Embed Size (px)
Citation preview
Focus Area 26:Substance AbuseProgress Review
October 13, 2004
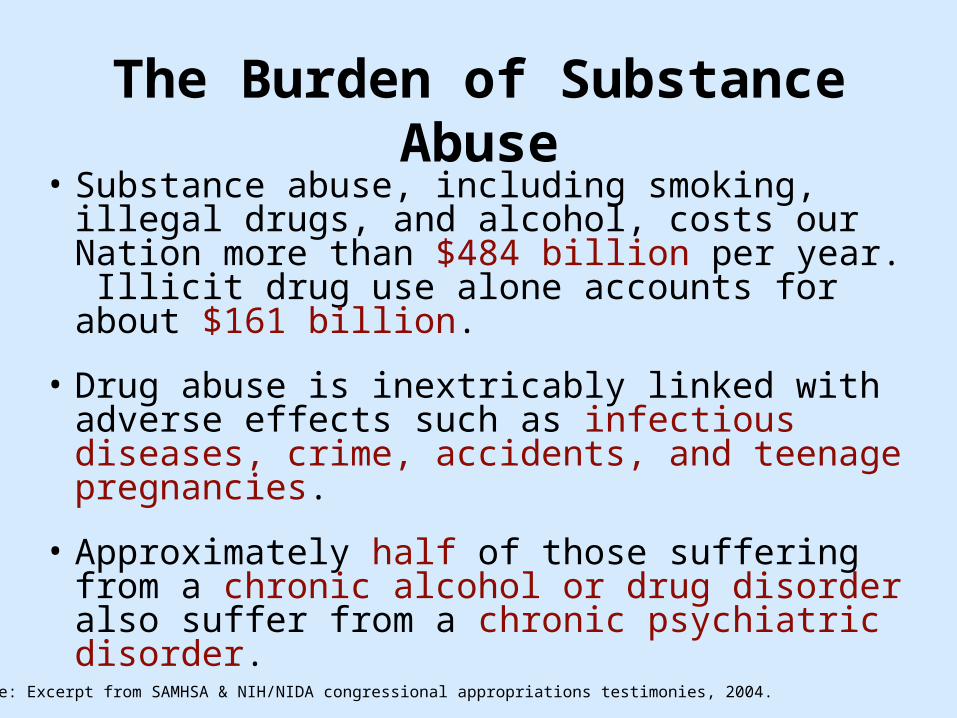
• Substance abuse, including smoking, illegal drugs, and alcohol, costs our Nation more than $484 billion per year. Illicit drug use alone accounts for about $161 billion.
• Drug abuse is inextricably linked with adverse effects such as infectious diseases, crime, accidents, and teenage pregnancies.
• Approximately half of those suffering from a chronic alcohol or drug disorder also suffer from a chronic psychiatric disorder.
The Burden of Substance Abuse
Source: Excerpt from SAMHSA & NIH/NIDA congressional appropriations testimonies, 2004.
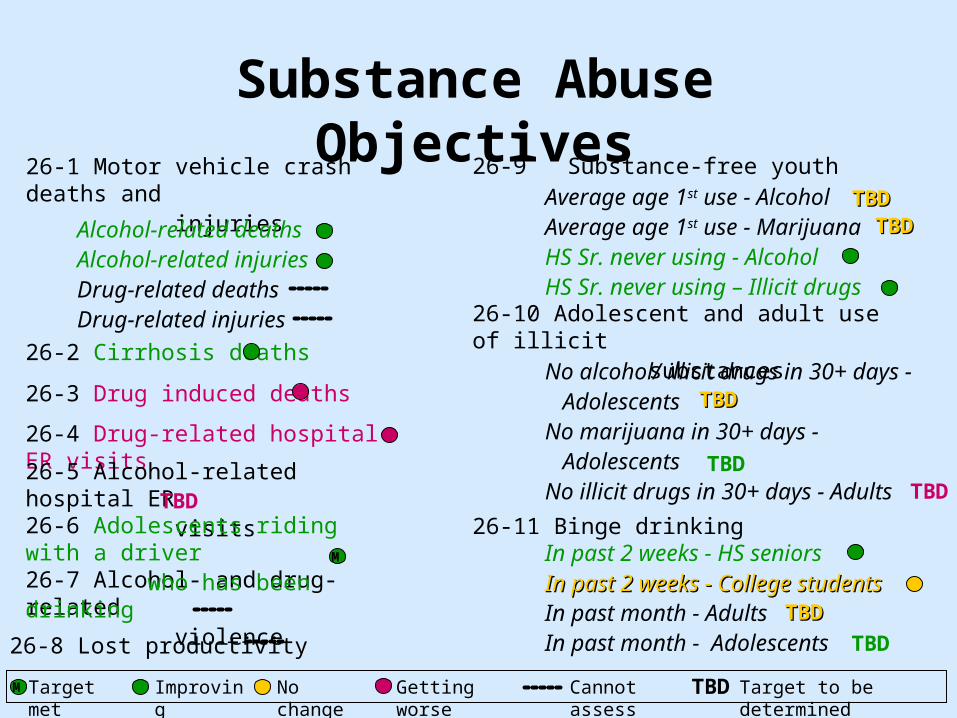
No alcohol/ illicit drugs in 30+ days - Adolescents No marijuana in 30+ days - Adolescents No illicit drugs in 30+ days - Adults
TBD
26-10 Adolescent and adult use of illicit substances
26-9 Substance-free youth26-1 Motor vehicle crash deaths and injuries
Substance Abuse Objectives
26-7 Alcohol- and drug-related violence
26-2 Cirrhosis deaths
26-3 Drug induced deaths
26-4 Drug-related hospital ER visits26-5 Alcohol-related hospital ER visits26-6 Adolescents riding with a driver who has been drinking
26-8 Lost productivity
26-11 Binge drinking
Alcohol-related deaths Alcohol-related injuries Drug-related deaths Drug-related injuries
In past 2 weeks - HS seniors In past 2 weeks - College In past 2 weeks - College studentsstudents In past month - Adults In past month - Adolescents
Average age 1st use - Alcohol Average age 1st use - Marijuana HS Sr. never using - Alcohol HS Sr. never using – Illicit drugs
No change
Cannot assess
Target to be determined
Target met
TBDGetting worse
TBD
TBDTBDTBDTBD
TBDTBD
TBD
TBDTBD
TBD
M
ImprovingM
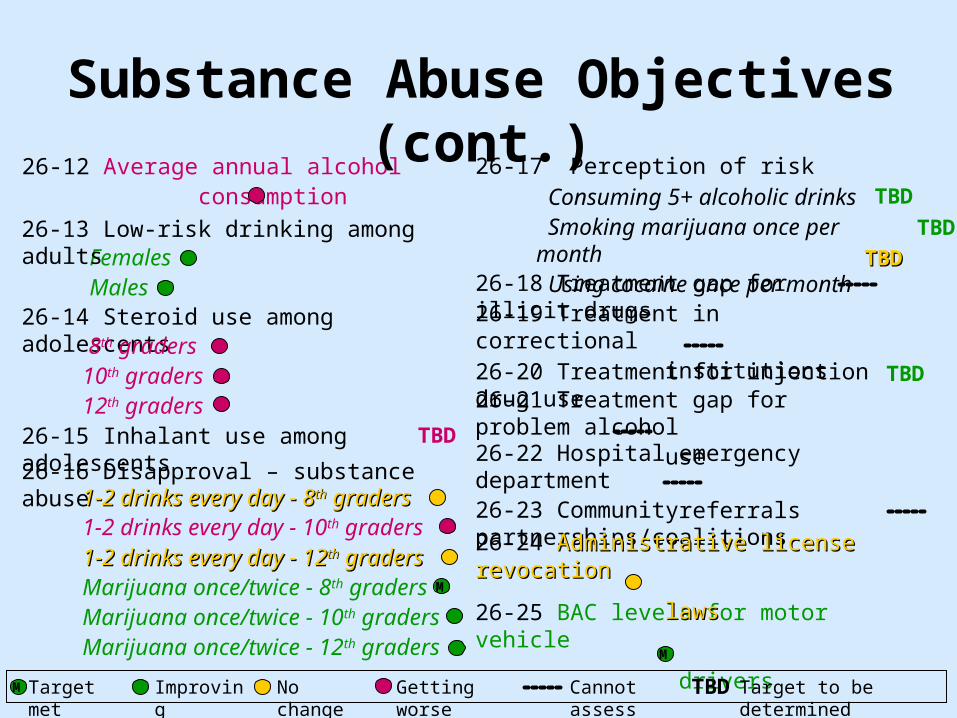
26-19 Treatment in correctional institutions
Consuming 5+ alcoholic drinks Smoking marijuana once per month Using cocaine once per month
TBD Females Males
26-17 Perception of risk26-12 Average annual alcohol consumption
Substance Abuse Objectives (cont.)
26-13 Low-risk drinking among adults
26-14 Steroid use among adolescents
26-15 Inhalant use among adolescents26-16 Disapproval – substance abuse
26-22 Hospital emergency department referrals
26-25 BAC levels for motor vehicle
drivers
1-2 drinks every day - 81-2 drinks every day - 8thth gradersgraders 1-2 drinks every day - 10th graders 1-2 drinks every day - 121-2 drinks every day - 12thth gradersgraders Marijuana once/twice - 8th graders Marijuana once/twice - 10th graders Marijuana once/twice - 12th graders
8th graders 10th graders 12th graders
26-18 Treatment gap for illicit drugs
26-20 Treatment for injection drug use26-21 Treatment gap for problem alcohol use
26-23 Community partnerships/coalitions26-24 Administrative license Administrative license revocationrevocation
lawslaws
TBD
TBD
TBD
TBDTBD
No change
Cannot assess
Target to be determined
Target met
Getting worse
M Improving TBD
M
M
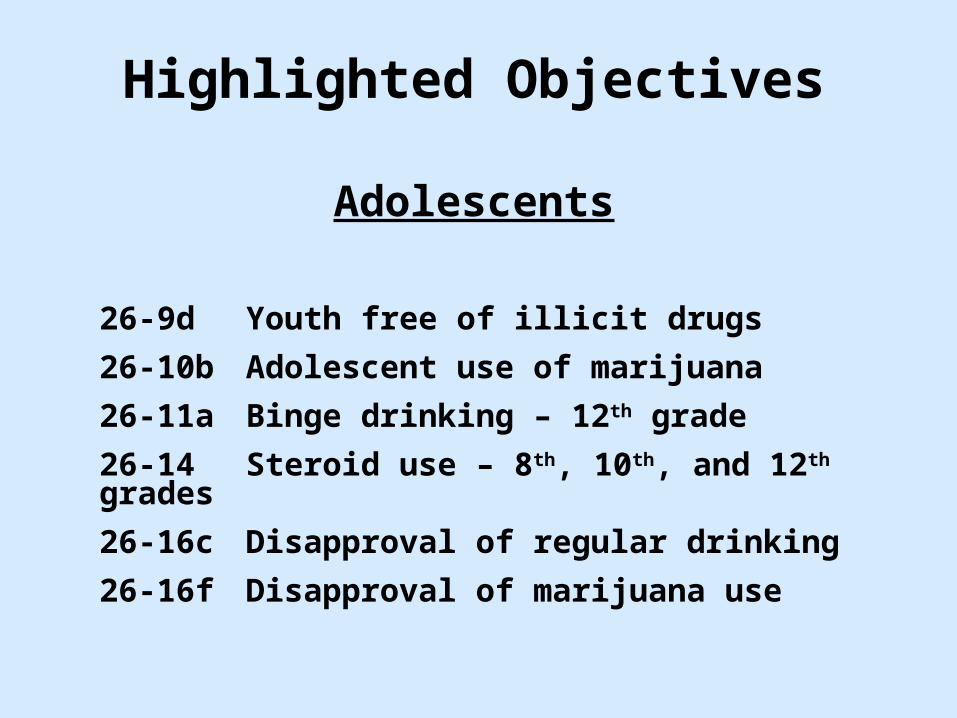
26-9d Youth free of illicit drugs
26-10b Adolescent use of marijuana
26-11a Binge drinking – 12th grade
26-14 Steroid use – 8th, 10th, and 12th grades
26-16c Disapproval of regular drinking
26-16f Disapproval of marijuana use
Highlighted Objectives
Adolescents
0
3 0
6 0
9 0
1 9 7 5 1 9 7 9 1 9 8 3 1 9 8 7 1 9 9 1 1 9 9 5 1 9 9 9 2 0 0 3
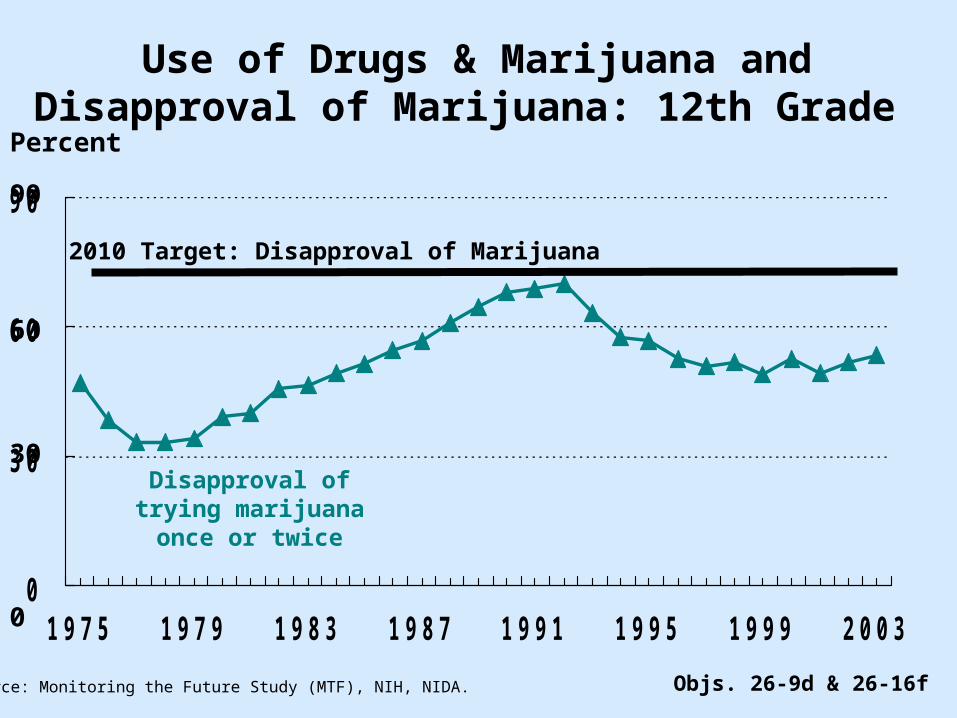
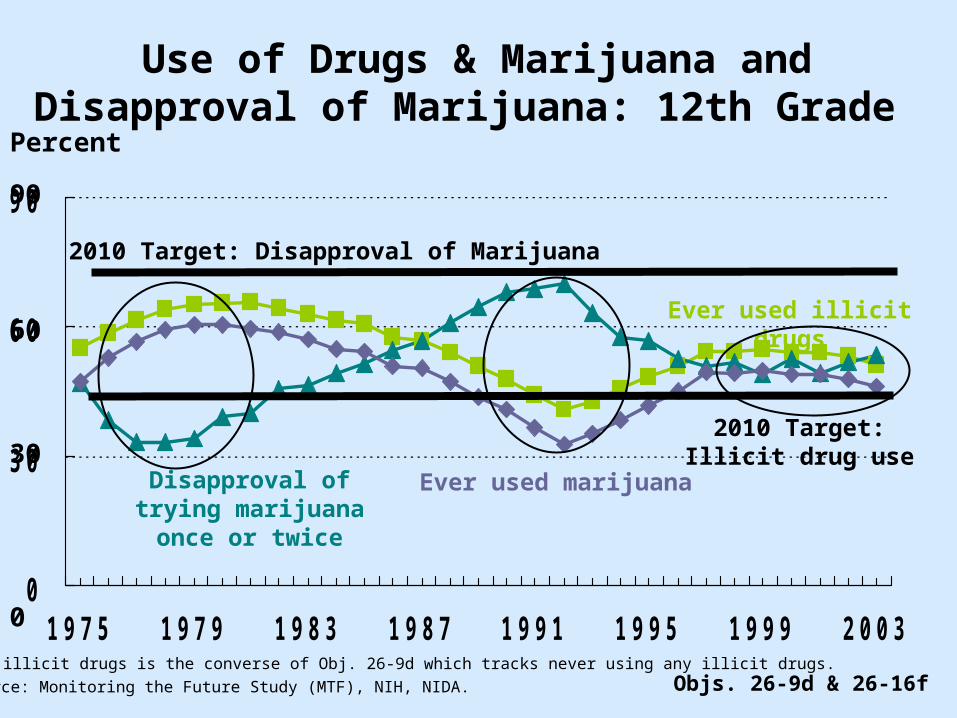
Use of Drugs & Marijuana and Disapproval of Marijuana: 12th Grade
Objs. 26-9d & 26-16fSource: Monitoring the Future Study (MTF), NIH, NIDA.
Percent
Disapproval of trying marijuana once or
twice
2010 Target: Disapproval of Marijuana
0
90
60
30
0
3 0
6 0
9 0
1 9 7 5 1 9 7 9 1 9 8 3 1 9 8 7 1 9 9 1 1 9 9 5 1 9 9 9 2 0 0 3
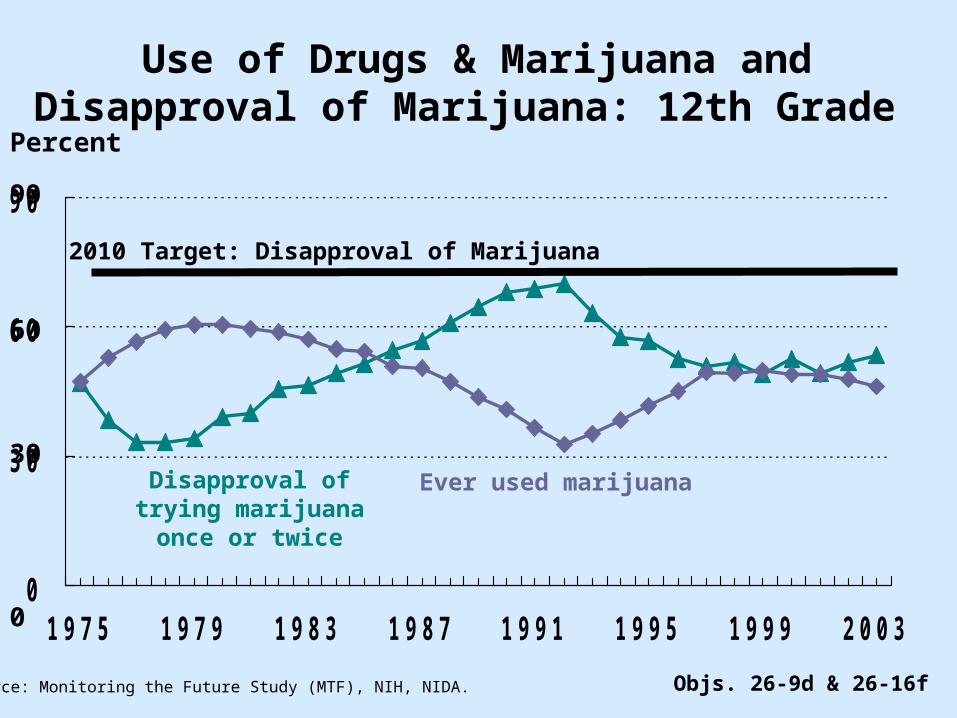
Use of Drugs & Marijuana and Disapproval of Marijuana: 12th Grade
Objs. 26-9d & 26-16fSource: Monitoring the Future Study (MTF), NIH, NIDA.
Percent
Disapproval of trying marijuana once or
twice
2010 Target: Disapproval of Marijuana
0
90
60
30Ever used marijuana
0
3 0
6 0
9 0
1 9 7 5 1 9 7 9 1 9 8 3 1 9 8 7 1 9 9 1 1 9 9 5 1 9 9 9 2 0 0 3
2010 Target:Illicit drug use
Use of Drugs & Marijuana and Disapproval of Marijuana: 12th Grade
Objs. 26-9d & 26-16fSource: Monitoring the Future Study (MTF), NIH, NIDA.
Ever used illicit drugs
Percent
Disapproval of trying marijuana once or
twice
2010 Target: Disapproval of Marijuana
0
90
60
30Ever used marijuana
Note: Use of illicit drugs is the converse of Obj. 26-9d which tracks never using any illicit drugs.
0
5
1 0
1 5
2 0
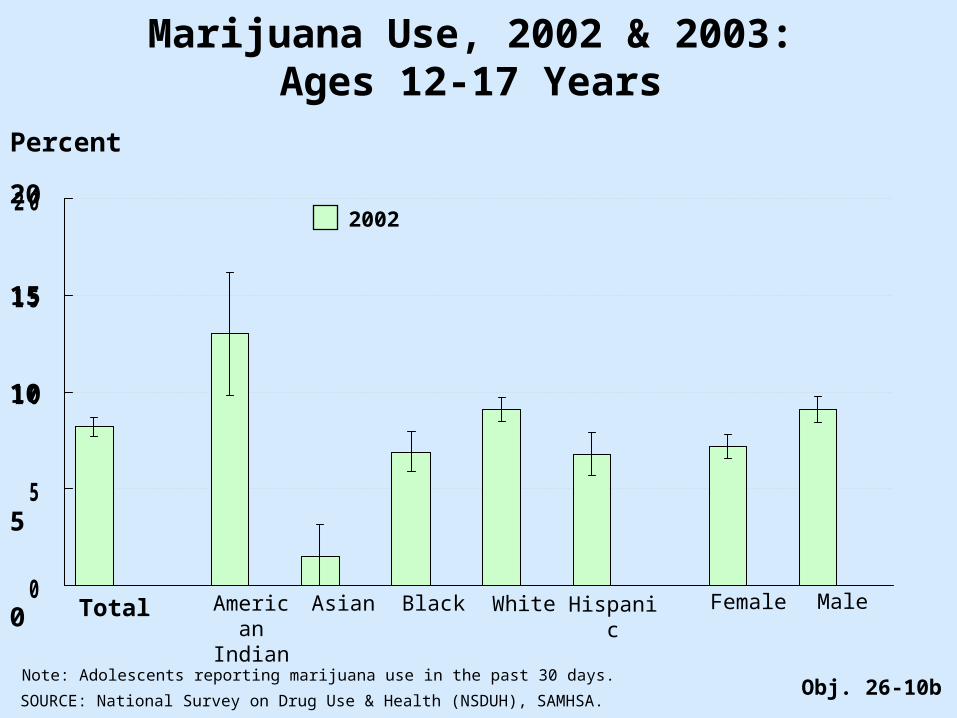
Obj. 26-10bSOURCE: National Survey on Drug Use & Health (NSDUH), SAMHSA.
Total White FemaleAmerican
Indian
MaleHispanicBlackAsian
Percent
5
20
10
15
0
Marijuana Use, 2002 & 2003:Ages 12-17 Years
2002
Note: Adolescents reporting marijuana use in the past 30 days.
0
5
1 0
1 5
2 0
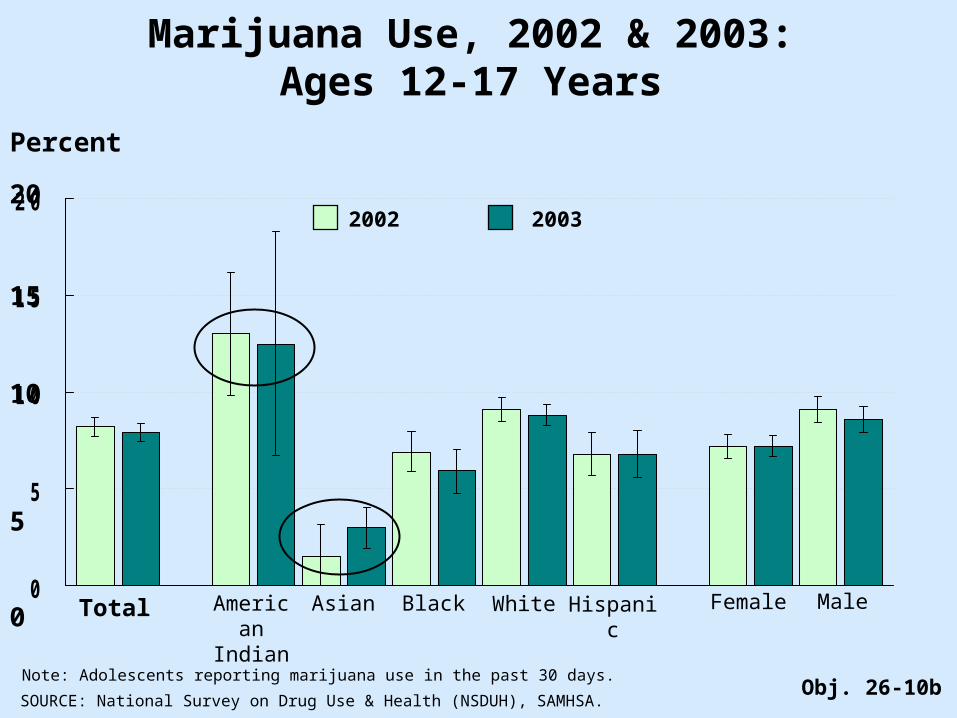
Obj. 26-10bSOURCE: National Survey on Drug Use & Health (NSDUH), SAMHSA.
Total White FemaleAmerican
Indian
MaleHispanicBlackAsian
Percent
5
20
10
15
0
Marijuana Use, 2002 & 2003:Ages 12-17 Years
2002 2003
Note: Adolescents reporting marijuana use in the past 30 days.
0
0 . 5
1
1 . 5
2
2 . 5
3
1 9 9 1 1 9 9 3 1 9 9 5 1 9 9 7 1 9 9 9 2 0 0 1 2 0 0 3
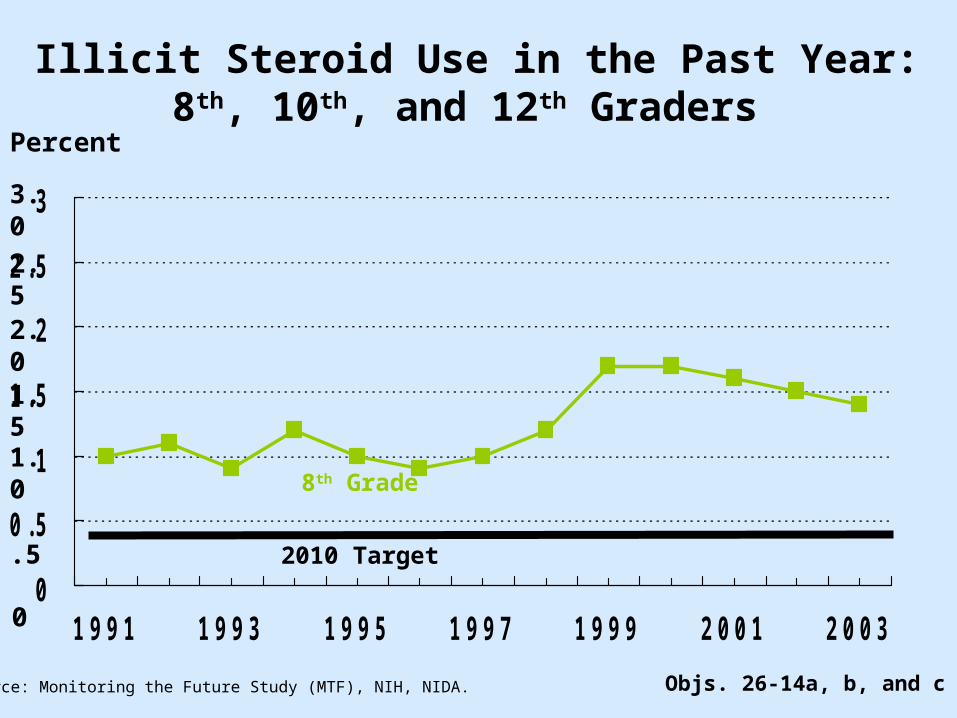
Objs. 26-14a, b, and cSource: Monitoring the Future Study (MTF), NIH, NIDA.
8th Grade
Percent
2010 Target .5
2.5
3.0
2.0
1.5
1.0
0
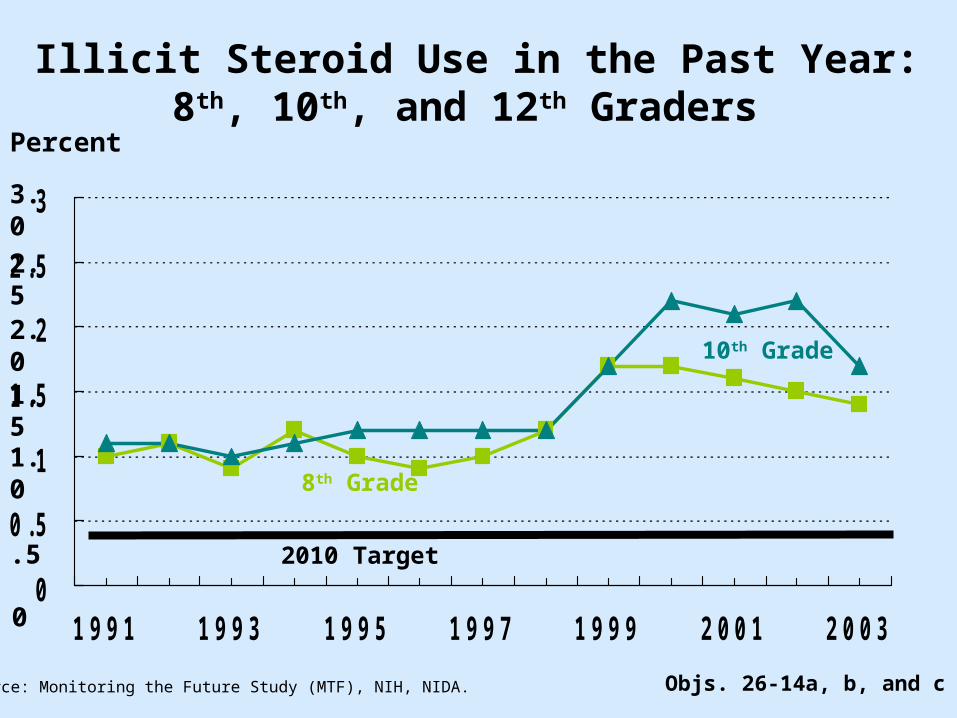
Illicit Steroid Use in the Past Year:8th, 10th, and 12th Graders
0
0 . 5
1
1 . 5
2
2 . 5
3
1 9 9 1 1 9 9 3 1 9 9 5 1 9 9 7 1 9 9 9 2 0 0 1 2 0 0 3
Objs. 26-14a, b, and cSource: Monitoring the Future Study (MTF), NIH, NIDA.
8th Grade
Percent
10th Grade
2010 Target .5
2.5
Illicit Steroid Use in the Past Year:8th, 10th, and 12th Graders
3.0
2.0
1.5
1.0
0
0
0 . 5
1
1 . 5
2
2 . 5
3
1 9 9 1 1 9 9 3 1 9 9 5 1 9 9 7 1 9 9 9 2 0 0 1 2 0 0 3
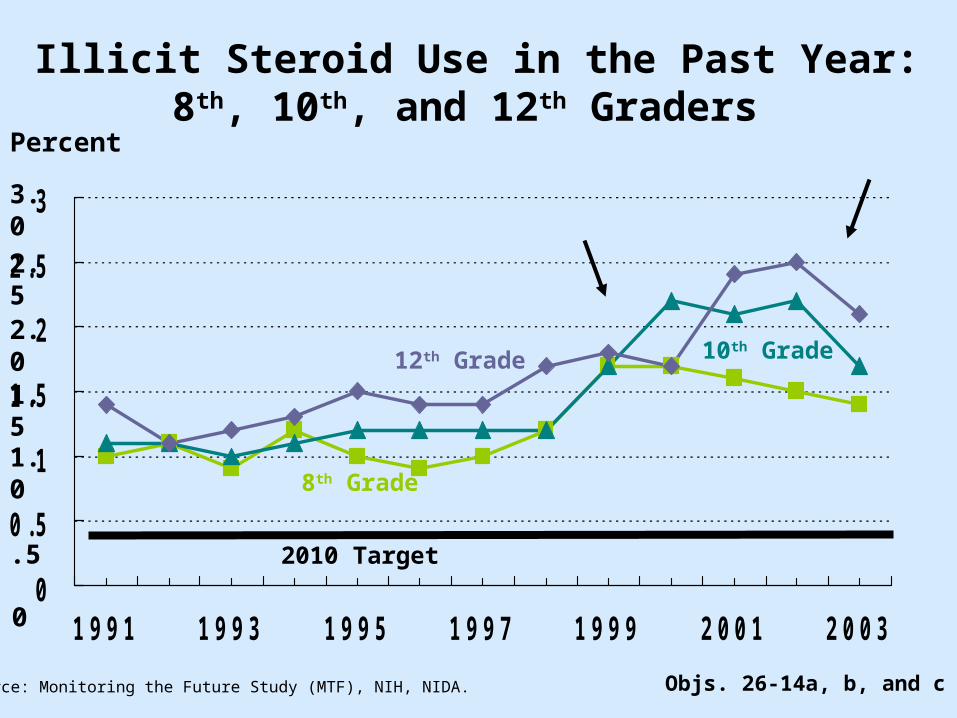
Objs. 26-14a, b, and cSource: Monitoring the Future Study (MTF), NIH, NIDA.
8th Grade
Percent
10th Grade
2010 Target .5
2.5
12th Grade
3.0
2.0
1.5
1.0
0
Illicit Steroid Use in the Past Year:8th, 10th, and 12th Graders
0
3 0
6 0
9 0
1 9 7 5 1 9 7 9 1 9 8 3 1 9 8 7 1 9 9 1 1 9 9 5 1 9 9 9 2 0 0 3
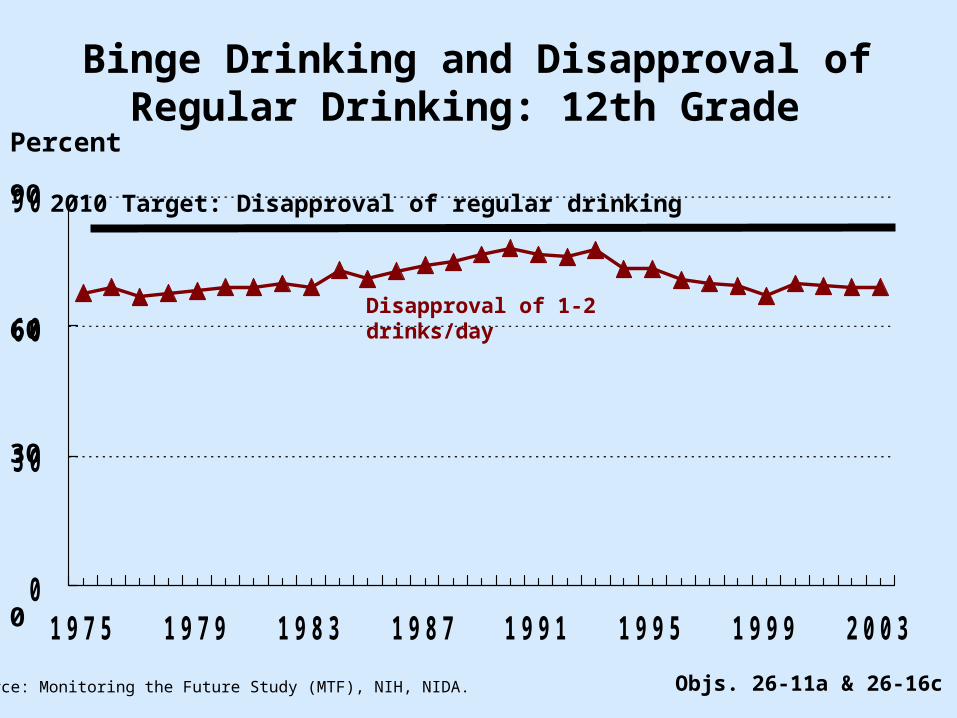
Binge Drinking and Disapproval of Regular Drinking: 12th Grade
Objs. 26-11a & 26-16cSource: Monitoring the Future Study (MTF), NIH, NIDA.
Disapproval of 1-2 drinks/day
Percent
2010 Target: Disapproval of regular drinking
0
90
60
30
0
3 0
6 0
9 0
1 9 7 5 1 9 7 9 1 9 8 3 1 9 8 7 1 9 9 1 1 9 9 5 1 9 9 9 2 0 0 3
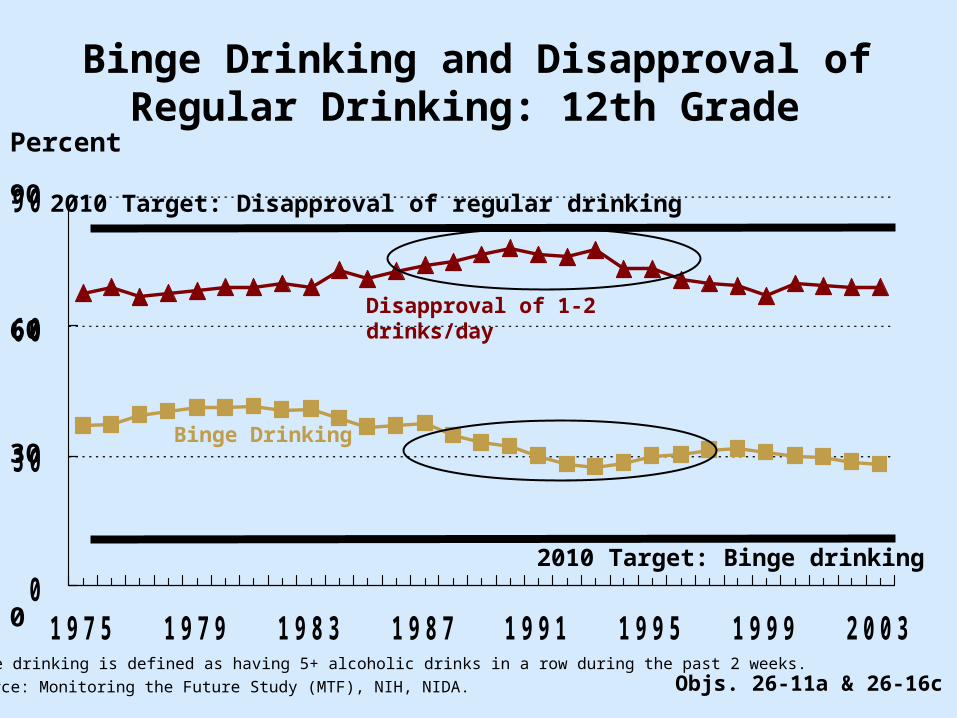
Binge Drinking and Disapproval of Regular Drinking: 12th Grade
Objs. 26-11a & 26-16cSource: Monitoring the Future Study (MTF), NIH, NIDA.
Disapproval of 1-2 drinks/day
Binge Drinking
Percent
2010 Target: Disapproval of regular drinking
2010 Target: Binge drinking 0
90
60
30
Note: Binge drinking is defined as having 5+ alcoholic drinks in a row during the past 2 weeks.
26-1a Motor vehicle crash deaths – Alcohol related
26-10c Use of illicit drugs
26-12 Average annual alcohol consumption
26-13 Low-risk drinking – Females and Males
26-24 Administrative license revocation (ALR) laws
26-25 Blood alcohol concentration (BAC) levels for motor vehicle drivers
Highlighted Objectives
Adults
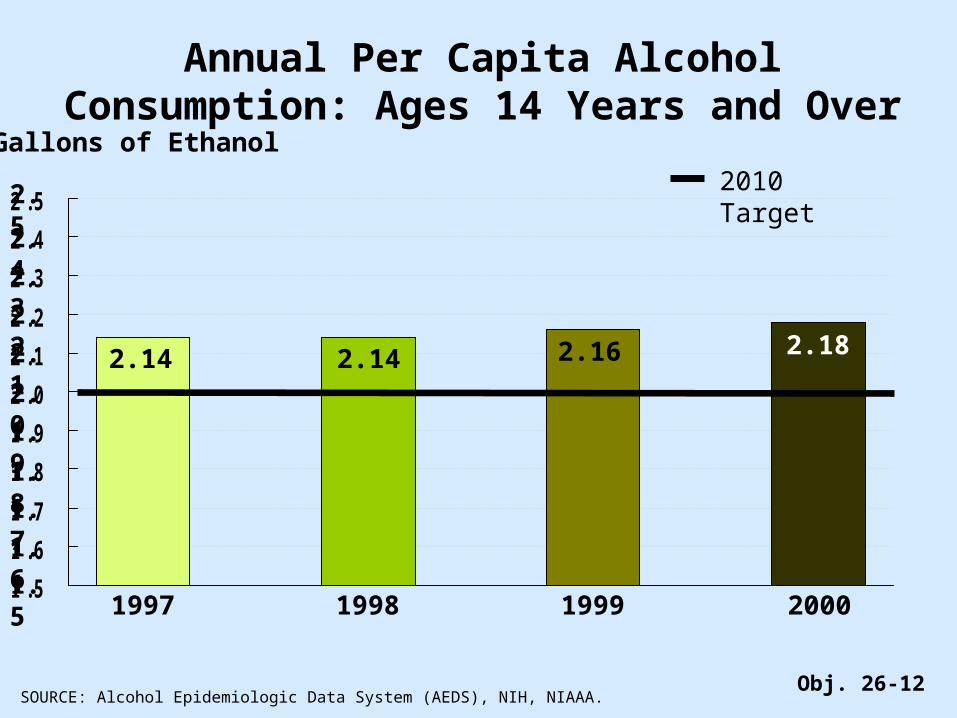
Annual Per Capita Alcohol Consumption: Ages 14 Years and
Over
1 . 5
1 . 6
1 . 7
1 . 8
1 . 9
2 . 0
2 . 1
2 . 2
2 . 3
2 . 4
2 . 5
Obj. 26-12
Gallons of Ethanol
SOURCE: Alcohol Epidemiologic Data System (AEDS), NIH, NIAAA.
1997 200019991998
2010 Target
1.5
2.5
2.4
2.3
2.2
2.1
2.0
1.9
1.8
1.7
1.6
2.182.14 2.14 2.16
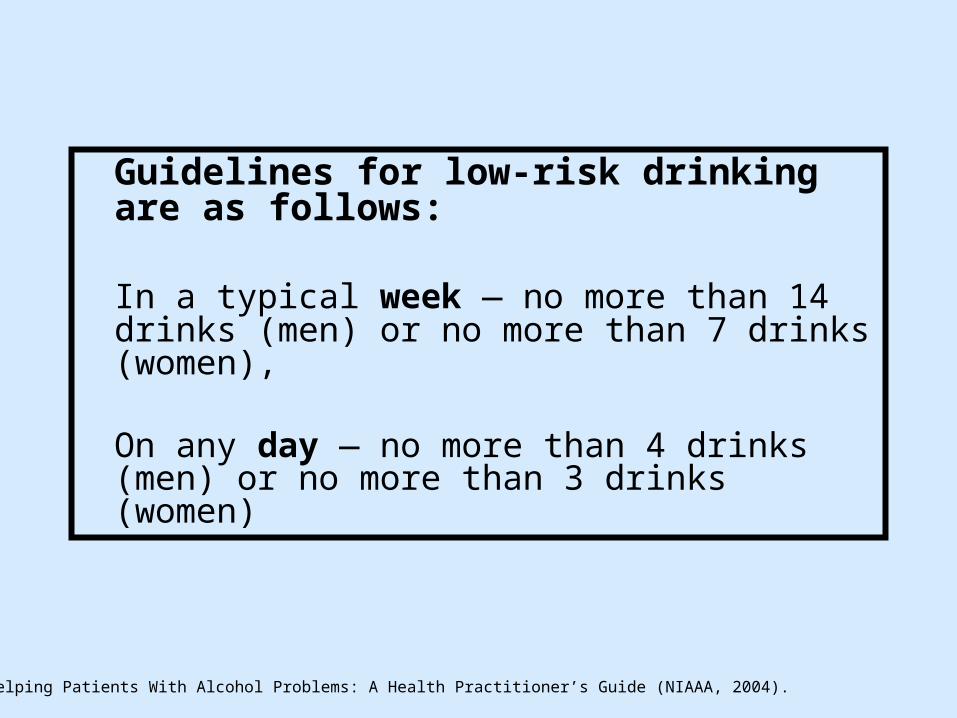
Guidelines for low-risk drinking are as follows:
In a typical week — no more than 14 drinks (men) or no more than 7 drinks (women),
On any day — no more than 4 drinks (men) or no more than 3 drinks (women)
Source: Helping Patients With Alcohol Problems: A Health Practitioner’s Guide (NIAAA, 2004).
0 2 0 4 0 6 0 8 08 0 6 0 4 0 2 0 0
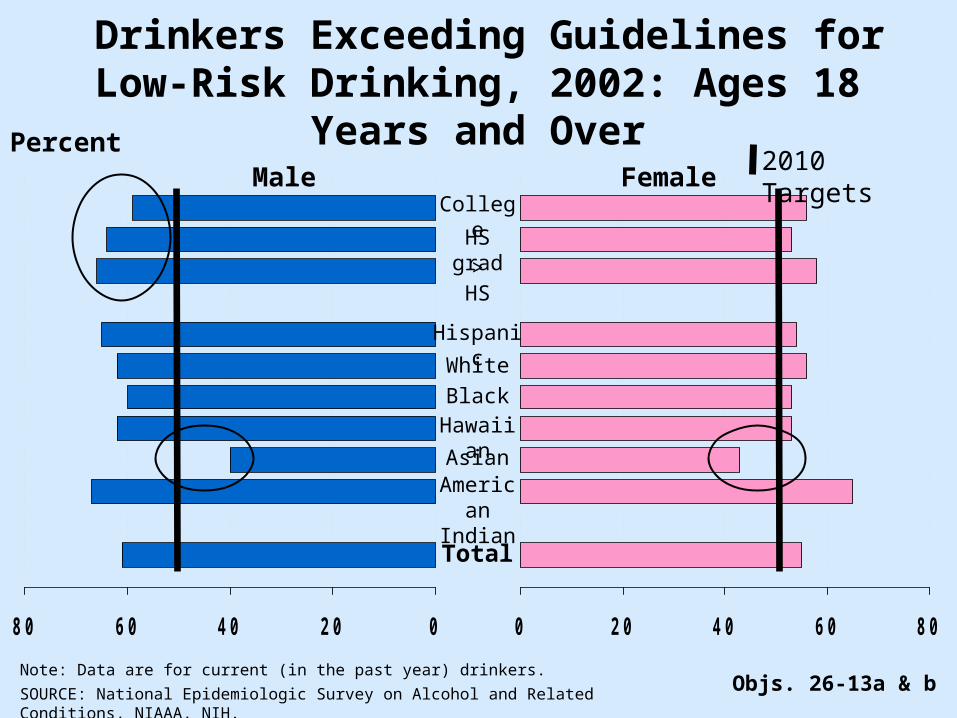
Drinkers Exceeding Guidelines for Low-Risk Drinking, 2002: Ages 18 Years and
Over
Objs. 26-13a & bSOURCE: National Epidemiologic Survey on Alcohol and Related Conditions, NIAAA, NIH.
Male Female
Total
White
American
Indian
Hispanic
BlackHawaiia
nAsian
HS grad> HS
College
2010 Targets
Percent
Note: Data are for current (in the past year) drinkers.
0
2
4
6
8
1 0
1 2
1 9 8 2 1 9 8 4 1 9 8 6 1 9 8 8 1 9 9 0 1 9 9 2 1 9 9 4 1 9 9 6 1 9 9 8 2 0 0 0 2 0 0 2
2
12
0
8
4
6
10
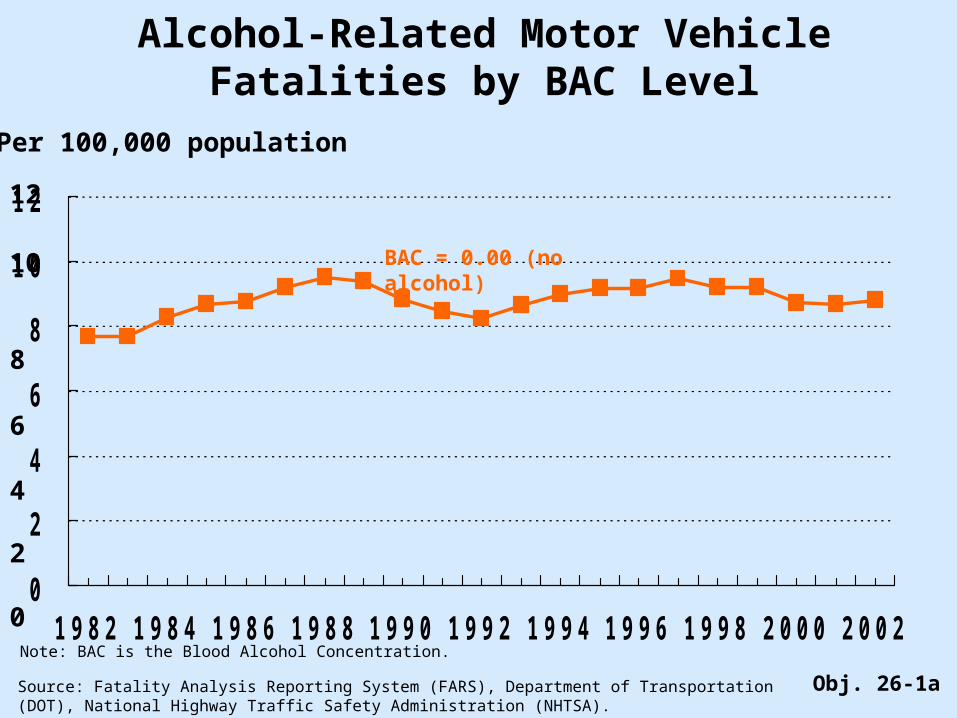
Alcohol-Related Motor Vehicle Fatalities by BAC Level
Source: Fatality Analysis Reporting System (FARS), Department of Transportation (DOT), National Highway Traffic Safety Administration (NHTSA).
Per 100,000 population
Obj. 26-1a
BAC = 0.00 (no alcohol)
Note: BAC is the Blood Alcohol Concentration.
0
2
4
6
8
1 0
1 2
1 9 8 2 1 9 8 4 1 9 8 6 1 9 8 8 1 9 9 0 1 9 9 2 1 9 9 4 1 9 9 6 1 9 9 8 2 0 0 0 2 0 0 2
2
12
0
8
4
6
10
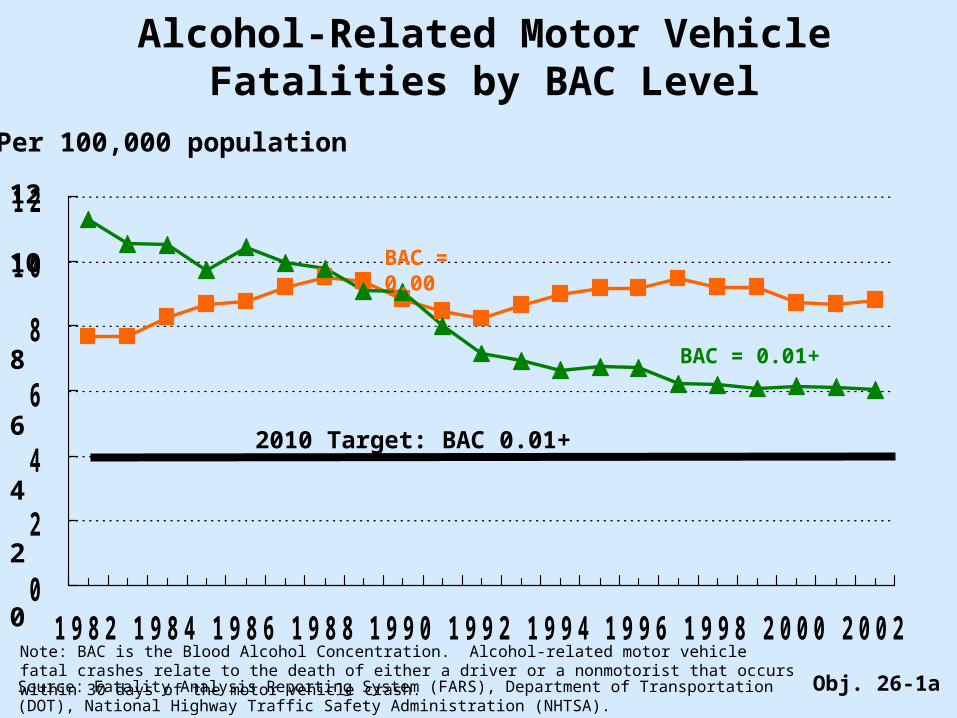
Alcohol-Related Motor Vehicle Fatalities by BAC Level
Source: Fatality Analysis Reporting System (FARS), Department of Transportation (DOT), National Highway Traffic Safety Administration (NHTSA).
Per 100,000 population
BAC = 0.01+
Obj. 26-1a
2010 Target: BAC 0.01+
BAC = 0.00
Note: BAC is the Blood Alcohol Concentration. Alcohol-related motor vehicle fatal crashes relate to the death of either a driver or a nonmotorist that occurs within 30 days of the motor vehicle crash.
0
2
4
6
8
1 0
1 2
1 9 8 2 1 9 8 4 1 9 8 6 1 9 8 8 1 9 9 0 1 9 9 2 1 9 9 4 1 9 9 6 1 9 9 8 2 0 0 0 2 0 0 2
2
12
0
8
4
6
10
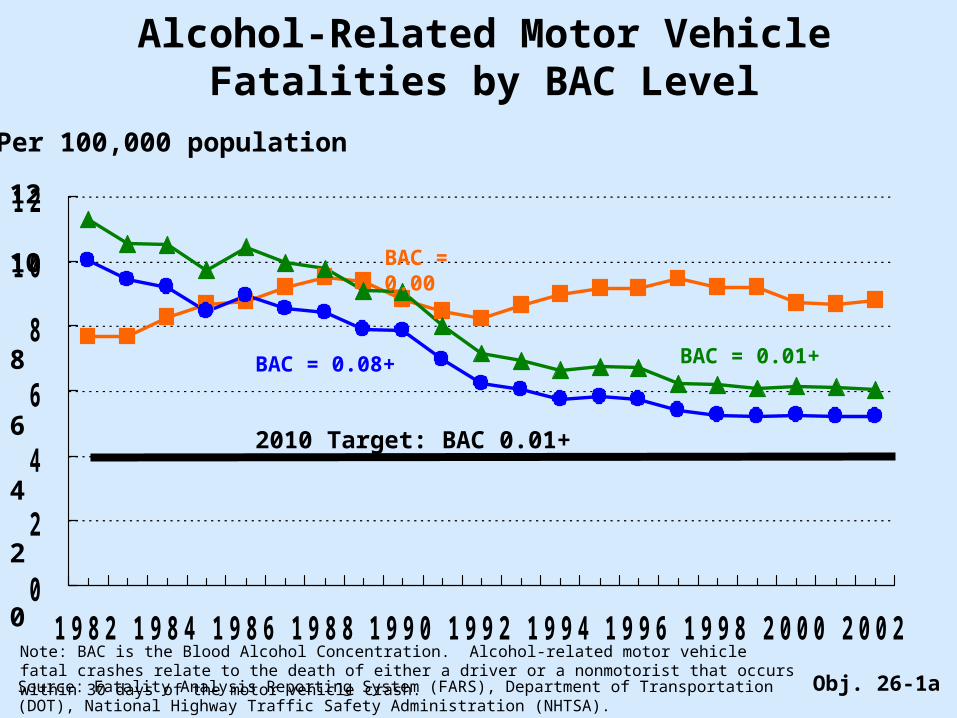
Alcohol-Related Motor Vehicle Fatalities by BAC Level
Source: Fatality Analysis Reporting System (FARS), Department of Transportation (DOT), National Highway Traffic Safety Administration (NHTSA).
Per 100,000 population
BAC = 0.08+
BAC = 0.01+
Obj. 26-1a
2010 Target: BAC 0.01+
BAC = 0.00
Note: BAC is the Blood Alcohol Concentration. Alcohol-related motor vehicle fatal crashes relate to the death of either a driver or a nonmotorist that occurs within 30 days of the motor vehicle crash.
0
2
4
6
8
1 0
1 2
1 9 8 2 1 9 8 4 1 9 8 6 1 9 8 8 1 9 9 0 1 9 9 2 1 9 9 4 1 9 9 6 1 9 9 8 2 0 0 0 2 0 0 2
2
12
0
8
4
6
10
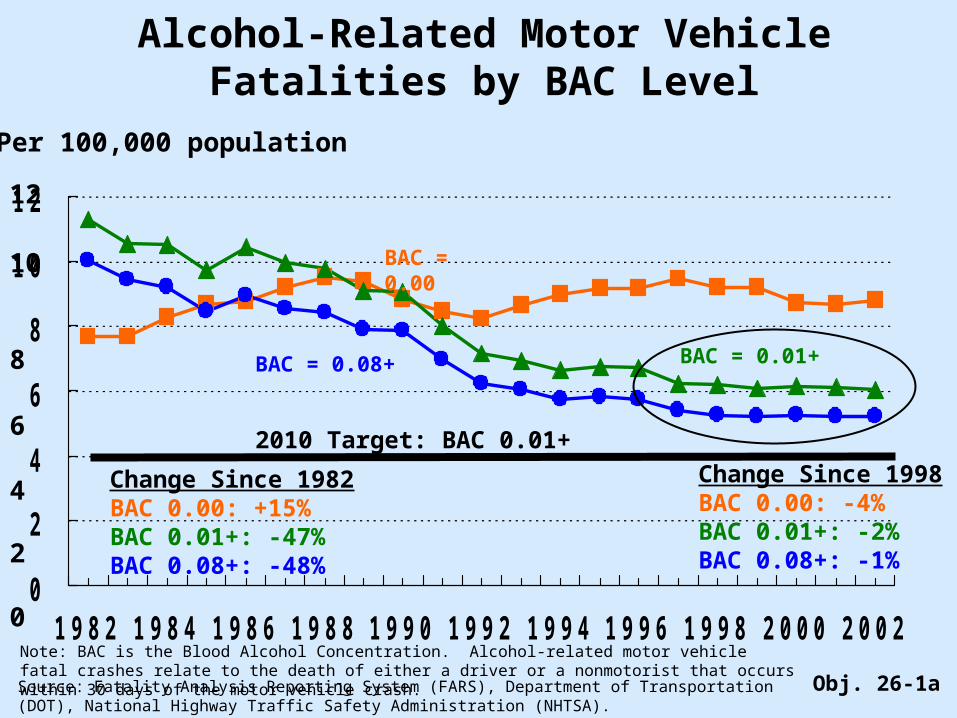
Alcohol-Related Motor Vehicle Fatalities by BAC Level
Source: Fatality Analysis Reporting System (FARS), Department of Transportation (DOT), National Highway Traffic Safety Administration (NHTSA).
Per 100,000 population
BAC = 0.08+
BAC = 0.01+
Obj. 26-1a
2010 Target: BAC 0.01+
BAC = 0.00
Change Since 1998BAC 0.00: -4%BAC 0.01+: -2%BAC 0.08+: -1%
Change Since 1982BAC 0.00: +15%BAC 0.01+: -47%BAC 0.08+: -48%
Note: BAC is the Blood Alcohol Concentration. Alcohol-related motor vehicle fatal crashes relate to the death of either a driver or a nonmotorist that occurs within 30 days of the motor vehicle crash.
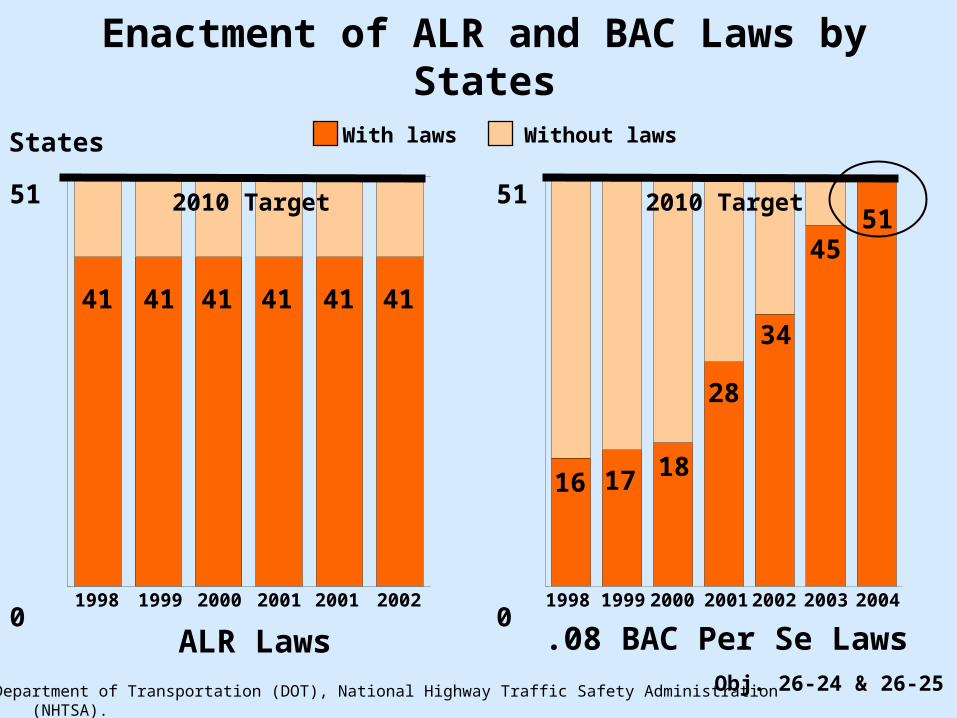
0
51
With laws Without laws
Enactment of ALR and BAC Laws by States
States
ALR Laws .08 BAC Per Se Laws
34
2010 Target 2010 Target
Obj. 26-24 & 26-25
41 41 41
18
28
Source: Department of Transportation (DOT), National Highway Traffic Safety Administration (NHTSA).
0
51
200319991998
4141 41
200020012002
5145
16 17
200219991998 2000 2001 2001 2004
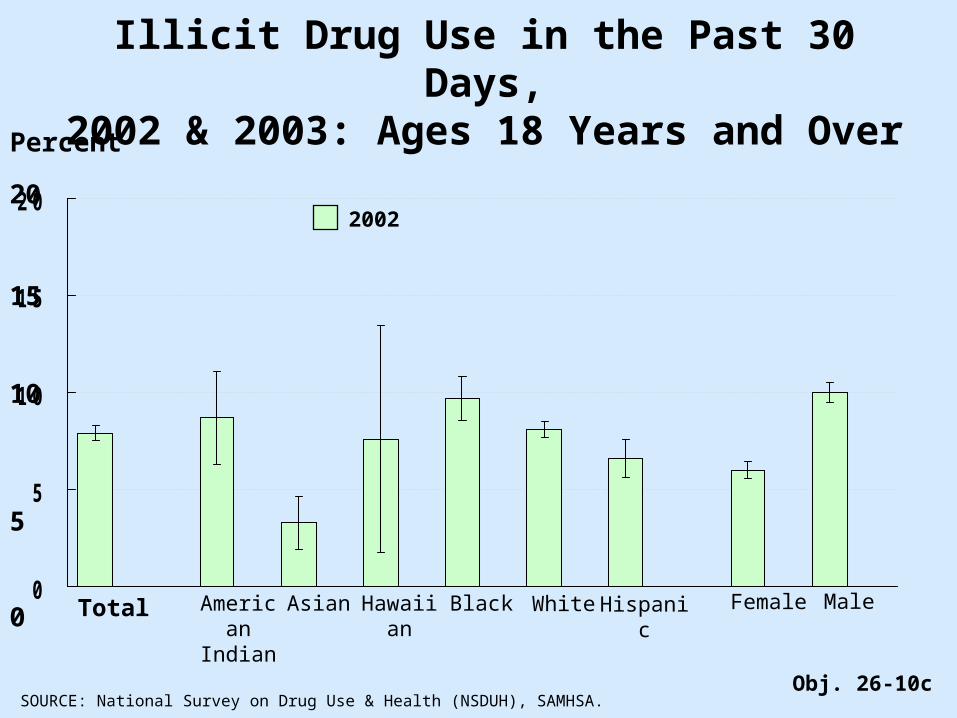
0
5
1 0
1 5
2 0
Obj. 26-10c
Total White FemaleAmerican
Indian
MaleHispanicBlackHawaiian
Asian
Percent
SOURCE: National Survey on Drug Use & Health (NSDUH), SAMHSA.
5
20
10
15
0
2002
Illicit Drug Use in the Past 30 Days,2002 & 2003: Ages 18 Years and Over
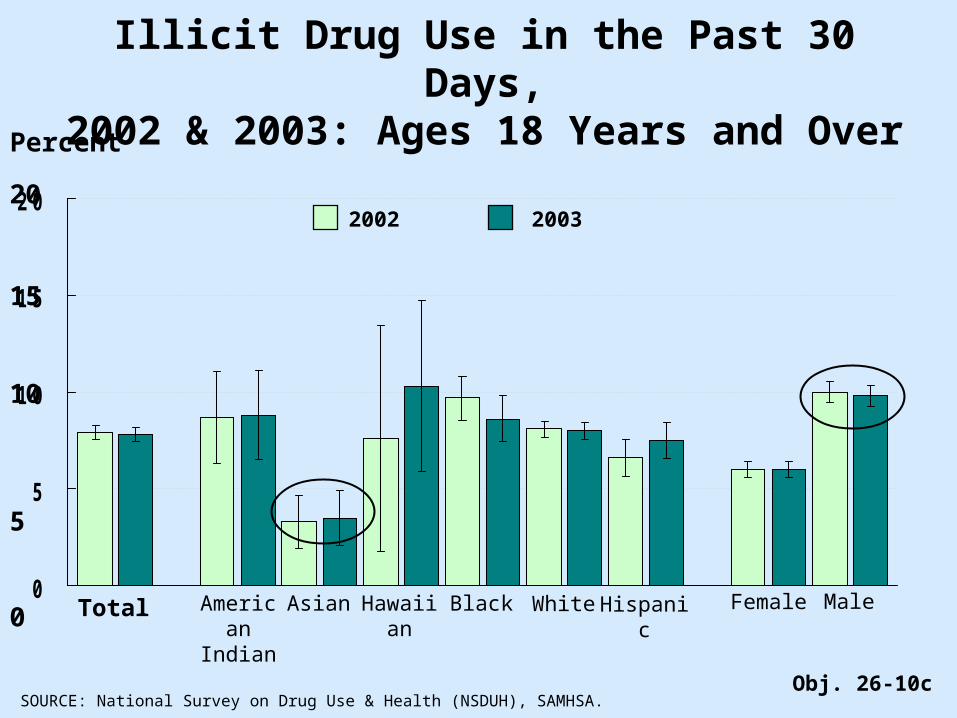
0
5
1 0
1 5
2 0
Obj. 26-10c
Total White FemaleAmerican
Indian
MaleHispanicBlackHawaiian
Asian
Percent
SOURCE: National Survey on Drug Use & Health (NSDUH), SAMHSA.
5
20
10
15
0
2002 2003
Illicit Drug Use in the Past 30 Days,2002 & 2003: Ages 18 Years and Over
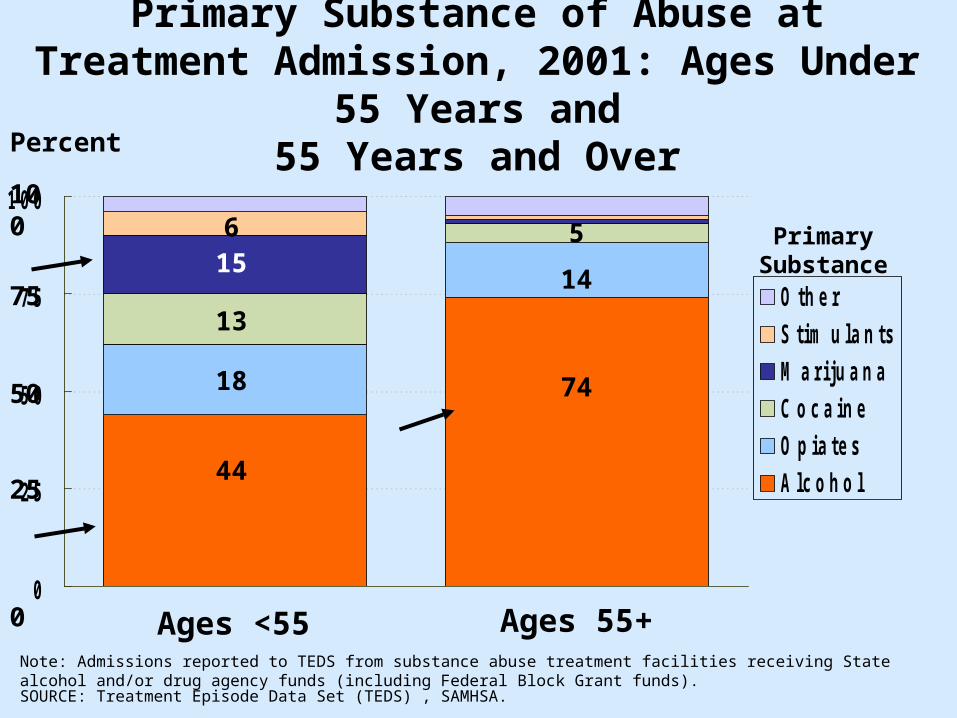
PrimarySubstance
Primary Substance of Abuse at Treatment Admission, 2001: Ages
Under 55 Years and55 Years and Over
0
2 5
5 0
7 5
1 0 0
O t h e r
S t i m u l a n t s
M a r i j u a n a
C o c a i n e
O p i a t e s
A l c o h o l
Percent
SOURCE: Treatment Episode Data Set (TEDS) , SAMHSA.
5
Ages <55
6
74
44
18
13
15
Ages 55+
14
100
25
75
0
50
Note: Admissions reported to TEDS from substance abuse treatment facilities receiving State alcohol and/or drug agency funds (including Federal Block Grant funds).
Progress review data and slides
can be found on the web at:
http://www.cdc.gov/nchs/hphome.htmhttp://www.cdc.gov/nchs/hphome.htm