Embed Size (px)
Citation preview
FARMERS MARKET
PROMOTIONAL
PROGRAM
FINAL
EVALUATION
REPORT
MAY 2014
TALLAHASSEE, FLORIDA
2
Tallahassee Farmers
Market Promotion
Project
Final Evaluation Report
Dr. P. Qasimah Boston
Project Evaluator
May 2014
We give thanks to all the people and
We wish to acknowledge all the people and partners that make this project
a success. To begin, thanks to the United States Department of Agriculture
(USDA) Farmers Market Promotion Program (FMPP) for the grant opportunity and
to the City of Tallahassee for serving as the fiscal agent and USDA liaison.
Thanks also to the Tallahassee Food Network (TFN) administration team for
handling community-level financial accountability and project management.
Next, wish to thank all those who comprise the TFN FMPP grant team:
Project Manager, Wes Shaffer of Tallahassee Sustainability Group, Evaluator,
Qasimah Boston with Project FOOD Now, Joyce Brown with Cultural Arts Natural
Design International, James Bellamy with the Frenchtown Neighborhood
Improvement Association, Kristen Goldsmith with iGrow Whatever You Like,
Kwasi Densu from Florida A&M University. These people stepped up, picked up
the pieces, improvised, and brought the project to completion. They did more
than was expected because their heart is in the work and they are team players
through and through.
In addition, though they do not walk with us the entire way, we wish to
acknowledge Cetta Barnhart of Seedtime Harvest, Greg Jubinsky with Ragged
Glory Farms, and Simon Bevis from the Salvation Army Garden.
In closing, we must acknowledge the countless partners who, though not
technically on the grant team, were central to the success of the overall project in
tremendous or simple yet critical ways. First and foremost, let us lift up Ms.
Miaisha Mitchell of the Frenchtown Revitalization Council who continues to
encourage and point us forward, humbly and patiently, through many
implementation challenges. Let us recognize our constant ally, Louise Divine of
Red Hills Small Farms Alliance. We honor our farmer co-educators Eugene
Cooke of Gebsite and Jamila Norman of Patchwork City Farms and we give
thanks to Kenya Strickland of the Marcus Garvey Club. We cannot forget all our
many meeting and workshop hosts, countless youth and university volunteers, and
the many TFN partners like Sundiata Ameh-El, Alexis Simoneau, Minister Ivy
and Cassidy Mills, who fill gaps and help us reach the community through their
networks. It takes a village, and to that village we say,
"Thank you!”
ACKNOWLEDGEMENTS
- Nathan Ballentine TFN Board Member
4
EXECUTIVE SUMMARY
The evaluation of the Tallahassee Farmer Market Promotion Project (TFMPP)
assesses achievement of the project objectives and activities. It is driven by the
Project’s logic model. The Project logic model presents the activities, outputs and
outcomes. The evaluator utilized a nonexperimental, mixed methodology and
participatory design that was framed by the Project’s theory of change.
The process evaluation examined the extent to which consumers and farmers
are educated on local food security and the neighborhood food environment, the
extent to which physical and online marketplaces are expanded, the extent of
outreach and marketing to the community of focus and the extent to which farmer
revenues were improved.
The outcome evaluation assesses performance indictors including curriculum
development, training workshops, knowledge improvement, participant
perceptions of their experience and cooking demonstration in order to measure
project effectiveness. Methods for the evaluation include primary data collection
using pre/post-tests, surveys and training logs.
Curriculums for farmer education
and consumer education was
developed, reviewed and utilized; there
were 16 consumer education workshops
and consumer knowledge improvement
was 72%, beyond the proposed 30%.
There were 20 cooking demonstrations
reaching beyond the 10 proposed.
There were 5 farmer education
workshops and farmer knowledge
improvement was 65% beyond the
proposed 30%. The workshop
participants recommended continuation
of the activities along with increased
time. Both markets achieved benefits
from this project. The Frenchtown
Heritage Market received increased
support from foundations and from the
city amounting to over $500,000 and the
Red Hills Small Farms Alliance achieved
increased linkages to the communities
they serve and other farmers and food
system initiatives supporting their work.
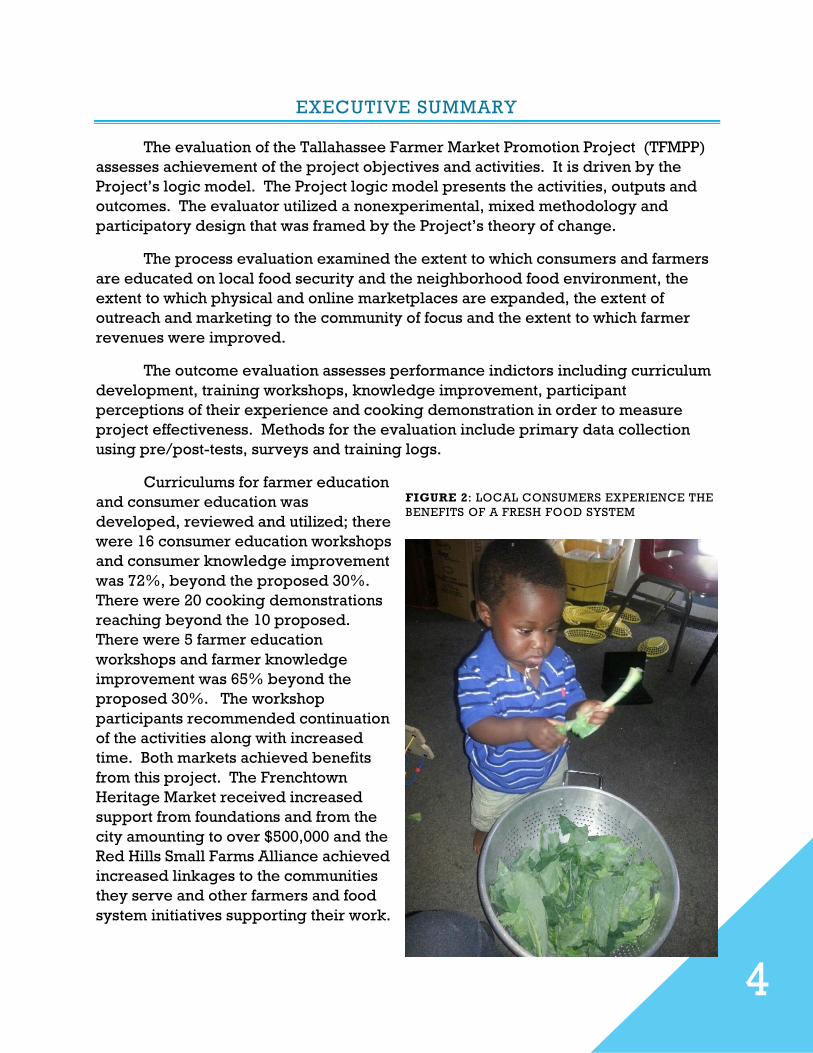
FIGURE 2: LOCAL CONSUMERS EXPERIENCE THE
BENEFITS OF A FRESH FOOD SYSTEM
5
TABLE OF CONTENTS
Acknowledgements .............................................................................................................. 3
Executive Summary .............................................................................................................. 4
Table of Figures .................................................................................................................... 6
Introduction .......................................................................................................................... 7
Report One: Project Antecedents ..................................................................... 10
The Collaboration ............................................................................................................ 10
The Project ...................................................................................................................... 12
Project Context ................................................................................................................ 13
Photographic Description ................................................................................................ 15
Report Two: Project Implmentation ................................................................. 17
Project Overview ............................................................................................................. 17
Project Logic Model / Theory of Change ......................................................................... 18
Selection of the Project Participants ................................................................................. 19
Photographic Description ................................................................................................ 20
Report Three: Project Results ......................................................................... 22
Evaluation Approach ....................................................................................................... 22
Evaluation Questions ....................................................................................................... 23
Evaluation Methods ......................................................................................................... 25
Evaluation Plan ................................................................................................................ 26
Evaluation Findings ......................................................................................................... 27
Photographic Description ................................................................................................ 46
Discussion ........................................................................................................................... 47
Conclusion .......................................................................................................................... 49
References .......................................................................................................................... 52
Appendices ........................................................................................................................ 54
6
TABLE OF FIGURES
Figure 1: Snap Dragons From Turkey Hill Farms .................................................................. 3
Figure 2: Local Consumers Experience The Benefits Of A Fresh Food System ...................... 4
Figure 3: Mr. Bellamy Receives SNAP/EBT Machine For Heritage Market ............................ 7
Figure 4: Mac’s Honey.......................................................................................................... 8
Figure 5: The Components Of Project Collaboration .......................................................... 11
Figure 6: Dr. Boston And Her Team Of Volunteers Evaluate Market Conditions ................. 12
Figure 7: Project Manager, Wes Shaffer, Leads Coordinator Meeting ................................ 12
Figure 8: Map Of Project Region & Food Deserts (Gadsden, Leon, And Jefferson Counties) 13
Figure 9: Frenchtown Heritage Market Opens For Business In May 2013 ............................ 14
Figure 10: Project Coalition ................................................................................................ 19
Figure 11: Evaluation Questions ......................................................................................... 23
Figure 12: Surveying Producers And Consumers ............................................................... 25
Figure 13: Tallahassee Farmers Market Promotion Project Evaluation Plan ........................ 26
Figure 14: Consumer Education Curriculum Cover ............................................................ 28
Figure 15: Eugine Cooke Educates Farmers On Benefits Of Growing Healthy Soil ............. 32
Figure 16: Farmers Take A Moment To Practice Some Basic Tai Chi Led By Dr. Boston ...... 33
Figure 17: Market The Farm Outreach Poster ..................................................................... 44
7
INTRODUCTION
There are benefits of local
farmer markets. Farmer markets
increase local access to fresh food,
they help communities respond to
issues of food security and food
desserts, they serve community and
the grower in educational, economic
and social ways and they help to keep
food dollars local. When direct
marketing methods are utilized,
farmer markets can help to increase
income for growers.
Promotion of farmer markets has
been shown to help increase volume of
sales, net income and customer base at
markets in New York and Alabama.
Consumers seem to prefer produce
sold at farmer markets because of
freshness, taste, appearance and
nutritional value. At farmer markets
consumers are educated by the
growers on how the produce is grown
and this encourages consumers to
seek out sustainably produced foods.
At farmer markets, consumers
appreciate the atmosphere and the
unique opportunity to get involved in
their food system by getting to know
the people who produce food in their
region.
The educational displays,
cooking demonstrations and unusual
vegetables also encourage consumers
to get involved in the farmer market
experience (Abel, J, Thompson, J. and
Maretzki, A, 1999).
The educational, economic,
social and health benefits of farmer
markets to communities are primary
reasons why they should be
supported. To support farmer
markets, the Tallahassee Farmer’s
Market Promotion Project (TFMPP) was
developed, implemented and
evaluated in order to strengthen a
network of educated growers and
educated consumers in Tallahassee,
Florida. Diverse community partners
like the City of Tallahassee, the local
Extension office, Tallahassee Food
Network, The Red Hills Small Farms
Alliance, the Frenchtown
Neighborhood Improvement
Association, Cultural Arts & Natural
Design International, the Greater
Frenchtown Revitalization Council,
Project FOOD Now, the Frenchtown
Heritage Market, Seed Time Harvest
and food movement activist came
together to help improve the local food
environment by promoting farmer
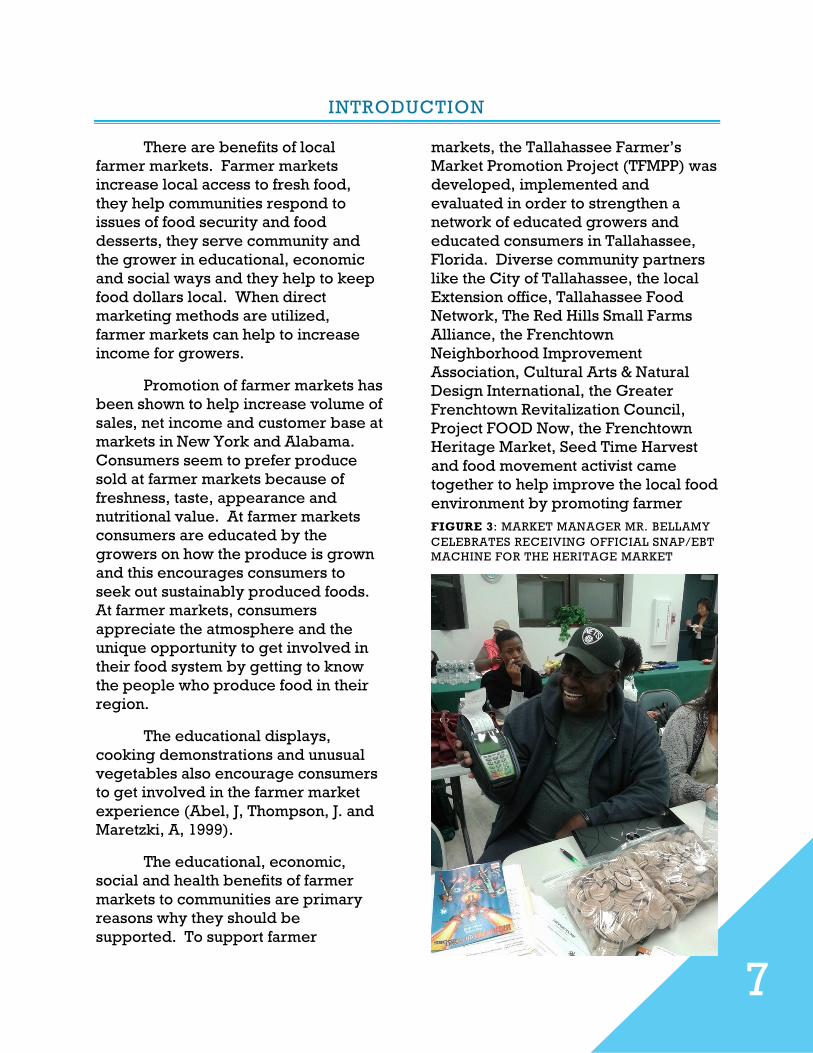
FIGURE 3: MARKET MANAGER MR. BELLAMY
CELEBRATES RECEIVING OFFICIAL SNAP/EBT
MACHINE FOR THE HERITAGE MARKET
8
markets. The goals of this evaluation
report is to firstly, help the Tallahassee
Food Network (TFN) (which led the
Farmers’ Market Promotion Project), to
critically examine what it
accomplished. Secondly, the report is
structured to speak to a broad
audience of organizations and
professionals who need to find ways of
improving neighborhood food
environments. This audience also
includes community developers. A
third audience for this evaluation
report includes both the consumers
and growers that the project served.
They are the project’s main
stakeholders and have contributed
greatly to the information used to
prepare this report. Finally, this study
used evaluation strategies and
processes that could be useful to
others including foundations, national
and local government, community
organizations, academic institutions,
researchers, faith based organizations,
businesses and nonprofit
organizations.
This evaluation report is a
composite of three distinct reports.
Report one focuses on the project’s
antecedents, the Tallahassee Food
Network, the project genesis, and the
project context. Report two conveys
information on the project’s
implementation, with an overview of
the project and more detailed
descriptions. Report three presents
the evaluation design, findings, overall
conclusions and contains the project’s
results. The sections are kept in three
reports so that different readers can go
directly to the information that most
interests them, without having to read
the entire document from beginning to
end.
At the end of report one we
provide photographs to help the
reader appreciate the nature of the
Tallahassee Food Network and the
existing environmental conditions
surrounding the Tallahassee Farmer
Market Promotion Project. At the end
of report two on project
implementation, we present a series of
photographs to show how the project
was carried out and to acquaint the
readers with the project participants.
At the end of report three on project
results, photographs are included to
depict the visible outcomes of the
FMPP.
The appendices document what
we did in conducting the evaluation
and how we did it. This information
may help other evaluators conduct
similar studies and offers a foundation
for future FMPP evaluation.
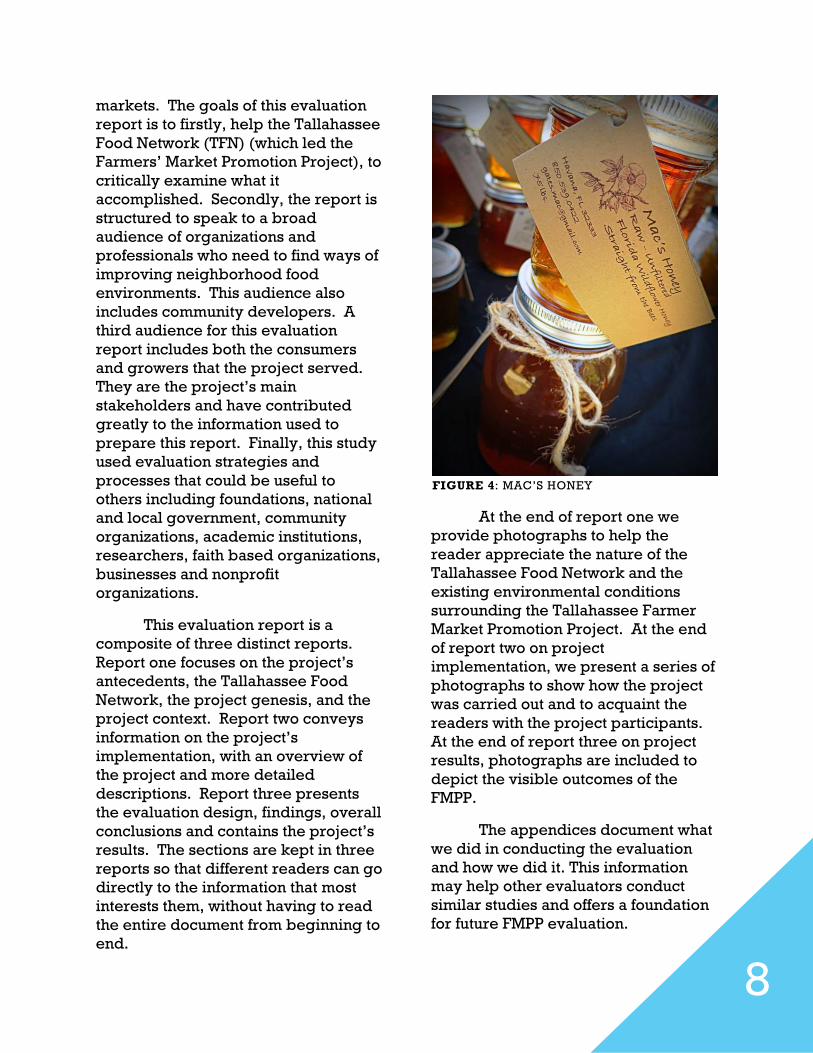
FIGURE 4: MAC’S HONEY

PROJECT
ANTECEDENTS
The Collaboration
The Project
Project Context
Photographic
Description
10
REPORT ONE:
PROJECT ANTECEDENTS
THE COLLABORATION
The City of Tallahassee and a
collaboration of farmers, nonprofit
organizations, and area universities
came together to address common
food, health and economic needs. The
resulting plan was designed to bring
food producers and consumers
together via workshops developed for
a three county area that included Leon,
Jefferson and Gadsden counties. The
Tallahassee Food Network (TFN) is the
nonprofit organization that worked to
build partnerships among the grant
team and other key players in the
Tallahassee area food movement
arena. The organization served as the
umbrella for the grant team and linked
the grant team with city and county
government officials in order to
increase the impact of the Farmer’s
Market Promotion Project.
The Frenchtown Neighborhood
Improvement Association worked as
the farmer market coordinator and
coordinated a farmers market
advertising campaign in partnership
with the Red Hills Small Farms Alliance
(RHSFA).
Seed Time Harvest and Cultural
Arts & Natural Design International
(CANDI) coordinated the consumer
education activities by coordinating
and leading community engagement
workshops and training. Seed Time
Harvest also worked to engage the
Monticello Main Street farmers, a
monthly farmers market.
Two farmer markets were key
collaborators in the Tallahassee
Farmer Market Promotion Project. The
first, the Red Hills Small Farms Alliance
(RHSFA) an established nonprofit
organization dedicated to growing and
supporting local and regional small
farms by providing a reliable outlet for
their direct sale of farm products; and
The Frenchtown Heritage Market. The
RHSMA assigned a local grower to act
as the farmer education coordinator to
participate with curriculum
development, farmer recruitment and
education. The RHSFA has held
previous workshops. All of their
market data is stored online and is
easily accessible. Other partners
contributed services to the Project.
The Greater Frenchtown Revitalization
Council, Project FOOD Now,
Leon/Jefferson County Extension
Services and the Tallahassee
Sustainability Group.
11
THE COLLABORATION
City of Tallahassee
Community Organizations
Universities
Frenchtown Heritage Market
Red Hills Small Farms
Alliance
A Farmer Market
Marketing Coordinator
A Farmer Education
Coordinator
A Consumer Education
Coordinator
A Volunteer
Coordinator
An
Evaluation
Coordinator
A Project
Manager
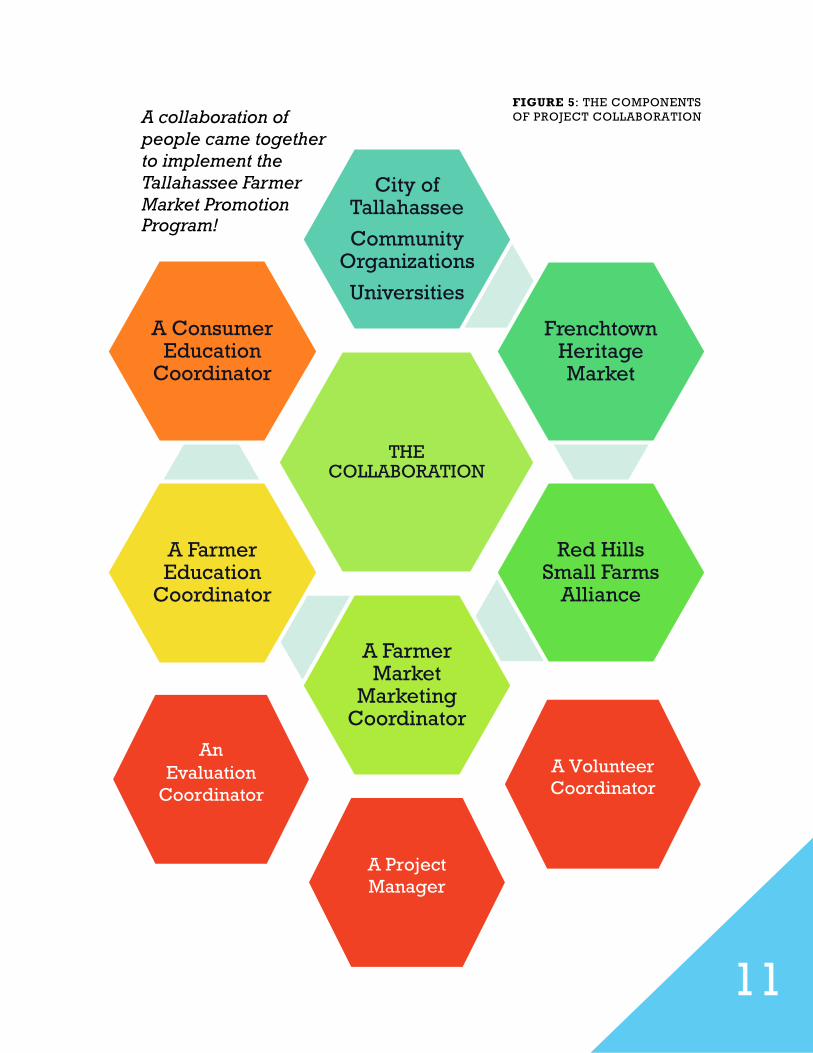
A collaboration of
people came together
to implement the
Tallahassee Farmer
Market Promotion Program!
FIGURE 5: THE COMPONENTS
OF PROJECT COLLABORATION
12
THE TALLAHASSEE FARMER MARKET
PROMOTION PROJECT
The United States Department
of Agriculture (USDA) has a Farmers
Market Promotion Program (FMPP)
that offers grants to help improve and
expand domestic farmers’ markets,
roadside stands, community supported
agriculture programs, agri-tourism
activities, and other direct producer-
to-consumer market opportunities.
Agricultural cooperatives, producer
networks, producer associations, local
governments, nonprofit corporations,
public benefit corporations, economic
development corporations, regional
farmers’ market authorities and Tribal
governments are among those eligible
to apply.
The City of Tallahassee and a
collaboration of farmers, nonprofit
organizations, and area universities
came together to apply for the FMPP
grant and were awarded. The
Tallahassee Farmers Market Promotion
Project was designed to strengthen a
network of educated farmers and
consumers and to provide a minimum
of two farmer market locations the
support needed to expand. It was
expected that more farmers would
participate in local markets and that
more consumers would shop for and
consume locally grown foods.
The goal of the Tallahassee Farmers
Market Promotion Project was: to
eliminate barriers that affect farmer
revenue and keep their products from food
deserts by: educating farmers, service
providers and consumers on local food
security and the neighborhood food
environment; expanding physical and
online marketplaces for fresh produce;
developing outreach strategies and
marketing to targeted communities; and
increasing farmer revenue
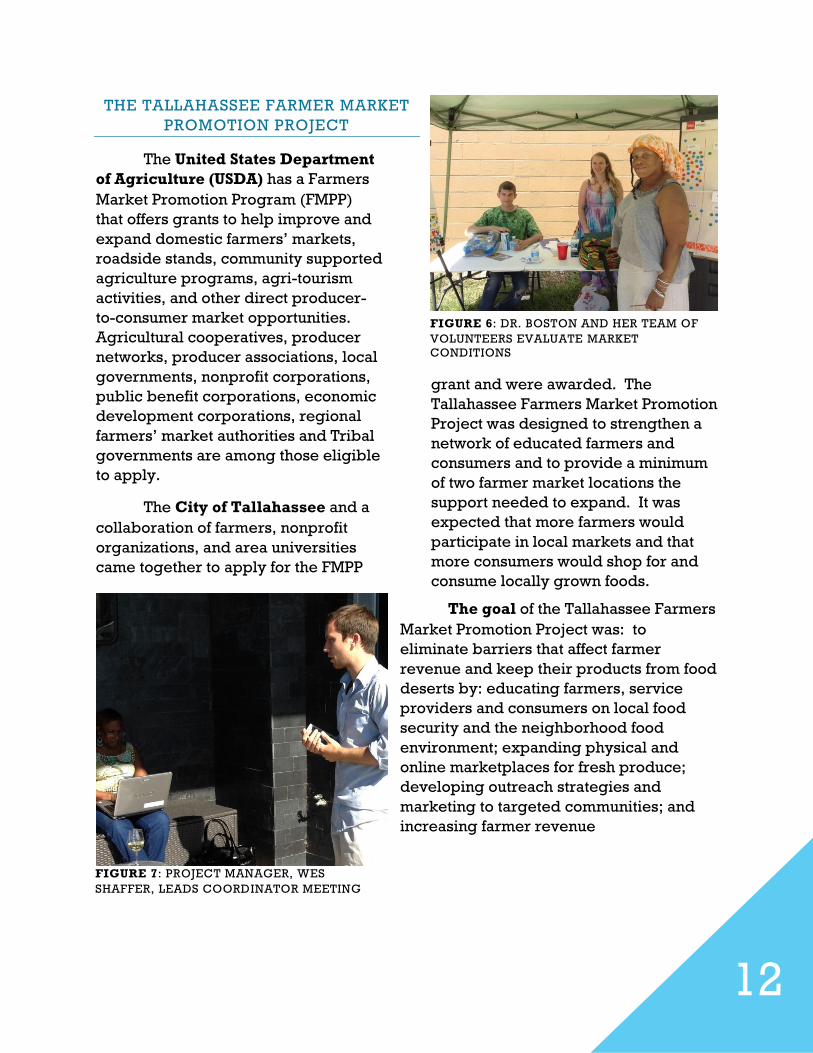
FIGURE 6: DR. BOSTON AND HER TEAM OF
VOLUNTEERS EVALUATE MARKET
CONDITIONS
FIGURE 7: PROJECT MANAGER, WES
SHAFFER, LEADS COORDINATOR MEETING
13
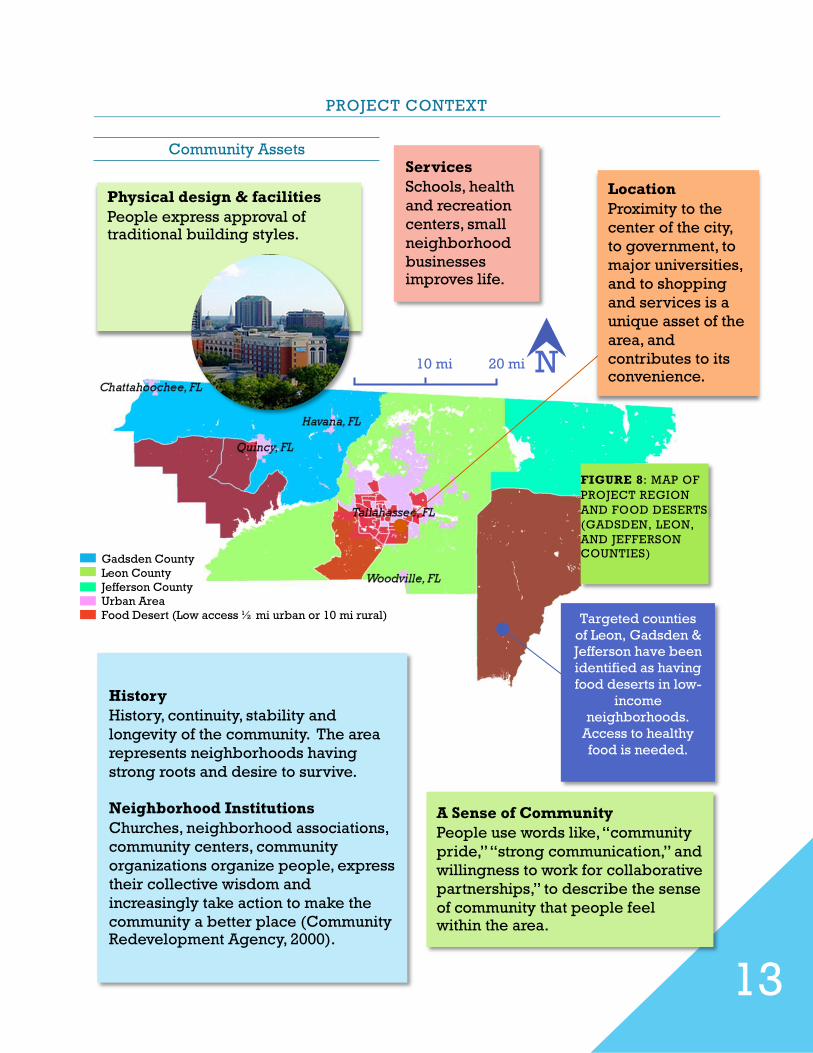
PROJECT CONTEXT
Community Assets
Location
Proximity to the
center of the city,
to government, to
major universities,
and to shopping
and services is a
unique asset of the
area, and
contributes to its convenience.
Services
Schools, health
and recreation
centers, small
neighborhood
businesses improves life.
Physical design & facilities
People express approval of traditional building styles.
A Sense of Community
People use words like, “community
pride,” “strong communication,” and
willingness to work for collaborative
partnerships,” to describe the sense
of community that people feel within the area.
History
History, continuity, stability and
longevity of the community. The area
represents neighborhoods having
strong roots and desire to survive.
Neighborhood Institutions
Churches, neighborhood associations,
community centers, community
organizations organize people, express
their collective wisdom and
increasingly take action to make the
community a better place (Community Redevelopment Agency, 2000).
Targeted counties
of Leon, Gadsden &
Jefferson have been
identified as having
food deserts in low-
income
neighborhoods.
Access to healthy
food is needed.
FIGURE 8: MAP OF
PROJECT REGION
AND FOOD DESERTS
(GADSDEN, LEON,
AND JEFFERSON
COUNTIES)
N 10 mi 20 mi
Gadsden County
Leon County
Jefferson County
Urban Area
Food Desert (Low access ½ mi urban or 10 mi rural)
14
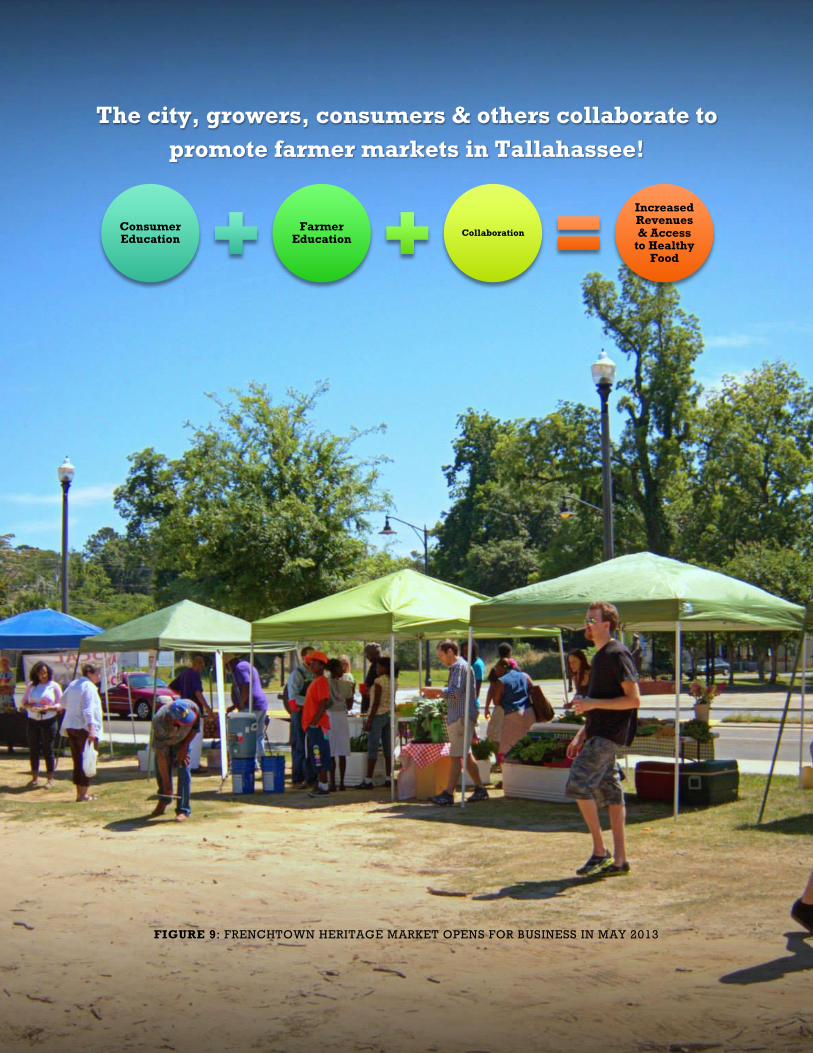
Consumer Education
Farmer Education
Collaboration
Increased Revenues & Access
to Healthy Food
The city, growers, consumers & others collaborate to
promote farmer markets in Tallahassee!
FIGURE 9: FRENCHTOWN HERITAGE MARKET OPENS FOR BUSINESS IN MAY 2013
15
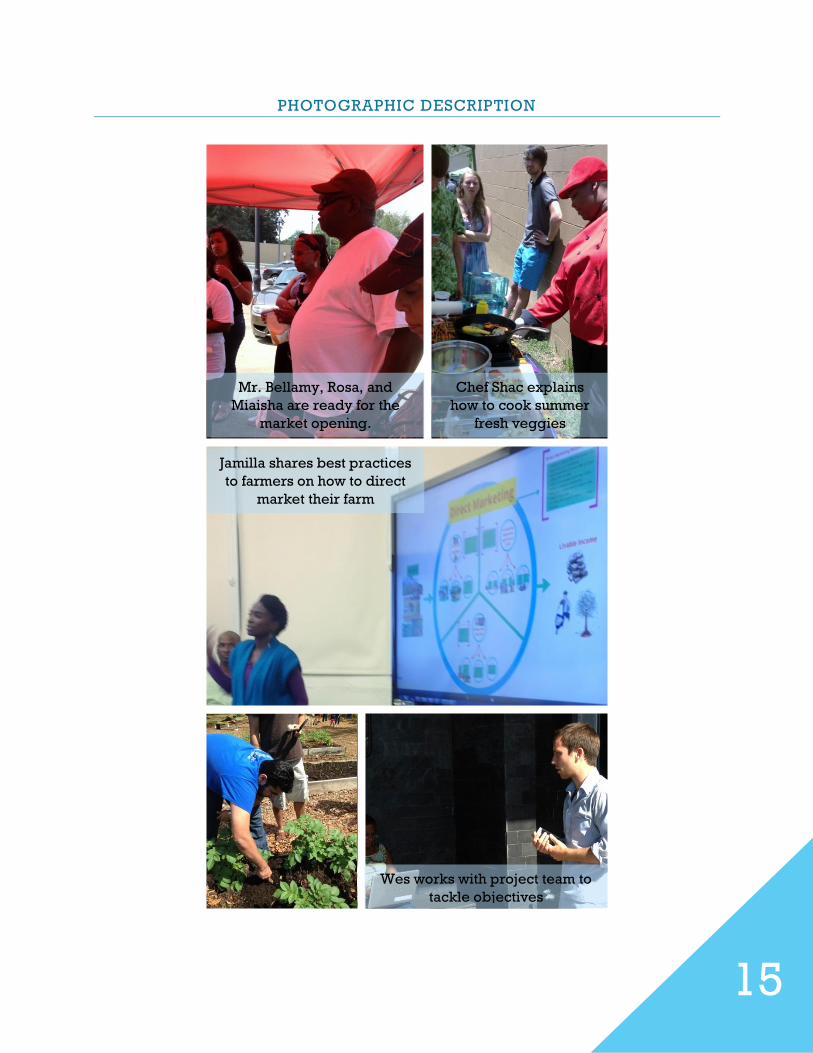
PHOTOGRAPHIC DESCRIPTION
Mr. Bellamy, Rosa, and
Miaisha are ready for the
market opening.
Chef Shac explains
how to cook summer
fresh veggies
Jamilla shares best practices
to farmers on how to direct
market their farm
Wes works with project team to
tackle objectives
PROJECT
IMPLEMENTATION
Project Overview
Project Theory of Change
Selection of Project
Participants
Photographic Description
17
REPORT TWO:
PROJECT IMPLMENTATION
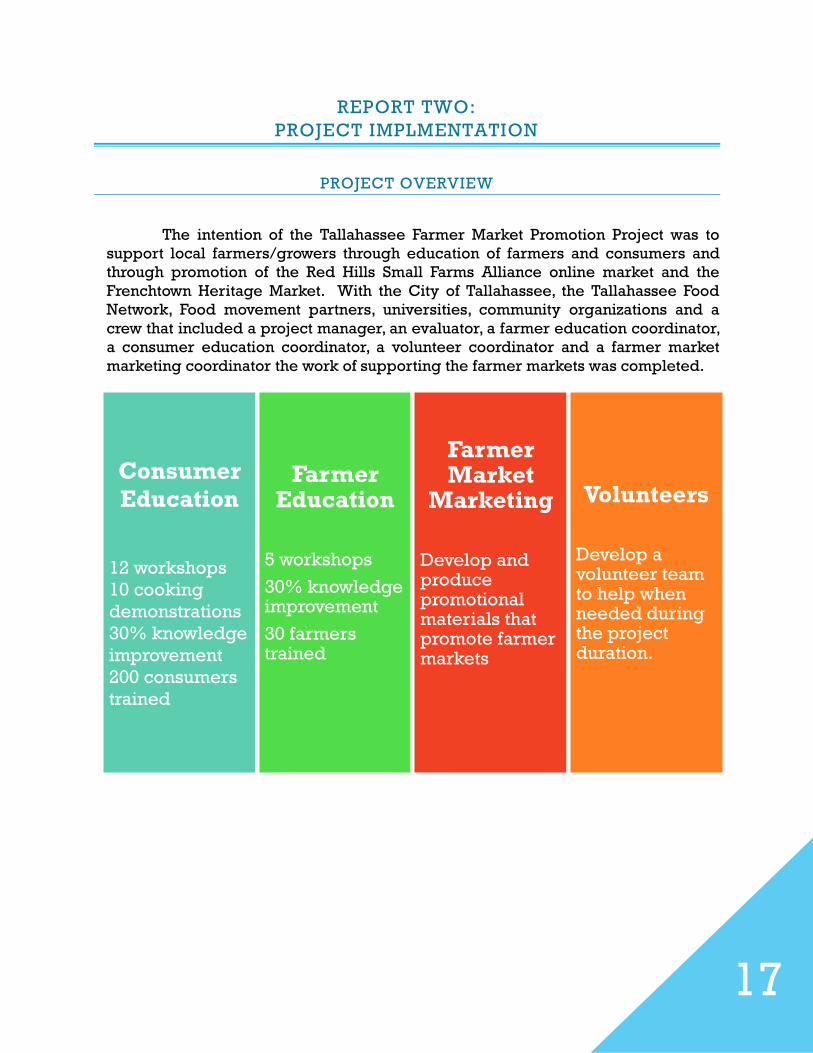
PROJECT OVERVIEW
The intention of the Tallahassee Farmer Market Promotion Project was to
support local farmers/growers through education of farmers and consumers and
through promotion of the Red Hills Small Farms Alliance online market and the
Frenchtown Heritage Market. With the City of Tallahassee, the Tallahassee Food
Network, Food movement partners, universities, community organizations and a
crew that included a project manager, an evaluator, a farmer education coordinator,
a consumer education coordinator, a volunteer coordinator and a farmer market
marketing coordinator the work of supporting the farmer markets was completed.
Consumer
Education
12 workshops
10 cooking
demonstrations
30% knowledge
improvement
200 consumers
trained
Farmer Education
5 workshops
30% knowledge improvement
30 farmers trained
Farmer Market
Marketing
Develop and produce promotional materials that promote farmer markets
Volunteers
Develop a volunteer team to help when needed during the project duration.
18
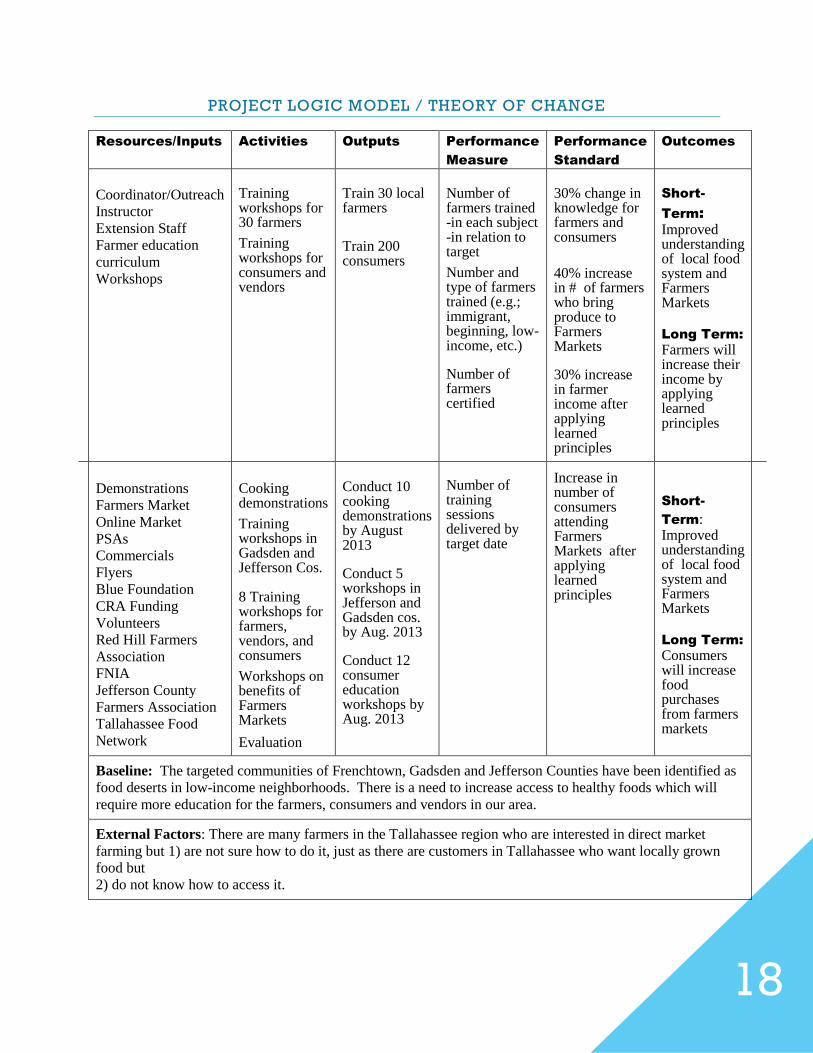
PROJECT LOGIC MODEL / THEORY OF CHANGE
Resources/Inputs Activities Outputs Performance
Measure
Performance
Standard
Outcomes
Coordinator/Outreach
Instructor
Extension Staff
Farmer education
curriculum
Workshops
Demonstrations
Farmers Market
Online Market
PSAs
Commercials
Flyers
Blue Foundation
CRA Funding
Volunteers
Red Hill Farmers
Association
FNIA
Jefferson County
Farmers Association
Tallahassee Food
Network
Training workshops for 30 farmers
Training workshops for consumers and vendors
Cooking demonstrations
Training workshops in Gadsden and Jefferson Cos.
8 Training workshops for farmers, vendors, and consumers
Workshops on benefits of Farmers Markets
Evaluation
Train 30 local farmers
Train 200 consumers
Conduct 10 cooking demonstrations by August 2013
Conduct 5 workshops in Jefferson and Gadsden cos. by Aug. 2013
Conduct 12 consumer education workshops by Aug. 2013
Number of farmers trained -in each subject -in relation to target
Number and type of farmers trained (e.g.; immigrant, beginning, low-income, etc.)
Number of farmers certified
Number of training sessions delivered by target date
30% change in knowledge for farmers and consumers
40% increase in # of farmers who bring produce to Farmers Markets
30% increase in farmer income after applying learned principles Increase in number of consumers attending Farmers Markets after applying learned principles
Short-
Term:
Improved understanding of local food system and Farmers Markets
Long Term:
Farmers will increase their income by applying learned principles
Short-
Term: Improved understanding of local food system and Farmers Markets
Long Term:
Consumers will increase food purchases from farmers markets
Baseline: The targeted communities of Frenchtown, Gadsden and Jefferson Counties have been identified as
food deserts in low-income neighborhoods. There is a need to increase access to healthy foods which will
require more education for the farmers, consumers and vendors in our area.
External Factors: There are many farmers in the Tallahassee region who are interested in direct market
farming but 1) are not sure how to do it, just as there are customers in Tallahassee who want locally grown
food but
2) do not know how to access it.
19
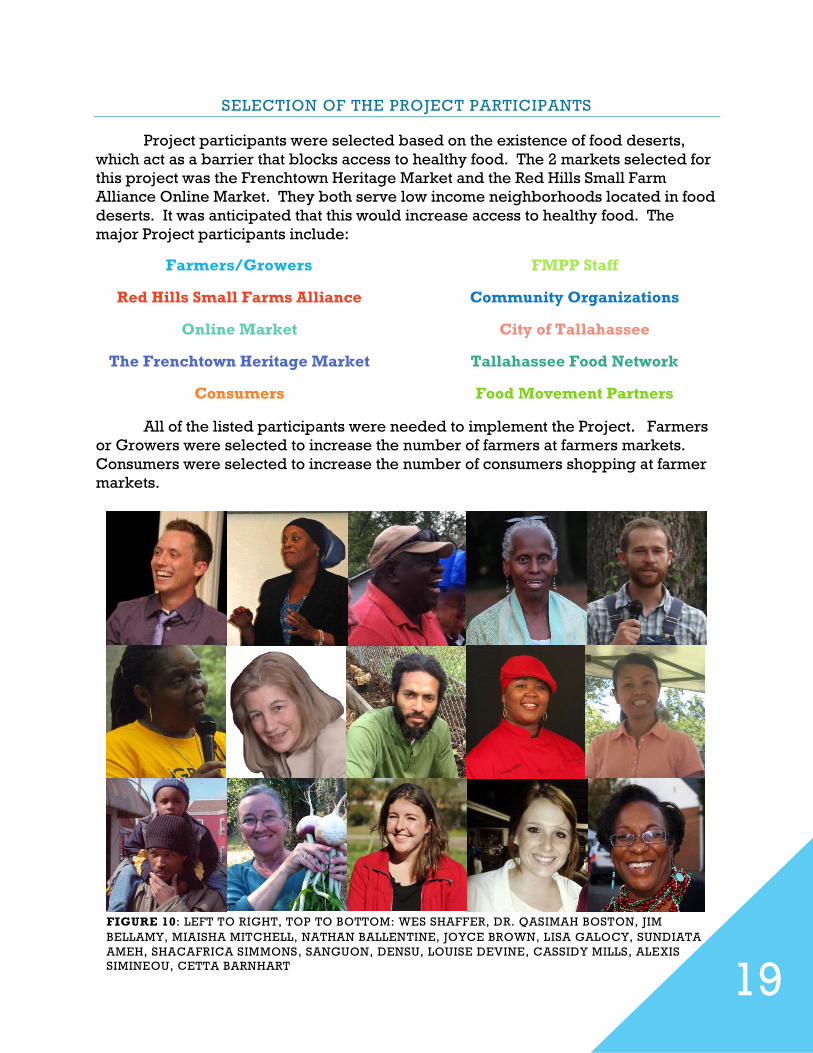
SELECTION OF THE PROJECT PARTICIPANTS
Project participants were selected based on the existence of food deserts,
which act as a barrier that blocks access to healthy food. The 2 markets selected for
this project was the Frenchtown Heritage Market and the Red Hills Small Farm
Alliance Online Market. They both serve low income neighborhoods located in food
deserts. It was anticipated that this would increase access to healthy food. The
major Project participants include:
Farmers/Growers
Red Hills Small Farms Alliance
Online Market
The Frenchtown Heritage Market
Consumers
FMPP Staff
Community Organizations
City of Tallahassee
Tallahassee Food Network
Food Movement Partners
All of the listed participants were needed to implement the Project. Farmers
or Growers were selected to increase the number of farmers at farmers markets.
Consumers were selected to increase the number of consumers shopping at farmer
markets.
FIGURE 10: LEFT TO RIGHT, TOP TO BOTTOM: WES SHAFFER, DR. QASIMAH BOSTON, JIM
BELLAMY, MIAISHA MITCHELL, NATHAN BALLENTINE, JOYCE BROWN, LISA GALOCY, SUNDIATA
AMEH, SHACAFRICA SIMMONS, SANGUON, DENSU, LOUISE DEVINE, CASSIDY MILLS, ALEXIS
SIMINEOU, CETTA BARNHART
20
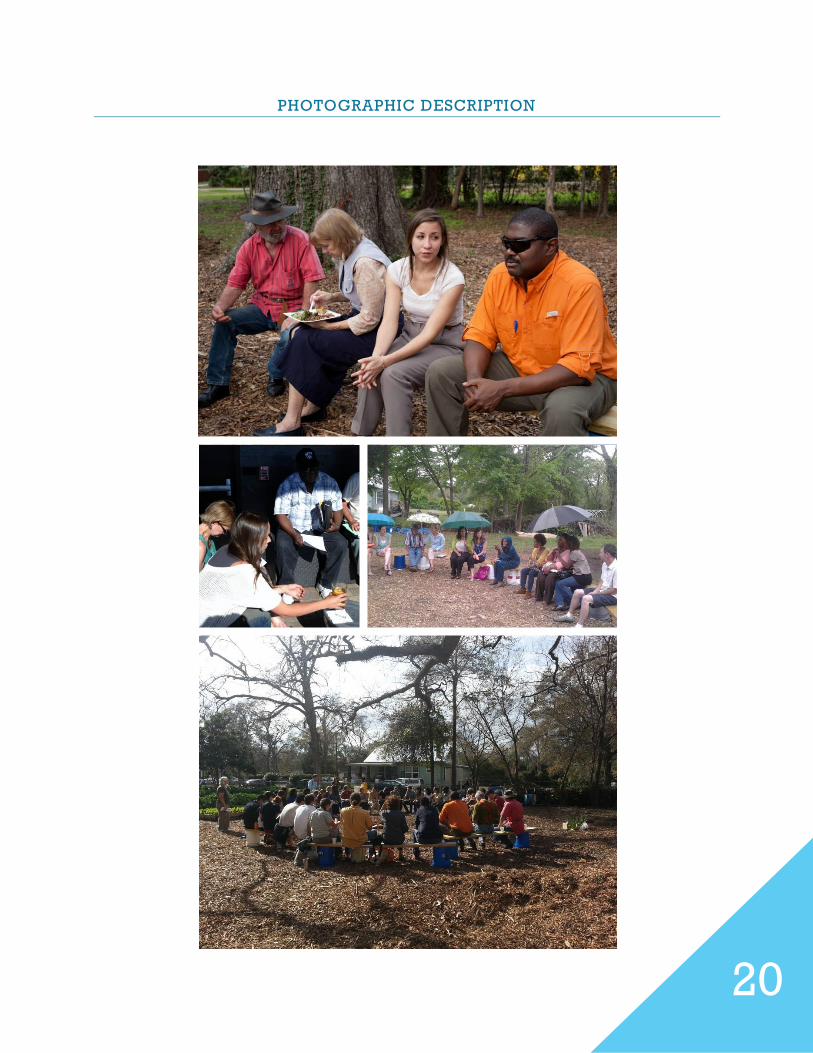
PHOTOGRAPHIC DESCRIPTION
PROJECT
RESULTS
Evaluation Approach
Evaluation Questions
Evaluation Methods
Evaluation Plan
Evaluation Findings
Photographic Description
22
REPORT THREE:
PROJECT RESULTS
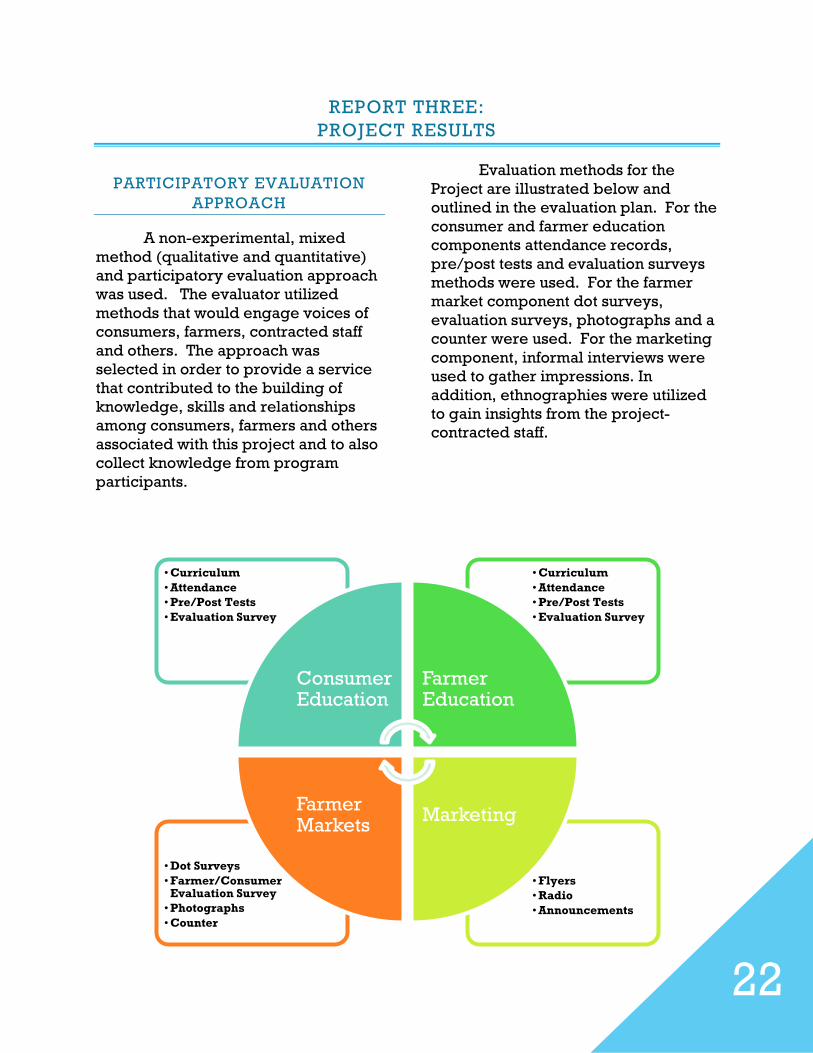
PARTICIPATORY EVALUATION
APPROACH
A non-experimental, mixed
method (qualitative and quantitative)
and participatory evaluation approach
was used. The evaluator utilized
methods that would engage voices of
consumers, farmers, contracted staff
and others. The approach was
selected in order to provide a service
that contributed to the building of
knowledge, skills and relationships
among consumers, farmers and others
associated with this project and to also
collect knowledge from program
participants.
Evaluation methods for the
Project are illustrated below and
outlined in the evaluation plan. For the
consumer and farmer education
components attendance records,
pre/post tests and evaluation surveys
methods were used. For the farmer
market component dot surveys,
evaluation surveys, photographs and a
counter were used. For the marketing
component, informal interviews were
used to gather impressions. In
addition, ethnographies were utilized
to gain insights from the project-
contracted staff.
• Flyers
• Radio
• Announcements
• Dot Surveys
• Farmer/Consumer Evaluation Survey
• Photographs
• Counter
• Curriculum
• Attendance
• Pre/Post Tests
• Evaluation Survey
• Curriculum
• Attendance
• Pre/Post Tests
• Evaluation Survey
Consumer Education
Farmer Education
Marketing Farmer Markets
23
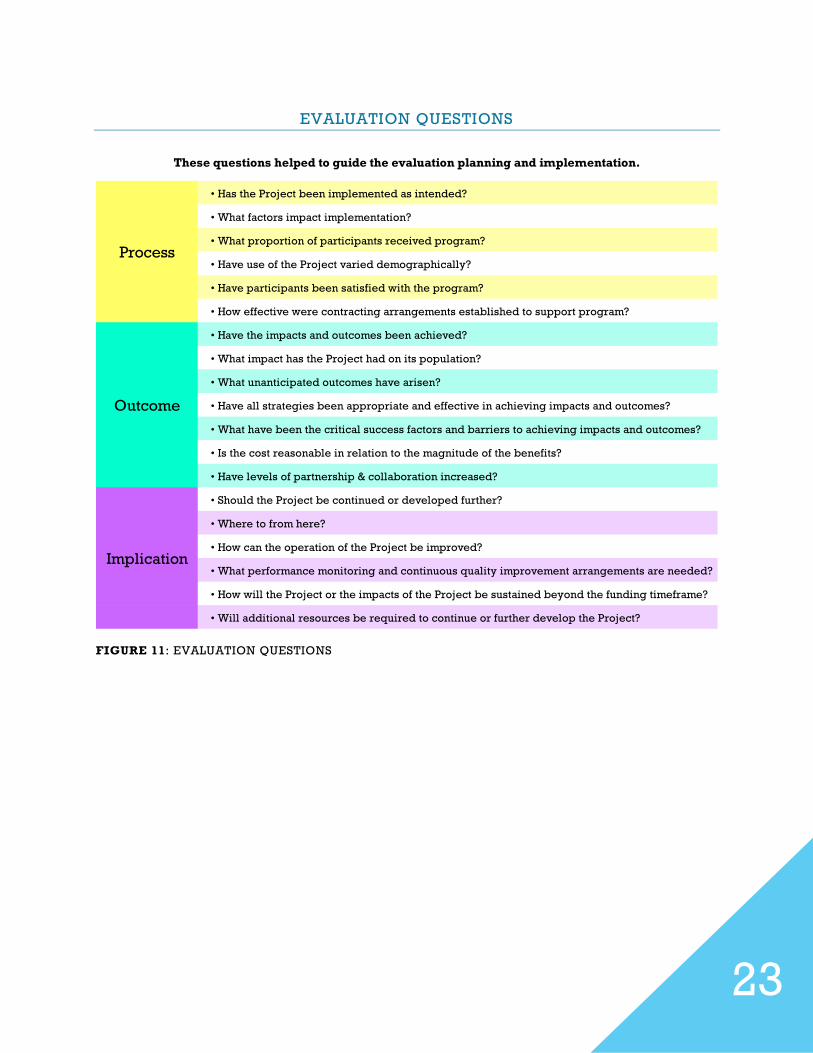
EVALUATION QUESTIONS
FIGURE 11: EVALUATION QUESTIONS
• Has the Project been implemented as intended?
• What factors impact implementation?
• What proportion of participants received program?
• Have use of the Project varied demographically?
• Have participants been satisfied with the program?
• How effective were contracting arrangements established to support program?
• Have the impacts and outcomes been achieved?
• What impact has the Project had on its population?
• What unanticipated outcomes have arisen?
• Have all strategies been appropriate and effective in achieving impacts and outcomes?
• What have been the critical success factors and barriers to achieving impacts and outcomes?
• Is the cost reasonable in relation to the magnitude of the benefits?
• Have levels of partnership & collaboration increased?
• Should the Project be continued or developed further?
• Where to from here?
• How can the operation of the Project be improved?
• What performance monitoring and continuous quality improvement arrangements are needed?
• How will the Project or the impacts of the Project be sustained beyond the funding timeframe?
• Will additional resources be required to continue or further develop the Project?
These questions helped to guide the evaluation planning and implementation.
Process
Outcome
Implication
24
Consumer Education Evaluation Findings
25
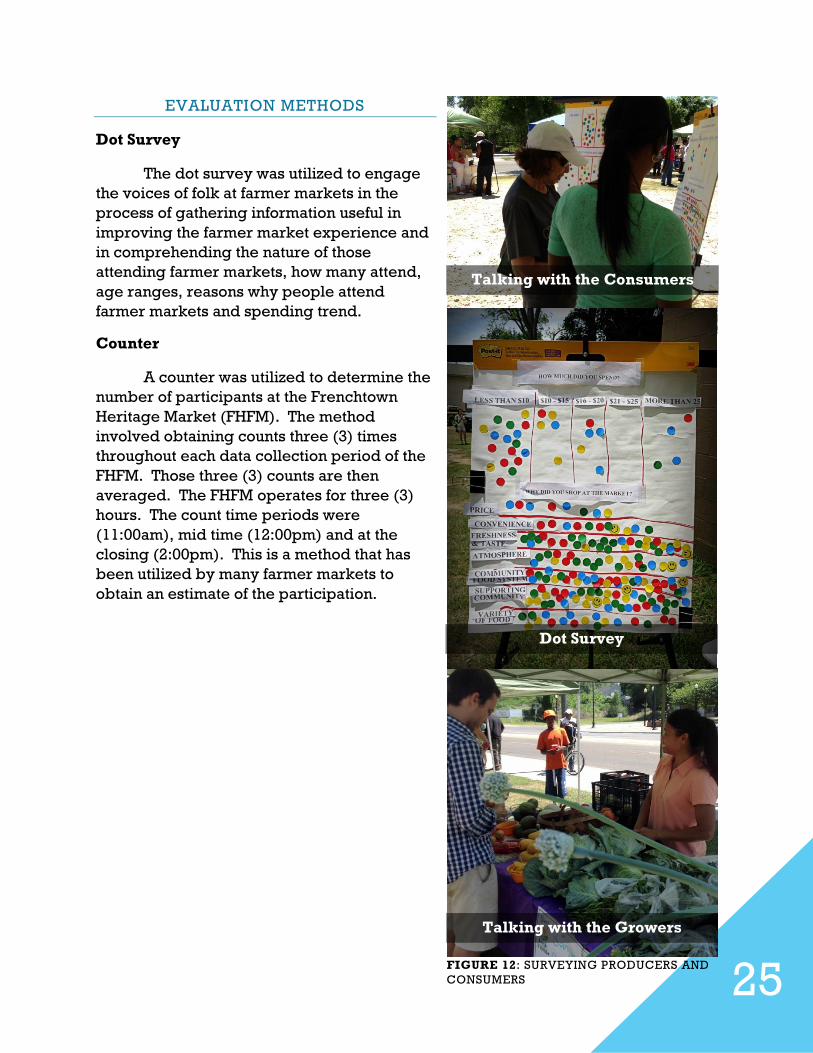
EVALUATION METHODS
Dot Survey
The dot survey was utilized to engage
the voices of folk at farmer markets in the
process of gathering information useful in
improving the farmer market experience and
in comprehending the nature of those
attending farmer markets, how many attend,
age ranges, reasons why people attend
farmer markets and spending trend.
Counter
A counter was utilized to determine the
number of participants at the Frenchtown
Heritage Market (FHFM). The method
involved obtaining counts three (3) times
throughout each data collection period of the
FHFM. Those three (3) counts are then
averaged. The FHFM operates for three (3)
hours. The count time periods were
(11:00am), mid time (12:00pm) and at the
closing (2:00pm). This is a method that has
been utilized by many farmer markets to
obtain an estimate of the participation.
FIGURE 12: SURVEYING PRODUCERS AND
CONSUMERS
Talking with the Consumers
Dot Survey
Talking with the Growers
26
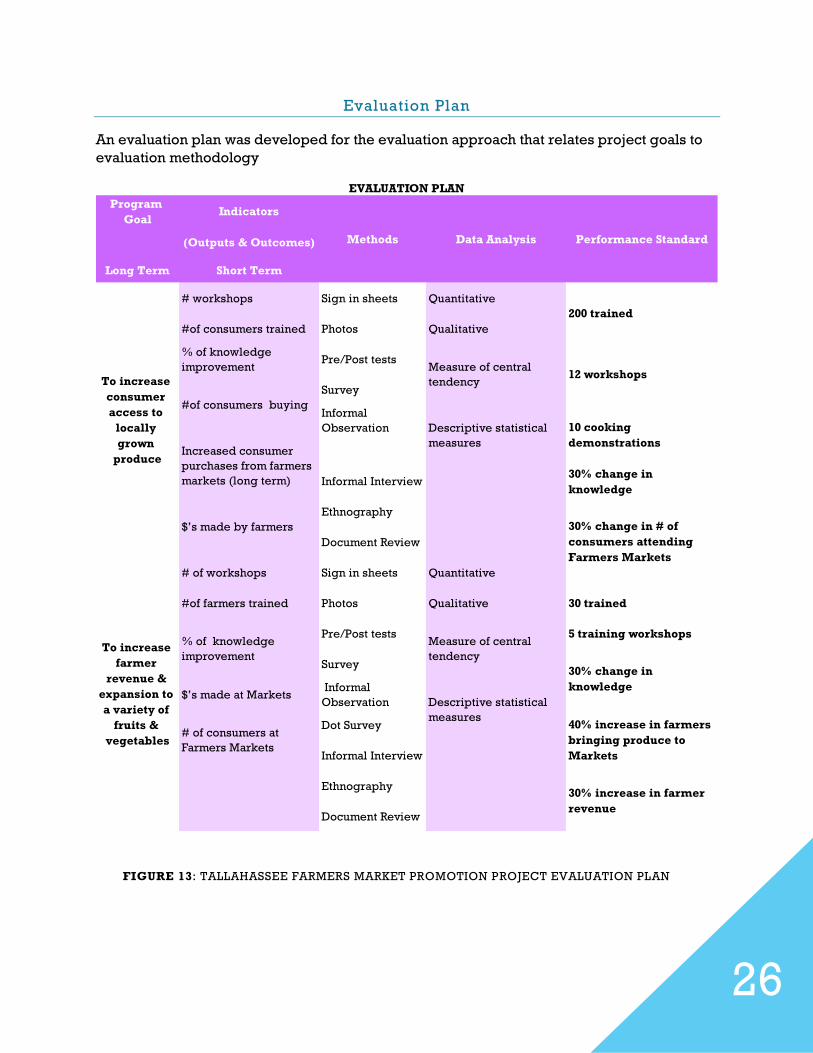
Evaluation Plan
An evaluation plan was developed for the evaluation approach that relates project goals to
evaluation methodology
Program
GoalIndicators
(Outputs & Outcomes)
Long Term Short Term
# workshops Sign in sheets Quantitative
#of consumers trained Photos Qualitative
% of knowledge
improvementPre/Post tests
Survey
Informal
Observation
Informal Interview30% change in
knowledge
Ethnography
Document Review
# of workshops Sign in sheets Quantitative
#of farmers trained Photos Qualitative 30 trained
Pre/Post tests 5 training workshops
Survey
$’s made at Markets Informal
Observation
Dot Survey
Informal Interview
Ethnography
Document Review
30% increase in farmer
revenue
30% change in # of
consumers attending
Farmers Markets
Descriptive statistical
measures
Measure of central
tendency
Descriptive statistical
measures
200 trained
12 workshops
10 cooking
demonstrations
30% change in
knowledge
40% increase in farmers
bringing produce to
Markets
To increase
farmer
revenue &
expansion to
a variety of
fruits &
vegetables
% of knowledge
improvement
# of consumers at
Farmers Markets
EVALUATION PLAN
Methods Data Analysis Performance Standard
To increase
consumer
access to
locally
grown
produceIncreased consumer
purchases from farmers
markets (long term)
#of consumers buying
$’s made by farmers
Measure of central
tendency
FIGURE 13: TALLAHASSEE FARMERS MARKET PROMOTION PROJECT EVALUATION PLAN
27
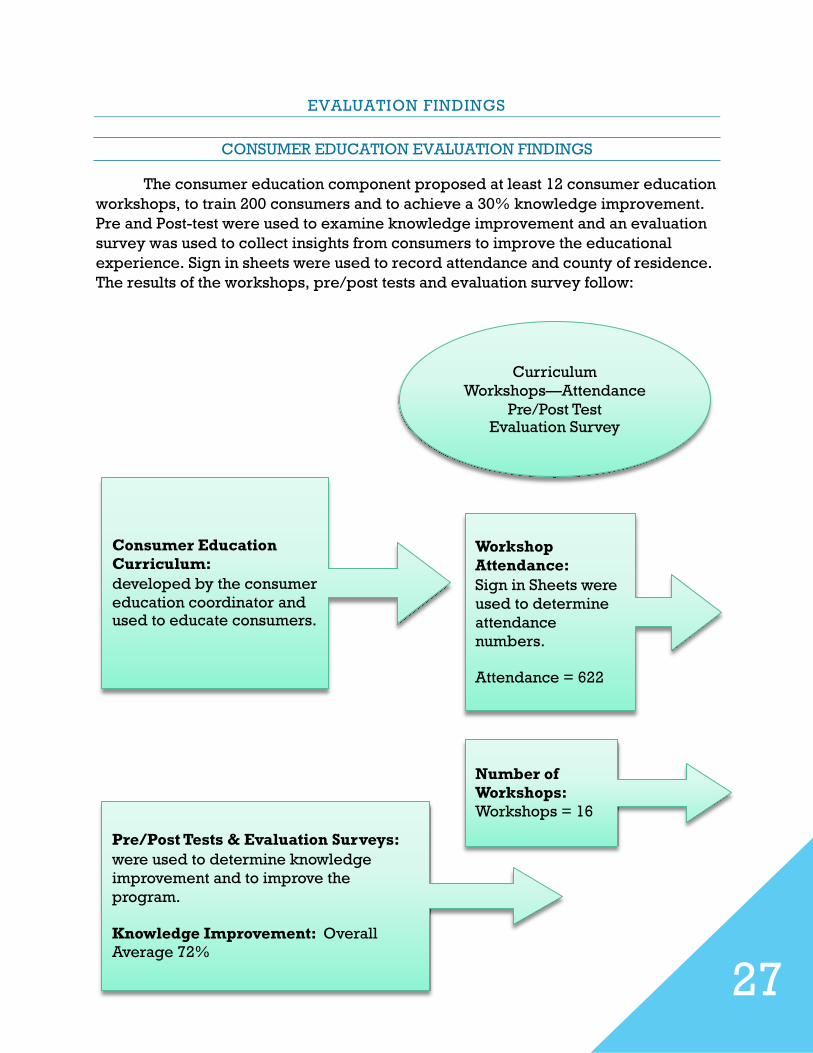
EVALUATION FINDINGS
CONSUMER EDUCATION EVALUATION FINDINGS
The consumer education component proposed at least 12 consumer education
workshops, to train 200 consumers and to achieve a 30% knowledge improvement.
Pre and Post-test were used to examine knowledge improvement and an evaluation
survey was used to collect insights from consumers to improve the educational
experience. Sign in sheets were used to record attendance and county of residence.
The results of the workshops, pre/post tests and evaluation survey follow:
Curriculum
Workshops—Attendance
Pre/Post Test Evaluation Survey
Consumer Education
Curriculum:
developed by the consumer
education coordinator and used to educate consumers.
Number of
Workshops:
Workshops = 16
Workshop
Attendance:
Sign in Sheets were
used to determine
attendance
numbers. Attendance = 622
Pre/Post Tests & Evaluation Surveys:
were used to determine knowledge
improvement and to improve the
program.
Knowledge Improvement: Overall
Average 72%
28
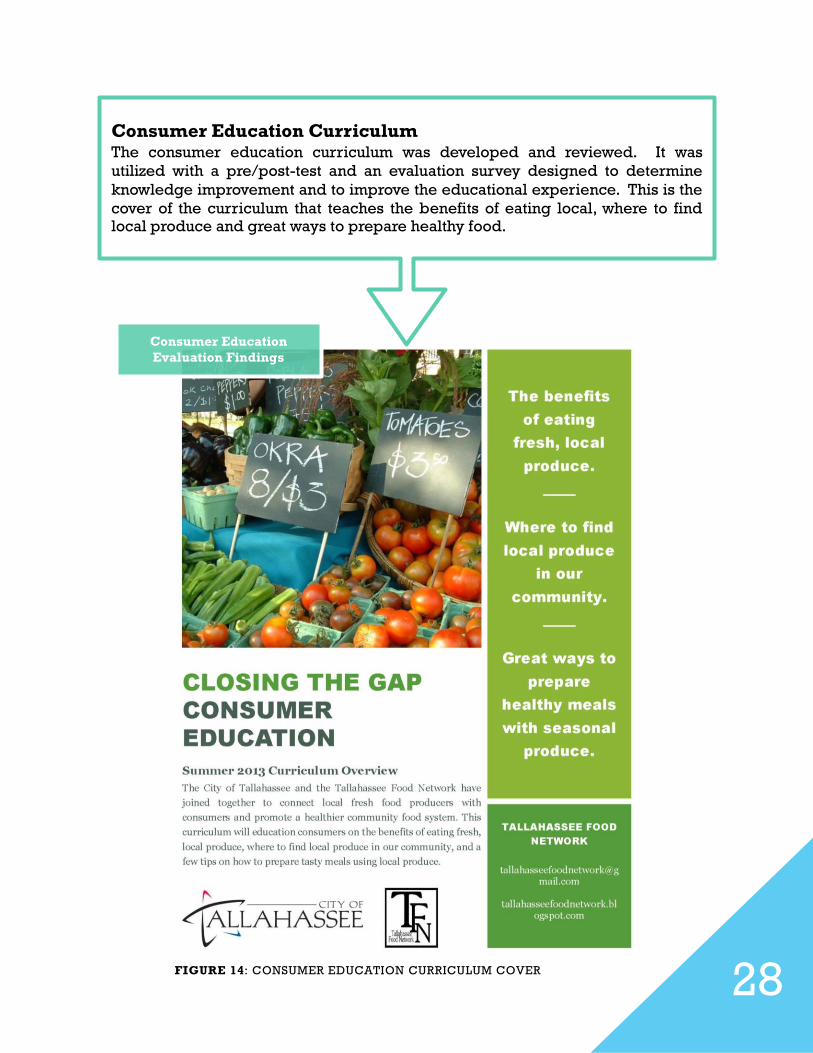
Consumer Education Curriculum The consumer education curriculum was developed and reviewed. It was
utilized with a pre/post-test and an evaluation survey designed to determine
knowledge improvement and to improve the educational experience. This is the
cover of the curriculum that teaches the benefits of eating local, where to find local produce and great ways to prepare healthy food.
Consumer Education Evaluation Findings
FIGURE 14: CONSUMER EDUCATION CURRICULUM COVER
29
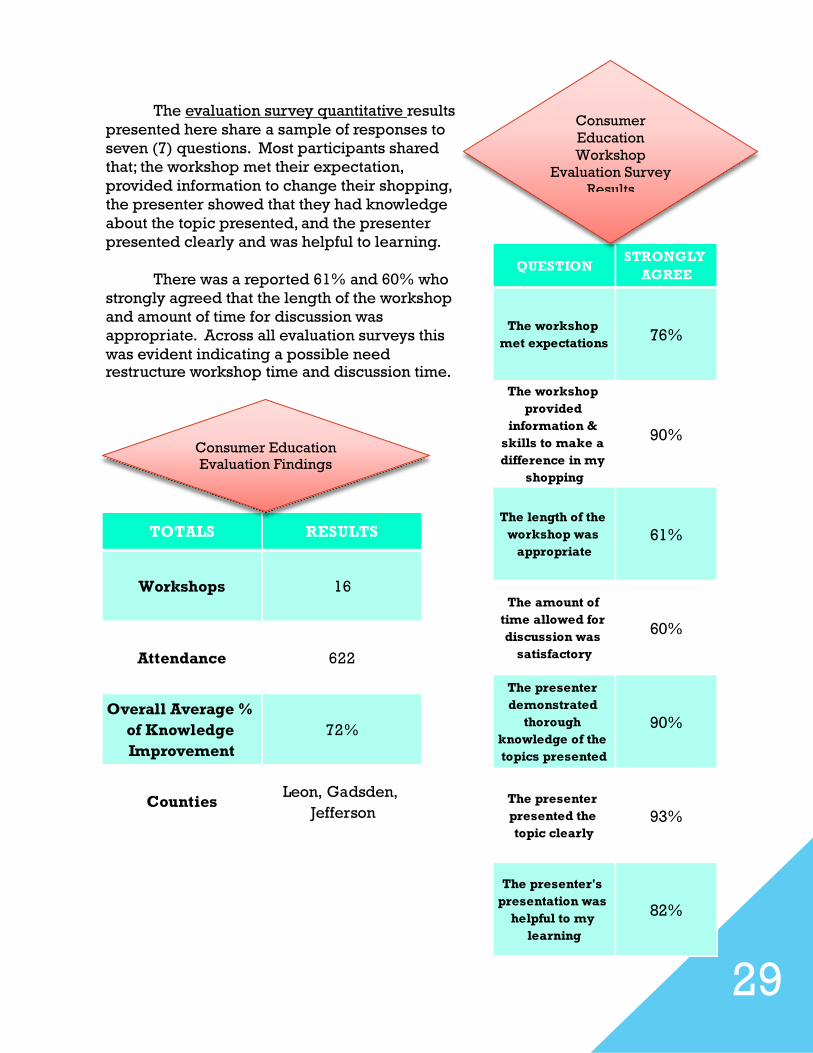
The evaluation survey quantitative results
presented here share a sample of responses to
seven (7) questions. Most participants shared
that; the workshop met their expectation,
provided information to change their shopping,
the presenter showed that they had knowledge
about the topic presented, and the presenter
presented clearly and was helpful to learning.
There was a reported 61% and 60% who
strongly agreed that the length of the workshop
and amount of time for discussion was
appropriate. Across all evaluation surveys this
was evident indicating a possible need restructure workshop time and discussion time.
TOTALS RESULTS
Workshops 16
Attendance 622
Overall Average %
of Knowledge
Improvement
72%
CountiesLeon, Gadsden,
Jefferson
Consumer Education Evaluation Findings
QUESTIONSTRONGLY
AGREE
The workshop
met expectations76%
The workshop
provided
information &
skills to make a
difference in my
shopping
90%
The length of the
workshop was
appropriate
61%
The amount of
time allowed for
discussion was
satisfactory
60%
The presenter
demonstrated
thorough
knowledge of the
topics presented
90%
The presenter
presented the
topic clearly
93%
The presenter's
presentation was
helpful to my
learning
82%
Consumer
Education
Workshop
Evaluation Survey
Results
30
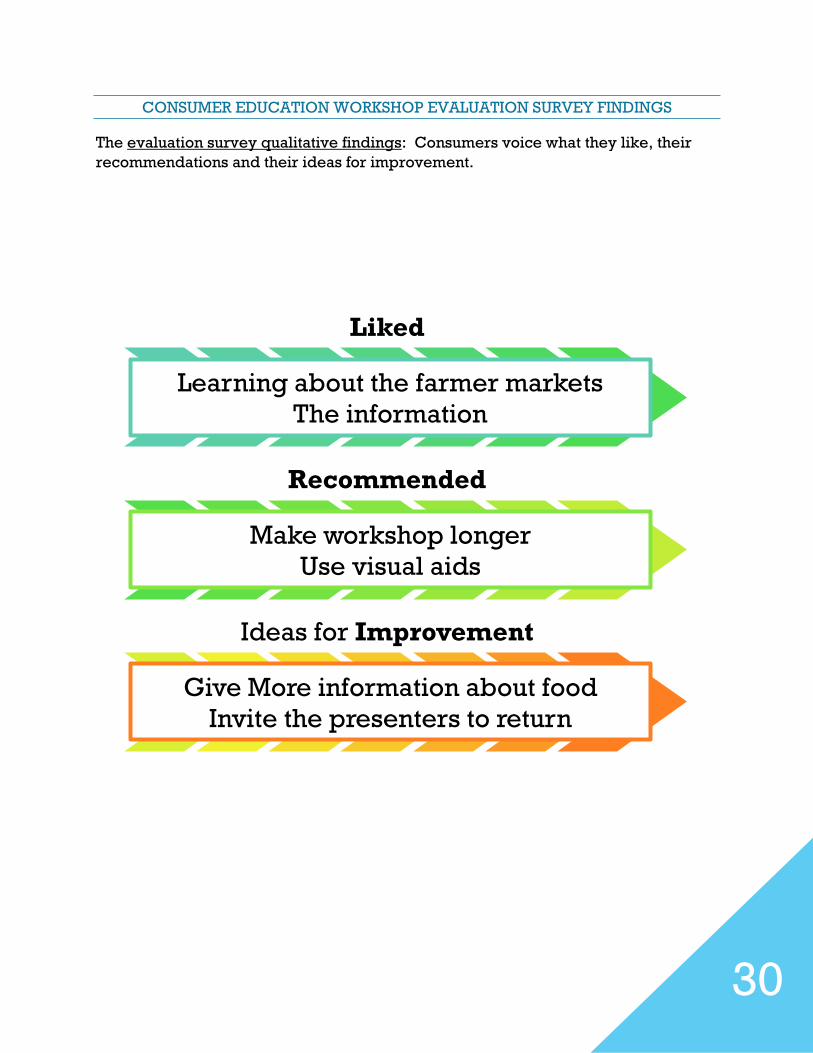
CONSUMER EDUCATION WORKSHOP EVALUATION SURVEY FINDINGS
The evaluation survey qualitative findings: Consumers voice what they like, their
recommendations and their ideas for improvement.
Liked
Learning about the farmer markets
The information
Recommended
Make workshop longer
Use visual aids
Ideas for Improvement
Give More information about food
Invite the presenters to return
31
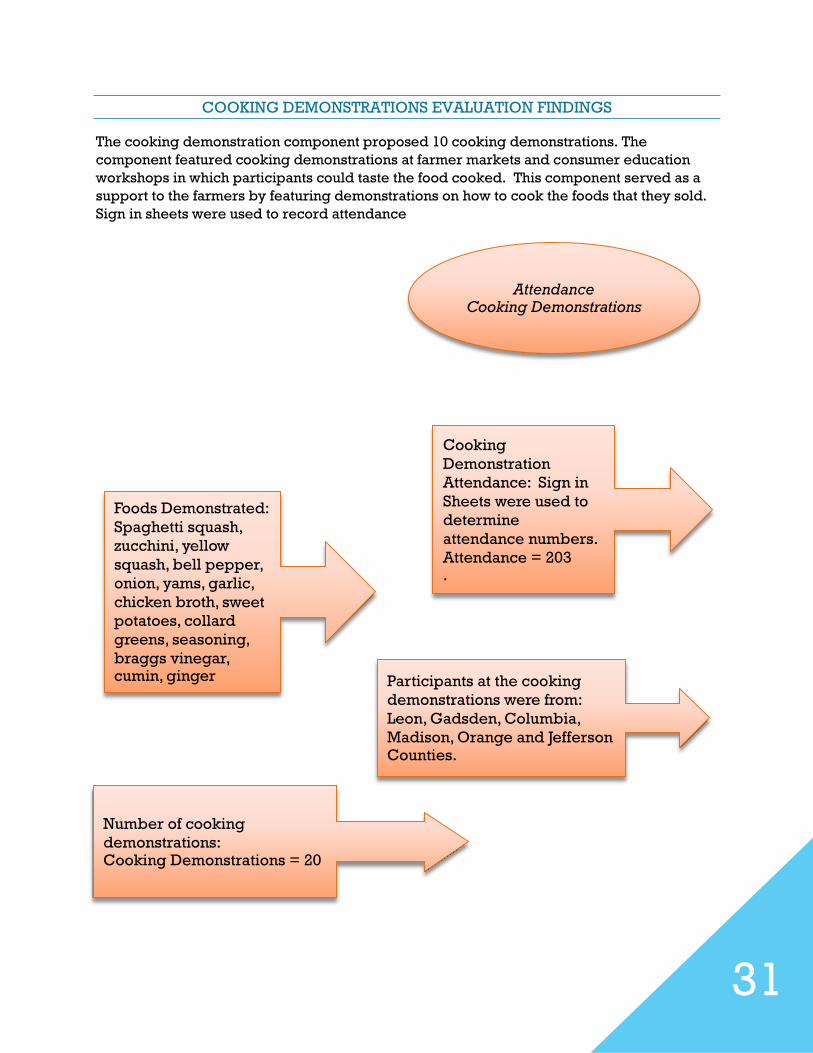
COOKING DEMONSTRATIONS EVALUATION FINDINGS
The cooking demonstration component proposed 10 cooking demonstrations. The
component featured cooking demonstrations at farmer markets and consumer education
workshops in which participants could taste the food cooked. This component served as a
support to the farmers by featuring demonstrations on how to cook the foods that they sold.
Sign in sheets were used to record attendance
Attendance Cooking Demonstrations
Foods Demonstrated:
Spaghetti squash,
zucchini, yellow
squash, bell pepper,
onion, yams, garlic,
chicken broth, sweet
potatoes, collard
greens, seasoning,
braggs vinegar, cumin, ginger Participants at the cooking
demonstrations were from:
Leon, Gadsden, Columbia,
Madison, Orange and Jefferson Counties.
Cooking
Demonstration
Attendance: Sign in
Sheets were used to
determine
attendance numbers.
Attendance = 203 .
Number of cooking
demonstrations: Cooking Demonstrations = 20
32
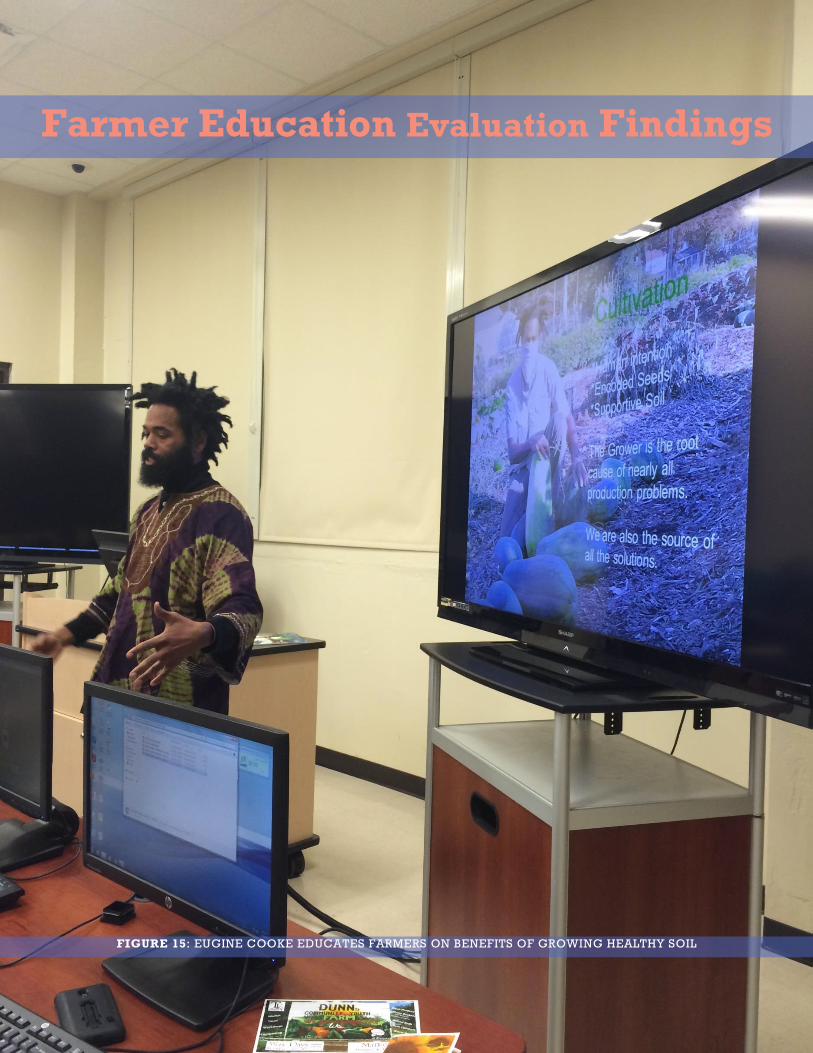
Farmer Education Evaluation Findings
FIGURE 15: EUGINE COOKE EDUCATES FARMERS ON BENEFITS OF GROWING HEALTHY SOIL
33
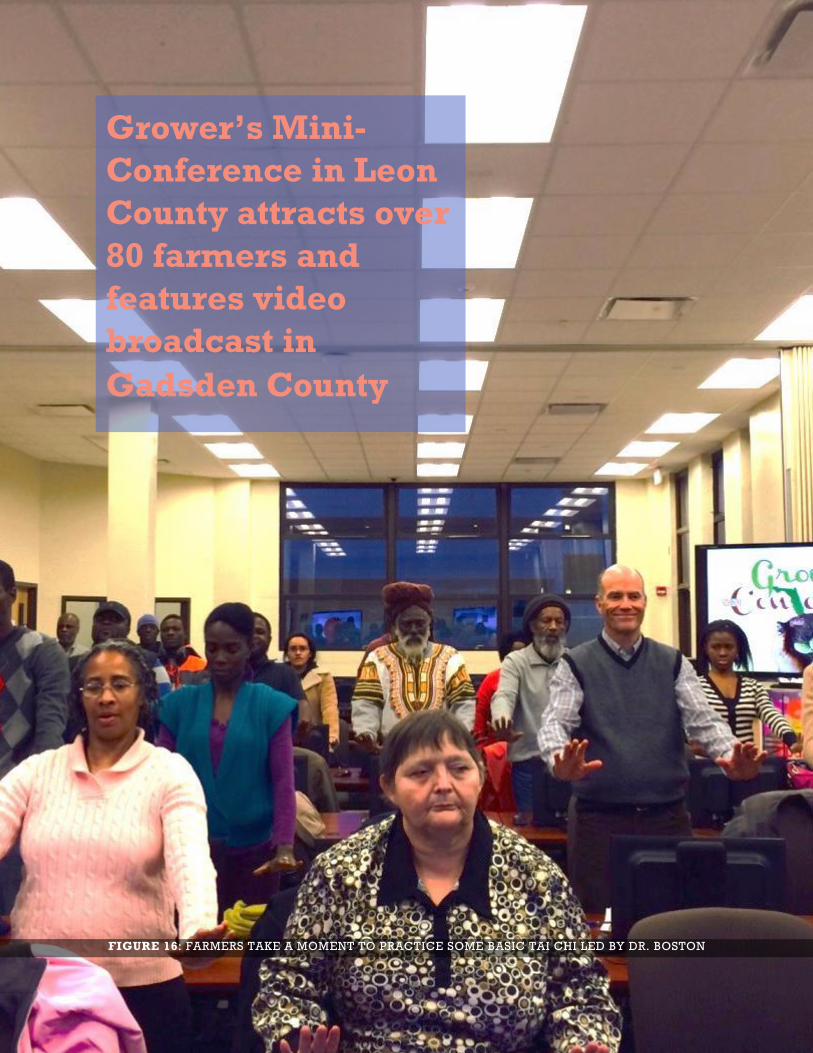
Grower’s Mini-
Conference in Leon
County attracts over
80 farmers and
features video
broadcast in
Gadsden County
FIGURE 16: FARMERS TAKE A MOMENT TO PRACTICE SOME BASIC TAI CHI LED BY DR. BOSTON
34
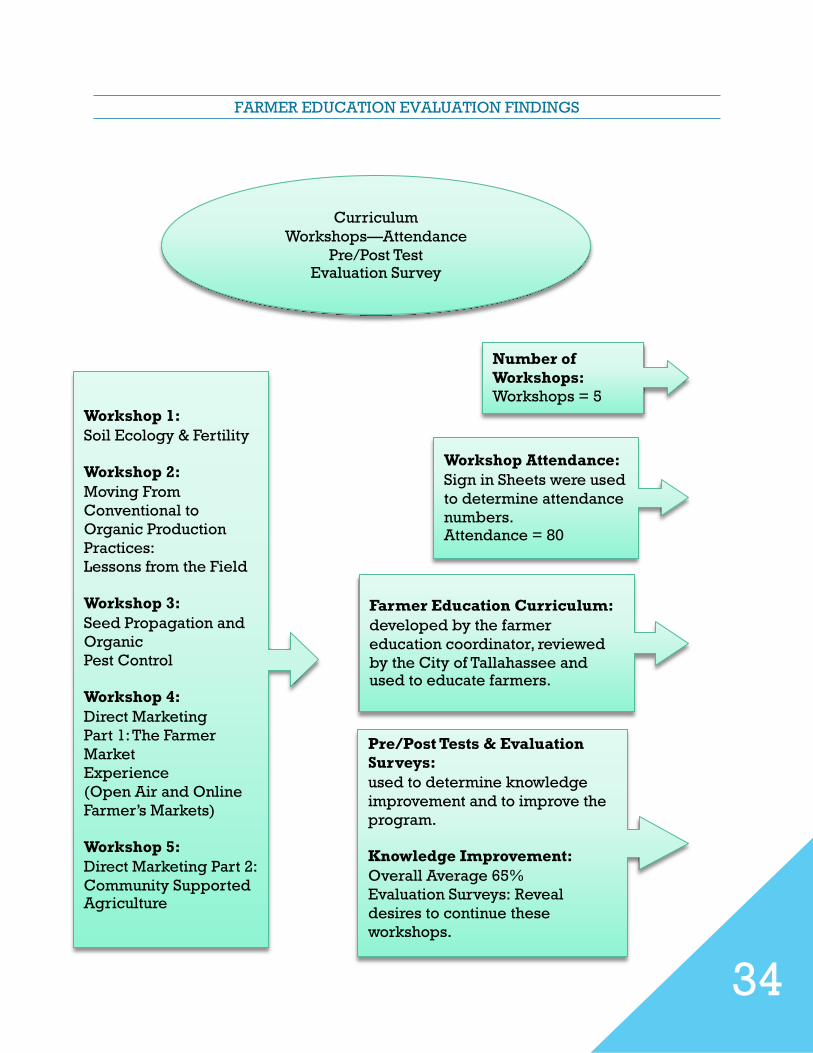
FARMER EDUCATION EVALUATION FINDINGS
Curriculum
Workshops—Attendance
Pre/Post Test Evaluation Survey
Number of
Workshops:
Workshops = 5
Workshop Attendance:
Sign in Sheets were used
to determine attendance
numbers. Attendance = 80
Workshop 1:
Soil Ecology & Fertility
Workshop 2:
Moving From
Conventional to
Organic Production
Practices:
Lessons from the Field
Workshop 3:
Seed Propagation and
Organic
Pest Control
Workshop 4:
Direct Marketing
Part 1: The Farmer
Market
Experience
(Open Air and Online
Farmer’s Markets)
Workshop 5:
Direct Marketing Part 2:
Community Supported Agriculture
Farmer Education Curriculum:
developed by the farmer
education coordinator, reviewed
by the City of Tallahassee and used to educate farmers.
Pre/Post Tests & Evaluation
Surveys:
used to determine knowledge
improvement and to improve the
program.
Knowledge Improvement:
Overall Average 65%
Evaluation Surveys: Reveal
desires to continue these
workshops.
35
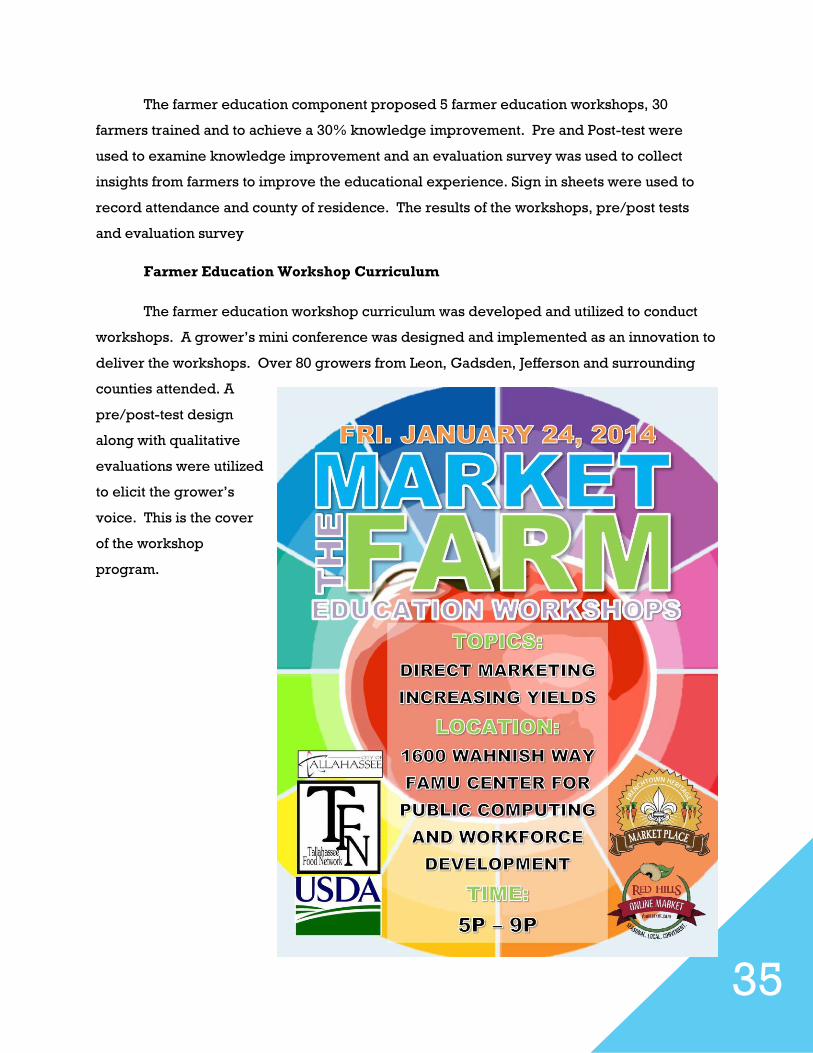
The farmer education component proposed 5 farmer education workshops, 30
farmers trained and to achieve a 30% knowledge improvement. Pre and Post-test were
used to examine knowledge improvement and an evaluation survey was used to collect
insights from farmers to improve the educational experience. Sign in sheets were used to
record attendance and county of residence. The results of the workshops, pre/post tests
and evaluation survey
Farmer Education Workshop Curriculum
The farmer education workshop curriculum was developed and utilized to conduct
workshops. A grower’s mini conference was designed and implemented as an innovation to
deliver the workshops. Over 80 growers from Leon, Gadsden, Jefferson and surrounding
counties attended. A
pre/post-test design
along with qualitative
evaluations were utilized
to elicit the grower’s
voice. This is the cover
of the workshop
program.
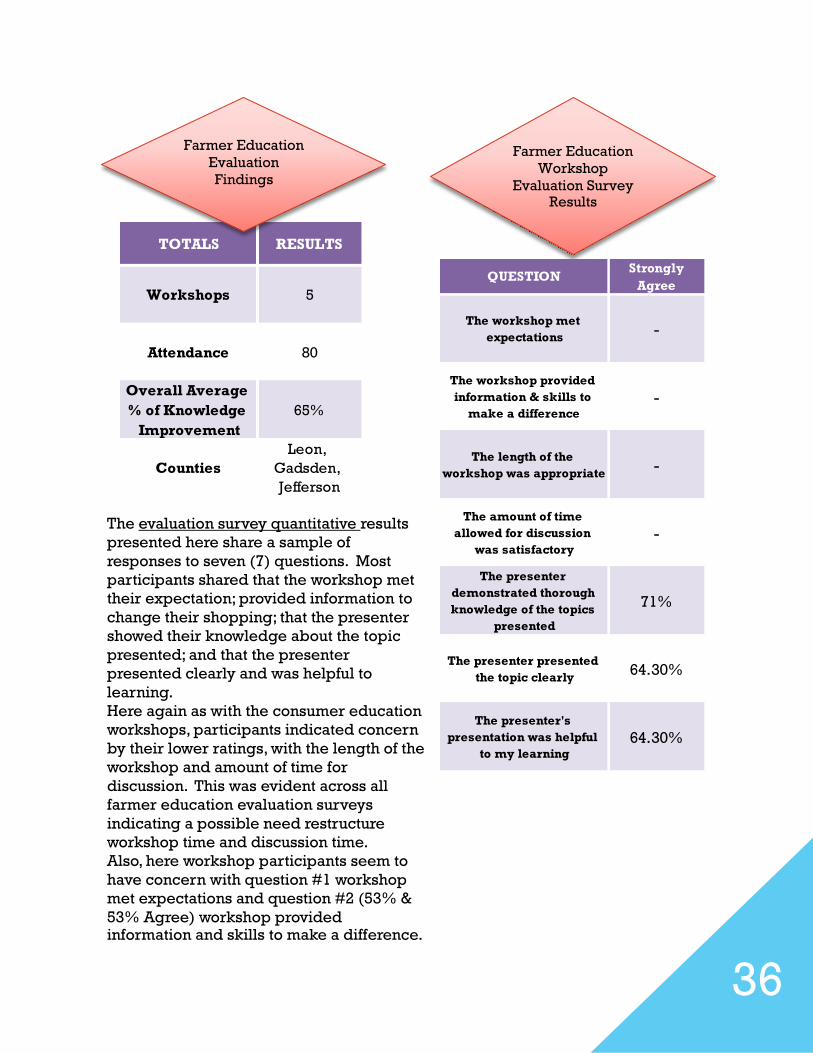
36
TOTALS RESULTS
Workshops 5
Attendance 80
Overall Average
% of Knowledge
Improvement
65%
Counties
Leon,
Gadsden,
Jefferson
The evaluation survey quantitative results
presented here share a sample of
responses to seven (7) questions. Most
participants shared that the workshop met
their expectation; provided information to
change their shopping; that the presenter
showed their knowledge about the topic
presented; and that the presenter
presented clearly and was helpful to
learning.
Here again as with the consumer education
workshops, participants indicated concern
by their lower ratings, with the length of the
workshop and amount of time for
discussion. This was evident across all
farmer education evaluation surveys
indicating a possible need restructure
workshop time and discussion time.
Also, here workshop participants seem to
have concern with question #1 workshop
met expectations and question #2 (53% &
53% Agree) workshop provided information and skills to make a difference.
Farmer Education
Workshop
Evaluation Survey Results
Farmer Education
Evaluation
Findings
Strongly
Agree
The workshop met
expectations-
The workshop provided
information & skills to
make a difference
-
The length of the
workshop was appropriate-
The amount of time
allowed for discussion
was satisfactory
-
The presenter
demonstrated thorough
knowledge of the topics
presented
71%
The presenter presented
the topic clearly64.30%
The presenter's
presentation was helpful
to my learning
64.30%
QUESTION
37
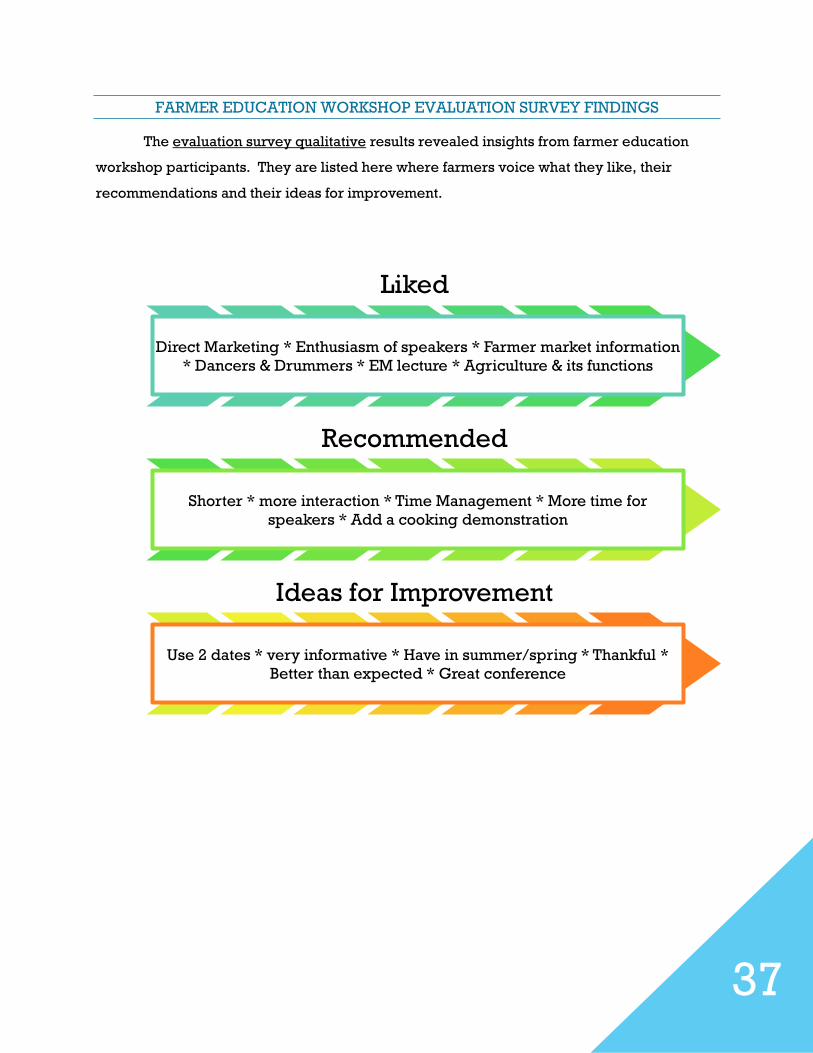
FARMER EDUCATION WORKSHOP EVALUATION SURVEY FINDINGS
The evaluation survey qualitative results revealed insights from farmer education
workshop participants. They are listed here where farmers voice what they like, their
recommendations and their ideas for improvement.
Liked
Direct Marketing * Enthusiasm of speakers * Farmer market information
* Dancers & Drummers * EM lecture * Agriculture & its functions
Recommended
Shorter * more interaction * Time Management * More time for
speakers * Add a cooking demonstration
Ideas for Improvement
Use 2 dates * very informative * Have in summer/spring * Thankful *
Better than expected * Great conference
38
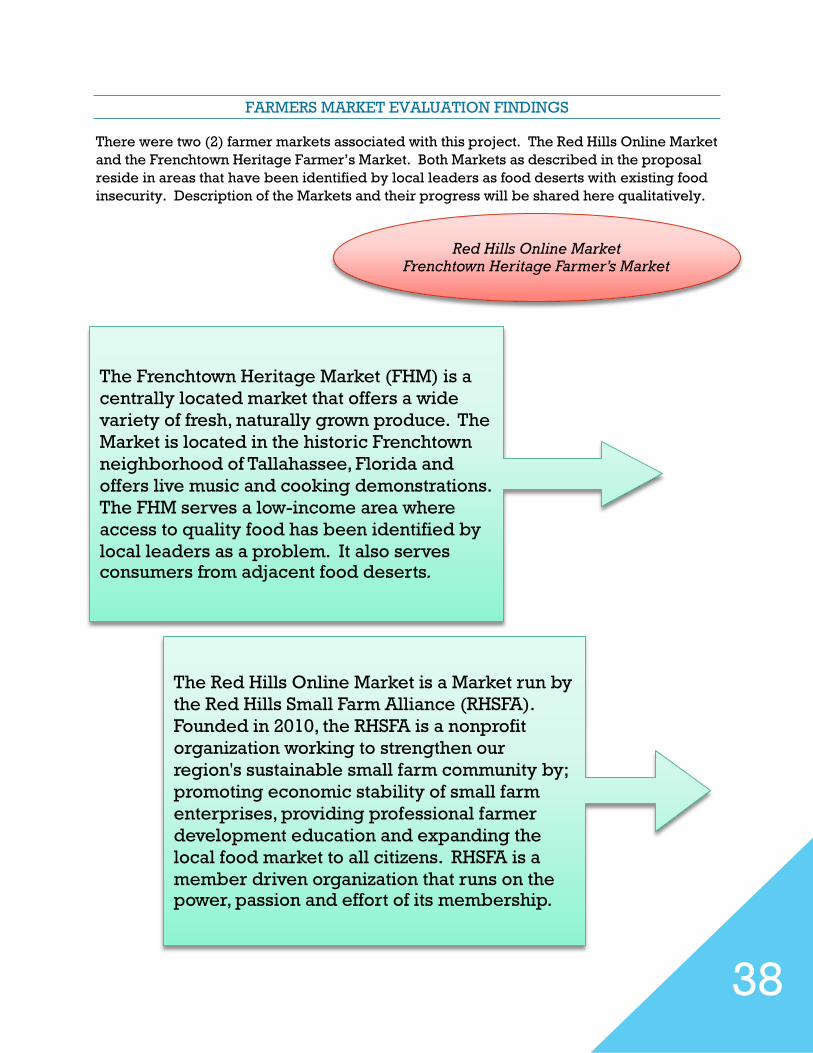
FARMERS MARKET EVALUATION FINDINGS
There were two (2) farmer markets associated with this project. The Red Hills Online Market
and the Frenchtown Heritage Farmer’s Market. Both Markets as described in the proposal
reside in areas that have been identified by local leaders as food deserts with existing food
insecurity. Description of the Markets and their progress will be shared here qualitatively.
Red Hills Online Market
Frenchtown Heritage Farmer’s Market
The Frenchtown Heritage Market (FHM) is a
centrally located market that offers a wide
variety of fresh, naturally grown produce. The
Market is located in the historic Frenchtown
neighborhood of Tallahassee, Florida and
offers live music and cooking demonstrations.
The FHM serves a low-income area where
access to quality food has been identified by
local leaders as a problem. It also serves consumers from adjacent food deserts.
The Red Hills Online Market is a Market run by
the Red Hills Small Farm Alliance (RHSFA).
Founded in 2010, the RHSFA is a nonprofit
organization working to strengthen our
region's sustainable small farm community by;
promoting economic stability of small farm
enterprises, providing professional farmer
development education and expanding the
local food market to all citizens. RHSFA is a
member driven organization that runs on the power, passion and effort of its membership.
39
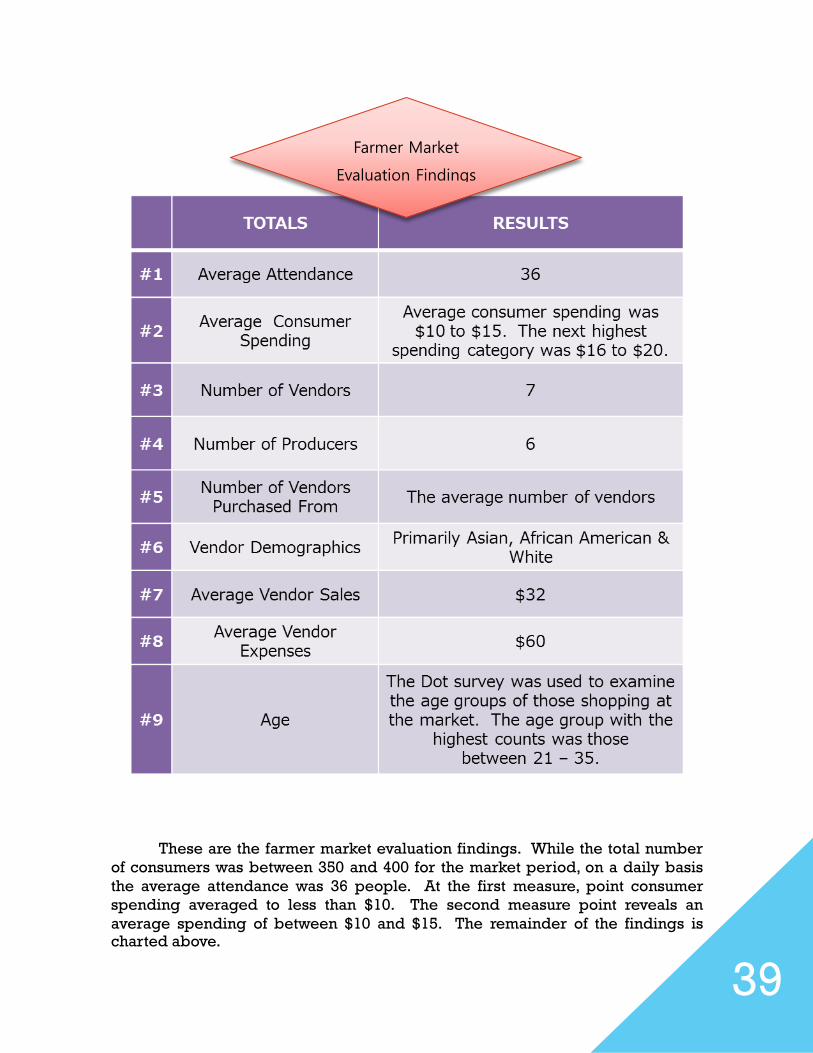
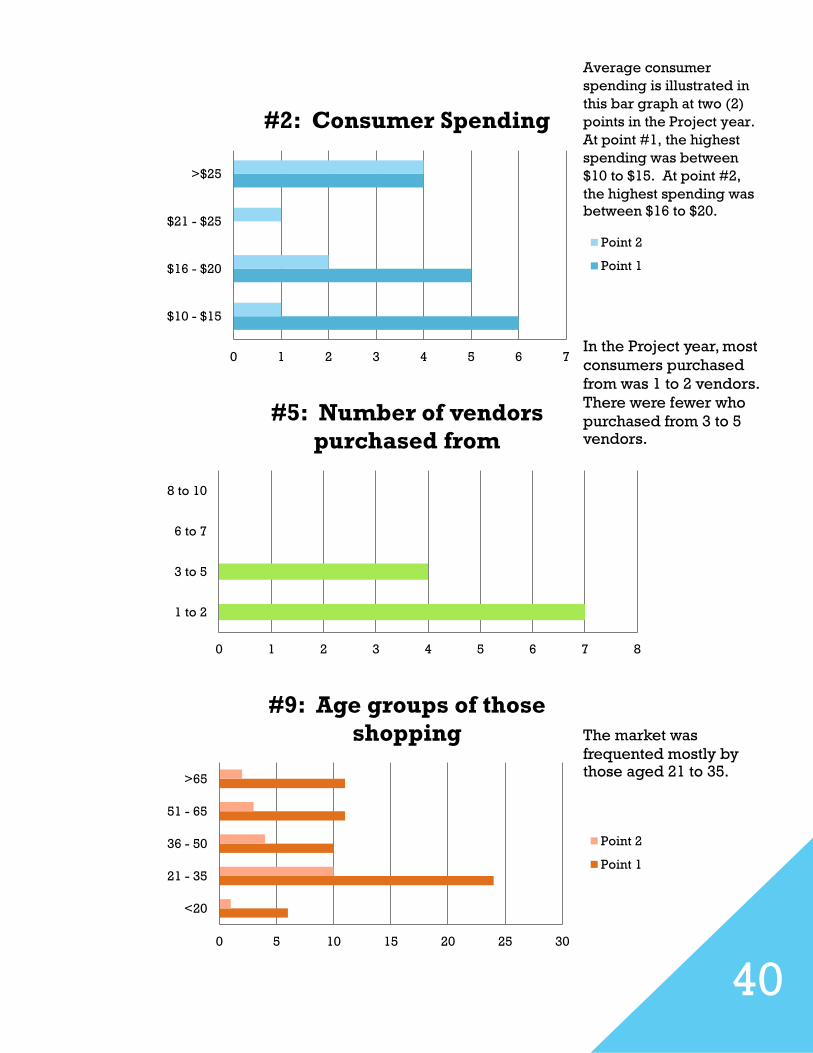
These are the farmer market evaluation findings. While the total number
of consumers was between 350 and 400 for the market period, on a daily basis
the average attendance was 36 people. At the first measure, point consumer
spending averaged to less than $10. The second measure point reveals an
average spending of between $10 and $15. The remainder of the findings is charted above.
Farmer Market
Evaluation Findings
40
0 1 2 3 4 5 6 7
$10 - $15
$16 - $20
$21 - $25
>$25
#2: Consumer Spending
Point 2
Point 1
0 1 2 3 4 5 6 7 8
1 to 2
3 to 5
6 to 7
8 to 10
#5: Number of vendors
purchased from
0 5 10 15 20 25 30
<20
21 - 35
36 - 50
51 - 65
>65
#9: Age groups of those
shopping
Point 2
Point 1
Average consumer
spending is illustrated in
this bar graph at two (2)
points in the Project year.
At point #1, the highest
spending was between
$10 to $15. At point #2,
the highest spending was
between $16 to $20.
In the Project year, most
consumers purchased
from was 1 to 2 vendors.
There were fewer who
purchased from 3 to 5 vendors.
The market was
frequented mostly by those aged 21 to 35.
41
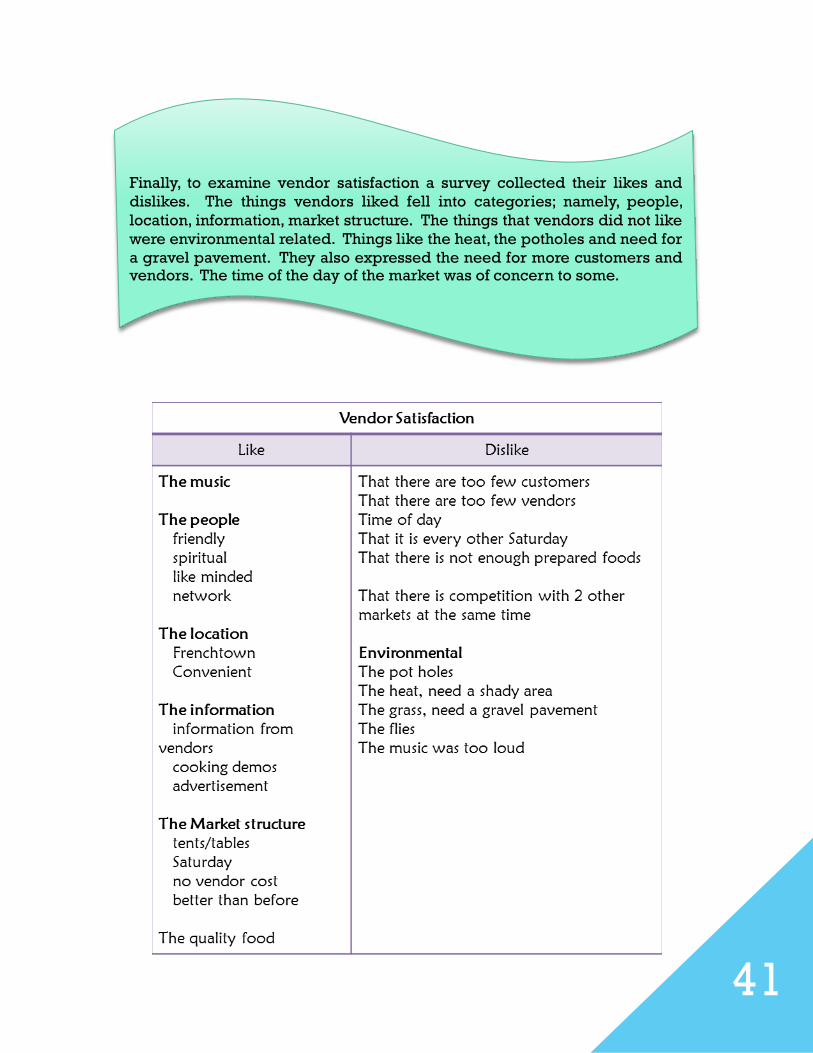
Finally, to examine vendor satisfaction a survey collected their likes and
dislikes. The things vendors liked fell into categories; namely, people,
location, information, market structure. The things that vendors did not like
were environmental related. Things like the heat, the potholes and need for
a gravel pavement. They also expressed the need for more customers and vendors. The time of the day of the market was of concern to some.
42
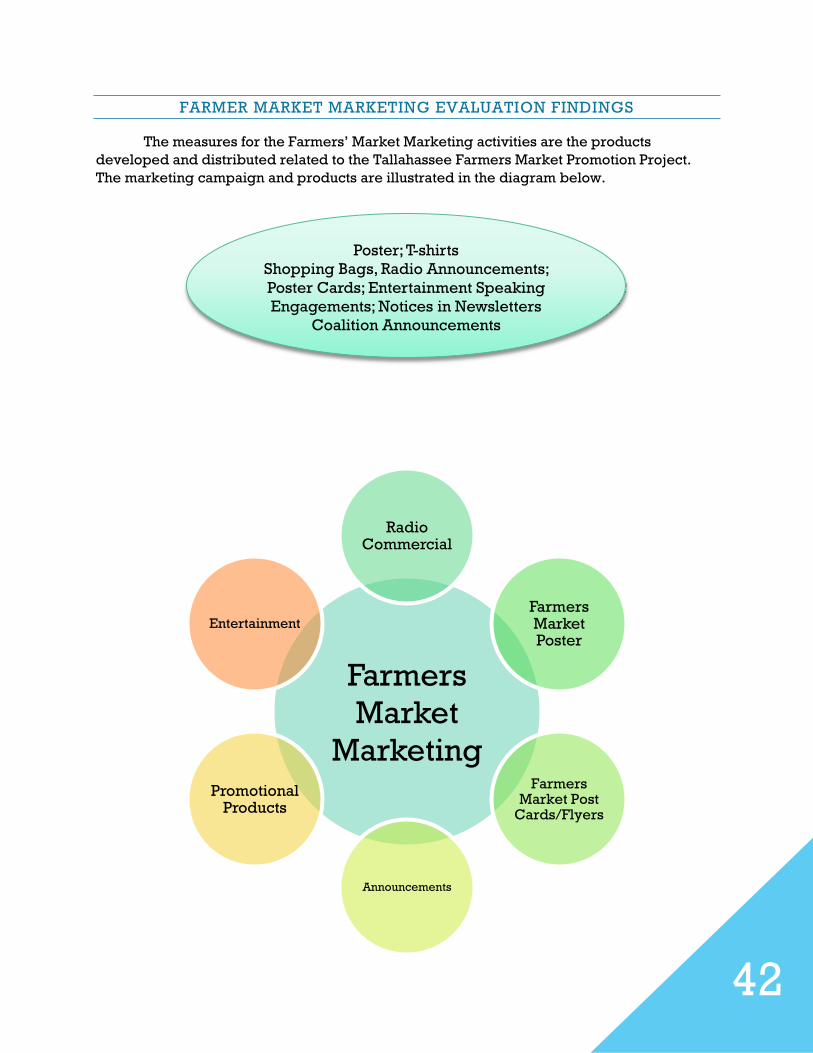
FARMER MARKET MARKETING EVALUATION FINDINGS
The measures for the Farmers’ Market Marketing activities are the products
developed and distributed related to the Tallahassee Farmers Market Promotion Project.
The marketing campaign and products are illustrated in the diagram below.
Poster; T-shirts
Shopping Bags, Radio Announcements;
Poster Cards; Entertainment Speaking
Engagements; Notices in Newsletters
Coalition Announcements
Farmers
Market
Marketing
Radio Commercial
Farmers Market Poster
Farmers Market Post
Cards/Flyers
Announcements
Promotional Products
Entertainment
43
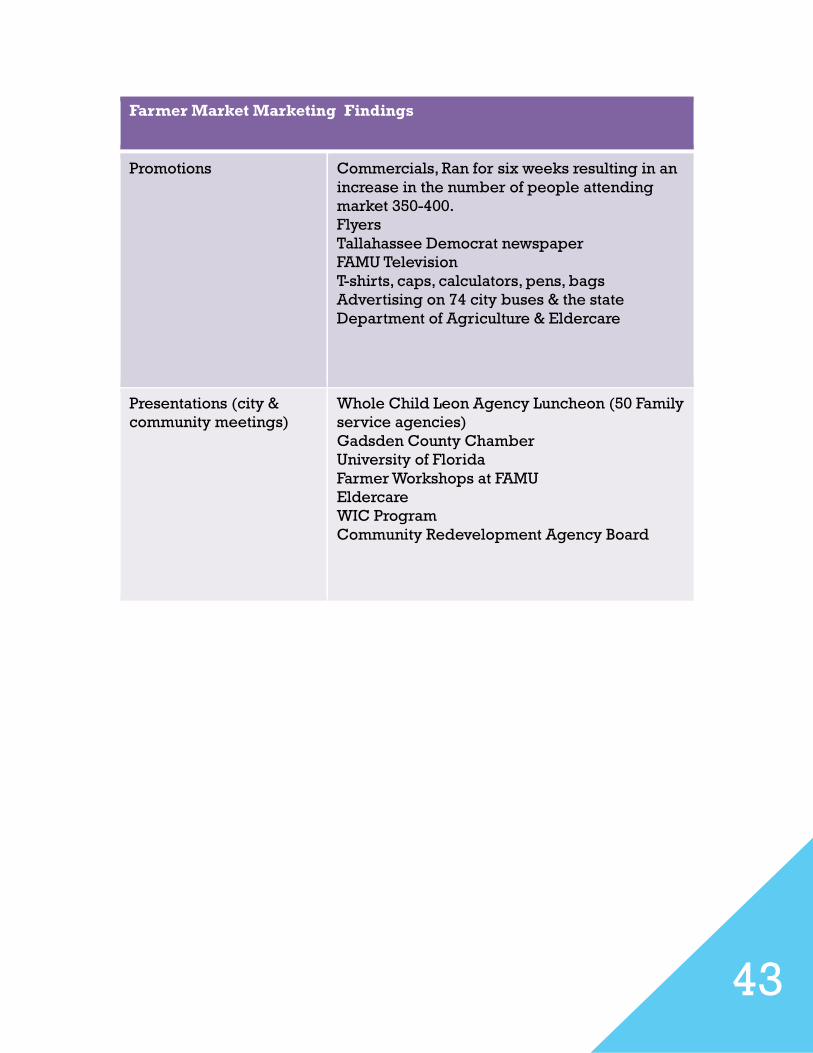
Farmer Market Marketing Findings
Promotions Commercials, Ran for six weeks resulting in an
increase in the number of people attending
market 350-400. Flyers Tallahassee Democrat newspaper FAMU Television T-shirts, caps, calculators, pens, bags Advertising on 74 city buses & the state
Department of Agriculture & Eldercare
Presentations (city & community meetings)
Whole Child Leon Agency Luncheon (50 Family
service agencies) Gadsden County Chamber University of Florida Farmer Workshops at FAMU Eldercare WIC Program Community Redevelopment Agency Board
44
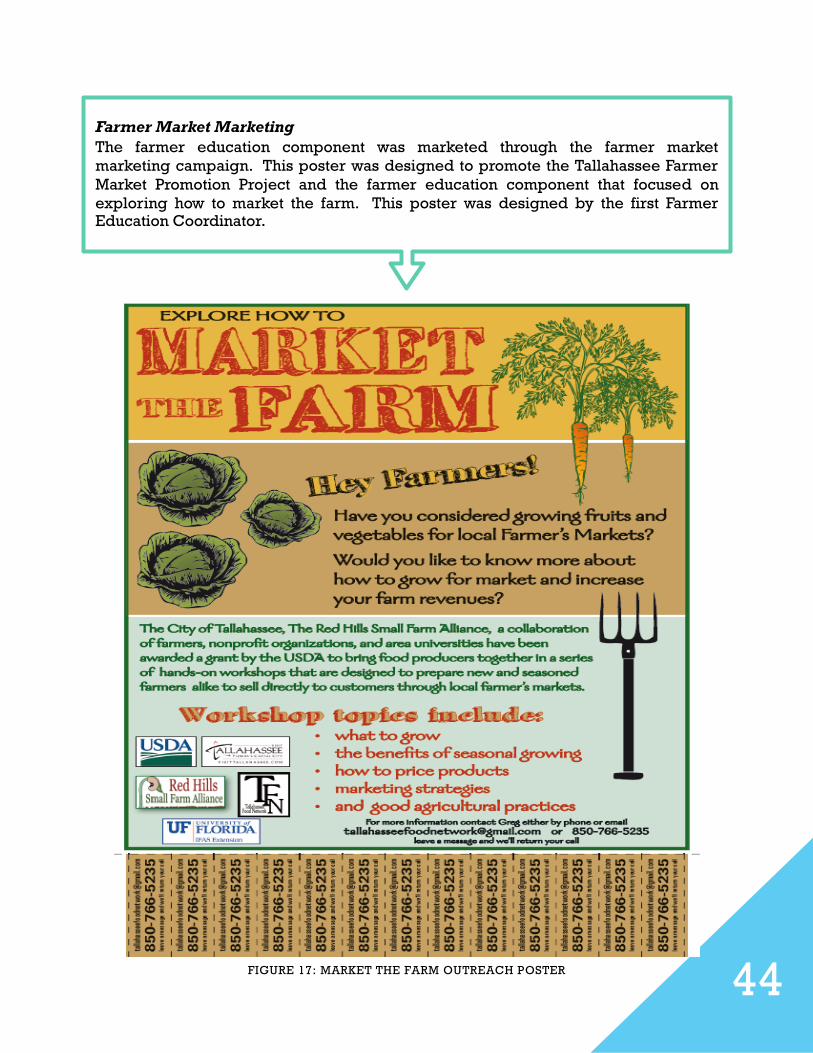
Farmer Market Marketing
The farmer education component was marketed through the farmer market
marketing campaign. This poster was designed to promote the Tallahassee Farmer
Market Promotion Project and the farmer education component that focused on
exploring how to market the farm. This poster was designed by the first Farmer Education Coordinator.
FIGURE 17: MARKET THE FARM OUTREACH POSTER
45
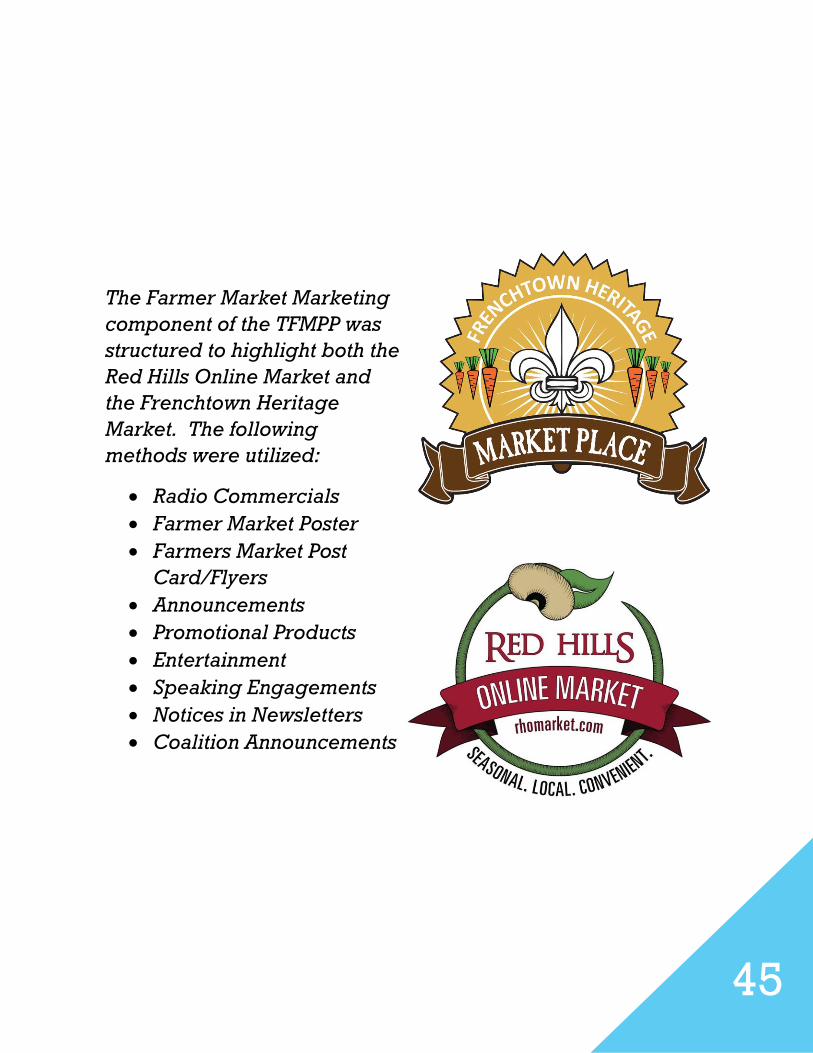
The Farmer Market Marketing
component of the TFMPP was
structured to highlight both the
Red Hills Online Market and
the Frenchtown Heritage
Market. The following
methods were utilized:
Radio Commercials
Farmer Market Poster
Farmers Market Post
Card/Flyers
Announcements
Promotional Products
Entertainment
Speaking Engagements
Notices in Newsletters
Coalition Announcements
46
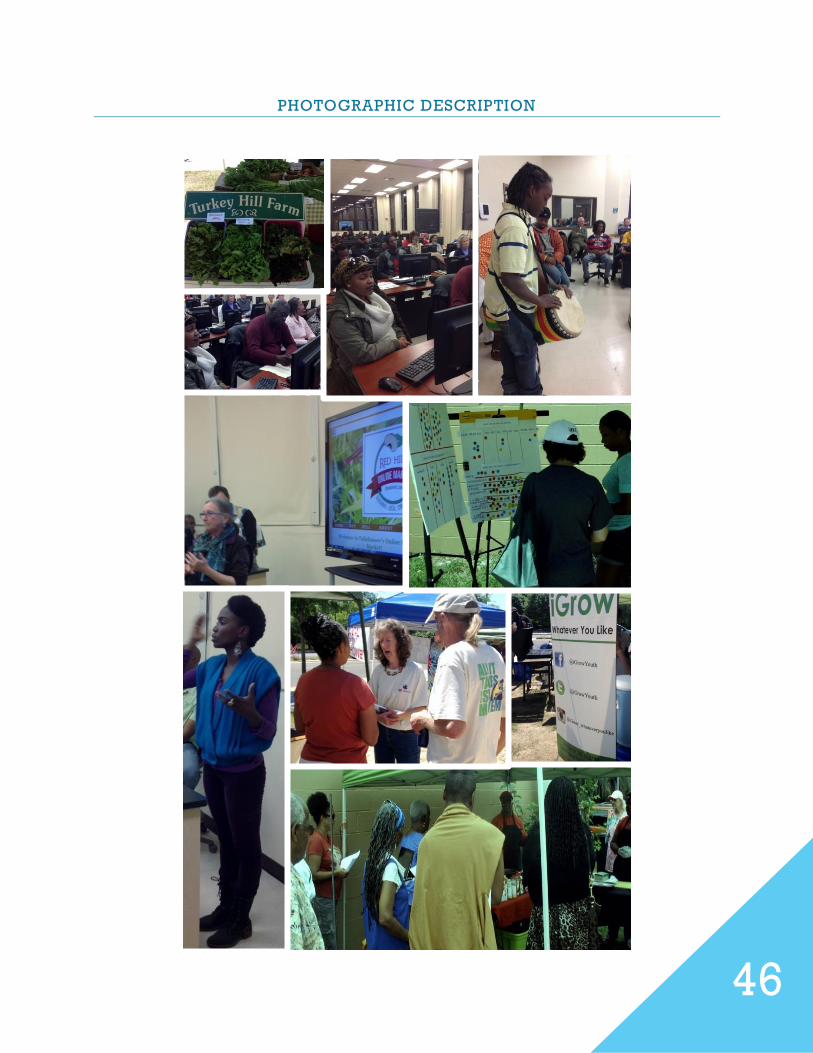
PHOTOGRAPHIC DESCRIPTION
47
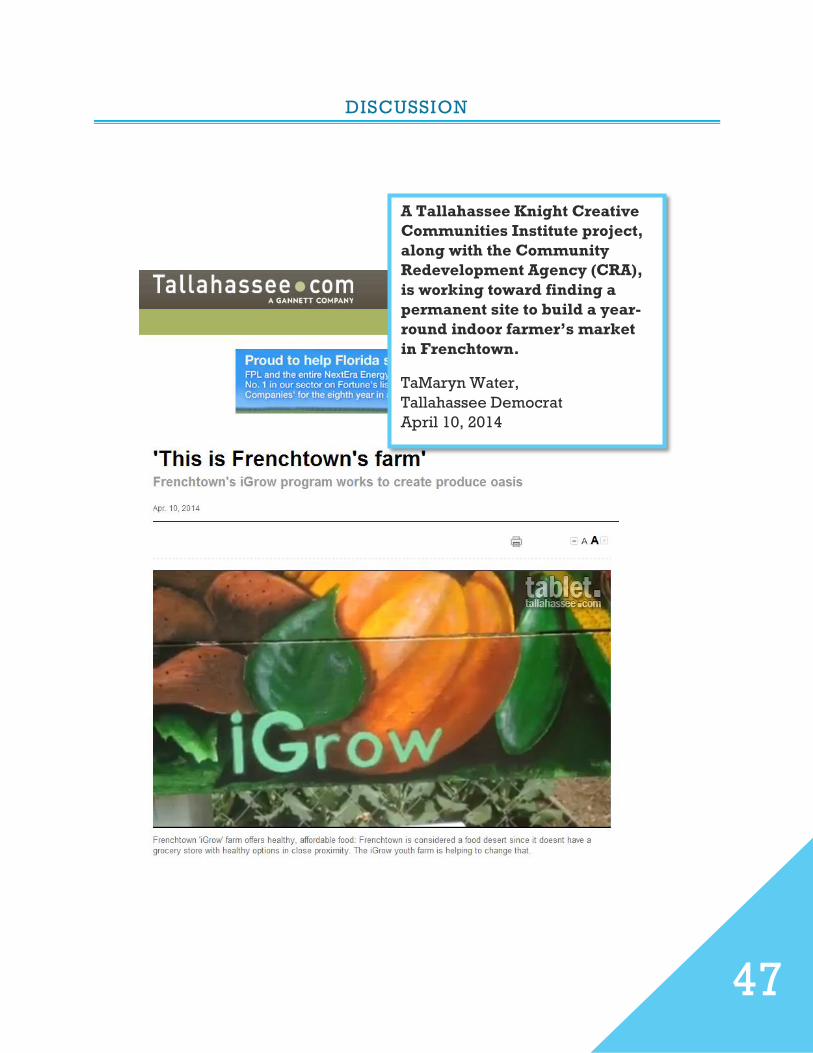
DISCUSSION
A Tallahassee Knight Creative
Communities Institute project,
along with the Community
Redevelopment Agency (CRA),
is working toward finding a
permanent site to build a year-
round indoor farmer’s market
in Frenchtown.
TaMaryn Water,
Tallahassee Democrat
April 10, 2014
48
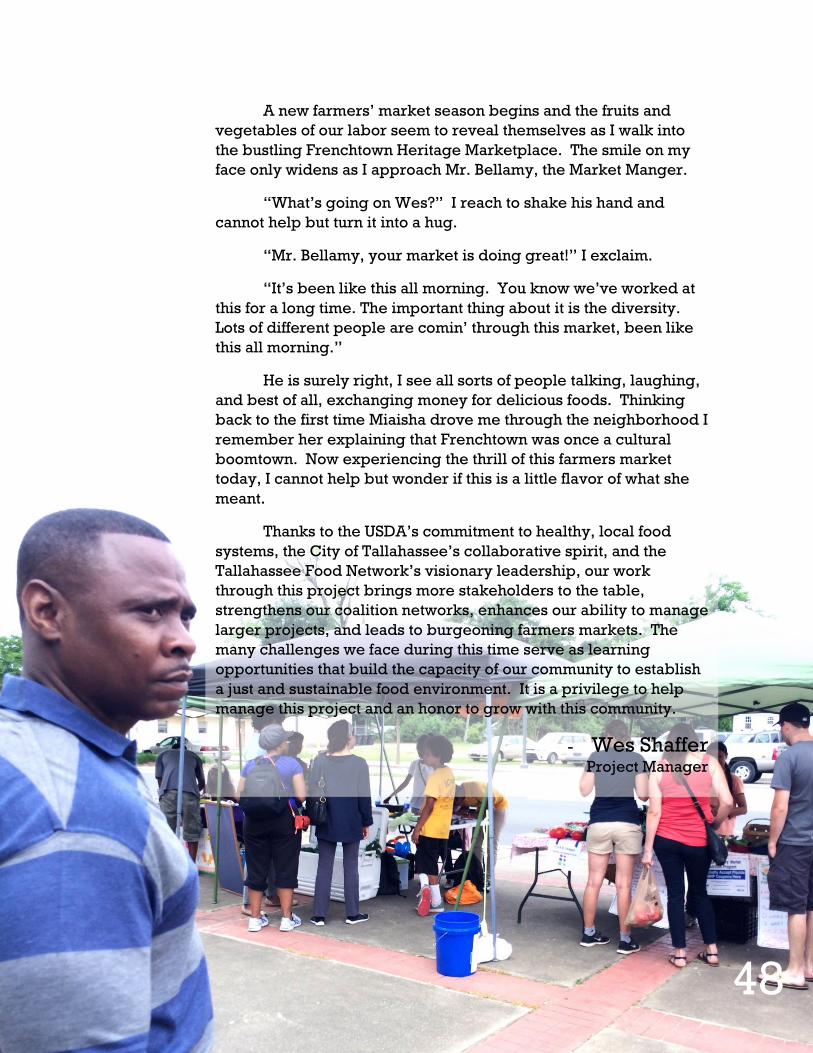
A new farmers’ market season begins and the fruits and
vegetables of our labor seem to reveal themselves as I walk into
the bustling Frenchtown Heritage Marketplace. The smile on my
face only widens as I approach Mr. Bellamy, the Market Manger.
“What’s going on Wes?” I reach to shake his hand and
cannot help but turn it into a hug.
“Mr. Bellamy, your market is doing great!” I exclaim.
“It’s been like this all morning. You know we’ve worked at
this for a long time. The important thing about it is the diversity.
Lots of different people are comin’ through this market, been like
this all morning.”
He is surely right, I see all sorts of people talking, laughing,
and best of all, exchanging money for delicious foods. Thinking
back to the first time Miaisha drove me through the neighborhood I
remember her explaining that Frenchtown was once a cultural
boomtown. Now experiencing the thrill of this farmers market
today, I cannot help but wonder if this is a little flavor of what she
meant.
Thanks to the USDA’s commitment to healthy, local food
systems, the City of Tallahassee’s collaborative spirit, and the
Tallahassee Food Network’s visionary leadership, our work
through this project brings more stakeholders to the table,
strengthens our coalition networks, enhances our ability to manage
larger projects, and leads to burgeoning farmers markets. The
many challenges we face during this time serve as learning
opportunities that build the capacity of our community to establish
a just and sustainable food environment. It is a privilege to help
manage this project and an honor to grow with this community.
- Wes Shaffer Project Manager
48
49
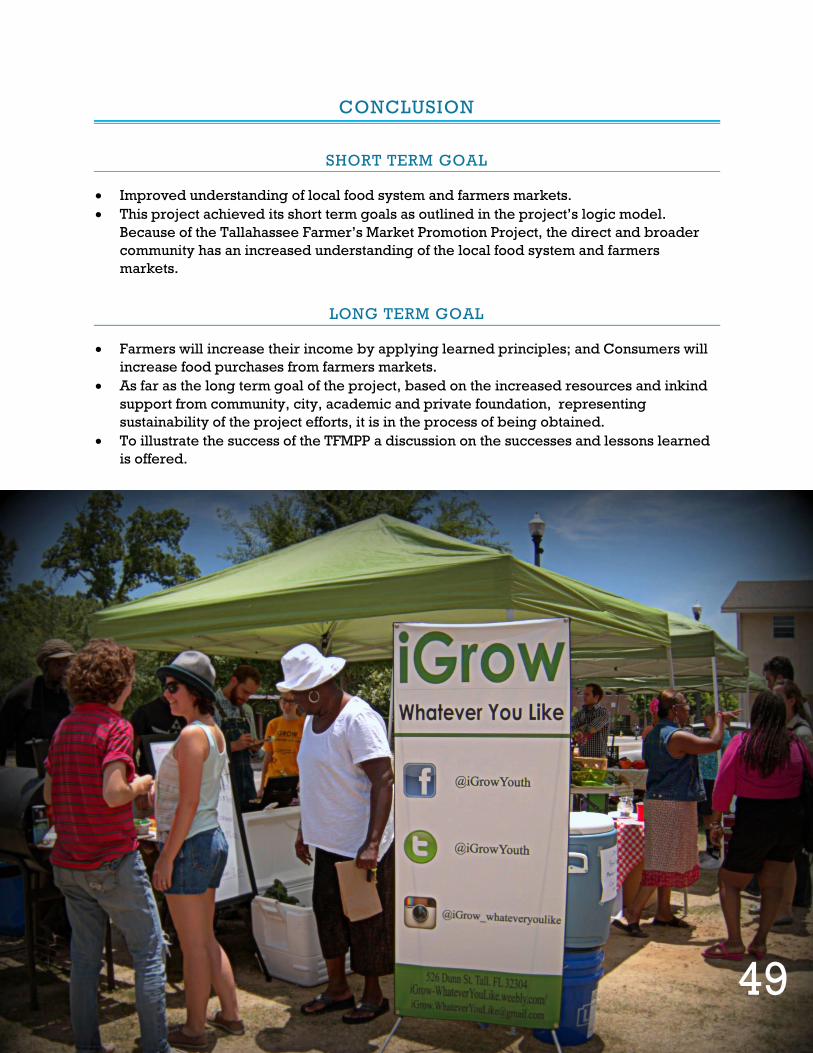
CONCLUSION
SHORT TERM GOAL
Improved understanding of local food system and farmers markets.
This project achieved its short term goals as outlined in the project’s logic model.
Because of the Tallahassee Farmer’s Market Promotion Project, the direct and broader
community has an increased understanding of the local food system and farmers
markets.
LONG TERM GOAL
Farmers will increase their income by applying learned principles; and Consumers will
increase food purchases from farmers markets.
As far as the long term goal of the project, based on the increased resources and inkind
support from community, city, academic and private foundation, representing
sustainability of the project efforts, it is in the process of being obtained.
To illustrate the success of the TFMPP a discussion on the successes and lessons learned
is offered.
49
50
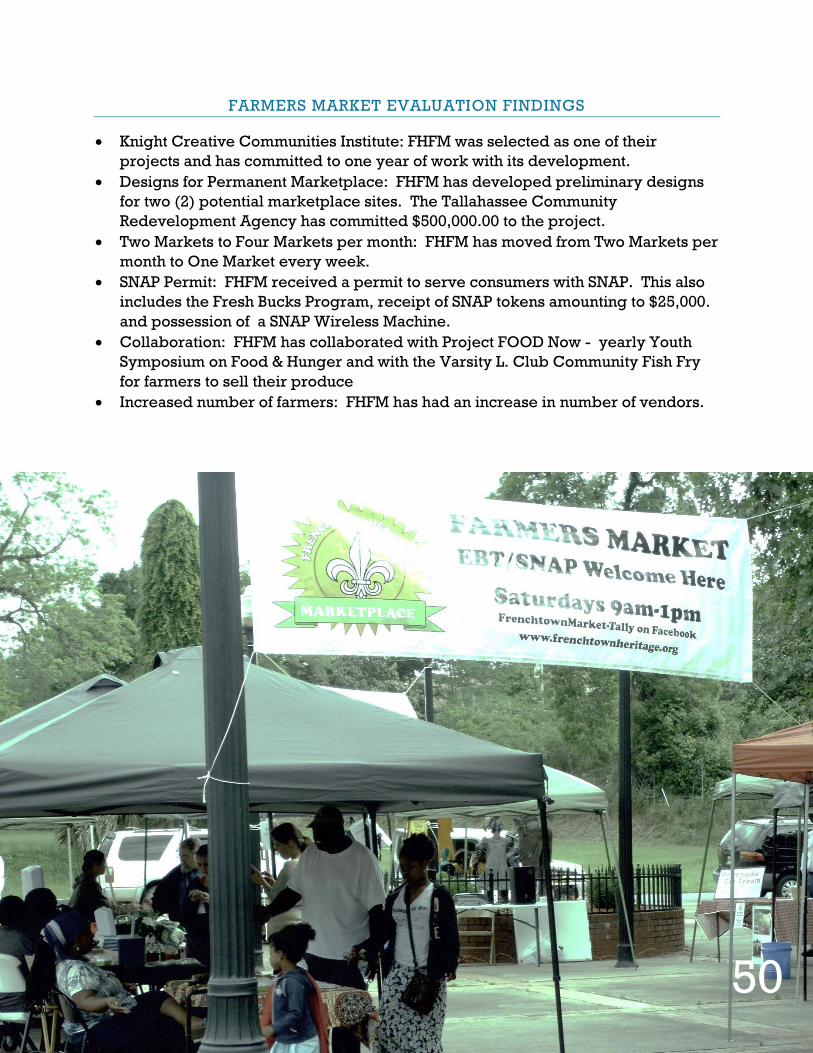
FARMERS MARKET EVALUATION FINDINGS
Knight Creative Communities Institute: FHFM was selected as one of their
projects and has committed to one year of work with its development.
Designs for Permanent Marketplace: FHFM has developed preliminary designs
for two (2) potential marketplace sites. The Tallahassee Community
Redevelopment Agency has committed $500,000.00 to the project.
Two Markets to Four Markets per month: FHFM has moved from Two Markets per
month to One Market every week.
SNAP Permit: FHFM received a permit to serve consumers with SNAP. This also
includes the Fresh Bucks Program, receipt of SNAP tokens amounting to $25,000.
and possession of a SNAP Wireless Machine.
Collaboration: FHFM has collaborated with Project FOOD Now - yearly Youth
Symposium on Food & Hunger and with the Varsity L. Club Community Fish Fry
for farmers to sell their produce
Increased number of farmers: FHFM has had an increase in number of vendors.
50

51
SUCCESSES
Strengthen & Increased Partnerships: Existing partnerships were useful in achieving the goals of this project. Additional partnerships were developed which will be useful in sustaining
these efforts.
Strengthened
Collaboration: Similar to
partnerships, many
collaborations were
strengthened and developed
as a result of this project.
They include the farm to
school project, the local
Childhood Obesity
Prevention Education
Coalition and most of all the
additional growers who were
engaged and inspired during this project.
Educated & Engaged Consumers: The Education process occurred and workshop and attendance numbers were achieved
Increased Experience
with the Civic Process:
The City of Tallahassee
was one of our partners
in this project. The
cultural characteristics
are unique. We gained
great experience and
insights which will be useful for years to come.
Educated & Engaged
Consumers
Educated & Engaged
Farmers
Strengthened Partnerships
Strengthened & Increased
Collaboration
Increased Experience with
Civic Process
52
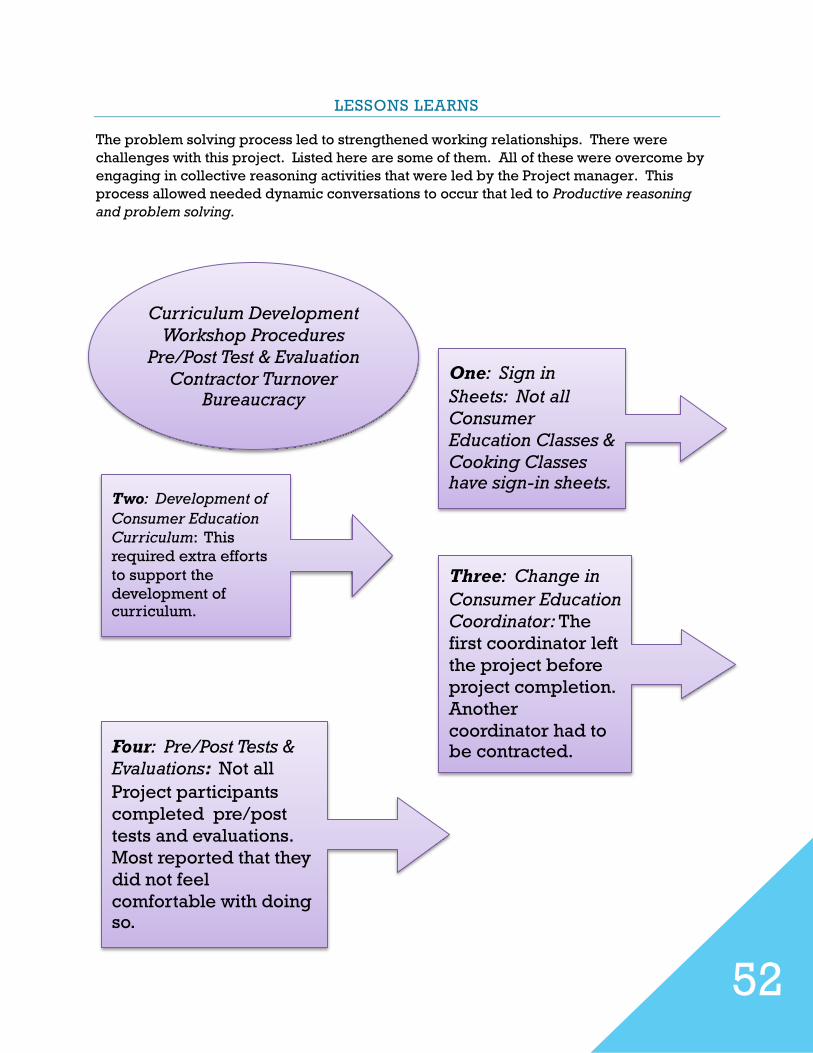
LESSONS LEARNS
The problem solving process led to strengthened working relationships. There were
challenges with this project. Listed here are some of them. All of these were overcome by
engaging in collective reasoning activities that were led by the Project manager. This
process allowed needed dynamic conversations to occur that led to Productive reasoning
and problem solving.
Curriculum Development
Workshop Procedures
Pre/Post Test & Evaluation
Contractor Turnover Bureaucracy
Two: Development of
Consumer Education
Curriculum: This
required extra efforts
to support the
development of curriculum.
Three: Change in
Consumer Education
Coordinator: The
first coordinator left
the project before
project completion.
Another
coordinator had to be contracted.
One: Sign in
Sheets: Not all
Consumer
Education Classes &
Cooking Classes have sign-in sheets.
Four: Pre/Post Tests &
Evaluations: Not all
Project participants
completed pre/post
tests and evaluations.
Most reported that they
did not feel
comfortable with doing so.

53
REFERENCES
Extension's Role with Farmers' Markets: Working with Farmers, Consumers, and
Communities, 1999, October 1999 // Volume 37 // Number 5 // Feature Articles //
5FEA4 Jennifer Abel, Joan Thompson, Audrey Maretzki) by Extension Journal, Inc.
ISSN 1077-5315. http://www.joe.org/joe/1999october/a4.php

54
APPENDICES
55
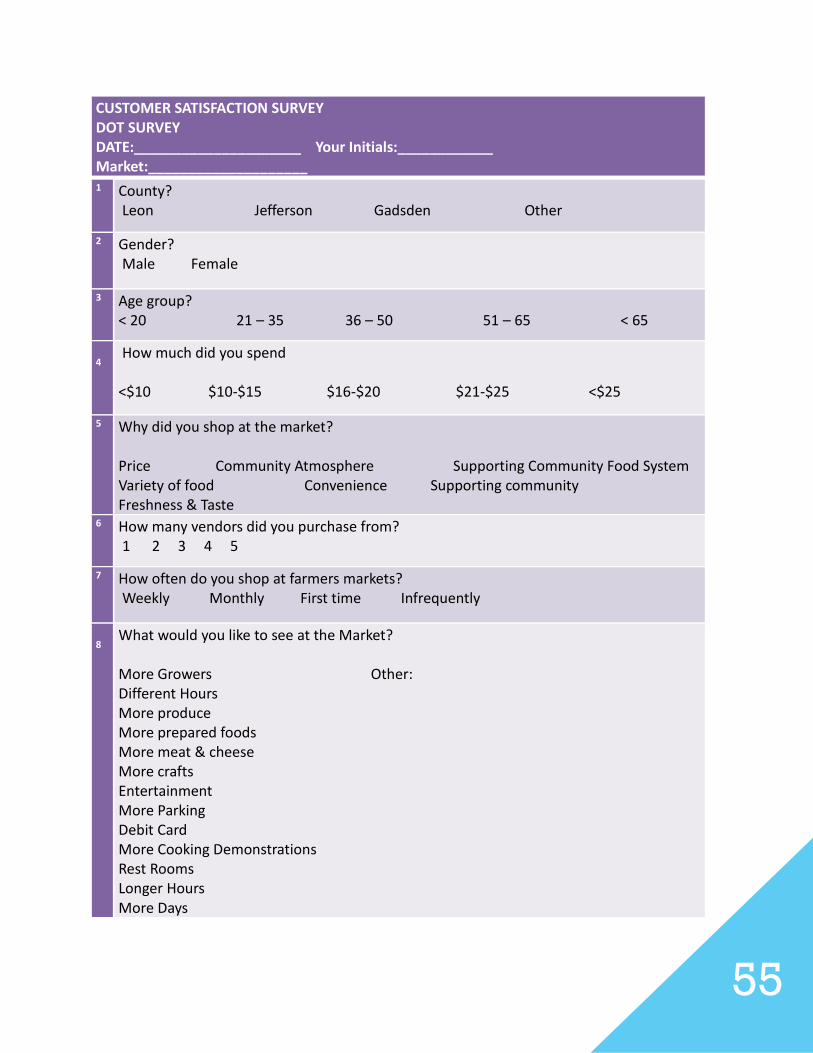
CUSTOMER SATISFACTION SURVEY DOT SURVEY DATE:_____________________ Your Initials:____________ Market:____________________ 1 County?
Leon Jefferson Gadsden Other
2 Gender? Male Female
3 Age group? < 20 21 – 35 36 – 50 51 – 65 < 65
4 How much did you spend
<$10 $10-$15 $16-$20 $21-$25 <$25
5 Why did you shop at the market? Price Community Atmosphere Supporting Community Food System Variety of food Convenience Supporting community Freshness & Taste
6 How many vendors did you purchase from? 1 2 3 4 5
7 How often do you shop at farmers markets? Weekly Monthly First time Infrequently
8 What would you like to see at the Market?
More Growers Other: Different Hours More produce More prepared foods More meat & cheese More crafts Entertainment More Parking Debit Card More Cooking Demonstrations Rest Rooms Longer Hours More Days

CITY OF TALLAHASSEE AND TALLAHASSEE FOOD NETWORK
USDA’S FARMERS MARKET
PROMOTIONAL GRANT