Embed Size (px)
Citation preview
Aquaculture production and trade trends:
carp, tilapia and shrimp
Weimin Miao, FAO RAP
Email: [email protected]
FMM/RAS/298: Strengthening capacities, policies and national action plans on
prudent and responsible use of antimicrobials in fisheries Final Workshop
in cooperation with AVA Singapore and INFOFISH12-14 December, Concorde Hotel, Singapore

TREND OF CULTURED CARPS
2

Carp culture in the world
o Carp is the most important finfish species
group cultured worldwide;
o In 2015, global culture carp production
reached 28.8 million tonnes;
o Carp accounted for 37.5% of global
aquaculture production in 2015, highest
45.8% in 1997;
o Accounted for 25.6% of total value of
cultured animals in 2015, 29.5% in 1996
o 92 countries or regions reported cultured
carp production to FAO in 2015
Country
Production
(1000 t)
China 21,053
India 3,902
Bangladesh 996
Myanmar 819
Indonesia 519
Viet Nam 411
Iran 184
Pakistan 148
Russian 104
Egypt 95
Top 10 producers
3

Production of cultured carps
0
5000000
10000000
15000000
20000000
25000000
30000000
1995
1996
1997
1998
1999
2000
2001
2002
2003
2004
2005
2006
2007
2008
2009
2010
2011
2012
2013
2014
2015
• Average production growth between 1996-2015: 5.3%
• The production growth fluctuated between 2.1-8.9%
throughout 1997-2015;
4
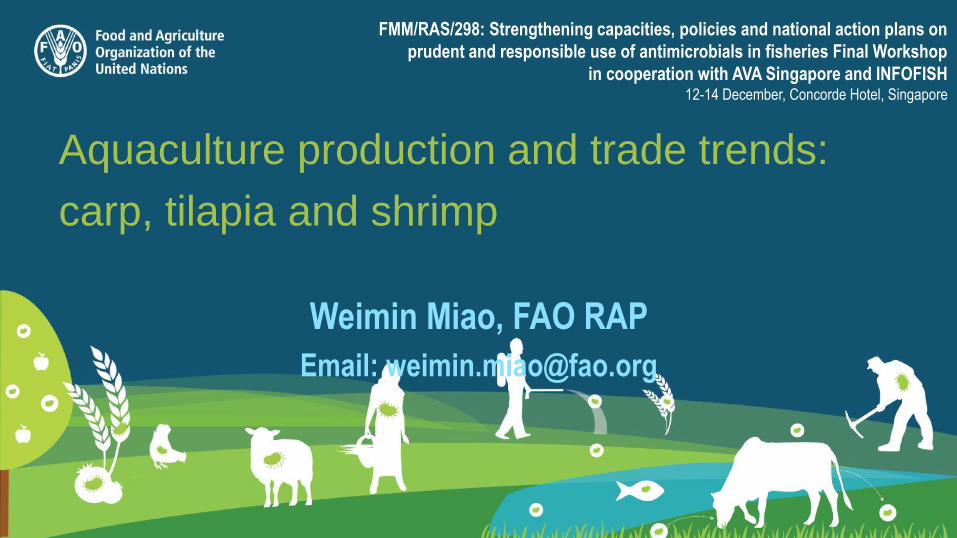
Carp production by species: 29 species with production over
100 tonnes in 2015
5822868.66
5125461.1
4328083.1
3402869.85
2913159.7
2764944.14
1785900.09796830
596240.08 467604.51Chart Title
Grass carp(=White amur) Silver carp Common carp Bighead carp
[Carassius spp] Catla Roho labeo Wuchang bream
Black carp Mrigal carp
5

PRODUCTION TREND OF CULTURED TILAPIA
6

Tilapia culture in the world
o Tilapia is most popularly culture fish in the
world, 126 countries or regions reported
cultured carp production to FAO in 2015
o Tilapia is the 2nd important finfish species group
cultured worldwide in terms of production;
o In 2015, global culture tilapia production
reached 5.7 million tonnes;
o Tilapia accounted for 7.4% of global aquaculture
production in 2015 (2.89% in 1995)
o Accounted for 5.6% of total value of cultured
animals in 2015, 2.5% in 1995
Country/regionProduction
(1000 tonnes)
China 1,779.5
Indonesia 1,120.4
Egypt 875.5
Bangladesh 324.3
Viet Nam 283.0
Philippines 261.2
Brazil 219.4
Thailand 177.6
Taiwan PoC 70.5
Colombia 61.1
Top 10 producers
7

Cultured tilapia production by species in 2015
3930579.14
1243781.42
445002
37805.01 37603272
32501880
Nile tilapia Tilapias nei Blue-Nile tilapia, hybrid
Mozambique tilapia Redbreast tilapia Three spotted tilapia
Blue tilapia Tilapia shiranus
8

Trend of cultured tilapia production
0
1000000
2000000
3000000
4000000
5000000
6000000 • Average production growth between 1996-2015: 11.1%;
• Recent growth (2013-2015) slowed down to 6.7-8.8%
9
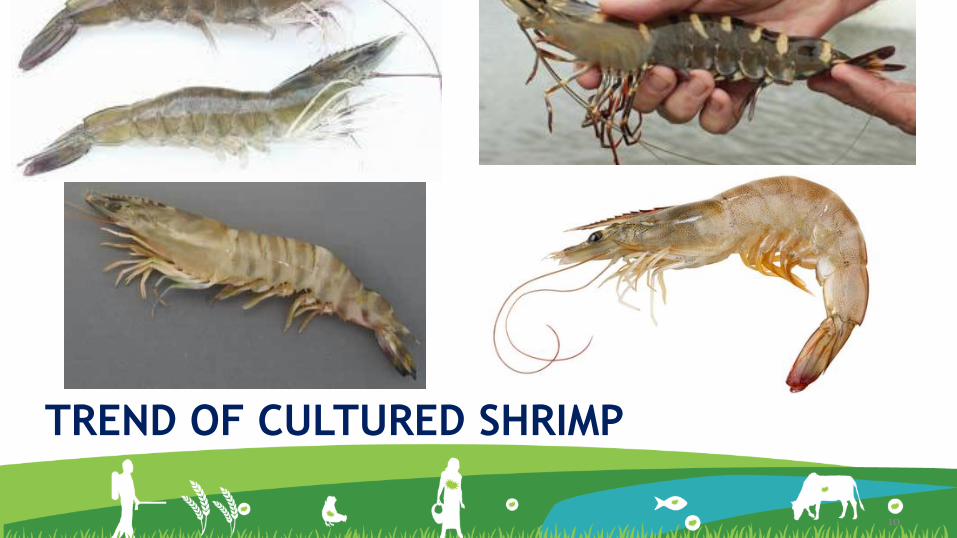
TREND OF CULTURED SHRIMP
10

Shrimp culture in the world
o Shrimp is the most important species group
cultured worldwide in terms international trade;
o 59 countries or regions reported cultured carp
production to FAO in 2015
o In 2015, global culture shrimp production
reached 4.9 million tonnes;
o Shrimp accounted for 6.4% of global
aquaculture production in 2015; rapid increase
(3.5-6.7%) between 2000-2006
o 15.8% of total value of cultured aquatic
animals in 2015 (2nd); remained same in last
20 years, reduced comparative price;
Country Production
China 1,892,801
Indonesia 595,071
Viet Nam 550,240
India 500,758
Ecuador 403,000
Thailand 294,896
Mexico 130,361
Bangladesh 84,024
Brazil 69,860
Philippines 60,875
Top 10 producers
11

Cultured shrimp production by species in 2015
12

Trend of cultured shrimp production
• Average production growth between 1996-2015: 9%;
• Rapid growth between 2000-2006: 17.3%
13

Global shrimp trade
Over 50% of cultured
production (captured
included)
14

Global trade of carps
15

Global trade of Tilapia
Less than 10% of the total
production
16

Future prospect of carp, shrimp, tilapia culture
o Carp production is likely to maintained or keep slow growth:
• Bulk fish supply for many Asian countries-staple fish for domestic, low production cost
• Limited international market (consumer preference)
• Not so adapted to changing life style of people (smaller family, quick life pace)
o Tilapia production will continue to grow at fast rate:
• Short production period and easy culture techniques; relatively low cost)
• good international market
• More adapted to changing lifestyle (moderate size, no intramuscular bones, etc.)
o Shrimp production will continue to grow fast:
• Improving living stand will increase the demand for high valued species;
• Marine catch of wild shrimp is reducing due to overfishing, environmental degradation and
CC impact;
• Good international and intraregional market-- Convenience in consumption
17

THANK YOU FOR ATTENTION!
18

![Detection of Off-Flavor in Catfish Using a Conducting ... · freshwater fish species including Hypophthalmichthys molitrix (silver carp) [34], Oreochromis niloticus (tilapia) [35],](https://img.pdfslide.us/doc/110x75/60aaa1c358366f75ca0bc0f2/detection-of-off-flavor-in-catfish-using-a-conducting-freshwater-fish-species.jpg)