Embed Size (px)
Citation preview
[PUBLIC] 1
FM Insurance Europe S.A.
Solvency and Financial Condition Report
31 December 2018
[PUBLIC] 2
Table of Contents .................................................................................................................................... 2
Summary ................................................................................................................................................. 4
Directors’ Report ..................................................................................................................................... 6
A. Business and Performance .............................................................................................................. 7
Business ................................................................................................................................... 7
Underwriting Performance ..................................................................................................... 8
Investment Performance ...................................................................................................... 11
Performance of Other Activities ........................................................................................... 12
Any Other Information .......................................................................................................... 12
B. System of Governance .................................................................................................................. 12
General Information ............................................................................................................. 12
Fit and Proper Requirements ................................................................................................ 14
Risk Management System ..................................................................................................... 15
Internal Control System ........................................................................................................ 17
Internal Audit Function ......................................................................................................... 20
Actuarial Function ................................................................................................................. 21
Outsourcing ........................................................................................................................... 23
Any Other Information .......................................................................................................... 23
C. Risk Profile ..................................................................................................................................... 23
Underwriting Risk .................................................................................................................. 23
Market Risk ........................................................................................................................... 24
Credit Risk ............................................................................................................................. 25
Liquidity Risk ......................................................................................................................... 26
Operational Risk .................................................................................................................... 26
Other Material Risks ............................................................................................................. 26
Any Other Information .......................................................................................................... 27
D. Valuation for Solvency Purposes .................................................................................................. 29
Assets .................................................................................................................................... 29
Technical Provisions .............................................................................................................. 31
Other Liabilities ..................................................................................................................... 33
Alternative Methods for Valuation ....................................................................................... 34
Any Other Information .......................................................................................................... 34
E. Capital Management ..................................................................................................................... 35
Own Funds ............................................................................................................................ 35

[PUBLIC] 3
SCR and MCR ......................................................................................................................... 36
Duration-Based Equity Risk Sub-Module .............................................................................. 37
Differences between SF and Any Internal Model Used ........................................................ 37
SCR and MCR Non-Compliance ............................................................................................. 37
Any Other Information .......................................................................................................... 37
Appendices ............................................................................................................................................ 38
Glossary ............................................................................................................................................. 38
Contact Information .......................................................................................................................... 40
Reporting Templates ......................................................................................................................... 41
[PUBLIC] 4
Current Year Performance FM Insurance Europe S.A. (“FMIE” and the “Company”) was incorporated on 9 December 2016 as a public limited liability company (“Société Anonyme”). On 17 May 2017, the Commissariat aux Assurances (“CAA” and the “Regulator) granted the Company an insurance license. FMIE has received authorisation from the CAA to establish insurance activities headquartered in the Grand Duchy of Luxembourg and to underwrite policies throughout the European Economic Area (EEA) via branches which have been established in Belgium, France, Germany, Italy, The Netherlands, Spain and Sweden. The Company plans to open a new branch in Switzerland during 2019. FMIE is a wholly owned subsidiary of Factory Mutual Insurance Company (“FMIC” or the “parent company”), a company under the laws of the State of Rhode Island, United States of America. As from 1 January 2018, the Company started to write insurance business within the EEA, excluding the United Kingdom, on a renewal basis. The insurance business was previously written by FM Insurance Company Limited (“FMI”). The 2018 gross written premium for the year is €655m (2017: nil). As at 31 December 2018, the net loss ratio was 89.1% and the expense ratio was 35.9%. The loss ratio position is primarily attributable to a large number of small loss events incurred during the year. The loss and expense ratio are significantly affected by the low level of net earned premium as at 31 December 2018, which is due to the first year of insurance activity. The Company also realised gains on investments amounting to €1.9m, unrealised losses amounting to €2.8m and investment income amounting to €5m. The foreign exchange gains resulting from the translation to Euro of US Dollar investments amounted to €8.8m. The loss for the year described in the profit and loss of the 2018 financial statements (“LuxGAAP financial statements”) is due to losses incurred during the year, in addition to the operating expenses and tax provisions. The loss resulted in a decrease in capital and reserves of €24.1m as at 31 December 2018.
2018 Solvency and Financial Condition A risk appetite framework is in place which highlights the key risks to FMIE and provides a way of monitoring the tolerances and limits on a regular basis. The Risk Management Committee (“RMC”) regularly reviews the status of this framework and is responsible for putting into place action plans as required. The framework is used to determine the key risk areas that are required to be incorporated in the capital modelling. The results are fed back into the framework to verify the limits and tolerances remain appropriate. The main risk areas which affect FMIE are:
• Underwriting risk due to the nature of the business; and
• Market risk due to the level of cash held in USD.
Additional risk categories included in the solvency calculation are credit risk and operational risk. Group risk is not included as a separate element of the solvency calculation as the failure of FMIE’s parent, FMIC, does not fall within the 99.5% confidence level. The “AA” Fitch rating, “A+” AM Best rating and “A+” Standard & Poor’s rating of FMIC indicate that the likelihood of default is significantly more than the one in 200-year scenario considered for the solvency calculation. However, it is still included on FMIE’s risk register and monitored regularly by FMIE’s senior management and Board.

[PUBLIC] 5
Capital Management The capital modelling process for FMIE in 2018 included the standard formula (“SF”) calculation and an internal calculation used for the Own Risk and Solvency Assessment (“ORSA”). A summary of the SF model including the capital requirement and solvency coverage is reflected in the table below:
2018 SF
€000s
2017 SF
€000s
Variance
Eligible own funds 208,499 230,481 (21,982) Solvency capital requirement 148,531 84,956 63,575 Surplus 59,968 145,525 (85,558)
Coverage of SCR 140.4% 271.1% (130.9%)
A more detailed breakdown of the capital modelling results, by risk type, are detailed later in this report. The increase in the SCR is driven by several factors; an increase in the underwriting risk as a result of the business written in 2018, while in 2017 the underwriting risk was mainly driven by “Bound But Not Incepted” business (BBNI) and an increase in the market risk due to the inception of the investment portfolio in 2018 and diversification of currencies. The method of calculation for the SF is set out in the Commission Delegated Regulations (Delegated Acts) which are made by the European Commission and there is no ability to adjust the core calculation, except for simplification options in the calculation of the risk margin. Due to this prescription, FMIE is unable to fully incorporate into the SF the total benefit of the stop loss treaty with FMIC. It is applied only within the catastrophe risk calculations, as mitigating reinsurance. The capital charge therefore understates the benefit the stop loss treaty would provide to FMIE in a volatile calendar year. Management understand the solvency capital requirement (“SCR”) calculated using the SF is conservative but agree it is appropriate. FMIE continues to have adequate capital coverage in respect of the SCR despite this significant conservatism. All balances used within this report are determined according to the valuation rules set out in the Delegated Acts. The key inputs and parameters for the calculations have been reviewed and agreed by the RMC. All risks on the risk register have been reviewed, included in the risk assessment and, where necessary, added to the modelling process. Emerging risks are considered at every RMC and discussed at Board meetings, as appropriate. Any emerging risk arising during the year that were deemed to be significant have been included in the capital modelling. Sensitivity tests and stress and scenario testing have been performed and overseen by the RMC on both the ORSA and SF models, to ensure FMIE continues to hold sufficient capital and to ensure management and the Board are aware of the key drivers and sensitivities of the capital models.
Outlook for 2019 FMIE will continue to consolidate and grow throughout the mainland EEA and Ireland. The Company’s exposure to the Eurozone is limited to Euro currency holdings as the Company does not hold any Euro denominated debt securities. Furthermore, it is the Company’s policy to convert excess currency into US Dollars, the functional currency of the parent company.
[PUBLIC] 6
Directors The directors who held office during the year and to the date of this report were as follows:
Christopher Johnson Dirigeant Agréé Jonathan W. Hall Brett N. Ahnell
(Resigned July 2018) (Appointed December 2018)
Kevin S. Ingram Thomas A. Lawson David Pulman Colin Day
Statement of Directors’ Responsibilities The Directors are responsible for preparing the SFCR in accordance with the Commissariat aux Assurances regulations and Delegated Acts. The Article 86 of the Insurance Law of 7 December 2015 on the insurance sector requires that the Company must have in place a written policy ensuring the ongoing appropriateness of any information disclosed and that the Company must ensure that its SFCR is subject to approval by the Directors. Each of the Directors, whose names are listed on the Luxembourg Business Register, confirm that, to the best of their knowledge:
(a) Throughout the financial year in question, the Company has complied in all material respects
with the requirements of the CAA regulations and Delegated Acts as applicable; and
(b) It is reasonable to believe that, at the date of the publication of the SFCR, the Company
continues to comply, and will continue to comply in future.
On behalf of the board Christopher Johnson Dirigeant Agréé 19 April 2019
[PUBLIC] 7
Business FMIE was incorporated on 9 December 2016 and is organised under the “Commercial Companies” laws of the Grand Duchy of Luxembourg, as a public limited liability company (Société Anonyme) and is a wholly owned subsidiary of FMIC. The Company is authorised by the Commissariat aux Assurances to establish insurance activities headquartered in the Grand Duchy of Luxembourg and to underwrite policies throughout the European Economic Area (EEA) via branches established in Belgium, France, Germany, Italy, The Netherlands, Spain and Sweden and on a services basis in the remaining member states. FMIE started to underwrite policies, as from 1 January 2018, on a renewal basis. The Company did not open any new branches in 2018 but plans to open a branch in Switzerland during 2019.
The business model for FM Global (“FMG”), the trade name of the group of consolidated companies including FMIC, FMIE and FMI, is based on providing worldwide insurance coverage and FMIE plays a key role in this.
FMIE writes commercial property insurance for multinational companies in many jurisdictions. The international nature of the business gives a geographical diversification benefit and enables FMG to insure clients globally.
FMIE’s aim is to provide competitively priced insurance to multi-national companies based in the continental EEA region and Ireland. FMIE also aims to assist in servicing the needs of those clients headquartered throughout the world that have locations in Continental Europe and Ireland.
FMIE has acquired, from FMI, a stable book of business and there are no plans to expand into any new lines of business. However, the line of business will be disclosed at a more granular level for reporting and capital modeling purposes. The Company will provide insurance business using the FMG business model and the business is constantly looking to improve the service to its customer and thereby retain clients. As part of this, as clients move into new geographical locations in Continental Europe, FMIE will follow and explore new business locations as required.
The parent company, FMIC, is a mutual company which is owned by and accountable to its policyholders. This structure allows FMG to take a long-term strategic view, helping FMIE to absorb and withstand volatility in operating results and enabling FMG to provide clients with a large, stable insurance capacity.
The FMG strategy is based on a belief that the majority of property loss and associated business interruption is preventable through loss prevention and risk management solutions. Deploying loss prevention engineering, based on scientific research, is the basis for the belief that the majority of property loss is preventable and unites the mutual company and its policyholders. The business model replicates FMI’s model, which remained consistent since the incorporation of FMI in 1963.
FMIE is constantly assessing potential new markets in areas where currently there is no representation, and measuring the potential gain against the potential risk. Any new business is run on the same principles as the existing business with adjustments only to meet local requirements and cultural practices. As the business model is very successful for FMG the directors do not anticipate any changes.
Financial supervision of FMIE is performed by the CAA. Willis Towers Watson (“WTW”) is contracted to complete a back testing and validations audit on the technical provisions on an annual basis. Deloitte Tax & Consulting has been contracted to perform a review of the QRTs and the Actuarial report.
Contact details for these companies can be found in the Appendices.
[PUBLIC] 8
Underwriting Performance FMG is known as an insurer specialising in the highly protected risk (“HPR”) market and is the main underwriter of this business. Clients are typically made up of Global 1000 companies that utilize and value the bundled professional services consisting of professional property engineering expertise, experienced property underwriting teams, inspection and loss control services, training and research.
FMIE will provide its policyholders with all-risk policies providing fire and extended coverage, boiler and machinery, difference in conditions or any combination of these lines of coverage.
As noted above, the philosophy at FMIE is that the majority of loss is preventable and as a result employs engineers to inspect insured’s locations and work with them to minimize the risk of a loss occurring or, if it does, to minimize the impact to the insured. This partnership with the client is a key factor in the high retention of business year on year throughout FMG.
Each year the Company sets key result areas (“KRA”) used to measure performance and to form the basis of the employee incentive scheme. The KRA’s that the Company measures are:
• Combined Ratio;
• Premium Retention; and
• New Business.
Combined Ratio The combined ratio is calculated as the sum of the loss ratio (net losses incurred divided by net premiums earned) and expense ratio (net underwriting expenses incurred divided by net premium earned) for the period. Premium Retention The premium in force is the total annual premium on all policies that have not expired or been cancelled, excluding the effect of new business written during the year. New Business The new business premium is the total annual premium of new policies written during the year. Throughout the year management reports are measured against these KRA’s and reported to staff so all employees are aware of the progress of the Company in achieving its goals. As noted above, FMIE started to underwrite policies, as from 1 January 2018, on a renewal basis. During 2018 the Company recognised an underwriting loss, offset by a profitable investment return. The premium retention for the year was 100.7% and new business was 4.2%, indicating that FMIE remained strong in a challenging market.
[PUBLIC] 9
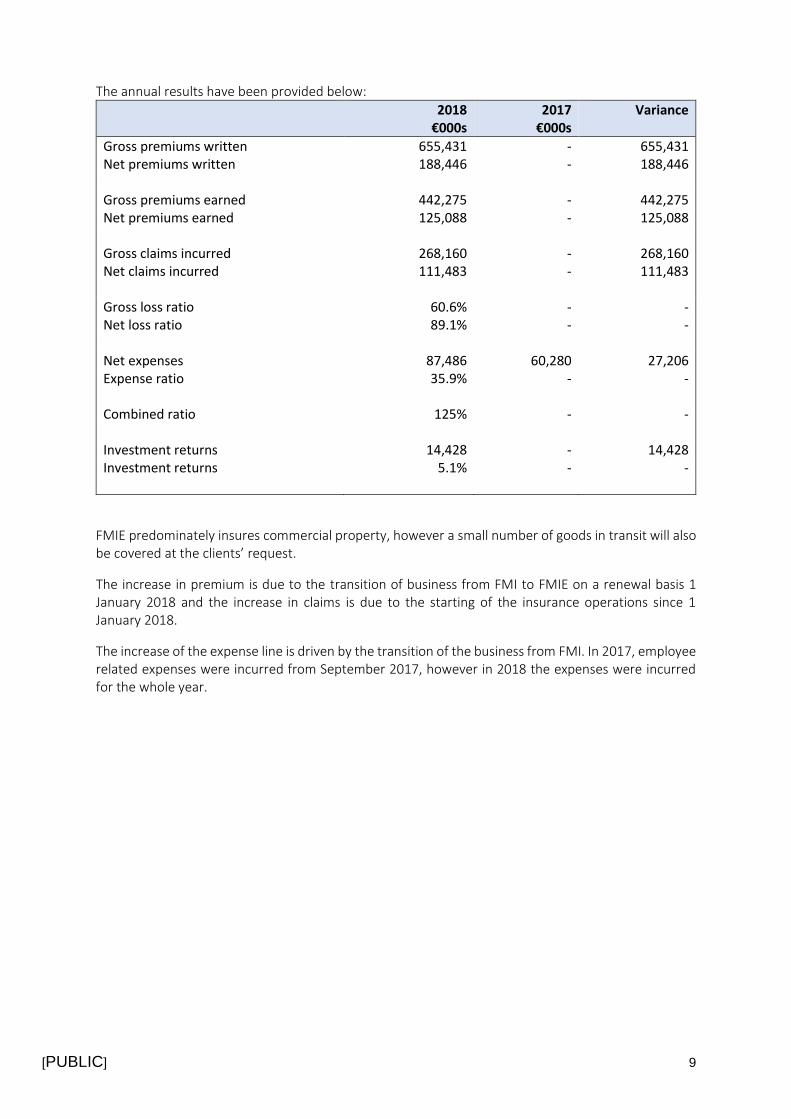
The annual results have been provided below:
2018 €000s
2017 €000s
Variance
Gross premiums written 655,431 - 655,431 Net premiums written 188,446 - 188,446 Gross premiums earned 442,275 - 442,275 Net premiums earned 125,088 - 125,088 Gross claims incurred 268,160 - 268,160 Net claims incurred 111,483 - 111,483 Gross loss ratio 60.6% - - Net loss ratio 89.1% - - Net expenses 87,486 60,280 27,206 Expense ratio 35.9% - - Combined ratio 125% - - Investment returns 14,428 - 14,428 Investment returns 5.1% - -
FMIE predominately insures commercial property, however a small number of goods in transit will also be covered at the clients’ request.
The increase in premium is due to the transition of business from FMI to FMIE on a renewal basis 1 January 2018 and the increase in claims is due to the starting of the insurance operations since 1 January 2018.
The increase of the expense line is driven by the transition of the business from FMI. In 2017, employee related expenses were incurred from September 2017, however in 2018 the expenses were incurred for the whole year.
[PUBLIC] 10
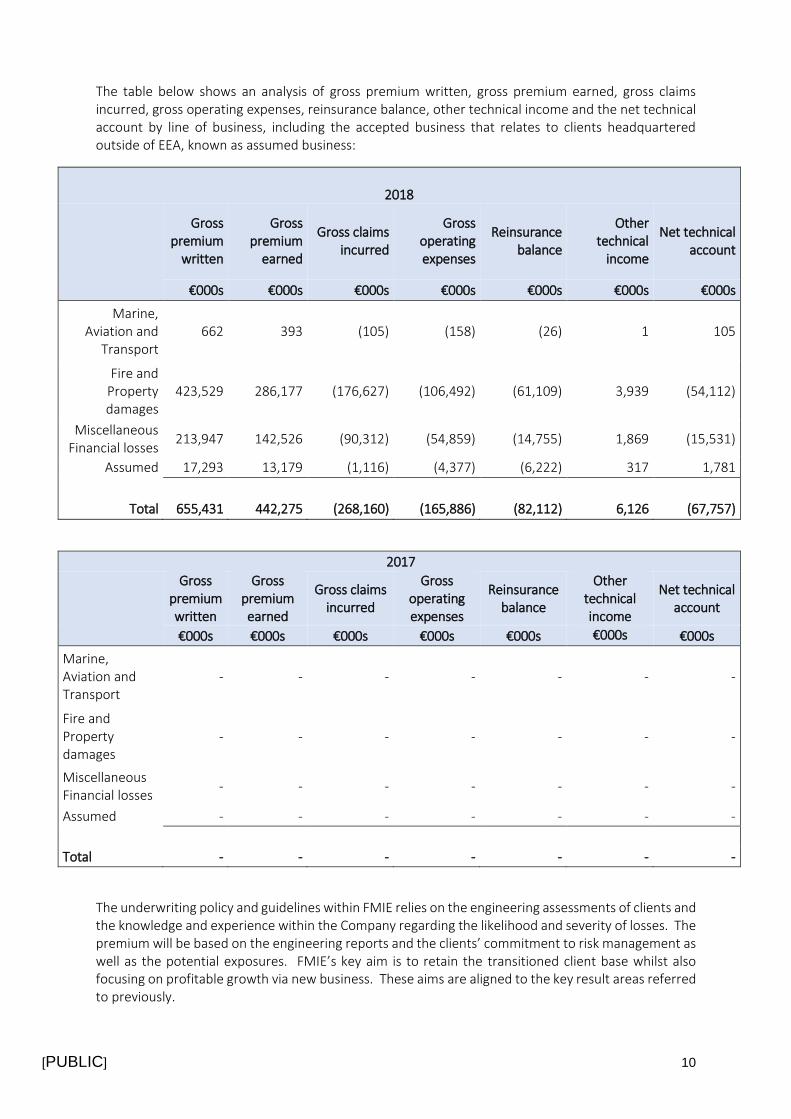
The table below shows an analysis of gross premium written, gross premium earned, gross claims incurred, gross operating expenses, reinsurance balance, other technical income and the net technical account by line of business, including the accepted business that relates to clients headquartered outside of EEA, known as assumed business:
2018
Gross premium
written
Gross premium
earned
Gross claims incurred
Gross operating expenses
Reinsurance balance
Other technical
income
Net technical account
€000s €000s €000s €000s €000s €000s €000s
Marine, Aviation and
Transport 662 393 (105) (158) (26)
1
105
Fire and Property damages
423,529 286,177 (176,627) (106,492) (61,109) 3,939 (54,112)
Miscellaneous Financial losses
213,947 142,526 (90,312) (54,859) (14,755) 1,869 (15,531)
Assumed 17,293 13,179 (1,116) (4,377) (6,222) 317 1,781
Total 655,431 442,275 (268,160) (165,886) (82,112) 6,126 (67,757)
2017
Gross premium written
Gross premium earned
Gross claims incurred
Gross operating expenses
Reinsurance balance
Other technical income
Net technical account
€000s €000s €000s €000s €000s €000s €000s
Marine, Aviation and Transport
- - - - - - -
Fire and Property damages
- - - - - - -
Miscellaneous Financial losses
- - - - - - -
Assumed - - - - - - -
Total - - - - - - -
The underwriting policy and guidelines within FMIE relies on the engineering assessments of clients and the knowledge and experience within the Company regarding the likelihood and severity of losses. The premium will be based on the engineering reports and the clients’ commitment to risk management as well as the potential exposures. FMIE’s key aim is to retain the transitioned client base whilst also focusing on profitable growth via new business. These aims are aligned to the key result areas referred to previously.
[PUBLIC] 11
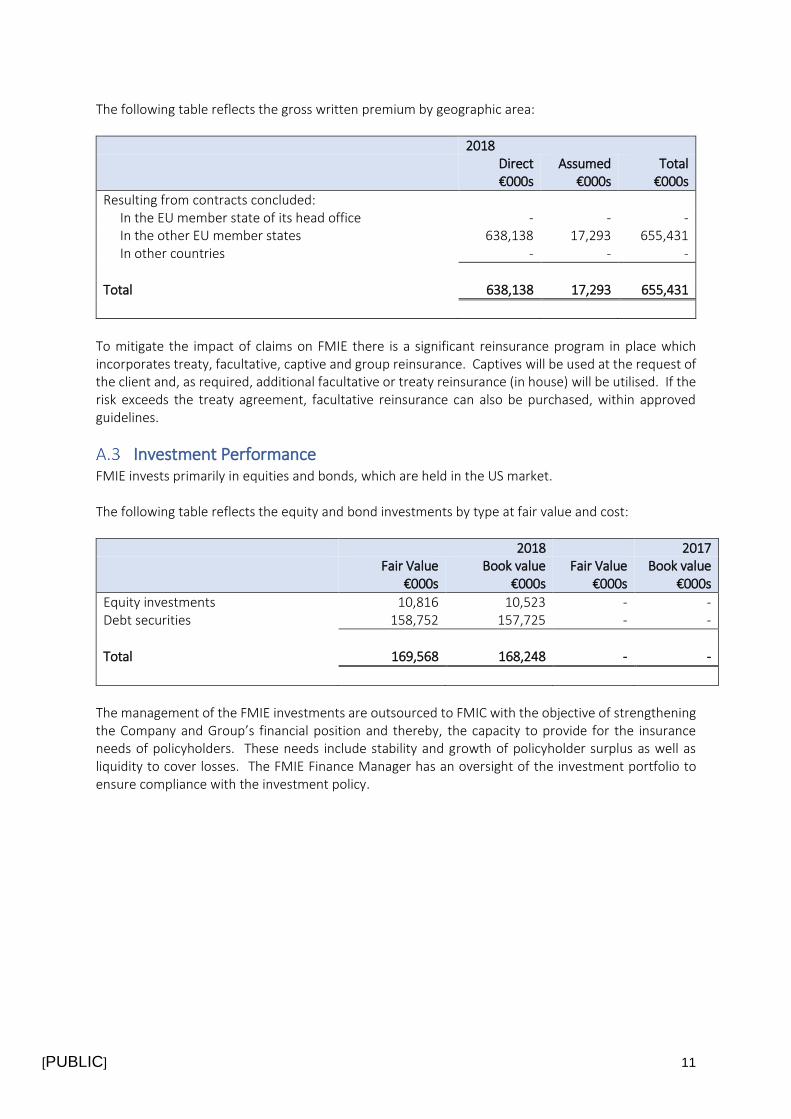
The following table reflects the gross written premium by geographic area:
2018
Direct €000s
Assumed €000s
Total €000s
Resulting from contracts concluded: In the EU member state of its head office - - - In the other EU member states 638,138 17,293 655,431 In other countries - - -
Total 638,138 17,293 655,431
To mitigate the impact of claims on FMIE there is a significant reinsurance program in place which incorporates treaty, facultative, captive and group reinsurance. Captives will be used at the request of the client and, as required, additional facultative or treaty reinsurance (in house) will be utilised. If the risk exceeds the treaty agreement, facultative reinsurance can also be purchased, within approved guidelines.
Investment Performance FMIE invests primarily in equities and bonds, which are held in the US market. The following table reflects the equity and bond investments by type at fair value and cost:
2018 2017 Fair Value
€000s Book value
€000s Fair Value
€000s Book value
€000s
Equity investments 10,816 10,523 - - Debt securities 158,752 157,725 - -
Total 169,568 168,248 - -
The management of the FMIE investments are outsourced to FMIC with the objective of strengthening the Company and Group’s financial position and thereby, the capacity to provide for the insurance needs of policyholders. These needs include stability and growth of policyholder surplus as well as liquidity to cover losses. The FMIE Finance Manager has an oversight of the investment portfolio to ensure compliance with the investment policy.
[PUBLIC] 12
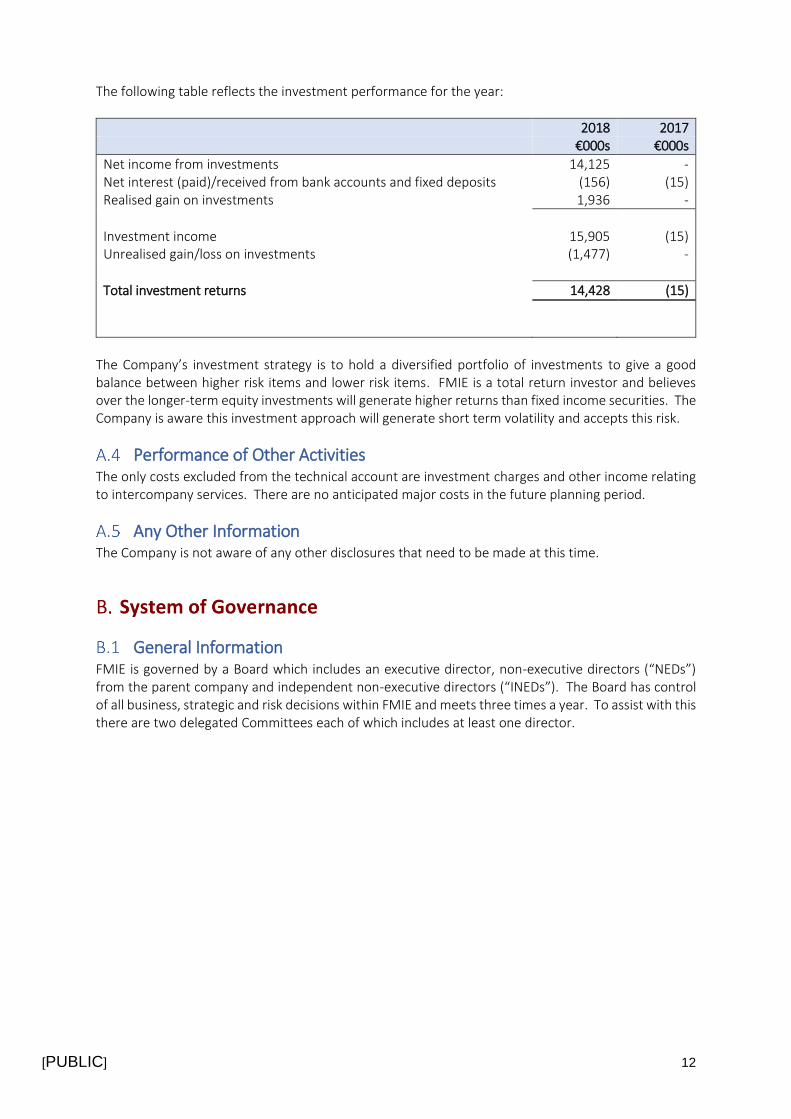
The following table reflects the investment performance for the year:
2018 2017 €000s €000s
Net income from investments 14,125 - Net interest (paid)/received from bank accounts and fixed deposits (156) (15) Realised gain on investments 1,936 -
Investment income 15,905 (15) Unrealised gain/loss on investments (1,477) -
Total investment returns 14,428 (15)
The Company’s investment strategy is to hold a diversified portfolio of investments to give a good balance between higher risk items and lower risk items. FMIE is a total return investor and believes over the longer-term equity investments will generate higher returns than fixed income securities. The Company is aware this investment approach will generate short term volatility and accepts this risk.
Performance of Other Activities The only costs excluded from the technical account are investment charges and other income relating to intercompany services. There are no anticipated major costs in the future planning period.
Any Other Information The Company is not aware of any other disclosures that need to be made at this time.
General Information FMIE is governed by a Board which includes an executive director, non-executive directors (“NEDs”) from the parent company and independent non-executive directors (“INEDs”). The Board has control of all business, strategic and risk decisions within FMIE and meets three times a year. To assist with this there are two delegated Committees each of which includes at least one director.
[PUBLIC] 13
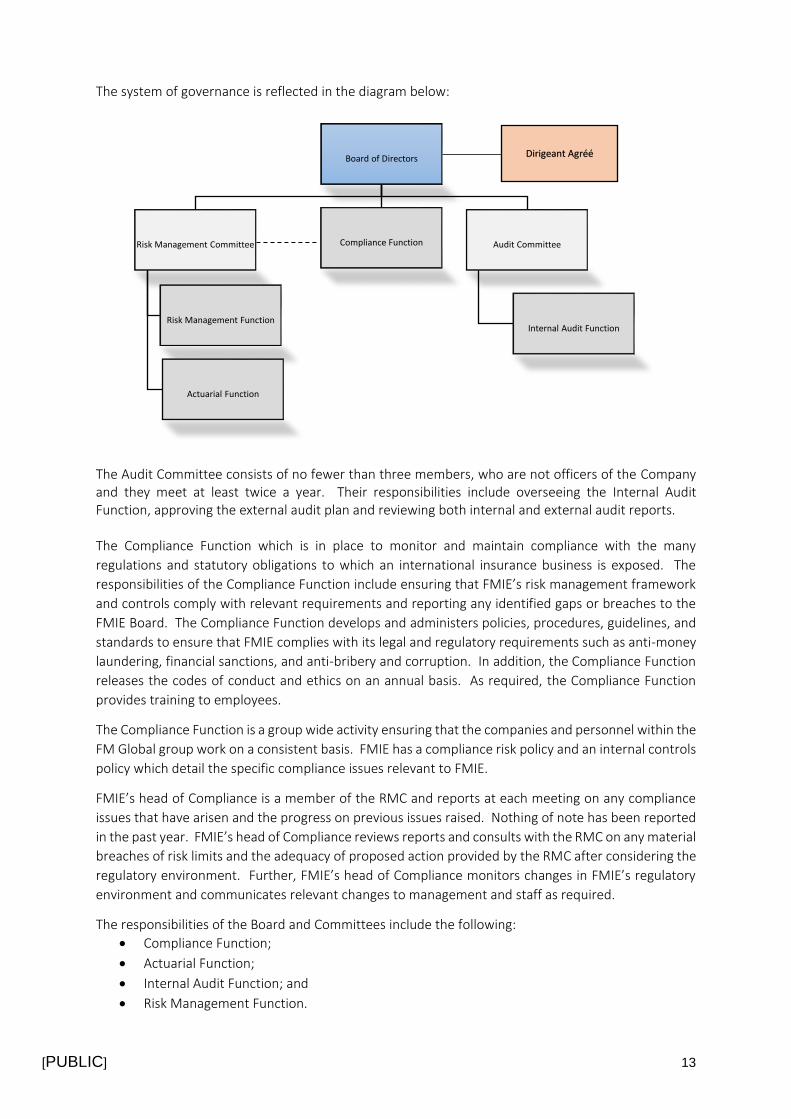
The system of governance is reflected in the diagram below:
The Audit Committee consists of no fewer than three members, who are not officers of the Company and they meet at least twice a year. Their responsibilities include overseeing the Internal Audit Function, approving the external audit plan and reviewing both internal and external audit reports. The Compliance Function which is in place to monitor and maintain compliance with the many
regulations and statutory obligations to which an international insurance business is exposed. The
responsibilities of the Compliance Function include ensuring that FMIE’s risk management framework
and controls comply with relevant requirements and reporting any identified gaps or breaches to the
FMIE Board. The Compliance Function develops and administers policies, procedures, guidelines, and
standards to ensure that FMIE complies with its legal and regulatory requirements such as anti-money
laundering, financial sanctions, and anti-bribery and corruption. In addition, the Compliance Function
releases the codes of conduct and ethics on an annual basis. As required, the Compliance Function
provides training to employees.
The Compliance Function is a group wide activity ensuring that the companies and personnel within the
FM Global group work on a consistent basis. FMIE has a compliance risk policy and an internal controls
policy which detail the specific compliance issues relevant to FMIE.
FMIE’s head of Compliance is a member of the RMC and reports at each meeting on any compliance
issues that have arisen and the progress on previous issues raised. Nothing of note has been reported
in the past year. FMIE’s head of Compliance reviews reports and consults with the RMC on any material
breaches of risk limits and the adequacy of proposed action provided by the RMC after considering the
regulatory environment. Further, FMIE’s head of Compliance monitors changes in FMIE’s regulatory
environment and communicates relevant changes to management and staff as required.
The responsibilities of the Board and Committees include the following:
• Compliance Function;
• Actuarial Function;
• Internal Audit Function; and
• Risk Management Function.
Board of Directors
Risk Management Committee
Risk Management Function
Actuarial Function
Compliance Function Audit Committee
Internal Audit Function
Dirigeant Agréé
[PUBLIC] 14
Refer to B.3 the Risk Management System section for more details on these functions. There have been no material changes to the System of Governance over the reporting period. The Independent non-Executive members of the Board are paid a retainer by FMIE. As stated within the FMIE Remuneration Policy, “Base pay is structured to ensure employees are paid competitively for the jobs they perform. FM Global develops and manages its compensation levels according to the competitive practice of each country in which it operates.” In addition, the executive director is eligible for the payment of incentives through FMIE. Per the Remuneration Policy “The objective of the incentive plans is to provide employees with variable compensation for performance that contributes significantly to the sustained success of the Company and which is directly related to the employee’s contribution to exceptional Company results.” As noted on page 8, the incentive scheme is principally based on the three KRA’s. Each of these KRAs are evaluated and targets are set for each calendar year and approved by the Board. The KRAs and incentive plan therefore align with the overall performance of the consolidated company. This restricts the potential for incentive driven strategies that do not benefit the overall FM Global group.
Fit and Proper Requirements FMIE has a ‘fit and proper’ policy in place which applies to all employees of FMIE that are subject to fit and proper assessments. The policy outlines how the employees are identified, the assessment criteria, the assessment process and the process to maintain compliance with the requirements. A fit and proper person is anyone occupying a key position within FMIE such that they may influence policy and strategic decisions. Such persons must be demonstrably honest with integrity and a good reputation. In addition, they must demonstrate competence, capability and financial soundness and meet the requirement specified in the Articles 72 and 73 of the Luxembourg Law of 7 December 2015 on the insurance industry (the “Luxembourg Insurance Law”). Persons occupying key positions within FMIE are:
• Directors;
• Dirigeant Agréé;
• Key Function holders under the Luxembourg Insurance Law;
• Members of the Risk Management Committee;
• Operations Managers; and
• Legal Representatives/Branch Managers.
The policy is owned and maintained by the legal department but is at a minimum annually reviewed and approved by the RMC. The RMC also monitors compliance with the policy and has ultimate responsibility for ensuring the relevant employees are identified and meet the requirements of the policy. There is an ongoing responsibility on both Executive Management and those persons occupying key positions to maintain their fit and proper status throughout their employment in that role. Succession plans are in place for all key positions.
[PUBLIC] 15
Risk Management System The Board and management recognise the importance that risk management plays in ensuring the business is able to fully capitalise on the opportunities available to it as well as mitigating potential loss. Risk management is an integral part of the strategic planning process of FMIE and is incorporated into its business plan. The Board aims to ensure that effective risk management practice remains embedded in the Company culture and throughout activities that are carried out at all levels within the Company. Risk management at FMIE is present throughout the business processes. It starts with the loss prevention reports (“LPR”) prepared by engineers when they perform their engineering visits at the insured’s (or a prospect in the case of potential new business) locations. These LPR’s are used by the account teams to underwrite the account, set limits and deductibles, and buy reinsurance if needed. Copies of the LPR are also provided to the insured to advise them of the recommendations to improve risk quality at the inspected location. The insured’s use the LPR to address the deficiencies identified in the LPR. There are also additional tools available to the account teams and engineers to assist them in their assessment of risk and communication with the insured (e.g. underwriting guidelines, RiskMark scores etc.). The FMIE RMC was established to provide independent oversight of the Company’s risks and risk
management. As noted previously, it is an Executive Committee that has the power to make decisions
regarding the Company’s risk management policies and practices.
The RMC is comprised of several members of the senior management team including:
• Dirigeant Agréé;
• Division Manager;
• Finance Manager;
• Legal Manager;
• Engineering Manager;
• Risk Manager;
• Human Resources Manager; and
• Operations Managers.
The Committee is responsible for setting and maintaining the Risk Management Policy and ensuring it is consistent across FMIE. It is also responsible for the Risk Appetite Framework which details the limits and tolerances the Company will accept in each of the key risk areas. Departments within FMIE maintain a departmental risk register and each risk is evaluated to determine the level of risk. Priority is given to risks that have the greatest potential for adverse impact and these risks are held in a corporate risk register which is monitored and regularly reviewed by the RMC. These risks cover all areas of the business and do not just consider operational risk. They also cover market, underwriting, credit, group, liquidity and compliance risks. The criteria for risks to be included on the corporate risk register are based on a combination of the severity and frequency factors along with the judgement of the RMC. Each risk on all registers must be reviewed by the risk owner at least annually, however, high rated risks are monitored more frequently. The risk management framework has been enhanced in a number of ways since inception:
• The appointment of WTW and Deloitte Tax & Consulting to provide expert actuarial review and
guidance;
• The embedding of a risk appetite monitoring control system;
• Alignment of the risk register with the FM Global group; and
• Thorough reviews with company experts.
[PUBLIC] 16
WTW provides appropriate technical support on Solvency II and review of the technical provisions.
Deloitte Tax & Consulting provides appropriate technical support on Luxembourg regulatory specific
matters.
The risk appetite monitoring system is based on the tolerances and limits laid out in the risk appetite framework. The risk appetite of FMIE is focused around the key risks and therefore the majority of tolerances and limits are focused around underwriting risk. These include targets for the combined ratio, premium retention and new business as well as policy limits. The framework was put in place during 2017 and has been fully applicable since 1 January 2018. The framework is a working document and as such is expected to evolve with the business. At RMC meetings, the Committee reviews, monitors and documents significant risks. Strategies and operational controls are considered and evaluated and where appropriate will be put into place to ensure the minimisation and effective management of each risk. There is also a standing item on the RMC agenda to consider any operational changes that are occurring and the resulting potential for any new risks arising, together with an emerging risk standing agenda item. Depending on the operational change being considered, a discussion is held regarding re-running the ORSA process to quantify the effect on capital. To assist with the identification of new risks there are policies in place for each of the risk categories which define that risk area and give examples of the types of risks that could be included in this risk area. They also cover the possible controls in place to mitigate a risk. The materiality of risks is determined during the process of development of the risk profile by considering the consequences, likelihood and controllability of each risk. The assessment of risk is based on quantitative and/or qualitative factors. The risks from the risk register are a key input into the solvency capital model. The RMC is involved in the review of the ORSA and its familiarity with the risks involved gives it a good understanding of the expected capital charge and coverage. In addition to risks identified in the risk register, FMIE’s approach is to minimise risk internally which is demonstrated by the levels of review and audit within the Company. Regular audits of engineering, claims and underwriting processes and procedures will take place in order to ensure the systems in place are adequate and are being followed. In addition, whenever a claim occurs at a higher level than anticipated an additional review of the claim takes place, including the underwriting and engineering assessments for that location, to see if there are any lessons to be learnt going forward. Assets held for solvency purposes are segregated between long and short-term holdings. Short term assets are held for working capital purposes and with a policy of neutrality on foreign currencies. This means, as far as possible, to make no profits or losses on exchange. Cash deposits and short-term investments are held in USD, unless required for a specific liability when the amount required will be held in the relevant transaction currency, if appropriate. Short term assets are held to provide the day to day working capital for the Company. The level of assets held is based on rolling 12-month cash flow forecasts which are prepared at a currency level. Any excess cash is put into long term investments in accordance with the global investment policy. FMIE’s long term assets are managed on behalf of FMIE by the FMIC Investment Department. It is expected that equities will provide superior long-term returns vs. bonds, albeit with greater volatility. ORSA The ORSA process is completed annually starting in February in order to have the results available for the Board meeting in July and the business strategy planning process in October.
[PUBLIC] 17
In certain circumstances an additional interim or partial ORSA will be run. Examples of the triggers to perform an interim or partial ORSA include:
• Changes to the business structure;
• Significant proposed changes to the investment portfolio; and
• Changes to strategy arising during the planning process.
This list is not exhaustive, and at each RMC meeting any significant changes to the business or the risk register are discussed and the need for a partial or full ORSA considered. There are specific actions that need to be followed to complete the ORSA and these are as follows, in the order in which they should occur:
• Review risks on the risk register;
• Identify emerging and long-term risks;
• Determine inputs to the model;
• Review data received;
• Define specific parameterisation;
• Run capital charge calculation;
• Perform sensitivity tests;
• Perform stress and scenario testing;
• Compare output to risk appetite framework;
• Prepare standard formula calculation;
• Review by actuarial function;
• Compare the standard formula SCR to the ORSA capital charge;
• Review differences between standard formula and ORSA capital charge;
• Projection of capital and solvency position;
• Finalise ORSA documentation;
• Review of ORSA report;
• Independent review performed; and
• Review and sign off ORSA.
The RMC will drive the ORSA and review key inputs during the process. It will also perform a preliminary review of the outputs. The Board has ultimate control and performs the final review and sign off. A review of FMIE’s own solvency assessment given the risk profile will be compared to the regulatory solvency assessment to determine whether additional solvency cover is required. As FMIE is currently well capitalised no further actions have to be taken.
Internal Control System FMIE has a strong control environment in place throughout the business and this is modelled on the Committee of Sponsoring Organisations of the Treadway Commission (“COSO”) framework. Thus, the internal control system within FMIE consists of five key components, namely:
• Control Environment;
• Risk Assessment;
• Control Activities;
• Information and Communication; and
• Monitoring Activities.
[PUBLIC] 18
These headings will be used to describe the FMIE internal control system, including any details on the
key procedures in place.
Control environment The Board and senior management of FMIE lead by example regarding the importance of internal controls and play an integral part in setting the expectations at all levels within the organisation. The Audit Committee addresses key components of the internal control system as mentioned previously in section B1. The Board collectively provides guidance and direction on all aspects of the internal control system. As part of its key role of providing oversight on standards and ethics within the business, it regularly reviews, approves, and monitors adherence to the various policies that FMIE management and employees are governed by. In addition to the policies, as noted in the section B1, there is a specific compliance function which is in place to monitor and maintain compliance with the many regulations and statutory obligations an international business is exposed to. A Compliance Risk Policy is in place and is required to be reviewed annually by the Compliance Officer and also requires annual approval by the RMC. Risk assessment FMIE has a process in place for identifying and assessing the risks involved in achieving the business’s objectives. As noted above, a risk register is used and overseen by the RMC to identify, assess, rate and record the significant risks that FMIE faces. The risk register also serves as a tool for Internal Audit in the development of the annual risk based audit plan. Control activities Control activities support every aspect of the internal control system within FMIE and are closely aligned with risk assessment. Management are tasked with enacting policies and procedures that help to prevent, detect or otherwise mitigate the risks identified in the ongoing risk assessment process. Control activities are built around the general business processes e.g. purchasing, treasury, accounts payable, as well as processes specific to the insurance industry such as underwriting and claims management. There are also technology related controls that deal with information security, system change management and data back-up. The types of controls that exist within the business include, but are not limited to:
• Reconciliations;
• System controls;
• Authorisations and approvals; and
• Physical controls.
In implementing each of the control activities in the business, consideration is given to the segregation of duties to reduce the possibilities of controls being overridden. Information and communication Information is important in helping the business achieve its objectives and this includes information regarding the internal control system.
[PUBLIC] 19
Information about the business’s objectives is primarily disseminated by senior management to management and employees through their reporting lines. In addition to that, there are various forums, both physical and online, through which company information is communicated. Departmental level information is also widely collected to help measure performance, record exceptions and determine any additional measures that are necessary. Employees have the opportunity to communicate upwards to management, for example, recent company initiatives focusing on increased efficiency have led to a significant input from employees about working practices within their departments. Management also communicate externally to clients, brokers, vendors and the general public through annual reports, articles in industry publications, and various marketing initiatives. Monitoring activities There are various forms of ongoing or separate evaluations to help monitor all aspects of the internal control system. These can either be conducted by internal or external resources. Separate evaluations are carried out by the Internal Audit department and staff auditors. Internal Audit
is tasked with carrying out evaluations on all aspects of the business; financial, operational and
compliance. Findings are reported to management and to the Board of Directors, through the Audit
Committee.
In addition to Internal Audit, there are discipline specific evaluations carried out by staff auditors. Examples of these include:
• Claims audits;
• Engineering audits;
• Operations audits;
• Processing audits;
• Underwriting audits; and
• Health and Safety audits.
Compliance Function FMIE is committed to managing its exposure to compliance risk in accordance with the agreed risk appetite. To properly address the risks, FMIE maintains effective relationships with the regulators and remains in good standing in all territories where FMIE is licensed to write insurance and reinsurance business. The risk appetite framework in place is used to advise management of the risks to which the Company is exposed. Any potential or existing risks are measured against the framework, and the results and outcomes of actions are monitored to ensure they remain within acceptable limits. The risk appetite and tolerances are subject to constant review by the RMC in order that they remain relevant and achievable.
[PUBLIC] 20
FMIE’s appetite for compliance risk is based upon the assumption that insurance companies are heavily regulated businesses. The loss of or any significant restriction on any of FMIE’s licenses would impair FMG’s ability to meet the needs of its policyholders and thus represents a threat to the business. Serious or persistent non-compliance with the rules and regulations of FMIE’s home and host regulators can lead to the loss of or a substantial restriction on one or more of its insurance licenses. Appropriate systems and controls must, therefore, be maintained and monitored at all times to ensure that FMIE remains in good standing with its home and host regulators and to ensure that any instances of non-compliance are promptly and effectively identified, assessed and addressed.
Internal Audit Function FMIE supports Internal Audit as an independent appraisal function to examine and evaluate company activities as a service to management and the Board of Directors. The mission of Internal Audit is to support the management and employees of FMIE in the effective discharge of their responsibilities, by providing an independent and objective assurance and consulting function. The FMIE Internal Audit function is served by the EMEA Internal Audit team, which, is based in Luxembourg and headed by the Internal Audit manager. The EMEA Internal Audit manager reports to the Chief Internal Auditor, FMIC, and the holder of the Head of Internal Audit position, to the FMIE Audit Committee of the Board of Directors. Bi-annually, the EMEA Internal Audit manager will submit to the Audit Committee a written report on the activities of the Internal Audit Function in the preceding auditable period. The EMEA Internal Audit manager will also make an oral report to the Audit Committee. The EMEA Internal Audit manager may confer with the Audit Committee or directly with the Chair of the Audit Committee or any other member of the Audit Committee including the Independent Non-Executive Directors, outside the presence of company officials, on any subject relevant to Internal Audit’s area of responsibility. On an annual basis, a risk based Internal Audit plan is developed and presented to the Audit Committee for approval. The Internal Audit annual plan is a risk-based plan that includes three major categories of work: (1) audit procedures related to internal control over financial reporting; (2) engagements related to regulatory compliance; and (3) risk-based internally focused audits.
(1) Audit work related to the internal control over financial reporting includes the evaluation of
internal controls at the level of significant financial business processes. A financial business
process is considered significant primarily based on quantitative factors, including the financial
misstatement effect.
(2) Certain regulations require or advise us to perform periodic audits including but not restricted
to compliance with Solvency II requirements of Pillar 2, Governance and Supervision. These are
included in the audit plan as appropriate.
(3) Identification of the internally focussed audits is based on a risk assessment process. Internal
audit constructed an audit environment based on their knowledge of the business and
discussions with various levels of management. The audit environment is made up of auditable
areas which are mapped to other assurance activities within the company. They meet with the
other assurance providers to understand the nature of their work and determine what areas
require internal audit coverage. The auditable areas covered by internal audit are assigned a
risk rating and ranked using a risk assessment formula to ensure the most effective use of
internal audit’s resources.
[PUBLIC] 21
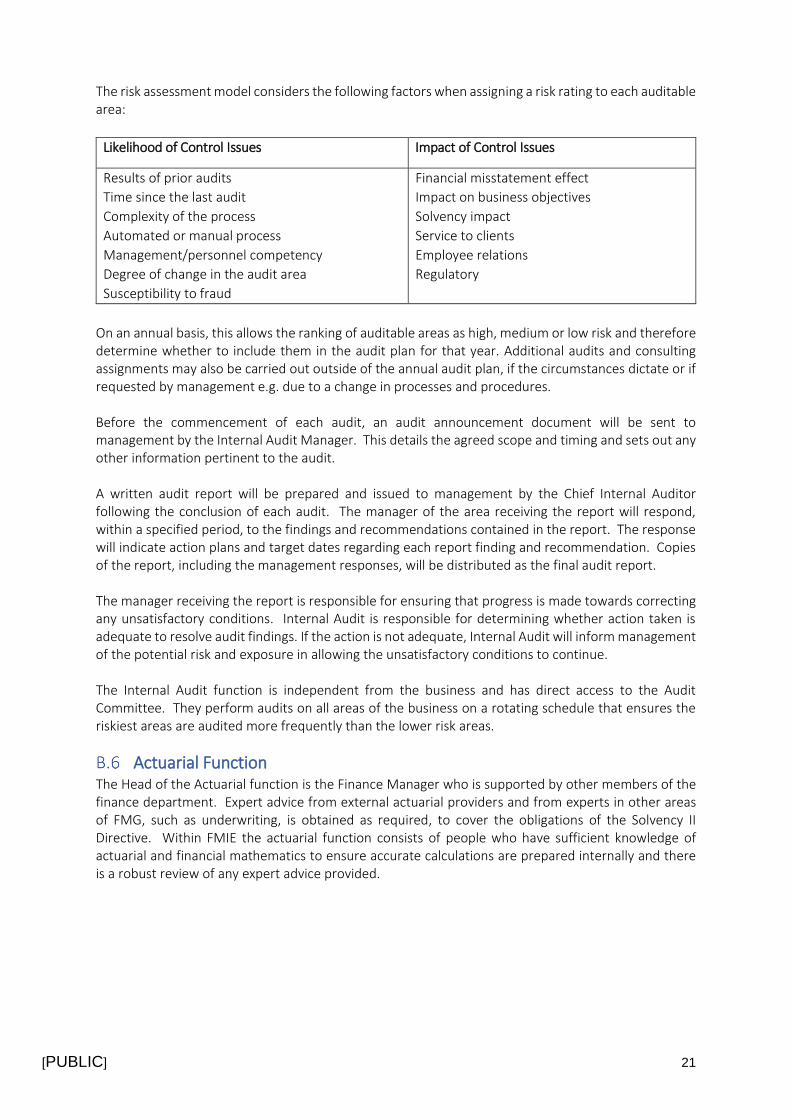
The risk assessment model considers the following factors when assigning a risk rating to each auditable area:
Likelihood of Control Issues Impact of Control Issues
Results of prior audits
Time since the last audit
Complexity of the process
Automated or manual process
Management/personnel competency
Degree of change in the audit area
Susceptibility to fraud
Financial misstatement effect
Impact on business objectives
Solvency impact
Service to clients
Employee relations
Regulatory
On an annual basis, this allows the ranking of auditable areas as high, medium or low risk and therefore determine whether to include them in the audit plan for that year. Additional audits and consulting assignments may also be carried out outside of the annual audit plan, if the circumstances dictate or if requested by management e.g. due to a change in processes and procedures. Before the commencement of each audit, an audit announcement document will be sent to management by the Internal Audit Manager. This details the agreed scope and timing and sets out any other information pertinent to the audit. A written audit report will be prepared and issued to management by the Chief Internal Auditor following the conclusion of each audit. The manager of the area receiving the report will respond, within a specified period, to the findings and recommendations contained in the report. The response will indicate action plans and target dates regarding each report finding and recommendation. Copies of the report, including the management responses, will be distributed as the final audit report. The manager receiving the report is responsible for ensuring that progress is made towards correcting any unsatisfactory conditions. Internal Audit is responsible for determining whether action taken is adequate to resolve audit findings. If the action is not adequate, Internal Audit will inform management of the potential risk and exposure in allowing the unsatisfactory conditions to continue. The Internal Audit function is independent from the business and has direct access to the Audit Committee. They perform audits on all areas of the business on a rotating schedule that ensures the riskiest areas are audited more frequently than the lower risk areas.
Actuarial Function The Head of the Actuarial function is the Finance Manager who is supported by other members of the finance department. Expert advice from external actuarial providers and from experts in other areas of FMG, such as underwriting, is obtained as required, to cover the obligations of the Solvency II Directive. Within FMIE the actuarial function consists of people who have sufficient knowledge of actuarial and financial mathematics to ensure accurate calculations are prepared internally and there is a robust review of any expert advice provided.
[PUBLIC] 22
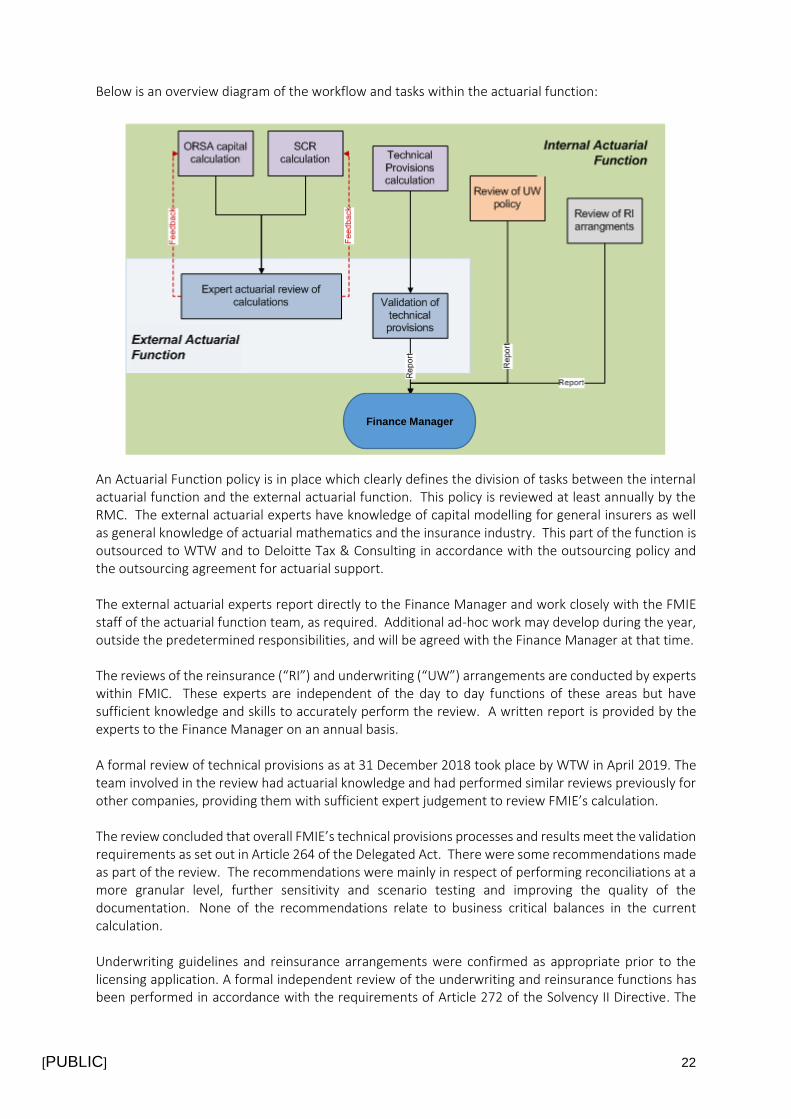
Below is an overview diagram of the workflow and tasks within the actuarial function:
An Actuarial Function policy is in place which clearly defines the division of tasks between the internal actuarial function and the external actuarial function. This policy is reviewed at least annually by the RMC. The external actuarial experts have knowledge of capital modelling for general insurers as well as general knowledge of actuarial mathematics and the insurance industry. This part of the function is outsourced to WTW and to Deloitte Tax & Consulting in accordance with the outsourcing policy and the outsourcing agreement for actuarial support. The external actuarial experts report directly to the Finance Manager and work closely with the FMIE staff of the actuarial function team, as required. Additional ad-hoc work may develop during the year, outside the predetermined responsibilities, and will be agreed with the Finance Manager at that time. The reviews of the reinsurance (“RI”) and underwriting (“UW”) arrangements are conducted by experts within FMIC. These experts are independent of the day to day functions of these areas but have sufficient knowledge and skills to accurately perform the review. A written report is provided by the experts to the Finance Manager on an annual basis. A formal review of technical provisions as at 31 December 2018 took place by WTW in April 2019. The team involved in the review had actuarial knowledge and had performed similar reviews previously for other companies, providing them with sufficient expert judgement to review FMIE’s calculation. The review concluded that overall FMIE’s technical provisions processes and results meet the validation requirements as set out in Article 264 of the Delegated Act. There were some recommendations made as part of the review. The recommendations were mainly in respect of performing reconciliations at a more granular level, further sensitivity and scenario testing and improving the quality of the documentation. None of the recommendations relate to business critical balances in the current calculation. Underwriting guidelines and reinsurance arrangements were confirmed as appropriate prior to the licensing application. A formal independent review of the underwriting and reinsurance functions has been performed in accordance with the requirements of Article 272 of the Solvency II Directive. The
Finance Manager
[PUBLIC] 23
reports were provided to the Head of the Actuarial Function and there were no issues arising from the review.
Outsourcing There is a comprehensive Outsourcing policy in place within FMIE which is used to ensure all outsourcing contracts do not add risk to the Company. This is available to any member of staff who may be involved in setting up an outsourcing arrangement and provides guidelines on the levels of agreement that are acceptable to FMIE. As noted on page 11, the investment management is outsourced to FMIC, however the investment strategy and asset allocation placed in bonds or equities is approved by the FMIE Board. Investment reports are received monthly by FMIE, reviewed and any changes or issues are acted on immediately. Utilising the parent company to manage the investments means FMIE can benefit from economies of scale and thereby reduce costs and maximise returns. The investments are held in USD which increases the market risk element. This results in an increased exchange risk when reporting in EUR, compared to if FMIE were holding the assets in EUR, however it does reflect the international nature of the business; a number of policies are transacted in USD. The assets have been included in USD in SF model and management and the Board consider this to have an acceptable level of risk. In addition, elements of system support and backup are outsourced to FMIC, but these are coordinated by suitably knowledgeable personnel within FMIE. The external actuarial function is outsourced to WTW and to Deloitte Tax & Consulting (registered as Professionnels du Secteur des Assurances in Luxembourg and regulated by the CAA). This enables FMIE to take advantage of expertise not available within the business. Any data used by the actuary is provided by FMIE and the results are scrutinised by the capital modelling team within FMIE Finance. The outsourcing of this function does not increase the risk to FMIE. If WTW or Deloitte Tax & Consulting were no longer available a similar provider could be found with minimal interruption to the running of the ORSA process, regulatory reporting and strategic decision making of the business. The actuarial function is well defined, as detailed in the previous section of this report, and there is an actuarial policy in place along with a Terms of Reference which ensures all parties are aware of their responsibilities.
Any Other Information FMIE has a robust governance system. All the relevant points have been detailed in this report and there are no further disclosures required at this time.
Underwriting Risk Underwriting risk within FMIE is accepted and managed within the agreed risk parameters. As a result, this area is very closely monitored and regulated through:
• Clear and specific underwriting guidelines;
• Well defined systems of training and monitoring;
• Regular process audits;
• General business controls as detailed in the Internal Control section above; and
• Regular risk appetite monitoring.
[PUBLIC] 24
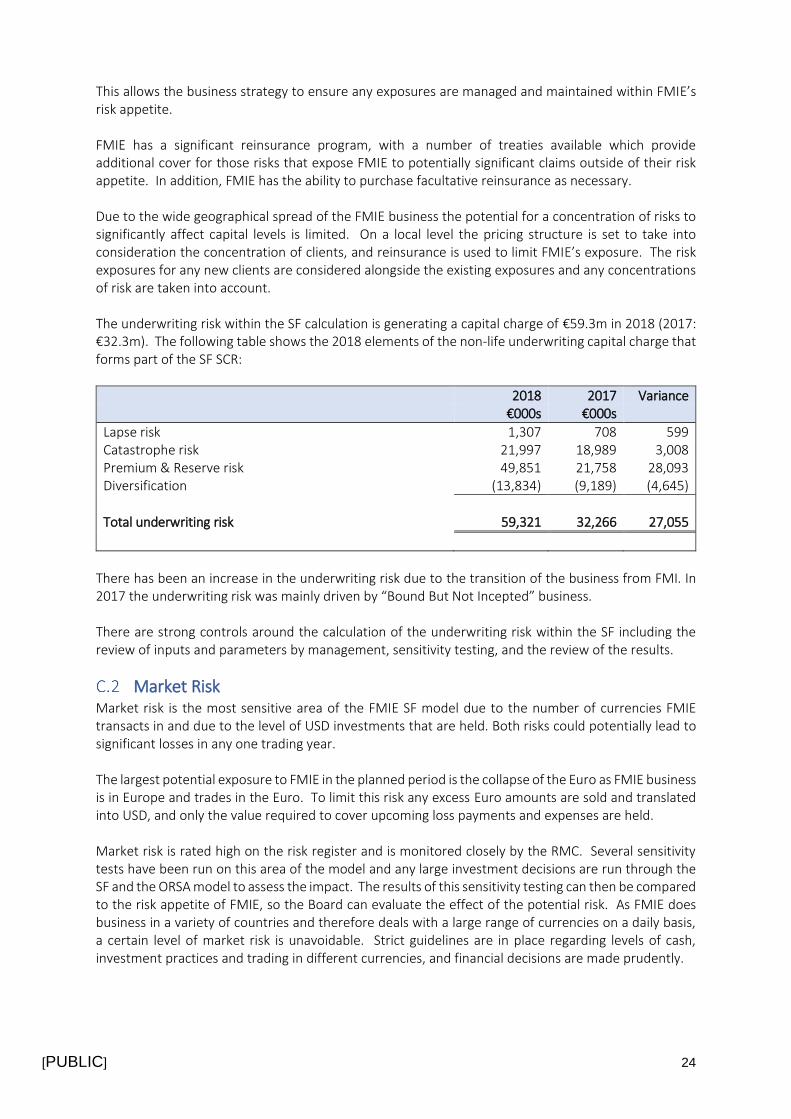
This allows the business strategy to ensure any exposures are managed and maintained within FMIE’s risk appetite. FMIE has a significant reinsurance program, with a number of treaties available which provide additional cover for those risks that expose FMIE to potentially significant claims outside of their risk appetite. In addition, FMIE has the ability to purchase facultative reinsurance as necessary. Due to the wide geographical spread of the FMIE business the potential for a concentration of risks to significantly affect capital levels is limited. On a local level the pricing structure is set to take into consideration the concentration of clients, and reinsurance is used to limit FMIE’s exposure. The risk exposures for any new clients are considered alongside the existing exposures and any concentrations of risk are taken into account. The underwriting risk within the SF calculation is generating a capital charge of €59.3m in 2018 (2017: €32.3m). The following table shows the 2018 elements of the non-life underwriting capital charge that forms part of the SF SCR:
2018 2017 Variance €000s €000s
Lapse risk 1,307 708 599 Catastrophe risk 21,997 18,989 3,008 Premium & Reserve risk 49,851 21,758 28,093 Diversification (13,834) (9,189) (4,645)
Total underwriting risk 59,321 32,266 27,055
There has been an increase in the underwriting risk due to the transition of the business from FMI. In 2017 the underwriting risk was mainly driven by “Bound But Not Incepted” business. There are strong controls around the calculation of the underwriting risk within the SF including the review of inputs and parameters by management, sensitivity testing, and the review of the results.
Market Risk Market risk is the most sensitive area of the FMIE SF model due to the number of currencies FMIE transacts in and due to the level of USD investments that are held. Both risks could potentially lead to significant losses in any one trading year. The largest potential exposure to FMIE in the planned period is the collapse of the Euro as FMIE business is in Europe and trades in the Euro. To limit this risk any excess Euro amounts are sold and translated into USD, and only the value required to cover upcoming loss payments and expenses are held. Market risk is rated high on the risk register and is monitored closely by the RMC. Several sensitivity tests have been run on this area of the model and any large investment decisions are run through the SF and the ORSA model to assess the impact. The results of this sensitivity testing can then be compared to the risk appetite of FMIE, so the Board can evaluate the effect of the potential risk. As FMIE does business in a variety of countries and therefore deals with a large range of currencies on a daily basis, a certain level of market risk is unavoidable. Strict guidelines are in place regarding levels of cash, investment practices and trading in different currencies, and financial decisions are made prudently.
[PUBLIC] 25
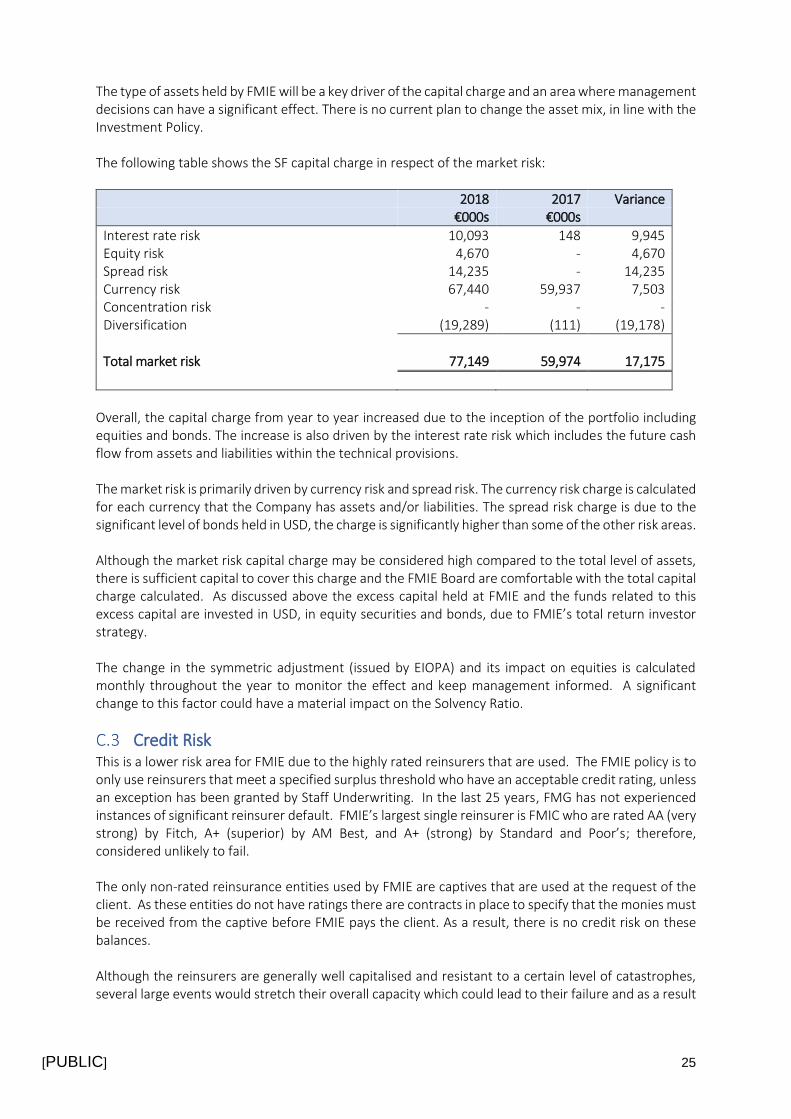
The type of assets held by FMIE will be a key driver of the capital charge and an area where management decisions can have a significant effect. There is no current plan to change the asset mix, in line with the Investment Policy. The following table shows the SF capital charge in respect of the market risk:
2018 2017 Variance €000s €000s
Interest rate risk 10,093 148 9,945 Equity risk 4,670 - 4,670 Spread risk 14,235 - 14,235 Currency risk 67,440 59,937 7,503 Concentration risk - - - Diversification (19,289) (111) (19,178)
Total market risk 77,149 59,974 17,175
Overall, the capital charge from year to year increased due to the inception of the portfolio including equities and bonds. The increase is also driven by the interest rate risk which includes the future cash flow from assets and liabilities within the technical provisions. The market risk is primarily driven by currency risk and spread risk. The currency risk charge is calculated for each currency that the Company has assets and/or liabilities. The spread risk charge is due to the significant level of bonds held in USD, the charge is significantly higher than some of the other risk areas. Although the market risk capital charge may be considered high compared to the total level of assets, there is sufficient capital to cover this charge and the FMIE Board are comfortable with the total capital charge calculated. As discussed above the excess capital held at FMIE and the funds related to this excess capital are invested in USD, in equity securities and bonds, due to FMIE’s total return investor strategy. The change in the symmetric adjustment (issued by EIOPA) and its impact on equities is calculated monthly throughout the year to monitor the effect and keep management informed. A significant change to this factor could have a material impact on the Solvency Ratio.
Credit Risk This is a lower risk area for FMIE due to the highly rated reinsurers that are used. The FMIE policy is to only use reinsurers that meet a specified surplus threshold who have an acceptable credit rating, unless an exception has been granted by Staff Underwriting. In the last 25 years, FMG has not experienced instances of significant reinsurer default. FMIE’s largest single reinsurer is FMIC who are rated AA (very strong) by Fitch, A+ (superior) by AM Best, and A+ (strong) by Standard and Poor’s; therefore, considered unlikely to fail. The only non-rated reinsurance entities used by FMIE are captives that are used at the request of the client. As these entities do not have ratings there are contracts in place to specify that the monies must be received from the captive before FMIE pays the client. As a result, there is no credit risk on these balances. Although the reinsurers are generally well capitalised and resistant to a certain level of catastrophes, several large events would stretch their overall capacity which could lead to their failure and as a result
[PUBLIC] 26
incur a capital charge within the SF. The total counterparty default charge within the SF is €25.3m (2017: €16.7m). The increase in 2018 is due to a combination of the increased claims incurred in the 2018 financial year and an increase in the catastrophe risk data used. More detailed reports have been available this year and have generated a specific fire risk charge calculated under the SII criteria (all risk included within a 200m radius even if belonging to separate insureds). The total sum insured is larger than the estimate used in previous years and therefore the reinsurance has correspondingly increased.
Liquidity Risk This is not considered a key risk area for FMIE as the investment policy requires that cash in the relevant currency is held against any large outstanding claims. To assist in managing this on a day to day basis a 12 month rolling cash flow forecast for each individual currency (where FMIE holds a bank account) is used to predict large and small claims along with income and reinsurance receipts due. This is then used to ensure any premiums or reinsurance recoveries received are retained to match against any claims outstanding. Where no income is expected in a specific currency, external advice is sought on the best time to purchase the currency required, prior to the date of the claims payment. The cash flow will also incorporate any other income and expenses expected within the next 12 months, such as operational expenses. Expected profits included in future premiums are €4.4m at 31 December 2018. Refer to S.23.01.01 within section F.3 for further detail. There is also a pre-funding arrangement in place with FMIC, which means that, if required, the
reinsurance due from FMIC will be paid in advance, to fund the payment to the client. This facility is
considered on a claim by claim basis. Historically, a similar arrangement has proven to be very effective
for other group entities, following significant catastrophe events.
Operational Risk This risk area covers any risks on the risk register that are not covered by any other risk areas. The key risk areas are monitored through the risk register and the risk appetite framework. They are reviewed at RMC meetings to ensure management are aware of the risks, they are being adequately controlled and mitigation is in place, if deemed necessary. There is very little concentration of risks within the operational risk area of the capital modelling as these are mostly very disparate events with little or no correlation with each other. As a result, the individual elements of this risk area are not very sensitive and a change to one will not have a significant effect on the overall operational risk charge for the ORSA model. The SF charge for operational risk is a more simplistic formula based on the technical provisions and earned premiums. The total operational charge from the SF model for 2018 is €26.5m. Since no business was written through FMIE in 2017, the operational risk prescribed SF calculation effectively results in the charge being double the expected charge and the SF calculation does not allow any change in the parameter. The charge is expected to reduce in the 2019 calculation.
Other Material Risks The only risk area not mentioned above is that of group risk, however this is not considered a high risk to FMIE, as FMIC is very highly rated and unlikely to fail within a 99.5% confidence level. As at 31 December 2018 FMIC has $11.8bn capital and has had the same robust business model for over 180 years.
[PUBLIC] 27
The largest risk scenario modelled for FMIC is a Pacific Northwest earth movement which would leave sufficient surplus to cover the second largest risk of a windstorm. However, if FMIC were to fail this would be the most extreme scenario for FMIE as it would mean the loss of many international clients and therefore is also likely to cause FMIE to fail. This is considered as part of the reverse stress testing as it is such an extreme scenario and outside the parameters of the model calculations. The main risk for FMIE is that FMIC does not meet their financial obligations as they are FMIE’s largest
reinsurer. As noted above, FMIC has a very high rating indicating they are unlikely to default and held
over $2.2bn of available cash on their balance sheet at 31 December 2018. In addition, defaulting on
FMIE would mean losing their international base of operations which would alter FMG’s business
model. The risk of FMIC defaulting on its reinsurance balances with FMIE is included within the credit
risk section of the model in the same way as for any external reinsurer.
FMIC provides support services to FMIE, including investment management and system support, however the Company could continue to function in the short term using local resources, until new contracts were agreed. As the likelihood is low and there are good controls and mitigation in place, the overall rating of this risk is rated low and therefore it is not separately modelled within the ORSA. All services provided by FMIC are covered by a group risk entry on the risk register and this is reviewed at least annually by the RMC. In addition, the reinsurance exposure of FMIE to FMIC is monitored monthly as part of management reporting and is included in the risk appetite monitoring control sheet, which is distributed to the RMC. The ORSA model has been built to take into consideration the fact that the failure of FMIC will also mean the default of the stop loss treaty. If a simulation has calculated that FMIC will go into default, then the stop loss and amount ceded on expenses is also considered unrecoverable. A large capital charge for this scenario is generated within the extreme tail of the model. The SF model does not have the facility to account for the stop loss treaty. Therefore, the counterparty default charge is calculated from the balances and ratings and does not include any further adjustments for the stop loss. The Board understands that this generates a higher SCR however are comfortable that there is sufficient capital in place and the SF remains appropriate for the Company.
Any Other Information A large number of sensitivity and scenario tests are undertaken during the modelling process to assist in both understanding the effect of movements within a specific risk area and illustrating the overall dynamic of the risk areas within the total capital charge. The stressed model parameters are recommended by the Solvency II modelling team and agreed with the RMC, based on areas considered to be key risks for FMIE. The testing affecting individual risk areas has been discussed previously in this report. The tests performed on the ORSA model differ from those within the SF model. The sensitivity testing completed on the SF model include the following:
• Reducing all counterparty ratings by one credit quality step;
• Reducing FMIC’s rating by one credit quality step; and
• Reducing the reinsurance available for catastrophe risks.
[PUBLIC] 28
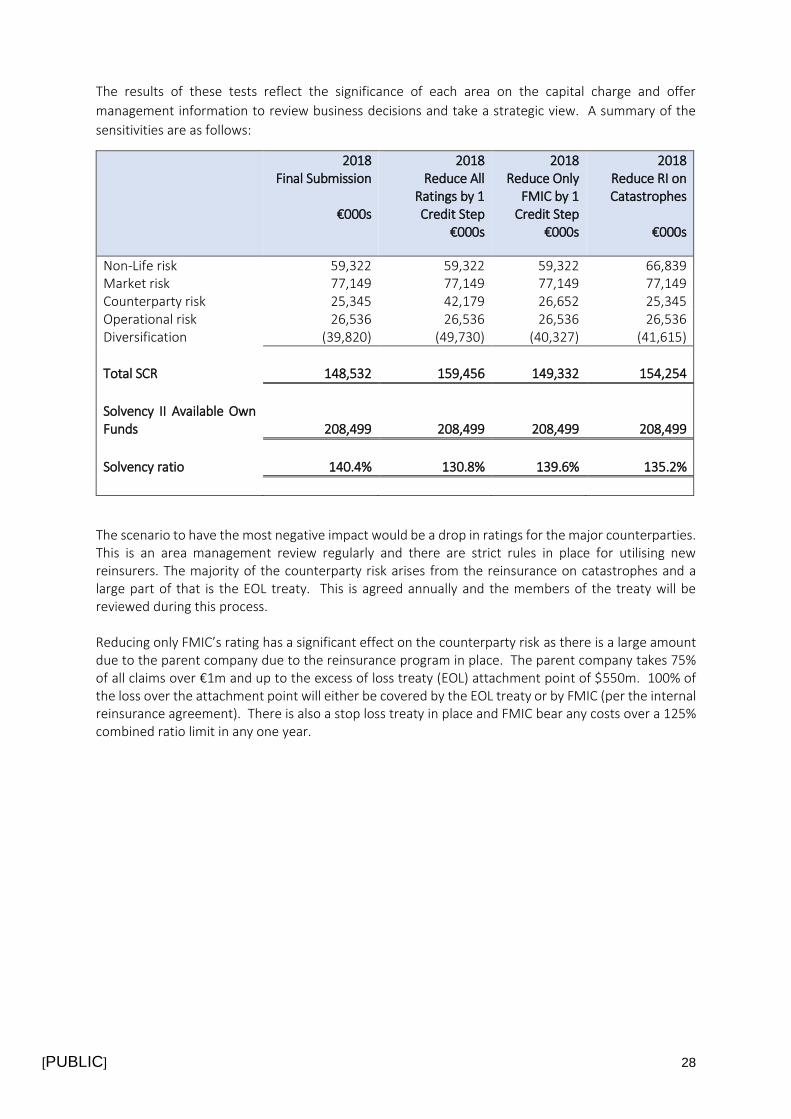
The results of these tests reflect the significance of each area on the capital charge and offer
management information to review business decisions and take a strategic view. A summary of the
sensitivities are as follows:
2018 2018 2018 2018 Final Submission
€000s
Reduce All Ratings by 1 Credit Step
€000s
Reduce Only FMIC by 1
Credit Step €000s
Reduce RI on Catastrophes
€000s
Non-Life risk 59,322 59,322 59,322 66,839 Market risk 77,149 77,149 77,149 77,149 Counterparty risk 25,345 42,179 26,652 25,345 Operational risk 26,536 26,536 26,536 26,536 Diversification (39,820) (49,730) (40,327) (41,615)
Total SCR 148,532 159,456 149,332 154,254
Solvency II Available Own Funds 208,499 208,499 208,499 208,499
Solvency ratio 140.4% 130.8% 139.6% 135.2%
The scenario to have the most negative impact would be a drop in ratings for the major counterparties. This is an area management review regularly and there are strict rules in place for utilising new reinsurers. The majority of the counterparty risk arises from the reinsurance on catastrophes and a large part of that is the EOL treaty. This is agreed annually and the members of the treaty will be reviewed during this process. Reducing only FMIC’s rating has a significant effect on the counterparty risk as there is a large amount due to the parent company due to the reinsurance program in place. The parent company takes 75% of all claims over €1m and up to the excess of loss treaty (EOL) attachment point of $550m. 100% of the loss over the attachment point will either be covered by the EOL treaty or by FMIC (per the internal reinsurance agreement). There is also a stop loss treaty in place and FMIC bear any costs over a 125% combined ratio limit in any one year.
[PUBLIC] 29
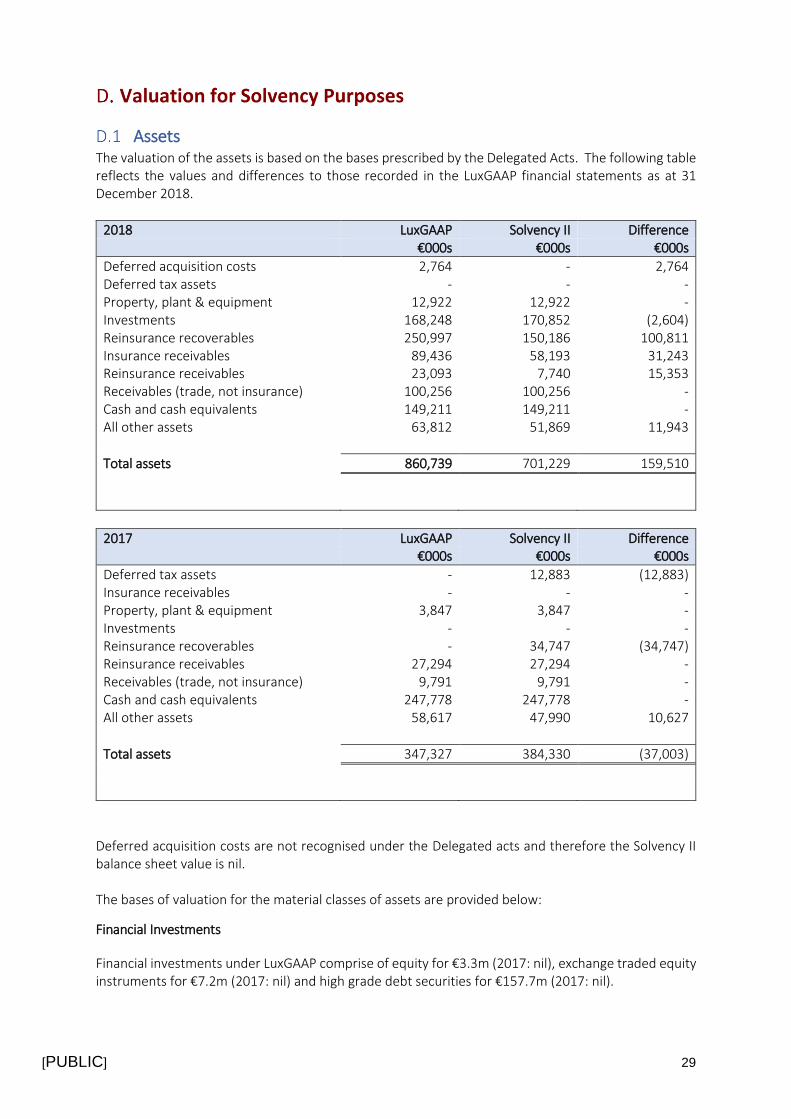
Assets The valuation of the assets is based on the bases prescribed by the Delegated Acts. The following table reflects the values and differences to those recorded in the LuxGAAP financial statements as at 31 December 2018.
2018 LuxGAAP Solvency II Difference €000s €000s €000s
Deferred acquisition costs 2,764 - 2,764 Deferred tax assets - - - Property, plant & equipment 12,922 12,922 - Investments 168,248 170,852 (2,604) Reinsurance recoverables 250,997 150,186 100,811 Insurance receivables 89,436 58,193 31,243 Reinsurance receivables 23,093 7,740 15,353 Receivables (trade, not insurance) 100,256 100,256 - Cash and cash equivalents 149,211 149,211 - All other assets 63,812 51,869 11,943
Total assets 860,739 701,229 159,510
2017 LuxGAAP Solvency II Difference €000s €000s €000s
Deferred tax assets - 12,883 (12,883) Insurance receivables - - - Property, plant & equipment 3,847 3,847 - Investments - - - Reinsurance recoverables - 34,747 (34,747) Reinsurance receivables 27,294 27,294 - Receivables (trade, not insurance) 9,791 9,791 - Cash and cash equivalents 247,778 247,778 - All other assets 58,617 47,990 10,627
Total assets 347,327 384,330 (37,003)
Deferred acquisition costs are not recognised under the Delegated acts and therefore the Solvency II balance sheet value is nil. The bases of valuation for the material classes of assets are provided below:
Financial Investments
Financial investments under LuxGAAP comprise of equity for €3.3m (2017: nil), exchange traded equity instruments for €7.2m (2017: nil) and high grade debt securities for €157.7m (2017: nil).
[PUBLIC] 30
Financial investments under Solvency II comprise of equity for €3.6m (2017: nil), exchange traded equity instruments for €7.2m (2017: nil) and high grade debt securities for €160m (2017: nil) including €1.3m of accrued interest. The investments are measured on a market value basis, consistent with Article 10(2) of the Delegated Acts. Equity and exchange traded instruments are financial assets that are measured by reference to published quotes in an active market, with quoted prices readily and regularly available from an exchange, dealer, or broker and those prices representing actual and regularly occurring market transactions on an arm’s length basis. Debt securities are financial assets measured using valuation techniques based on assumptions that are supported by prices from observable current market transactions. Debt securities are priced by an independent vendor using evaluated market pricing models. Under Solvency II, accrued interest is disclosed as part of the investment. By comparison under LuxGAAP it is disclosed separately as part of Other Assets. Reinsurance Recoverables Details related to the valuation of technical provisions are provided in Section D.2. Cash and Cash Equivalents Cash and cash equivalents in the balance sheet comprise of cash at bank and in hand and short-term deposits with an original maturity date of three months or less. Insurance and Reinsurance Receivables Debtors receivable are recorded at transaction price. Due to the short-term nature of the balances they are held at an undiscounted amount. Under Solvency II the current portion of these debtors are reclassified into the technical provisions. Receivables Receivables in the balance sheet are comprised of other debtors. Deferred Tax Assets Deferred tax is recognised in respect of all timing differences that have originated but not reversed by the balance sheet date. Deferred tax is measured on an undiscounted basis at the tax rates that are expected to apply in the periods in which timing differences reverse, based on tax rates and laws enacted or substantially enacted at the balance sheet date. Deferred tax assets are recognised to the extent that it is regarded as more likely than not that they will be recovered. Under Solvency II the deferred tax assets are calculated based on the temporary differences between the Solvency II and tax values. All Other Assets Included within All Other Assets is an amount of €49m relating to the amount recoverable on a reinsurance contract covering obligations arising from the company’s German defined benefit pension scheme. The value of the reinsurance contract has been determined using an alternative valuation method, linked to the underlying pension obligations covered by the contract.
[PUBLIC] 31
Technical Provisions The technical provisions represent a best estimate of future technical cashflows, discounted to present value. Under Solvency II, the value of technical provisions is expected to correspond to the amount an insurance or reinsurance undertaking would have to pay if it transferred its contractual rights and obligations immediately to another undertaking, and should comprise a best estimate and a risk margin. For non-life undertakings, the best estimate is the sum of the following:
• Claims provision - a provision relating to events that have already occurred; and a
• Premium provision - a provision relating to events on unexpired risks at the balance sheet date
within the contract boundaries.
The best estimate technical provisions on the Solvency II basis are supplemented by the risk margin, representing the cost of capital which a third party would incur in taking over and running the existing obligations to expiry. The risk margin is calculated by determining the cost of providing an amount of eligible Own Funds equal to the SCR necessary to support the current insurance obligations over their lifetime. A Technical Provisions policy is in place to outline the requirements under Solvency II and ensure each set of calculations are performed consistently. In addition, detailed procedures are available to ensure the calculation can be re-performed if required. Under Solvency II the technical provisions are based on the calculation specified in Section 3 of Chapter III of Title 1 of the Delegated Acts. This requires certain additional elements which are not included under the LuxGAAP valuations used in the FMIE annual accounts. Within the premium provision the value of premium arising from those contracts which have been bound but not incepted (BBNI) at the year-end date, is added. Events not in data (“ENIDs”) have been included based on the FMIE specific modelled catastrophes, which is performed by FMIC. The future cash in-flows and out-flows from insurance receivables and payables are included in the premium provision value before discounting. The portion of premiums due on the EOL treaty that FMIE participates in is included within the technical provisions, offsetting future reinsurance recoverables. For both the premium and claims provisions an element of reinsurer default has been included to account for the possibility that all reinsurance may not be recovered. This has been calculated based on credit risk factors within the SF. The claims provision will also include the cash in-flows from the reinsurance receivables as per the Delegated Acts. The discounting is calculated by currency based on the risk-free rates published by EIOPA. Future claims experience is dependent on the external environment, which is subject to uncertainty,
including that related to legislative, social and economic change. The impact of uncertain external
factors is considered throughout the reserving exercise and through sensitivity testing including in the
predicted profit ratios. External factors, future client behaviour and management actions are
considered when preparing the strategic plan as far as possible. The external environment is monitored
and where relevant predicted changes to the market and potential impacts are included in the
provision, or considered through sensitivity testing. The results of testing this year can be found in
section C7.
The payment of future claims is dependent on historical payment patterns and are used in the best
estimate reserving.
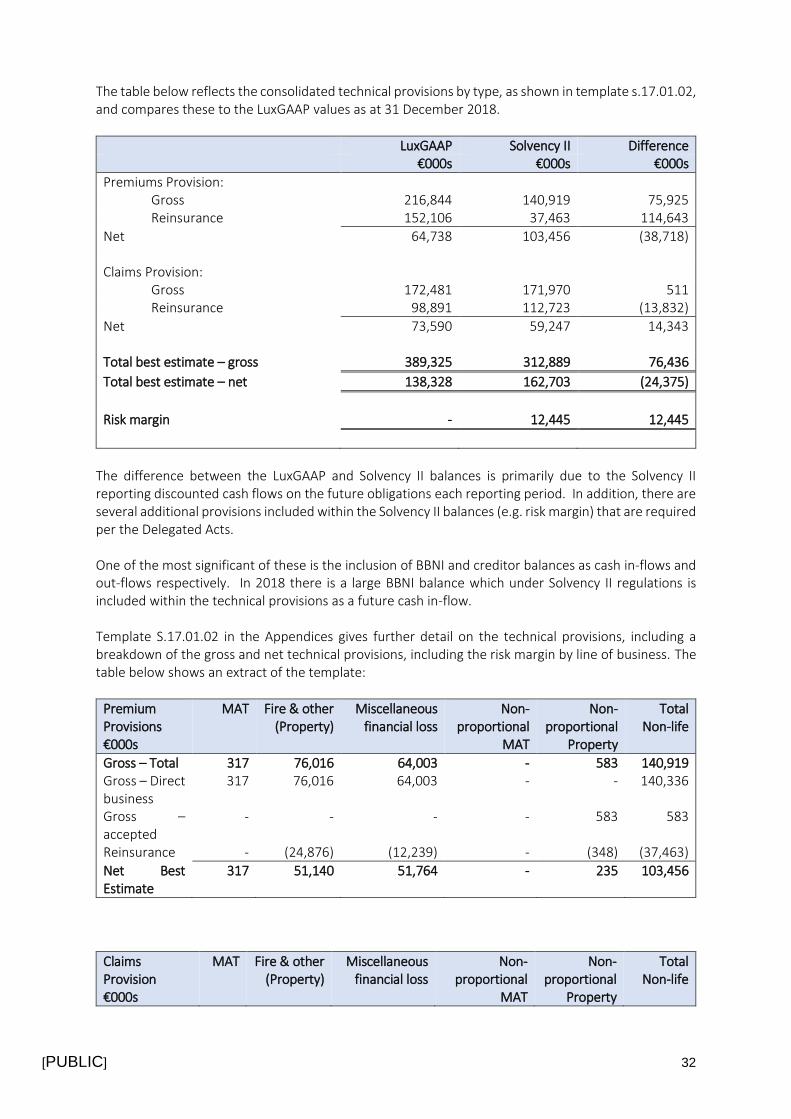
[PUBLIC] 32
The table below reflects the consolidated technical provisions by type, as shown in template s.17.01.02, and compares these to the LuxGAAP values as at 31 December 2018.
LuxGAAP Solvency II Difference €000s €000s €000s
Premiums Provision: Gross 216,844 140,919 75,925 Reinsurance 152,106 37,463 114,643
Net 64,738 103,456 (38,718) Claims Provision:
Gross 172,481 171,970 511 Reinsurance 98,891 112,723 (13,832)
Net 73,590 59,247 14,343 Total best estimate – gross 389,325 312,889 76,436
Total best estimate – net 138,328 162,703 (24,375)
Risk margin - 12,445 12,445
The difference between the LuxGAAP and Solvency II balances is primarily due to the Solvency II reporting discounted cash flows on the future obligations each reporting period. In addition, there are several additional provisions included within the Solvency II balances (e.g. risk margin) that are required per the Delegated Acts. One of the most significant of these is the inclusion of BBNI and creditor balances as cash in-flows and out-flows respectively. In 2018 there is a large BBNI balance which under Solvency II regulations is included within the technical provisions as a future cash in-flow. Template S.17.01.02 in the Appendices gives further detail on the technical provisions, including a breakdown of the gross and net technical provisions, including the risk margin by line of business. The table below shows an extract of the template:
Premium Provisions €000s
MAT Fire & other (Property)
Miscellaneous financial loss
Non-proportional
MAT
Non-proportional
Property
Total Non-life
Gross – Total 317 76,016 64,003 - 583 140,919 Gross – Direct business
317 76,016 64,003 - - 140,336
Gross – accepted
- - - - 583 583
Reinsurance - (24,876) (12,239) - (348) (37,463)
Net Best Estimate
317 51,140 51,764 - 235 103,456
Claims Provision €000s
MAT Fire & other (Property)
Miscellaneous financial loss
Non-proportional
MAT
Non-proportional
Property
Total Non-life
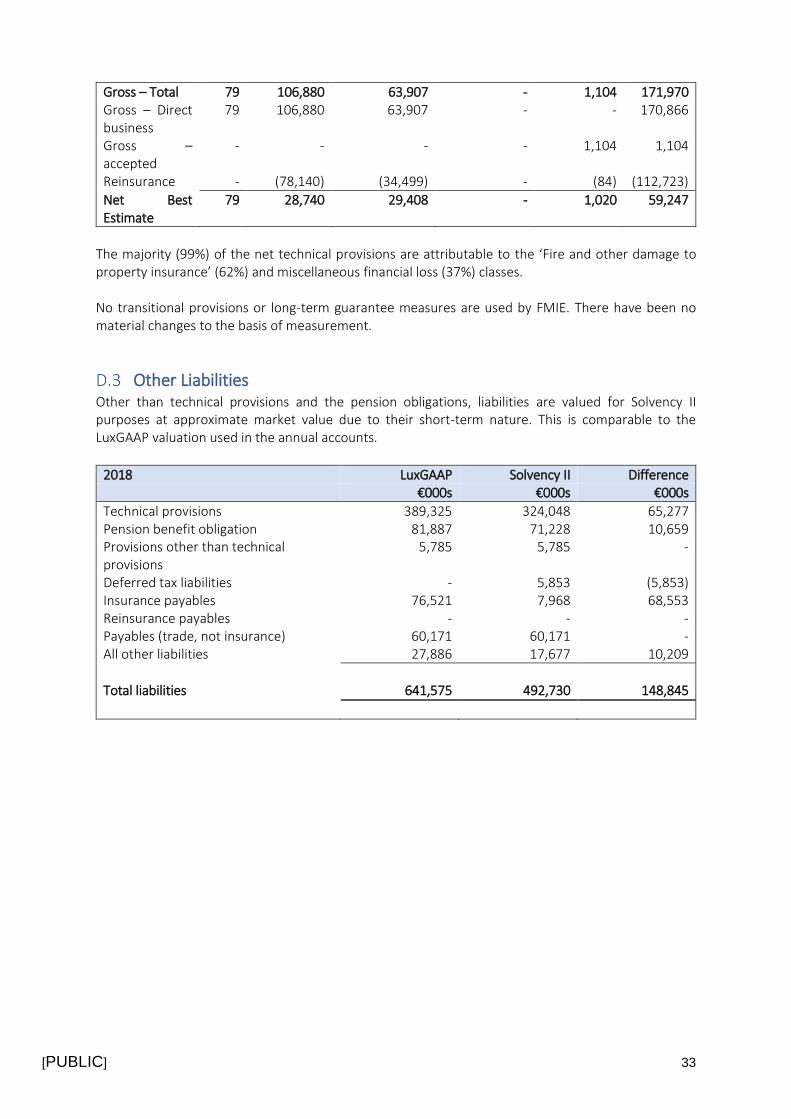
[PUBLIC] 33
Gross – Total 79 106,880 63,907 - 1,104 171,970 Gross – Direct business
79 106,880 63,907 - - 170,866
Gross – accepted
- - - - 1,104 1,104
Reinsurance - (78,140) (34,499) - (84) (112,723)
Net Best Estimate
79 28,740 29,408 - 1,020 59,247
The majority (99%) of the net technical provisions are attributable to the ‘Fire and other damage to property insurance’ (62%) and miscellaneous financial loss (37%) classes. No transitional provisions or long-term guarantee measures are used by FMIE. There have been no material changes to the basis of measurement.
Other Liabilities Other than technical provisions and the pension obligations, liabilities are valued for Solvency II purposes at approximate market value due to their short-term nature. This is comparable to the LuxGAAP valuation used in the annual accounts.
2018 LuxGAAP Solvency II Difference €000s €000s €000s
Technical provisions 389,325 324,048 65,277 Pension benefit obligation 81,887 71,228 10,659 Provisions other than technical provisions
5,785 5,785 -
Deferred tax liabilities - 5,853 (5,853) Insurance payables 76,521 7,968 68,553 Reinsurance payables - - - Payables (trade, not insurance) 60,171 60,171 - All other liabilities 27,886 17,677 10,209
Total liabilities 641,575 492,730 148,845
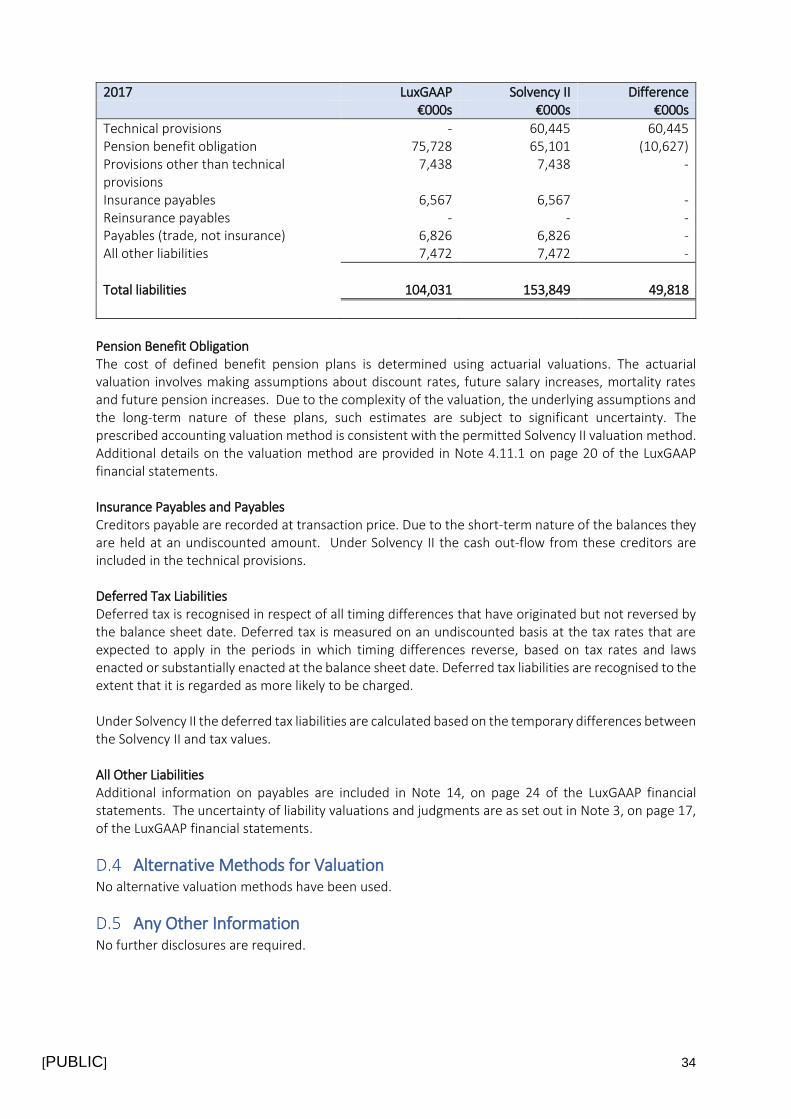
[PUBLIC] 34
2017 LuxGAAP Solvency II Difference €000s €000s €000s
Technical provisions - 60,445 60,445 Pension benefit obligation 75,728 65,101 (10,627) Provisions other than technical provisions
7,438 7,438 -
Insurance payables 6,567 6,567 - Reinsurance payables - - - Payables (trade, not insurance) 6,826 6,826 - All other liabilities 7,472 7,472 -
Total liabilities 104,031 153,849 49,818
Pension Benefit Obligation The cost of defined benefit pension plans is determined using actuarial valuations. The actuarial valuation involves making assumptions about discount rates, future salary increases, mortality rates and future pension increases. Due to the complexity of the valuation, the underlying assumptions and the long-term nature of these plans, such estimates are subject to significant uncertainty. The prescribed accounting valuation method is consistent with the permitted Solvency II valuation method. Additional details on the valuation method are provided in Note 4.11.1 on page 20 of the LuxGAAP financial statements. Insurance Payables and Payables Creditors payable are recorded at transaction price. Due to the short-term nature of the balances they are held at an undiscounted amount. Under Solvency II the cash out-flow from these creditors are included in the technical provisions. Deferred Tax Liabilities Deferred tax is recognised in respect of all timing differences that have originated but not reversed by the balance sheet date. Deferred tax is measured on an undiscounted basis at the tax rates that are expected to apply in the periods in which timing differences reverse, based on tax rates and laws enacted or substantially enacted at the balance sheet date. Deferred tax liabilities are recognised to the extent that it is regarded as more likely to be charged. Under Solvency II the deferred tax liabilities are calculated based on the temporary differences between the Solvency II and tax values. All Other Liabilities Additional information on payables are included in Note 14, on page 24 of the LuxGAAP financial statements. The uncertainty of liability valuations and judgments are as set out in Note 3, on page 17, of the LuxGAAP financial statements.
Alternative Methods for Valuation No alternative valuation methods have been used.
Any Other Information No further disclosures are required.
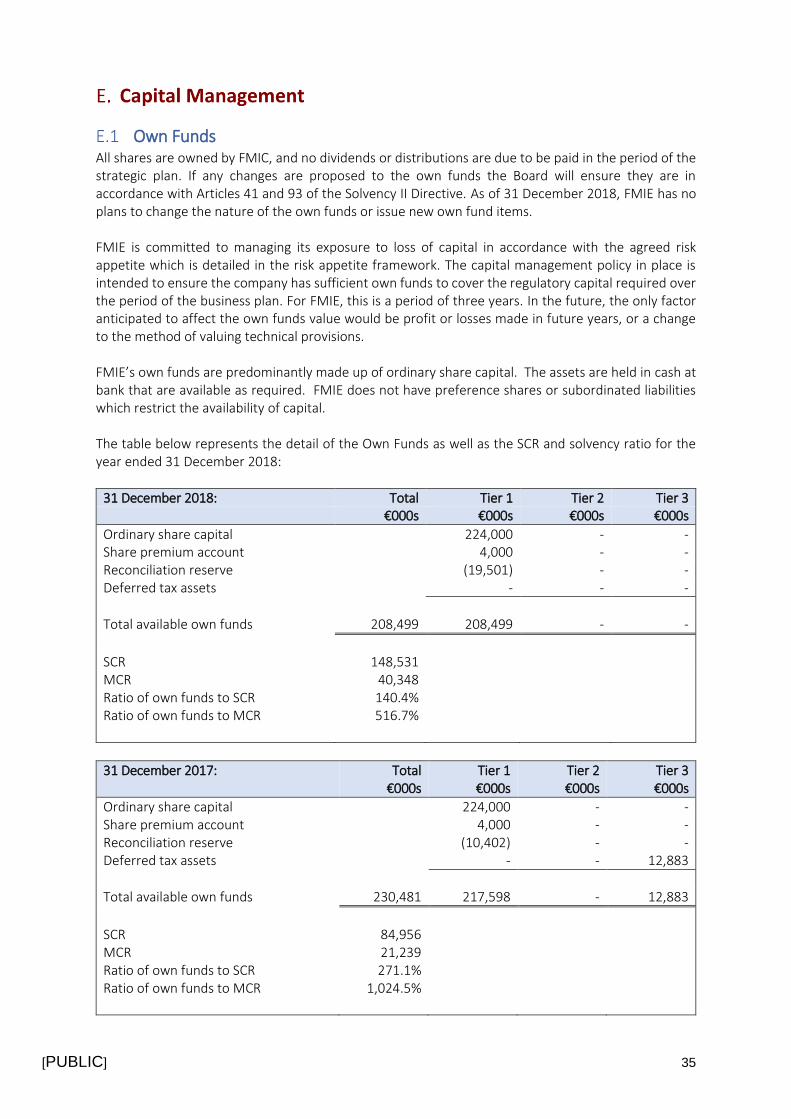
[PUBLIC] 35
Own Funds All shares are owned by FMIC, and no dividends or distributions are due to be paid in the period of the strategic plan. If any changes are proposed to the own funds the Board will ensure they are in accordance with Articles 41 and 93 of the Solvency II Directive. As of 31 December 2018, FMIE has no plans to change the nature of the own funds or issue new own fund items. FMIE is committed to managing its exposure to loss of capital in accordance with the agreed risk appetite which is detailed in the risk appetite framework. The capital management policy in place is intended to ensure the company has sufficient own funds to cover the regulatory capital required over the period of the business plan. For FMIE, this is a period of three years. In the future, the only factor anticipated to affect the own funds value would be profit or losses made in future years, or a change to the method of valuing technical provisions. FMIE’s own funds are predominantly made up of ordinary share capital. The assets are held in cash at bank that are available as required. FMIE does not have preference shares or subordinated liabilities which restrict the availability of capital. The table below represents the detail of the Own Funds as well as the SCR and solvency ratio for the year ended 31 December 2018:
31 December 2018: Total Tier 1 Tier 2 Tier 3 €000s €000s €000s €000s
Ordinary share capital 224,000 - - Share premium account 4,000 - - Reconciliation reserve (19,501) - - Deferred tax assets - - -
Total available own funds 208,499 208,499 - -
SCR 148,531 MCR 40,348 Ratio of own funds to SCR 140.4% Ratio of own funds to MCR 516.7%
31 December 2017: Total Tier 1 Tier 2 Tier 3 €000s €000s €000s €000s
Ordinary share capital 224,000 - - Share premium account 4,000 - - Reconciliation reserve (10,402) - - Deferred tax assets - - 12,883
Total available own funds 230,481 217,598 - 12,883
SCR 84,956 MCR 21,239 Ratio of own funds to SCR 271.1% Ratio of own funds to MCR 1,024.5%
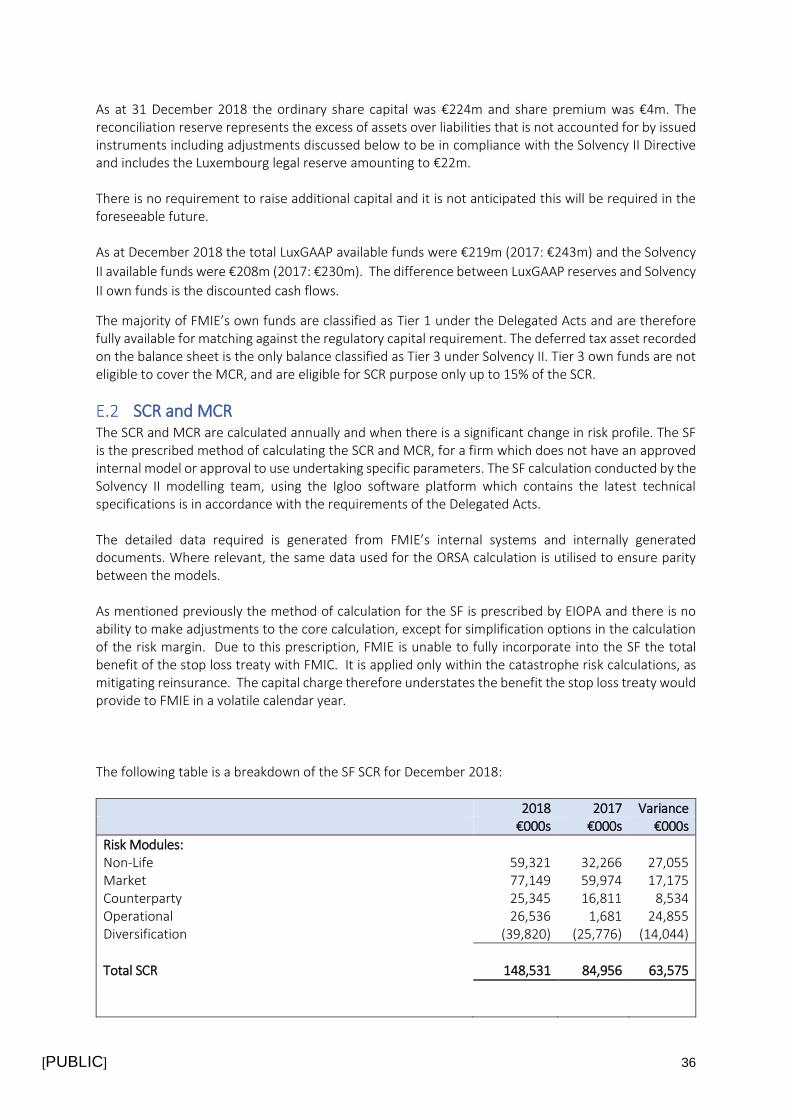
[PUBLIC] 36
As at 31 December 2018 the ordinary share capital was €224m and share premium was €4m. The reconciliation reserve represents the excess of assets over liabilities that is not accounted for by issued instruments including adjustments discussed below to be in compliance with the Solvency II Directive and includes the Luxembourg legal reserve amounting to €22m. There is no requirement to raise additional capital and it is not anticipated this will be required in the foreseeable future. As at December 2018 the total LuxGAAP available funds were €219m (2017: €243m) and the Solvency
II available funds were €208m (2017: €230m). The difference between LuxGAAP reserves and Solvency
II own funds is the discounted cash flows.
The majority of FMIE’s own funds are classified as Tier 1 under the Delegated Acts and are therefore fully available for matching against the regulatory capital requirement. The deferred tax asset recorded on the balance sheet is the only balance classified as Tier 3 under Solvency II. Tier 3 own funds are not eligible to cover the MCR, and are eligible for SCR purpose only up to 15% of the SCR.
SCR and MCR The SCR and MCR are calculated annually and when there is a significant change in risk profile. The SF is the prescribed method of calculating the SCR and MCR, for a firm which does not have an approved internal model or approval to use undertaking specific parameters. The SF calculation conducted by the Solvency II modelling team, using the Igloo software platform which contains the latest technical specifications is in accordance with the requirements of the Delegated Acts. The detailed data required is generated from FMIE’s internal systems and internally generated documents. Where relevant, the same data used for the ORSA calculation is utilised to ensure parity between the models. As mentioned previously the method of calculation for the SF is prescribed by EIOPA and there is no ability to make adjustments to the core calculation, except for simplification options in the calculation of the risk margin. Due to this prescription, FMIE is unable to fully incorporate into the SF the total benefit of the stop loss treaty with FMIC. It is applied only within the catastrophe risk calculations, as mitigating reinsurance. The capital charge therefore understates the benefit the stop loss treaty would provide to FMIE in a volatile calendar year. The following table is a breakdown of the SF SCR for December 2018:
2018 2017 Variance €000s €000s €000s
Risk Modules: Non-Life 59,321 32,266 27,055 Market 77,149 59,974 17,175 Counterparty 25,345 16,811 8,534 Operational 26,536 1,681 24,855 Diversification (39,820) (25,776) (14,044)
Total SCR 148,531 84,956 63,575
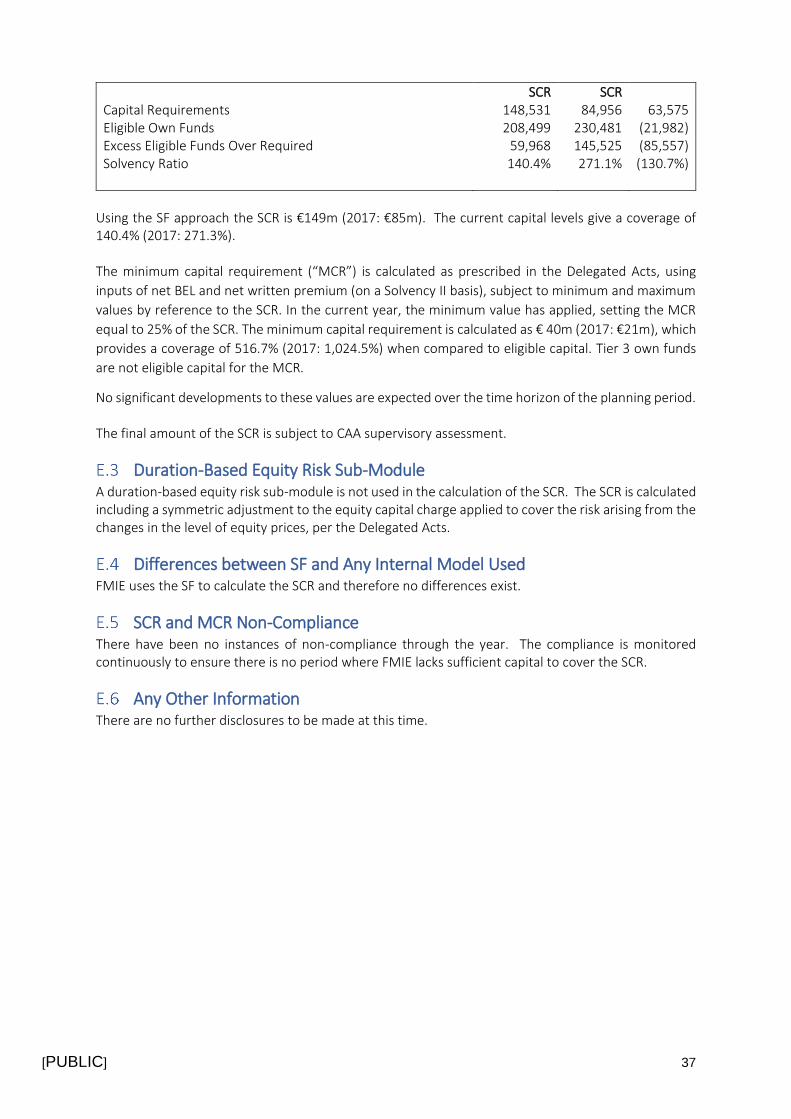
[PUBLIC] 37
SCR SCR Capital Requirements 148,531 84,956 63,575 Eligible Own Funds 208,499 230,481 (21,982) Excess Eligible Funds Over Required 59,968 145,525 (85,557) Solvency Ratio 140.4% 271.1% (130.7%)
Using the SF approach the SCR is €149m (2017: €85m). The current capital levels give a coverage of 140.4% (2017: 271.3%). The minimum capital requirement (“MCR”) is calculated as prescribed in the Delegated Acts, using
inputs of net BEL and net written premium (on a Solvency II basis), subject to minimum and maximum
values by reference to the SCR. In the current year, the minimum value has applied, setting the MCR
equal to 25% of the SCR. The minimum capital requirement is calculated as € 40m (2017: €21m), which
provides a coverage of 516.7% (2017: 1,024.5%) when compared to eligible capital. Tier 3 own funds
are not eligible capital for the MCR.
No significant developments to these values are expected over the time horizon of the planning period. The final amount of the SCR is subject to CAA supervisory assessment.
Duration-Based Equity Risk Sub-Module A duration-based equity risk sub-module is not used in the calculation of the SCR. The SCR is calculated including a symmetric adjustment to the equity capital charge applied to cover the risk arising from the changes in the level of equity prices, per the Delegated Acts.
Differences between SF and Any Internal Model Used FMIE uses the SF to calculate the SCR and therefore no differences exist.
SCR and MCR Non-Compliance There have been no instances of non-compliance through the year. The compliance is monitored continuously to ensure there is no period where FMIE lacks sufficient capital to cover the SCR.
Any Other Information There are no further disclosures to be made at this time.
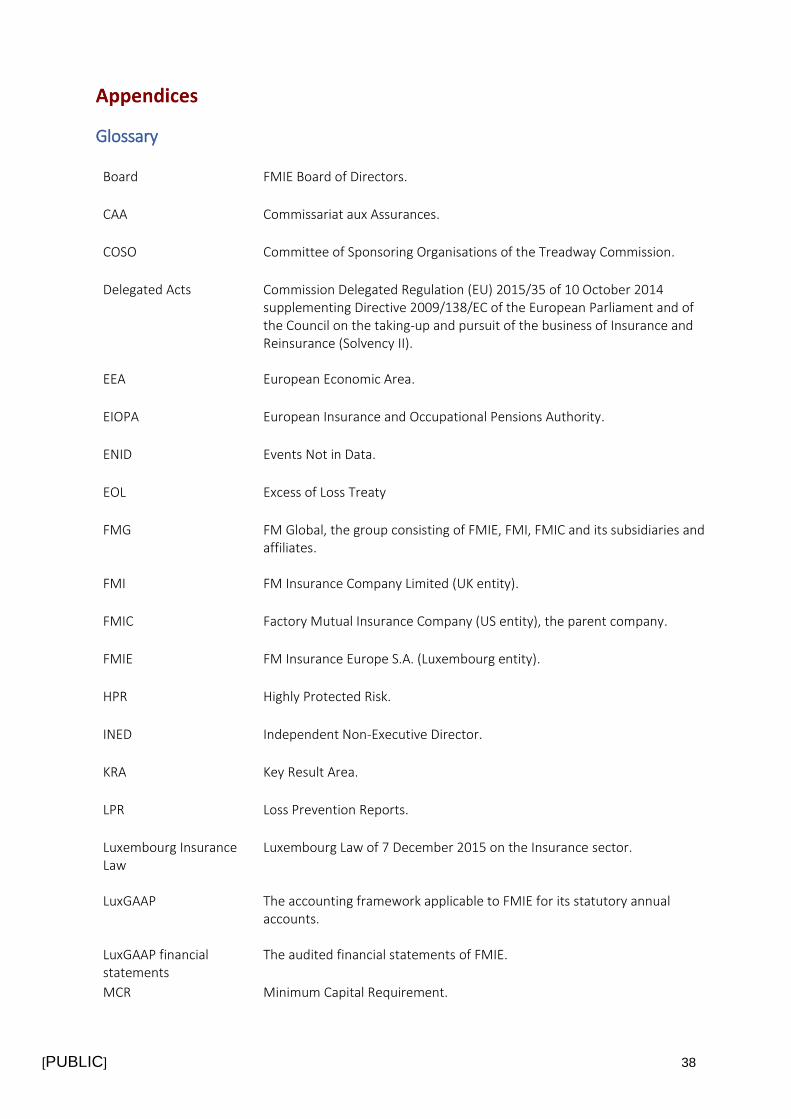
[PUBLIC] 38
Glossary
Board FMIE Board of Directors.
CAA Commissariat aux Assurances.
COSO Committee of Sponsoring Organisations of the Treadway Commission.
Delegated Acts Commission Delegated Regulation (EU) 2015/35 of 10 October 2014 supplementing Directive 2009/138/EC of the European Parliament and of the Council on the taking-up and pursuit of the business of Insurance and Reinsurance (Solvency II).
EEA European Economic Area.
EIOPA European Insurance and Occupational Pensions Authority.
ENID Events Not in Data.
EOL Excess of Loss Treaty
FMG FM Global, the group consisting of FMIE, FMI, FMIC and its subsidiaries and affiliates.
FMI FM Insurance Company Limited (UK entity).
FMIC Factory Mutual Insurance Company (US entity), the parent company.
FMIE FM Insurance Europe S.A. (Luxembourg entity).
HPR Highly Protected Risk.
INED Independent Non-Executive Director.
KRA Key Result Area.
LPR Loss Prevention Reports.
Luxembourg Insurance Law
Luxembourg Law of 7 December 2015 on the Insurance sector.
LuxGAAP The accounting framework applicable to FMIE for its statutory annual accounts.
LuxGAAP financial statements
The audited financial statements of FMIE.
MCR Minimum Capital Requirement.
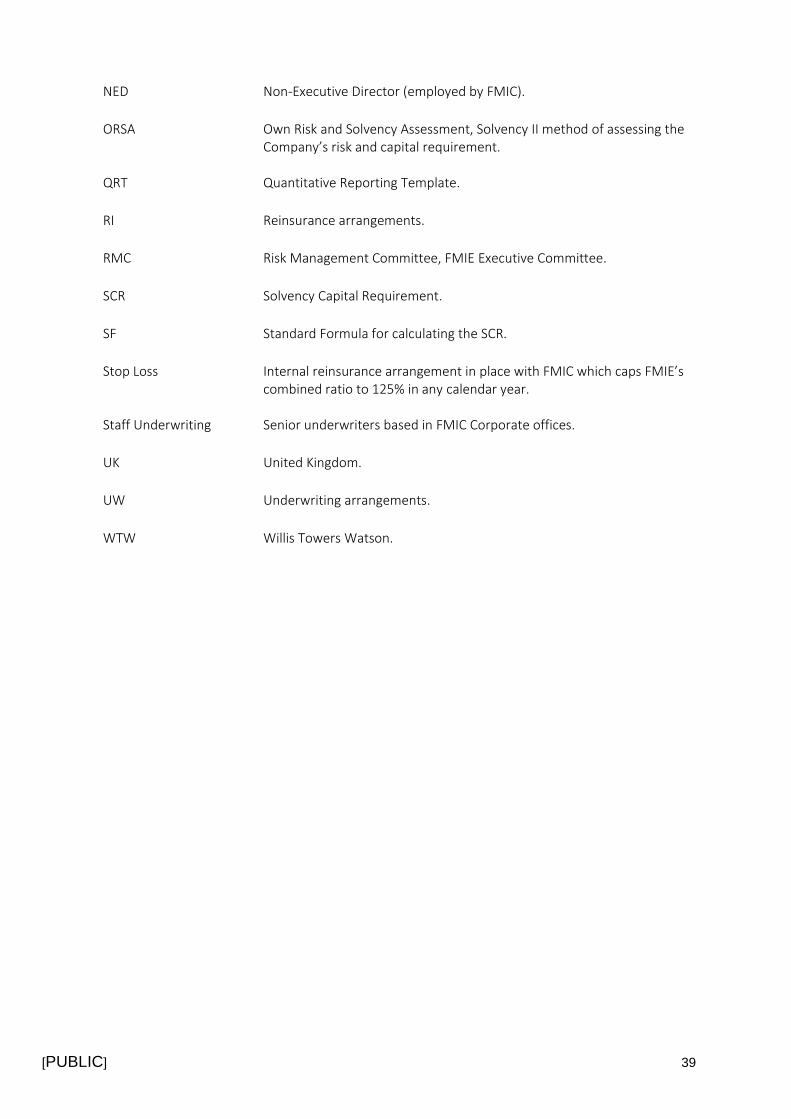
[PUBLIC] 39
NED Non-Executive Director (employed by FMIC).
ORSA Own Risk and Solvency Assessment, Solvency II method of assessing the Company’s risk and capital requirement.
QRT Quantitative Reporting Template.
RI Reinsurance arrangements.
RMC Risk Management Committee, FMIE Executive Committee.
SCR Solvency Capital Requirement.
SF Standard Formula for calculating the SCR.
Stop Loss Internal reinsurance arrangement in place with FMIC which caps FMIE’s combined ratio to 125% in any calendar year.
Staff Underwriting Senior underwriters based in FMIC Corporate offices.
UK United Kingdom.
UW Underwriting arrangements.
WTW Willis Towers Watson.
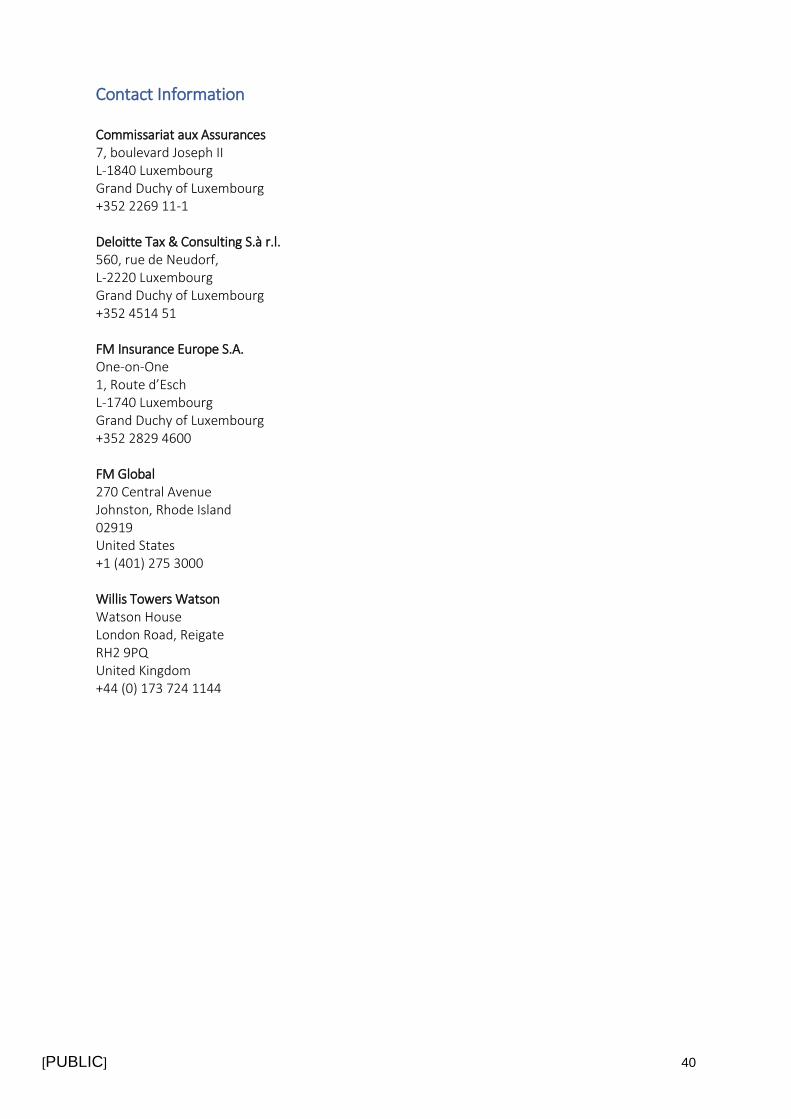
[PUBLIC] 40
Contact Information Commissariat aux Assurances 7, boulevard Joseph II L-1840 Luxembourg Grand Duchy of Luxembourg +352 2269 11-1 Deloitte Tax & Consulting S.à r.l. 560, rue de Neudorf, L-2220 Luxembourg Grand Duchy of Luxembourg +352 4514 51 FM Insurance Europe S.A. One-on-One 1, Route d’Esch L-1740 Luxembourg Grand Duchy of Luxembourg +352 2829 4600 FM Global 270 Central Avenue Johnston, Rhode Island 02919 United States +1 (401) 275 3000 Willis Towers Watson Watson House London Road, Reigate RH2 9PQ United Kingdom +44 (0) 173 724 1144
[PUBLIC] 41
Reporting Templates
• S.02.01.02 – Balance sheet
• S.05.01.02 – Premiums, claims and expenses by line of business
• S.05.02.01 – Premiums, claims and expenses by country
• S.17.01.02 – Non-Life Technical Provisions
• S.19.01.21 – Non-Life insurance claims
• S.23.01.01 – Own Funds
• S.25.01.21 – Solvency Capital Requirement – for undertakings on Standard Formula
• S.28.01.01 – Minimum Capital Requirement – Only life or only non-life insurance or
reinsurance activity
FM Insurance Europe
S.A.
Solvency and Financial
Condition Report
Disclosures
31 December
2018
(Monetary amounts in EUR thousands)
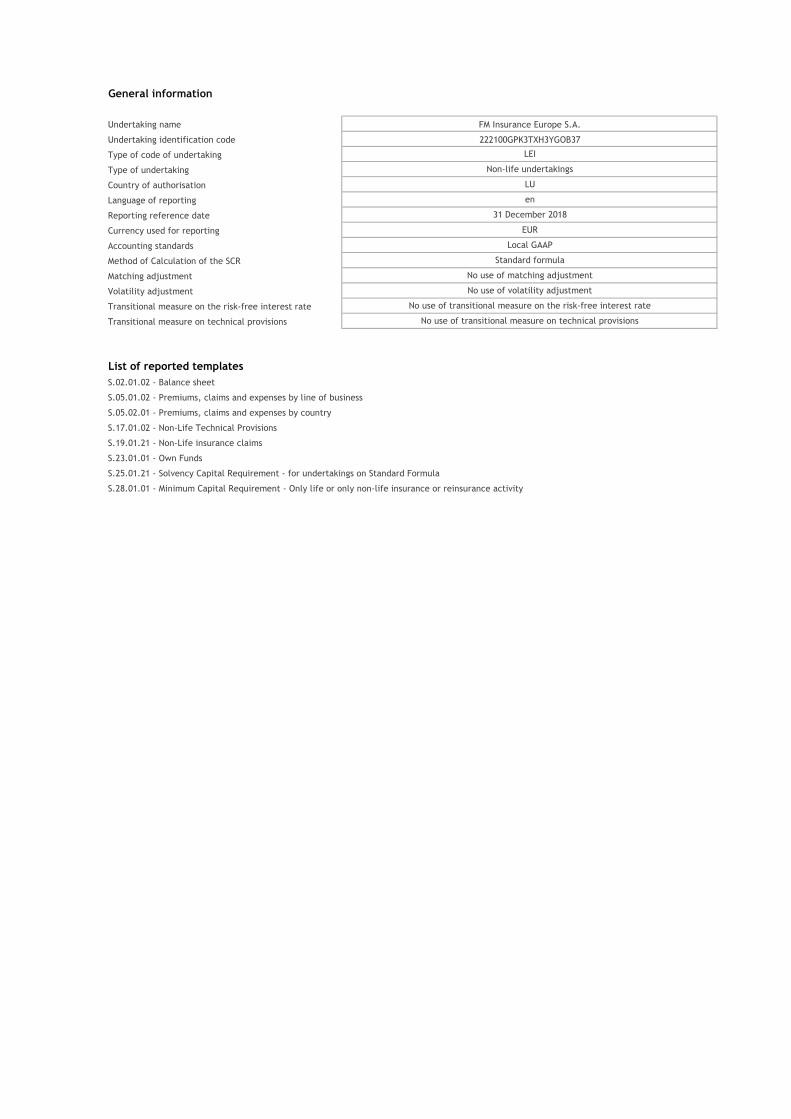
General information
Undertaking name FM Insurance Europe S.A.
Undertaking identification code 222100GPK3TXH3YGOB37
Type of code of undertaking LEI
Type of undertaking Non-life undertakings
Country of authorisation LU
Language of reporting en
Reporting reference date 31 December 2018
Currency used for reporting EUR
Accounting standards Local GAAP
Method of Calculation of the SCR Standard formula
Matching adjustment No use of matching adjustment
Volatility adjustment No use of volatility adjustment
Transitional measure on the risk-free interest rate No use of transitional measure on the risk-free interest rate
Transitional measure on technical provisions No use of transitional measure on technical provisions
List of reported templates
S.02.01.02 - Balance sheet
S.05.01.02 - Premiums, claims and expenses by line of business
S.05.02.01 - Premiums, claims and expenses by country
S.17.01.02 - Non-Life Technical Provisions
S.19.01.21 - Non-Life insurance claims
S.23.01.01 - Own Funds
S.25.01.21 - Solvency Capital Requirement - for undertakings on Standard Formula
S.28.01.01 - Minimum Capital Requirement - Only life or only non-life insurance or reinsurance activity
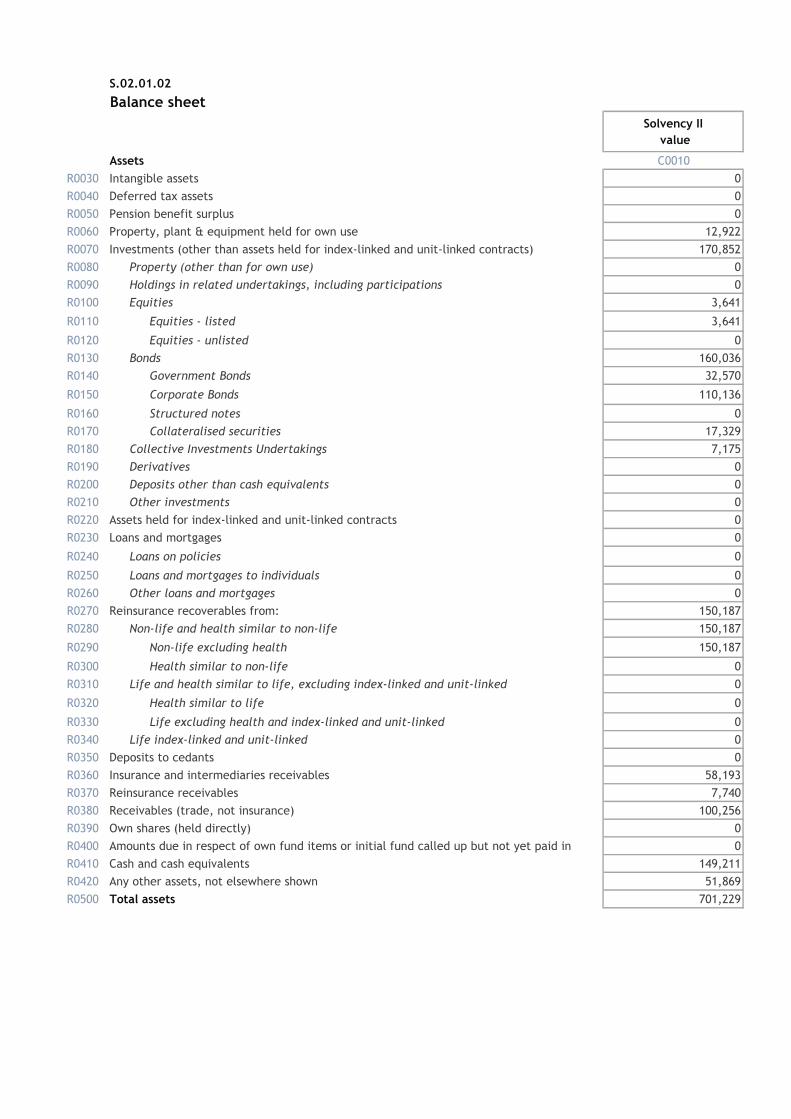
S.02.01.02
Balance sheet
Solvency II
value
Assets C0010
R0030 Intangible assets 0
R0040 Deferred tax assets 0
R0050 Pension benefit surplus 0
R0060 Property, plant & equipment held for own use 12,922
R0070 Investments (other than assets held for index-linked and unit-linked contracts) 170,852
R0080 Property (other than for own use) 0
R0090 Holdings in related undertakings, including participations 0
R0100 Equities 3,641
R0110 Equities - listed 3,641
R0120 Equities - unlisted 0
R0130 Bonds 160,036
R0140 Government Bonds 32,570
R0150 Corporate Bonds 110,136
R0160 Structured notes 0
R0170 Collateralised securities 17,329
R0180 Collective Investments Undertakings 7,175
R0190 Derivatives 0
R0200 Deposits other than cash equivalents 0
R0210 Other investments 0
R0220 Assets held for index-linked and unit-linked contracts 0
R0230 Loans and mortgages 0
R0240 Loans on policies 0
R0250 Loans and mortgages to individuals 0
R0260 Other loans and mortgages 0
R0270 Reinsurance recoverables from: 150,187
R0280 Non-life and health similar to non-life 150,187
R0290 Non-life excluding health 150,187
R0300 Health similar to non-life 0
R0310 Life and health similar to life, excluding index-linked and unit-linked 0
R0320 Health similar to life 0
R0330 Life excluding health and index-linked and unit-linked 0
R0340 Life index-linked and unit-linked 0
R0350 Deposits to cedants 0
R0360 Insurance and intermediaries receivables 58,193
R0370 Reinsurance receivables 7,740
R0380 Receivables (trade, not insurance) 100,256
R0390 Own shares (held directly) 0
R0400 Amounts due in respect of own fund items or initial fund called up but not yet paid in 0
R0410 Cash and cash equivalents 149,211
R0420 Any other assets, not elsewhere shown 51,869
R0500 Total assets 701,229
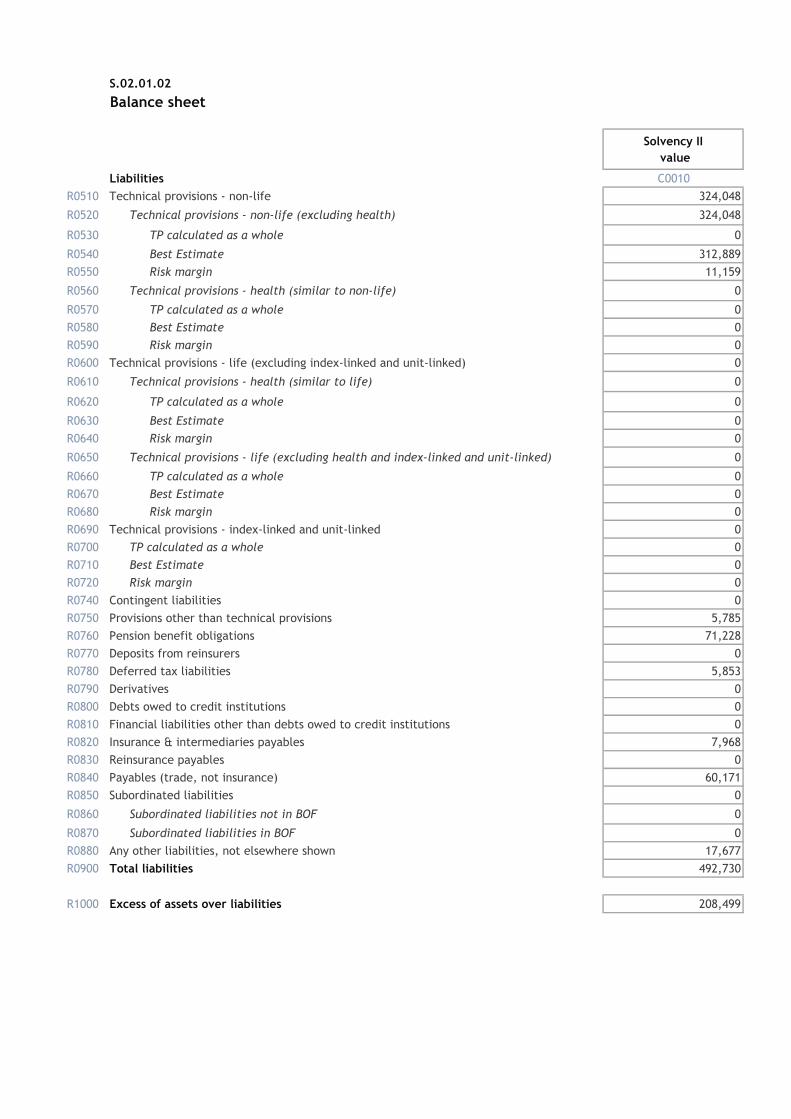
S.02.01.02
Balance sheet
Solvency II
value
Liabilities C0010
R0510 Technical provisions - non-life 324,048
R0520 Technical provisions - non-life (excluding health) 324,048
R0530 TP calculated as a whole 0
R0540 Best Estimate 312,889
R0550 Risk margin 11,159
R0560 Technical provisions - health (similar to non-life) 0
R0570 TP calculated as a whole 0
R0580 Best Estimate 0
R0590 Risk margin 0
R0600 Technical provisions - life (excluding index-linked and unit-linked) 0
R0610 Technical provisions - health (similar to life) 0
R0620 TP calculated as a whole 0
R0630 Best Estimate 0
R0640 Risk margin 0
R0650 Technical provisions - life (excluding health and index-linked and unit-linked) 0
R0660 TP calculated as a whole 0
R0670 Best Estimate 0
R0680 Risk margin 0
R0690 Technical provisions - index-linked and unit-linked 0
R0700 TP calculated as a whole 0
R0710 Best Estimate 0
R0720 Risk margin 0
R0740 Contingent liabilities 0
R0750 Provisions other than technical provisions 5,785
R0760 Pension benefit obligations 71,228
R0770 Deposits from reinsurers 0
R0780 Deferred tax liabilities 5,853
R0790 Derivatives 0
R0800 Debts owed to credit institutions 0
R0810 Financial liabilities other than debts owed to credit institutions 0
R0820 Insurance & intermediaries payables 7,968
R0830 Reinsurance payables 0
R0840 Payables (trade, not insurance) 60,171
R0850 Subordinated liabilities 0
R0860 Subordinated liabilities not in BOF 0
R0870 Subordinated liabilities in BOF 0
R0880 Any other liabilities, not elsewhere shown 17,677
R0900 Total liabilities 492,730
R1000 Excess of assets over liabilities 208,499
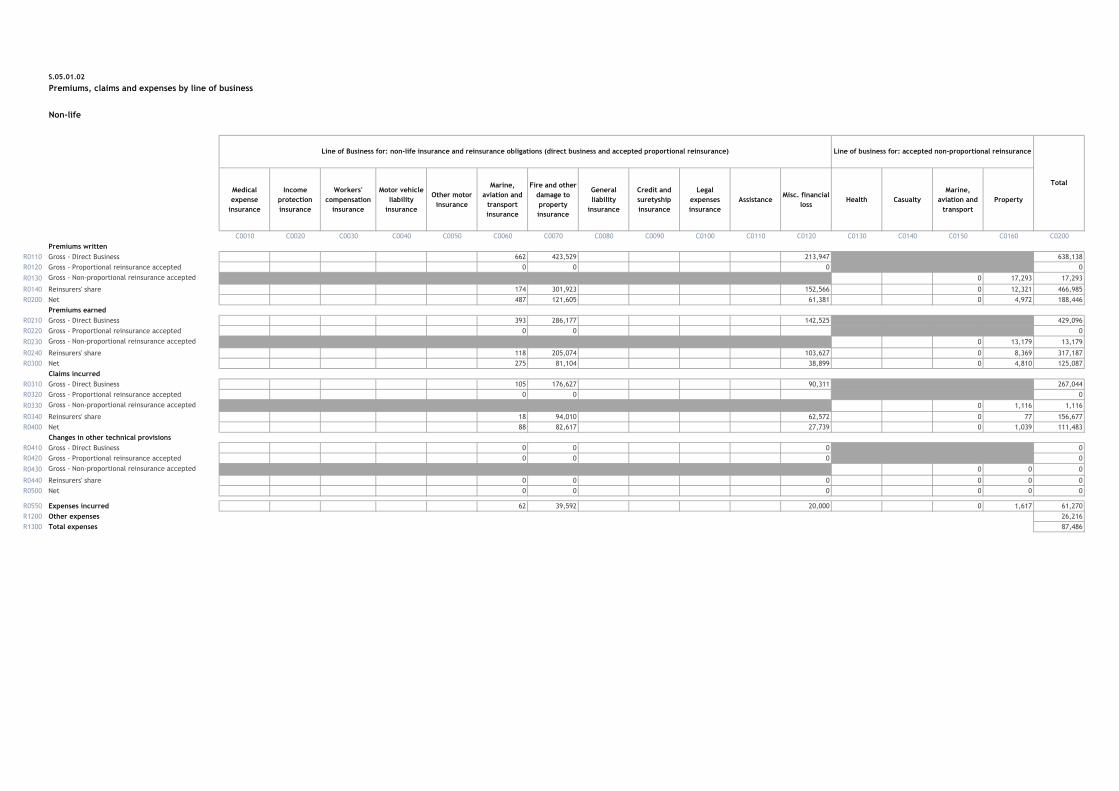
S.05.01.02
Non-life
Medical
expense
insurance
Income
protection
insurance
Workers'
compensation
insurance
Motor vehicle
liability
insurance
Other motor
insurance
Marine,
aviation and
transport
insurance
Fire and other
damage to
property
insurance
General
liability
insurance
Credit and
suretyship
insurance
Legal
expenses
insurance
AssistanceMisc. financial
lossHealth Casualty
Marine,
aviation and
transport
Property
C0010 C0020 C0030 C0040 C0050 C0060 C0070 C0080 C0090 C0100 C0110 C0120 C0130 C0140 C0150 C0160 C0200
Premiums written
R0110 Gross - Direct Business 662 423,529 213,947 638,138
R0120 Gross - Proportional reinsurance accepted 0 0 0 0
R0130 Gross - Non-proportional reinsurance accepted 0 17,293 17,293
R0140 Reinsurers' share 174 301,923 152,566 0 12,321 466,985
R0200 Net 487 121,605 61,381 0 4,972 188,446
Premiums earned
R0210 Gross - Direct Business 393 286,177 142,525 429,096
R0220 Gross - Proportional reinsurance accepted 0 0 0
R0230 Gross - Non-proportional reinsurance accepted 0 13,179 13,179
R0240 Reinsurers' share 118 205,074 103,627 0 8,369 317,187
R0300 Net 275 81,104 38,899 0 4,810 125,087
Claims incurred
R0310 Gross - Direct Business 105 176,627 90,311 267,044
R0320 Gross - Proportional reinsurance accepted 0 0 0
R0330 Gross - Non-proportional reinsurance accepted 0 1,116 1,116
R0340 Reinsurers' share 18 94,010 62,572 0 77 156,677
R0400 Net 88 82,617 27,739 0 1,039 111,483
Changes in other technical provisions
R0410 Gross - Direct Business 0 0 0 0
R0420 Gross - Proportional reinsurance accepted 0 0 0 0
R0430 Gross - Non-proportional reinsurance accepted 0 0 0
R0440 Reinsurers' share 0 0 0 0 0 0
R0500 Net 0 0 0 0 0 0
R0550 Expenses incurred 62 39,592 20,000 0 1,617 61,270
R1200 Other expenses 26,216
R1300 Total expenses 87,486
Premiums, claims and expenses by line of business
Line of Business for: non-life insurance and reinsurance obligations (direct business and accepted proportional reinsurance) Line of business for: accepted non-proportional reinsurance
Total
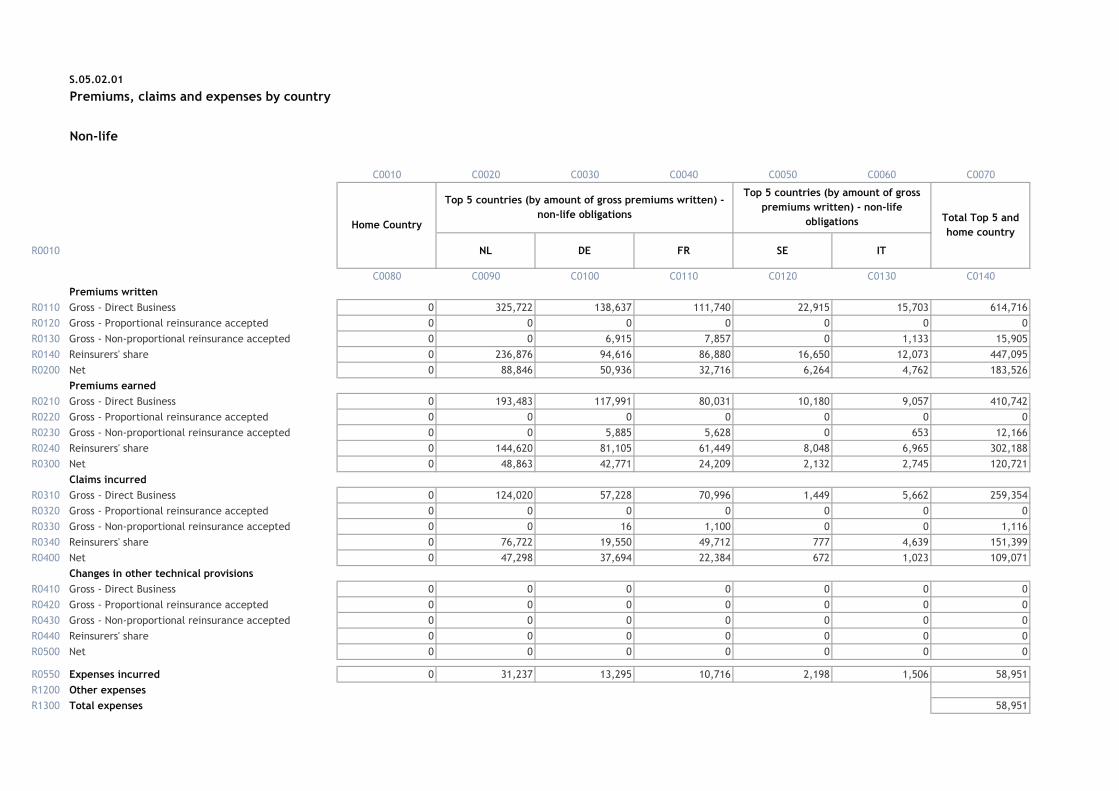
S.05.02.01
Premiums, claims and expenses by country
Non-life
C0010 C0020 C0030 C0040 C0050 C0060 C0070
R0010 NL DE FR SE IT
C0080 C0090 C0100 C0110 C0120 C0130 C0140
Premiums written
R0110 Gross - Direct Business 0 325,722 138,637 111,740 22,915 15,703 614,716
R0120 Gross - Proportional reinsurance accepted 0 0 0 0 0 0 0
R0130 Gross - Non-proportional reinsurance accepted 0 0 6,915 7,857 0 1,133 15,905
R0140 Reinsurers' share 0 236,876 94,616 86,880 16,650 12,073 447,095
R0200 Net 0 88,846 50,936 32,716 6,264 4,762 183,526
Premiums earned
R0210 Gross - Direct Business 0 193,483 117,991 80,031 10,180 9,057 410,742
R0220 Gross - Proportional reinsurance accepted 0 0 0 0 0 0 0
R0230 Gross - Non-proportional reinsurance accepted 0 0 5,885 5,628 0 653 12,166
R0240 Reinsurers' share 0 144,620 81,105 61,449 8,048 6,965 302,188
R0300 Net 0 48,863 42,771 24,209 2,132 2,745 120,721
Claims incurred
R0310 Gross - Direct Business 0 124,020 57,228 70,996 1,449 5,662 259,354
R0320 Gross - Proportional reinsurance accepted 0 0 0 0 0 0 0
R0330 Gross - Non-proportional reinsurance accepted 0 0 16 1,100 0 0 1,116
R0340 Reinsurers' share 0 76,722 19,550 49,712 777 4,639 151,399
R0400 Net 0 47,298 37,694 22,384 672 1,023 109,071
Changes in other technical provisions
R0410 Gross - Direct Business 0 0 0 0 0 0 0
R0420 Gross - Proportional reinsurance accepted 0 0 0 0 0 0 0
R0430 Gross - Non-proportional reinsurance accepted 0 0 0 0 0 0 0
R0440 Reinsurers' share 0 0 0 0 0 0 0
R0500 Net 0 0 0 0 0 0 0
R0550 Expenses incurred 0 31,237 13,295 10,716 2,198 1,506 58,951
R1200 Other expenses
R1300 Total expenses 58,951
Home Country
Top 5 countries (by amount of gross premiums written) -
non-life obligations
Top 5 countries (by amount of gross
premiums written) - non-life
obligations Total Top 5 and
home country
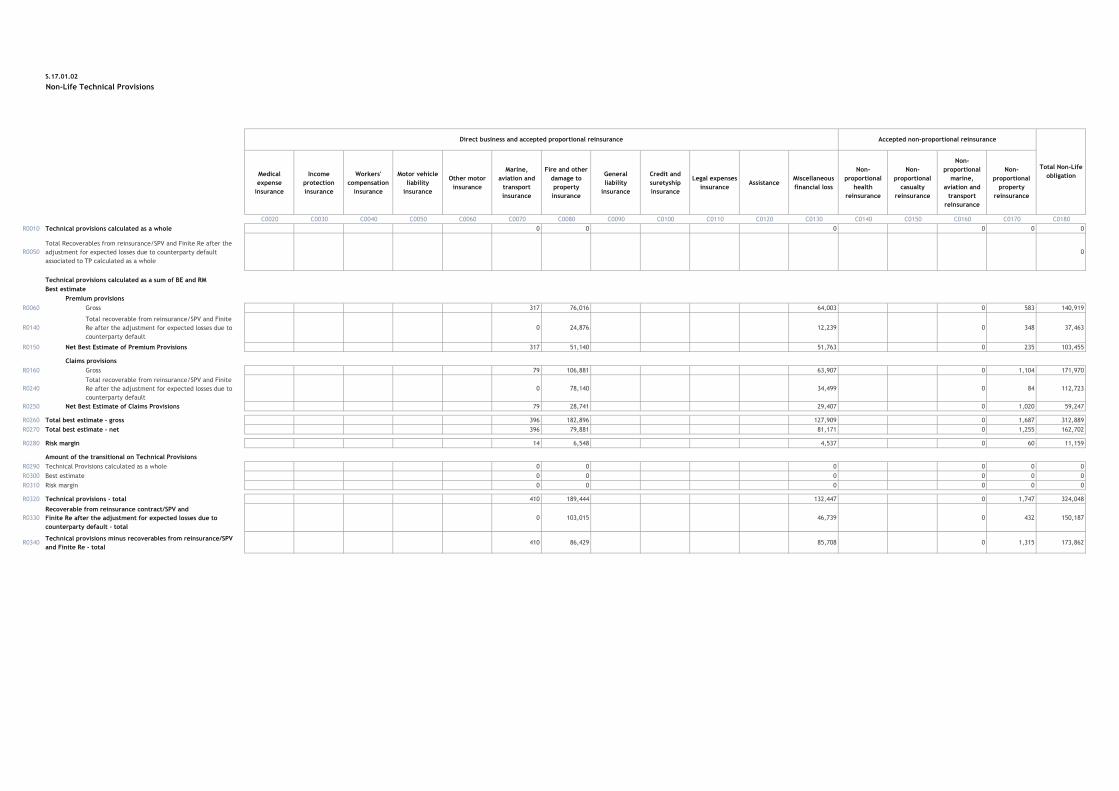
S.17.01.02
Non-Life Technical Provisions
Medical
expense
insurance
Income
protection
insurance
Workers'
compensation
insurance
Motor vehicle
liability
insurance
Other motor
insurance
Marine,
aviation and
transport
insurance
Fire and other
damage to
property
insurance
General
liability
insurance
Credit and
suretyship
insurance
Legal expenses
insuranceAssistance
Miscellaneous
financial loss
Non-
proportional
health
reinsurance
Non-
proportional
casualty
reinsurance
Non-
proportional
marine,
aviation and
transport
reinsurance
Non-
proportional
property
reinsurance
C0020 C0030 C0040 C0050 C0060 C0070 C0080 C0090 C0100 C0110 C0120 C0130 C0140 C0150 C0160 C0170 C0180
R0010 Technical provisions calculated as a whole 0 0 0 0 0 0
R0050
Total Recoverables from reinsurance/SPV and Finite Re after the
adjustment for expected losses due to counterparty default
associated to TP calculated as a whole
0
Technical provisions calculated as a sum of BE and RM
Best estimate
Premium provisions
R0060 Gross 317 76,016 64,003 0 583 140,919
R0140
Total recoverable from reinsurance/SPV and Finite
Re after the adjustment for expected losses due to
counterparty default
0 24,876 12,239 0 348 37,463
R0150 Net Best Estimate of Premium Provisions 317 51,140 51,763 0 235 103,455
Claims provisions
R0160 Gross 79 106,881 63,907 0 1,104 171,970
R0240
Total recoverable from reinsurance/SPV and Finite
Re after the adjustment for expected losses due to
counterparty default
0 78,140 34,499 0 84 112,723
R0250 Net Best Estimate of Claims Provisions 79 28,741 29,407 0 1,020 59,247
R0260 Total best estimate - gross 396 182,896 127,909 0 1,687 312,889
R0270 Total best estimate - net 396 79,881 81,171 0 1,255 162,702
R0280 Risk margin 14 6,548 4,537 0 60 11,159
Amount of the transitional on Technical Provisions
R0290 Technical Provisions calculated as a whole 0 0 0 0 0 0
R0300 Best estimate 0 0 0 0 0 0
R0310 Risk margin 0 0 0 0 0 0
R0320 Technical provisions - total 410 189,444 132,447 0 1,747 324,048
R0330
Recoverable from reinsurance contract/SPV and
Finite Re after the adjustment for expected losses due to
counterparty default - total
0 103,015 46,739 0 432 150,187
R0340Technical provisions minus recoverables from reinsurance/SPV
and Finite Re - total410 86,429 85,708 0 1,315 173,862
Direct business and accepted proportional reinsurance Accepted non-proportional reinsurance
Total Non-Life
obligation
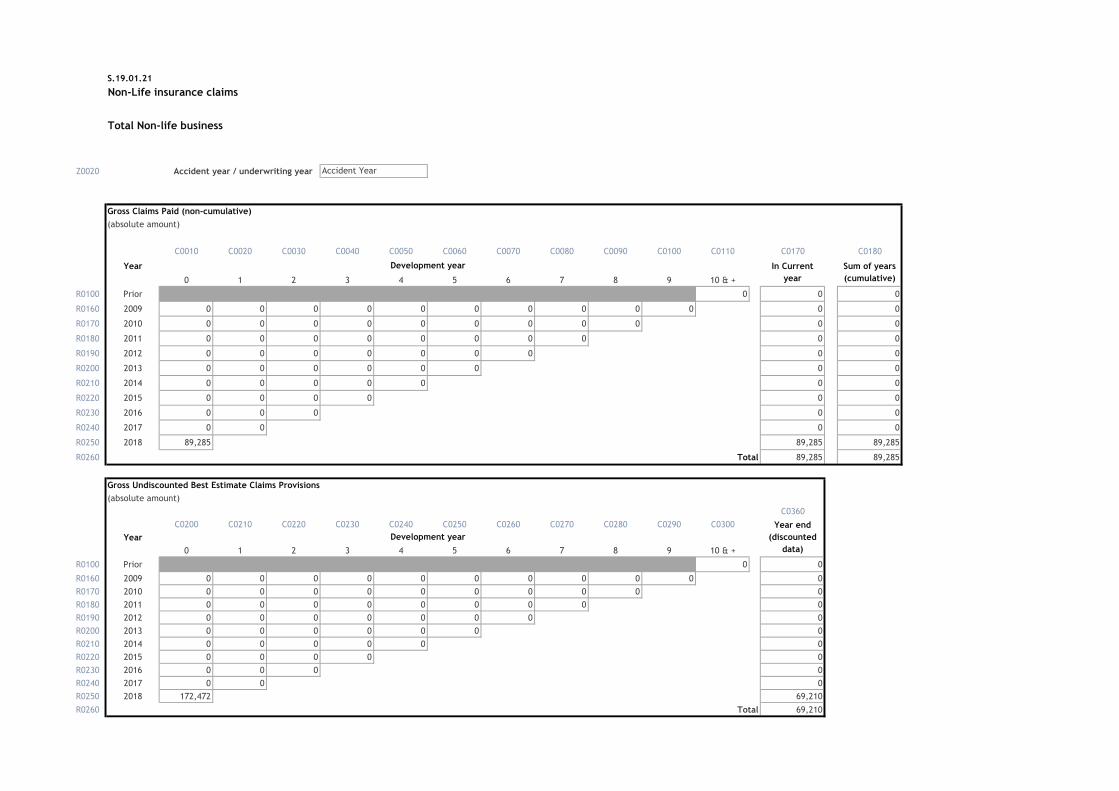
S.19.01.21
Non-Life insurance claims
Total Non-life business
Z0020 Accident year / underwriting year
Gross Claims Paid (non-cumulative)
(absolute amount)
C0010 C0020 C0030 C0040 C0050 C0060 C0070 C0080 C0090 C0100 C0110 C0170 C0180
Year
0 1 2 3 4 5 6 7 8 9 10 & +
R0100 Prior 0 0 0
R0160 2009 0 0 0 0 0 0 0 0 0 0 0 0
R0170 2010 0 0 0 0 0 0 0 0 0 0 0
R0180 2011 0 0 0 0 0 0 0 0 0 0
R0190 2012 0 0 0 0 0 0 0 0 0
R0200 2013 0 0 0 0 0 0 0 0
R0210 2014 0 0 0 0 0 0 0
R0220 2015 0 0 0 0 0 0
R0230 2016 0 0 0 0 0
R0240 2017 0 0 0 0
R0250 2018 89,285 89,285 89,285
R0260 Total 89,285 89,285
Gross Undiscounted Best Estimate Claims Provisions
(absolute amount)
C0360
C0200 C0210 C0220 C0230 C0240 C0250 C0260 C0270 C0280 C0290 C0300
Year
0 1 2 3 4 5 6 7 8 9 10 & +
R0100 Prior 0 0
R0160 2009 0 0 0 0 0 0 0 0 0 0 0
R0170 2010 0 0 0 0 0 0 0 0 0 0
R0180 2011 0 0 0 0 0 0 0 0 0
R0190 2012 0 0 0 0 0 0 0 0
R0200 2013 0 0 0 0 0 0 0
R0210 2014 0 0 0 0 0 0
R0220 2015 0 0 0 0 0
R0230 2016 0 0 0 0
R0240 2017 0 0 0
R0250 2018 172,472 69,210
R0260 Total 69,210
Accident Year
Development year In Current
year
Sum of years
(cumulative)
Year end
(discounted
data)
Development year
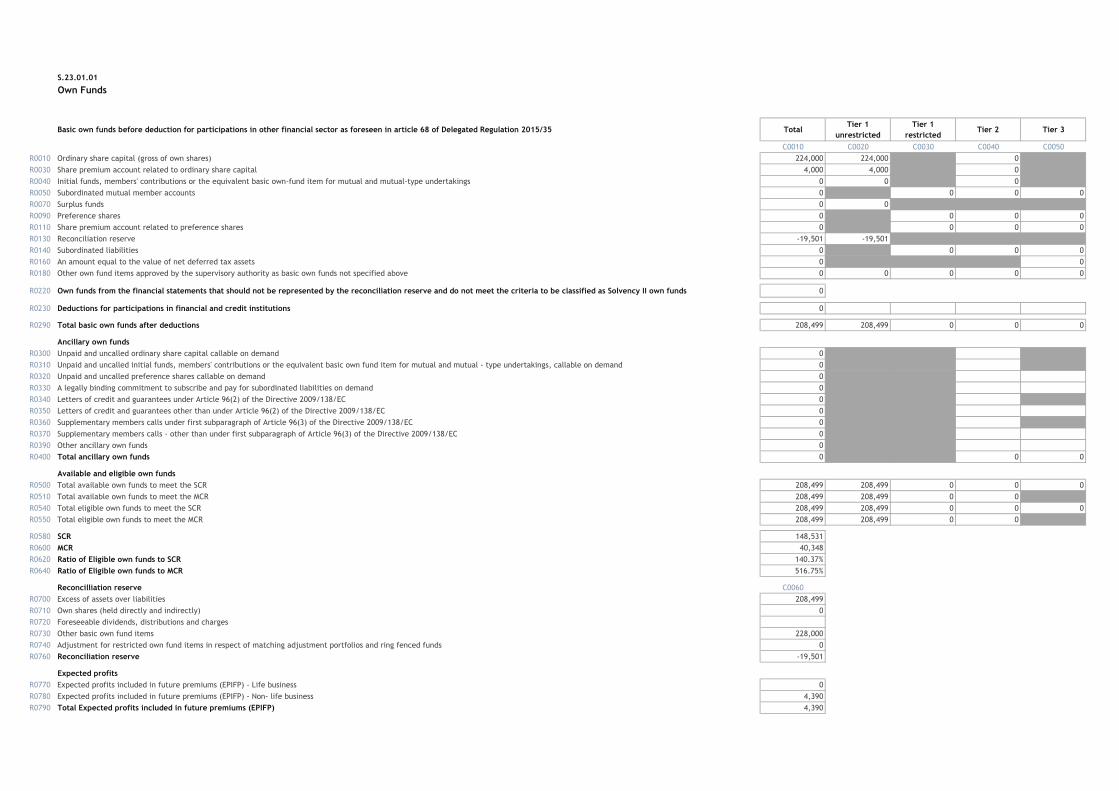
S.23.01.01
Own Funds
Basic own funds before deduction for participations in other financial sector as foreseen in article 68 of Delegated Regulation 2015/35 TotalTier 1
unrestricted
Tier 1
restrictedTier 2 Tier 3
C0010 C0020 C0030 C0040 C0050
R0010 Ordinary share capital (gross of own shares) 224,000 224,000 0
R0030 Share premium account related to ordinary share capital 4,000 4,000 0
R0040 Initial funds, members' contributions or the equivalent basic own-fund item for mutual and mutual-type undertakings 0 0 0
R0050 Subordinated mutual member accounts 0 0 0 0
R0070 Surplus funds 0 0
R0090 Preference shares 0 0 0 0
R0110 Share premium account related to preference shares 0 0 0 0
R0130 Reconciliation reserve -19,501 -19,501
R0140 Subordinated liabilities 0 0 0 0
R0160 An amount equal to the value of net deferred tax assets 0 0
R0180 Other own fund items approved by the supervisory authority as basic own funds not specified above 0 0 0 0 0
R0220 Own funds from the financial statements that should not be represented by the reconciliation reserve and do not meet the criteria to be classified as Solvency II own funds 0
R0230 Deductions for participations in financial and credit institutions 0
R0290 Total basic own funds after deductions 208,499 208,499 0 0 0
Ancillary own funds
R0300 Unpaid and uncalled ordinary share capital callable on demand 0
R0310 Unpaid and uncalled initial funds, members' contributions or the equivalent basic own fund item for mutual and mutual - type undertakings, callable on demand 0
R0320 Unpaid and uncalled preference shares callable on demand 0
R0330 A legally binding commitment to subscribe and pay for subordinated liabilities on demand 0
R0340 Letters of credit and guarantees under Article 96(2) of the Directive 2009/138/EC 0
R0350 Letters of credit and guarantees other than under Article 96(2) of the Directive 2009/138/EC 0
R0360 Supplementary members calls under first subparagraph of Article 96(3) of the Directive 2009/138/EC 0
R0370 Supplementary members calls - other than under first subparagraph of Article 96(3) of the Directive 2009/138/EC 0
R0390 Other ancillary own funds 0
R0400 Total ancillary own funds 0 0 0
Available and eligible own funds
R0500 Total available own funds to meet the SCR 208,499 208,499 0 0 0
R0510 Total available own funds to meet the MCR 208,499 208,499 0 0
R0540 Total eligible own funds to meet the SCR 208,499 208,499 0 0 0
R0550 Total eligible own funds to meet the MCR 208,499 208,499 0 0
R0580 SCR 148,531
R0600 MCR 40,348
R0620 Ratio of Eligible own funds to SCR 140.37%
R0640 Ratio of Eligible own funds to MCR 516.75%
Reconcilliation reserve C0060
R0700 Excess of assets over liabilities 208,499
R0710 Own shares (held directly and indirectly) 0
R0720 Foreseeable dividends, distributions and charges
R0730 Other basic own fund items 228,000
R0740 Adjustment for restricted own fund items in respect of matching adjustment portfolios and ring fenced funds 0
R0760 Reconciliation reserve -19,501
Expected profits
R0770 Expected profits included in future premiums (EPIFP) - Life business 0
R0780 Expected profits included in future premiums (EPIFP) - Non- life business 4,390
R0790 Total Expected profits included in future premiums (EPIFP) 4,390
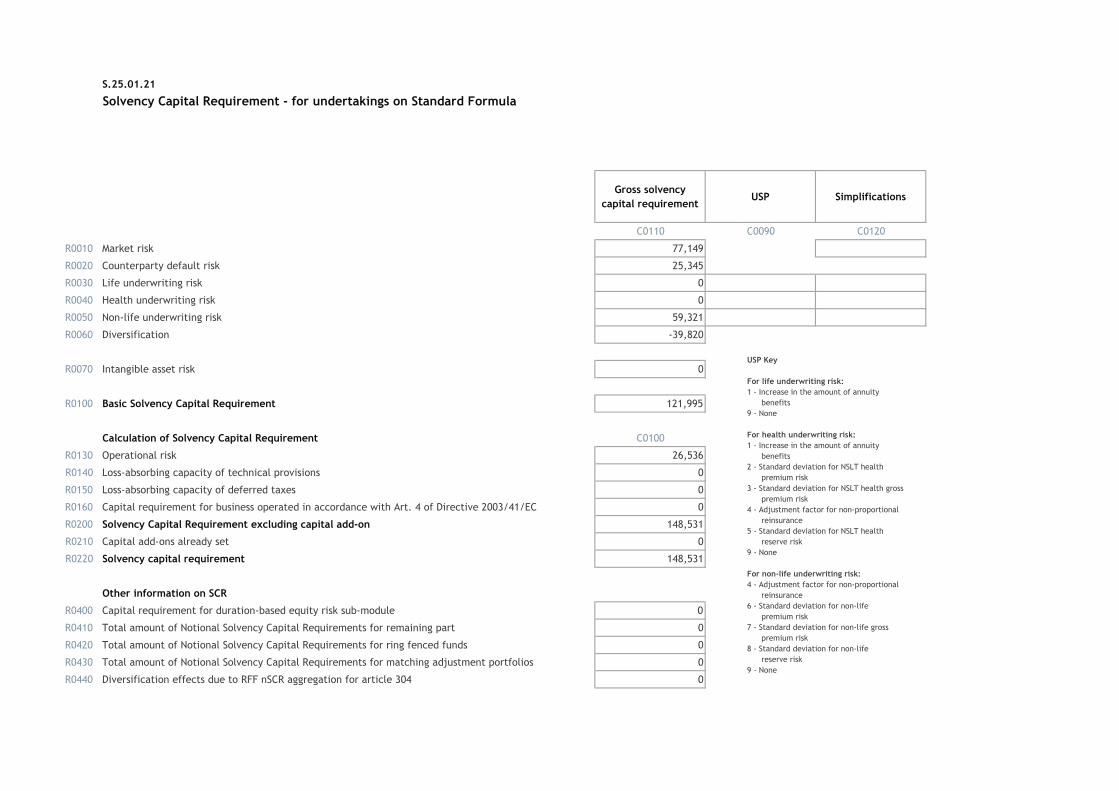
S.25.01.21
Solvency Capital Requirement - for undertakings on Standard Formula
Gross solvency
capital requirementUSP Simplifications
C0110 C0090 C0120
R0010 Market risk 77,149
R0020 Counterparty default risk 25,345
R0030 Life underwriting risk 0
R0040 Health underwriting risk 0
R0050 Non-life underwriting risk 59,321
R0060 Diversification -39,820
R0070 Intangible asset risk 0
R0100 Basic Solvency Capital Requirement 121,995
Calculation of Solvency Capital Requirement C0100
R0130 Operational risk 26,536
R0140 Loss-absorbing capacity of technical provisions 0
R0150 Loss-absorbing capacity of deferred taxes 0
R0160 Capital requirement for business operated in accordance with Art. 4 of Directive 2003/41/EC 0
R0200 Solvency Capital Requirement excluding capital add-on 148,531
R0210 Capital add-ons already set 0
R0220 Solvency capital requirement 148,531
Other information on SCR
R0400 Capital requirement for duration-based equity risk sub-module 0
R0410 Total amount of Notional Solvency Capital Requirements for remaining part 0
R0420 Total amount of Notional Solvency Capital Requirements for ring fenced funds 0
R0430 Total amount of Notional Solvency Capital Requirements for matching adjustment portfolios 0
R0440 Diversification effects due to RFF nSCR aggregation for article 304 0
USP Key
For life underwriting risk:
1 - Increase in the amount of annuity
benefits
9 - None
For health underwriting risk:
1 - Increase in the amount of annuity
benefits
2 - Standard deviation for NSLT health
premium risk
3 - Standard deviation for NSLT health gross
premium risk
4 - Adjustment factor for non-proportional
reinsurance
5 - Standard deviation for NSLT health
reserve risk
9 - None
For non-life underwriting risk:
4 - Adjustment factor for non-proportional
reinsurance
6 - Standard deviation for non-life
premium risk
7 - Standard deviation for non-life gross
premium risk
8 - Standard deviation for non-life
reserve risk
9 - None
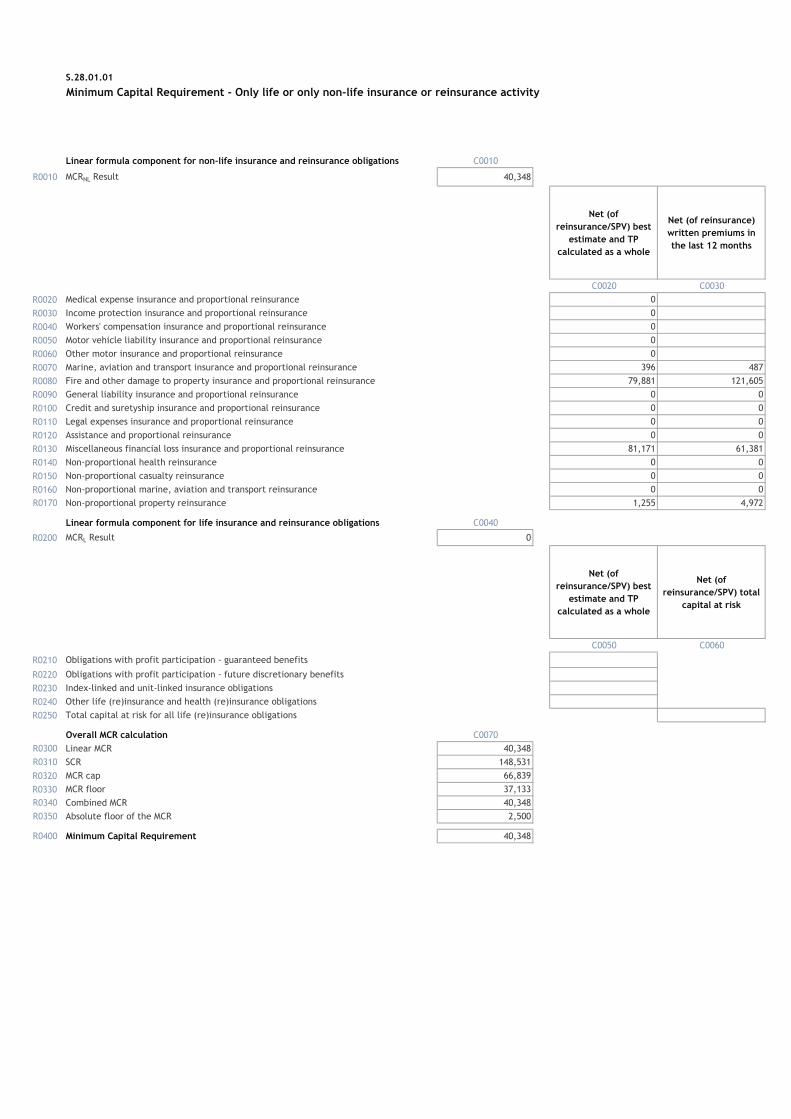
S.28.01.01
Minimum Capital Requirement - Only life or only non-life insurance or reinsurance activity
Linear formula component for non-life insurance and reinsurance obligations C0010
R0010 MCRNL Result 40,348
Net (of
reinsurance/SPV) best
estimate and TP
calculated as a whole
Net (of reinsurance)
written premiums in
the last 12 months
C0020 C0030
R0020 Medical expense insurance and proportional reinsurance 0
R0030 Income protection insurance and proportional reinsurance 0
R0040 Workers' compensation insurance and proportional reinsurance 0
R0050 Motor vehicle liability insurance and proportional reinsurance 0
R0060 Other motor insurance and proportional reinsurance 0
R0070 Marine, aviation and transport insurance and proportional reinsurance 396 487
R0080 Fire and other damage to property insurance and proportional reinsurance 79,881 121,605
R0090 General liability insurance and proportional reinsurance 0 0
R0100 Credit and suretyship insurance and proportional reinsurance 0 0
R0110 Legal expenses insurance and proportional reinsurance 0 0
R0120 Assistance and proportional reinsurance 0 0
R0130 Miscellaneous financial loss insurance and proportional reinsurance 81,171 61,381
R0140 Non-proportional health reinsurance 0 0
R0150 Non-proportional casualty reinsurance 0 0
R0160 Non-proportional marine, aviation and transport reinsurance 0 0
R0170 Non-proportional property reinsurance 1,255 4,972
Linear formula component for life insurance and reinsurance obligations C0040
R0200 MCRL Result 0
Net (of
reinsurance/SPV) best
estimate and TP
calculated as a whole
Net (of
reinsurance/SPV) total
capital at risk
C0050 C0060
R0210 Obligations with profit participation - guaranteed benefits
R0220 Obligations with profit participation - future discretionary benefits
R0230 Index-linked and unit-linked insurance obligations
R0240 Other life (re)insurance and health (re)insurance obligations
R0250 Total capital at risk for all life (re)insurance obligations
Overall MCR calculation C0070
R0300 Linear MCR 40,348
R0310 SCR 148,531
R0320 MCR cap 66,839
R0330 MCR floor 37,133
R0340 Combined MCR 40,348
R0350 Absolute floor of the MCR 2,500
R0400 Minimum Capital Requirement 40,348