Embed Size (px)
Citation preview

Flywheel as High Power Storage Devices Flywheel as High Power Storage Devices for Grid Load Balancing and Stabilizationfor Grid Load Balancing and Stabilization
Matt LazarewiczMatt LazarewiczVice President and Chief Technical OfficerVice President and Chief Technical Officer
International Renewable Energy Storage ConferenceInternational Renewable Energy Storage Conference
Gelsenkirchen, GermanyGelsenkirchen, Germany October 30October 30--31, 2006 31, 2006

TopicsTopics
• What is frequency regulation?• Choices for frequency regulation• Flywheel product evolution• Open US markets• Demonstration systems• Preliminary results• Summary
What is Frequency Regulation?What is Frequency Regulation?
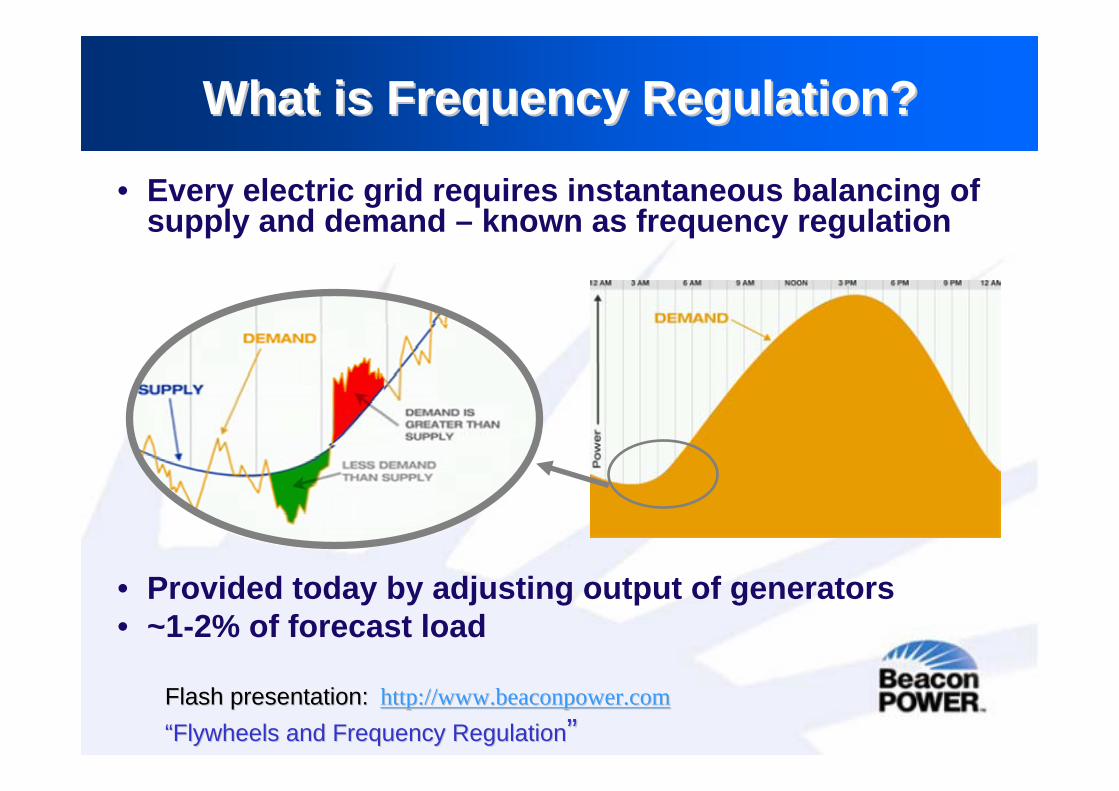
• Every electric grid requires instantaneous balancing of supply and demand – known as frequency regulation
• Provided today by adjusting output of generators• ~1-2% of forecast load
Flash presentation:Flash presentation: http://www.beaconpower.comhttp://www.beaconpower.com“Flywheels and Frequency Regulation“Flywheels and Frequency Regulation” ”

Frequency Regulation BasicsFrequency Regulation Basics

Today’s Regulation from Generators
• Fossil generators follow load with a time averaged control signal – Signal matches
generator’s slow ramp rate
• Slow response results in overshooting and undershooting– Imperfect balance
correction– Reduces regulation
effectiveness
Chart courtesy of Eric Chart courtesy of Eric HirstHirst & Brendan Kirby used in various papers& Brendan Kirby used in various papers

Frequency Regulation from Generators
Chart courtesy of Eric Chart courtesy of Eric HirstHirst & Brendan Kirby used in various papers& Brendan Kirby used in various papers
• Fossil performance– Load is dropping– Slow regulation signal
calls for more power– Result: load/generation
mismatch aggravated
• Desired improvement:– Faster regulation ramp
rate– Faster signal– Result: mismatch
reduced, tighter frequency control
Reducing Reducing mismatch mismatch improves improves performance performance

What Are the Options?What Are the Options?
Flywheel systems much faster because they are designed for this application
NoneGovernor wear, tube fractures
Fuel efficiency, emissions, turbine life
Control wear
Governor wear, tube
fractures
N/A
Negative impact of
cyclic operation
+/- 100%+/- 2%+/- 20%+/- 5%+/- 3-4% N/ARegulation range
100% <4 sec0.5%/min5%/min3%/min<1%/minHoursRate of Change
OutstandingFairGoodExcellentFairPoorAbility to
ramp up/down
Beacon Flywheel
Nat'l Gas Combined
Cycle
Nat'l Gas Simple Cycle
HydroFossil Simple Cycle
NuclearCharacteristic

Performance versus Damped SignalPerformance versus Damped Signal
FESS follows this signal 91% of the time
-1.00
-0.80
-0.60
-0.40
-0.20
0.00
0.20
0.40
0.60
0.80
1.00
0:00 3:00 6:00 9:00 12:00 15:00 18:00 21:00 0:00
NET
Pow
er M
egaW
atts
-1.00
-0.80
-0.60
-0.40
-0.20
0.00
0.20
0.40
0.60
0.80
1.00
Power (R
elative to Set Point)
-1.00
-0.80
-0.60
-0.40
-0.20
0.00
0.20
0.40
0.60
0.80
1.00
NET
Pow
er M
egaW
atts
2 hrs
Flywheels follows PJM Regulation signal > 95% of time
Actual PJM regulation signal (5-5-03)

Performance Following ACE Signal Performance Following ACE Signal
0
0
0
0
0
0
0
0
0
0
0
0:00 3:00 6:00 9:00 12:00 15:00 18:00 21:00 0:00-1.00
-0.80
-0.60
-0.40
-0.20
0.00
0.20
0.40
0.60
0.80
1.00Pow
er Relative to Set Point
-1.00
-0.80
-0.60
-0.40
-0.20
0.00
0.20
0.40
0.60
0.80
1.00
NET
Pow
er M
egaW
atts
• Flywheels Follow ACE signal > 99 percent of time• May be more effective than following regulation signal• Might lower grid regulation requirement
Actual PJM Area Control Error (ACE) (5-5-03)

Frequency Regulation Market DynamicsFrequency Regulation Market Dynamics
• Supply and demand equation will tighten:– Increasing electricity use will drive demand– Wind penetration will further accelerate demand
• Older fossil fuel-powered plants, often used for regulation, are being taken out of service
• Nuclear plants respond too slowly
Regulationdemand
increasing
Regulationsupply
decreasingwhile…
U.S. Markets for Regulation ServicesU.S. Markets for Regulation Services
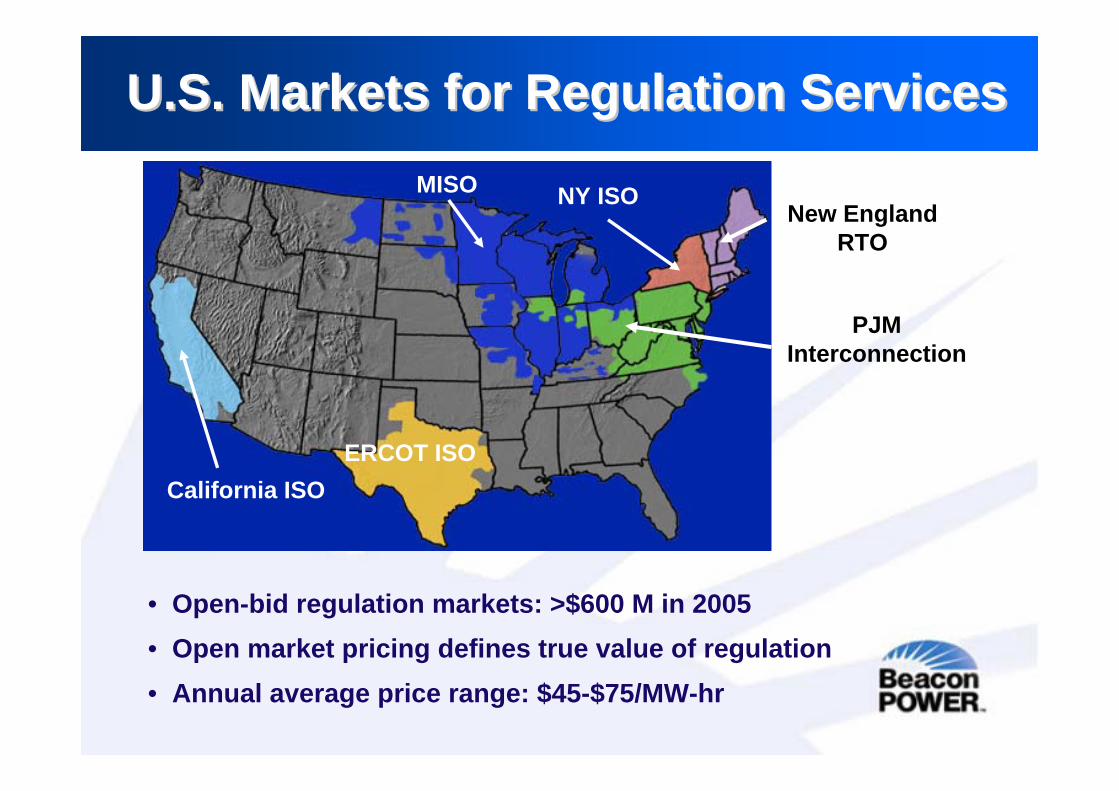
• Open-bid regulation markets: >$600 M in 2005 • Open market pricing defines true value of regulation• Annual average price range: $45-$75/MW-hr
California ISOERCOT ISO
NY ISONew England
RTO
PJM Interconnection
MISO

How the US ISO Market Works Today• RTO dispatches regulation turbines to add or drop
generation– Generator must respond within 5 minutes– Duration of response typically < 15 minutes
• Bid process – Internet-enabled, marginal pricing– Provider bids quantity of power and price– PJM model adds “opportunity cost” and ranks bids– Accepts bids until quota filled– Last bidder sets clearing price
All providers receive clearing price
0
20
40
60
80
100
120
1 34 67 100 133 166 199 232 265 298 331 364 397 430 463
Time
MW
out
put
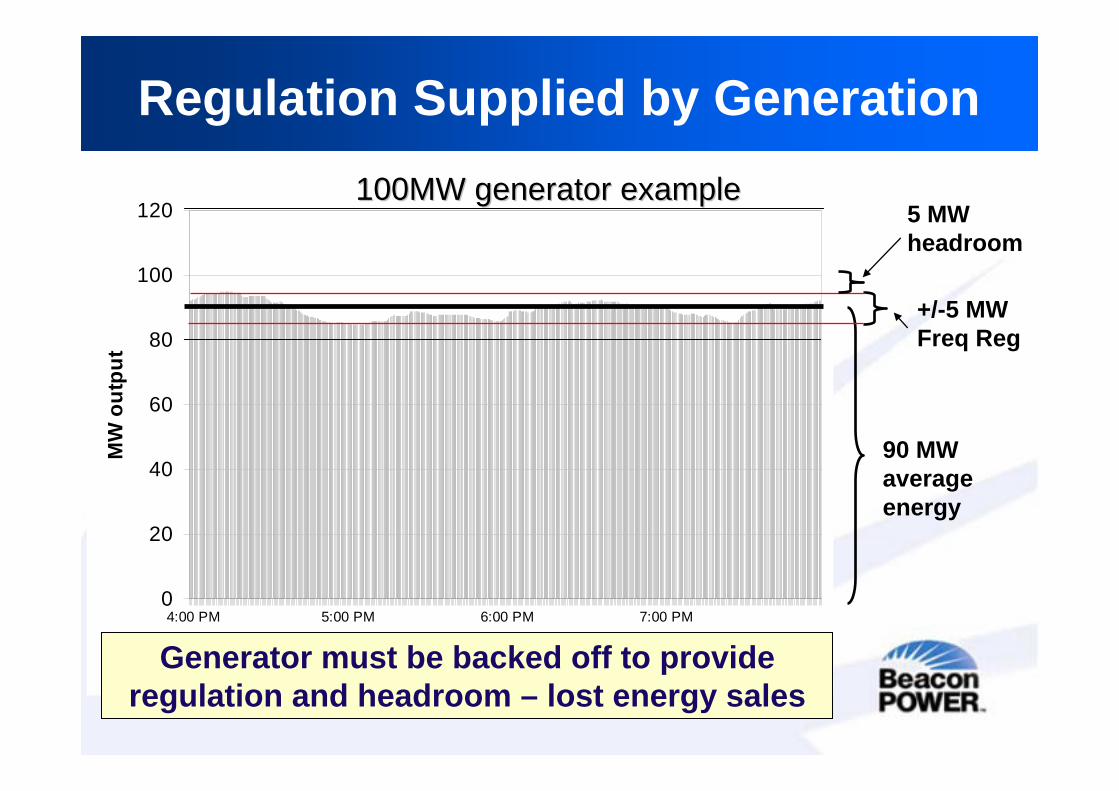
4:00 PM 5:00 PM 6:00 PM 7:00 PM
90 MW averageenergy
+/-5 MWFreq Reg
Regulation Supplied by Generation
Generator must be backed off to provide regulation and headroom – lost energy sales
100MW generator example100MW generator example5 MWheadroom

Regulation Using Generator vs. Energy Storage
-10
0
10
20
30
40
50
60
70
80
90
100
12:00 AM 6:00 AM 12:00 PM 6:00 PM 12:00 AM
Time of DayM
W t
o G
rid
100 MW Generator Set at 90 MW with 5 MW Regulation
Energy Storage providing 5 MW of Regulation
• Generator varies output• Decreases efficiency• Increases emissions
• Flywheel recycles energy• High round trip efficiency• Zero emissions
0
10
20
30
40
50
60
70
80
90
100
110
12:00 AM 6:00 AM 12:00 PM 6:00 PM 12:00 AM
Time of Day
MW
to
Grid

Advanced Flywheel TechnologyAdvanced Flywheel Technology
Composite Rim
Magnetic BearingsHub/Shaft
VacuumHousing
Motor/Generator

Beacon Flywheel Product EvolutionBeacon Flywheel Product Evolution
Gen 1Telecom
2 kWh / 1 kW
2000
Gen 2Telecom
6 kWh / 2 kW
2001
• Telecom applications• Over 500,000 hours of
operation
Gen 3Grid
6 kWh / 15 kW
2004
2005
100kW demonstration unit
2007
1st MW operational in commercial service
Gen 4Grid
25 kWh / 100 kW
2006

Smart Energy Matrix Smart Energy Matrix –– Modular DesignModular Design
• 1-MW increments up to 20 MW (or more)
• High availability through redundancy
• Small units factory built; large plants site built
One MW Smart Energy Matrix
Five MW Smart Energy Matrix

Smart Energy Matrix 20 MW PlantSmart Energy Matrix 20 MW Plant
Preliminary design

Smart Energy Matrix 20 MW PlantSmart Energy Matrix 20 MW Plant

Technology DifferentiationTechnology Differentiation
• Recycles energy with low losses • Attached on distribution or transmission network• No air emissions – permitting simple and fast• Responds to grid operator commands or line frequency• Super fast response – full power range in < 4 seconds! • No down-time from scheduled maintenance• 20-year design life with no major maintenance• Can operate continuously
– 15 min charge / 15 min discharge – 350,000 (100% depth of discharge) cycles in 20 years– 1MW system can deliver > 4000 MWh / yr back to the grid

Performance DemonstrationsPerformance Demonstrations• $2 million in contracts from
DOE, CEC and NYSERDA
• Two Smart Energy Matrix scale-power demonstration systems now operating
– 100 KW systems
– Uses Gen 3 6 kWh flywheels
– Validates monitoring and control hardware and software
– Gain approval for commercial service with Gen 4 flywheels
San Ramon, CA
Amsterdam, NY

Demonstration Scale FactorsDemonstration Scale Factors
• Full scale attributes:– 15 minute capacity– Grid operator communication
and control– Utility user interface– Speed of response– Control of multiple flywheels– 4-quadrant (real and reactive
power) operation
• Scale attributes:– Rated Power– Grid interconnection

Project ObjectivesProject Objectives
• Prove capability @ 100kW scale-power level– Demonstrate live and secure communication with ISO– Validate ability to follow fast changing regulation signals– Validate monitoring and control hardware and software– Verify anti-islanding capability
• Prepare for full-scale commercialization– Validate performance – Collect data for design improvements– Report results, gain industry confidence– Gain ISO approval for commercial service
• Gain insight on value of fast acting regulation

Graphic User InterfaceGraphic User Interface

Acceptance TestAcceptance Test100kW Acceptance Test Signal
-120
-100
-80
-60
-40
-20
0
20
40
60
80
100
120
0.00 10.00 20.00 30.00 40.00 50.00 60.00
Time (Minutes)
Reg
Sig
nal ~
kW
's
-130
-110
-90
-70
-50
-30
-10
10
30
50
70
90
110
Net
Pow
er ~
kW
's
Signal
Actual
Step Changes
Full ChargeLoad Bank comes on
Zero Reg Signal
~CAISO ACE Charge to full speed
Full Discharge
Set Point = -10 kWMax Reg = 100 kWFlywheels start @ 19,000 RPM
Zero Net

Other Promising ApplicationsOther Promising Applications
• Angular Stability Control• Renewable Ramp Mitigation• UPS• Peak Power• Micro-Grid Power Regulation• Renewable Energy Integration

SummarySummary
• Scale-power results positive to-date• Testing to be completed in 2006• Gen 4 - 100kW / 25kWh flywheel in 2006• Can free fossil plants for base loading• Reduce cycling on fossil regulating plants for
better efficiency and emissions• May lower amount of regulation needed• 1st service revenues by 2007 year-end• 10-20 MW operating by 2008 year-end

Flywheel as High Power Storage Devices Flywheel as High Power Storage Devices for Grid Load Balancing and Stabilizationfor Grid Load Balancing and Stabilization
Matt LazarewiczMatt [email protected]
978978--661661--28322832
International Renewable Energy Storage ConferenceInternational Renewable Energy Storage Conference
Gelsenkirchen, GermanyGelsenkirchen, Germany October 30October 30--31, 2006 31, 2006