Embed Size (px)
Citation preview

i
FLYPAPER EFFECT: The Evidence of Regencies and Municipalities in Indonesia
THESIS
A thesis submitted in partial fulfillment of the requirement for the degree of Magister Sains
by
Dany Prihananty SRN: S.4307056
PROGRAM STUDI MAGISTER AKUNTANSI
FAKULTAS EKONOMI
UNIVERSITAS SEBELAS MARET
SURAKARTA
2009

ii
FLYPAPER EFFECT: The Evidence of Regencies and Municipalities in Indonesia
Done by DANY PRIHANANTY
S.4307056
Have been approved by the supervisors
at 30th September 2009
Main Supervisor Co Supervisor Drs. Djoko Suhardjanto, M.Com (Hons), Ph.D, Ak Drs. Sri Hartoko, M.B.A, Ak NIP: 19630203 198903 1 006 NIP: 19610711 198703 1 001
Acknowledge by Head of Master’s Accounting Program
Doddy Setiawan, S.E., M.Si., IMRI, Ak NIP : 19750218 200012 1 001

iii
This thesis has been approved to be a partial fulfillment of the requirements for the graduate of Accounting Master on:
October 2009 Board of Examiners
Examiner I Prof. Dr. Bambang Sutopo, M.Com., Ak NIP. 19520610 198803 1 002
( )
Examiner II Dra. Y Anni Aryani, M.Proff.Acc., Ph.D. Ak NIP. 19650918 199203 2 002
( )
Main Supervisor
Drs. Djoko Suhardjanto, M.Com (Hons), Ph.D, Ak NIP. 19630203 198903 1 006
( )
Co Supervisor
Drs. Sri Hartoko, MBA, Ak NIP. 19610711 198703 1 001
( )
Acknowledge by
Director of PPs UNS Head of Master’s Accounting Program
Prof. Drs. Suranto, M.Sc, Ph.D Doddy Setiawan, S.E., M.Si., IMRI, Ak NIP : 19570820 198503 1 004 NIP : 19750218 200012 1 001

iv
AFFIDAVIT
Name : Dany Prihananty
NIM : S. 4307056
Program of Study : Master of Accounting
Concentration : Public Sector
I hereby sincerely state that the thesis titled FLYPAPER EFFECT: The Evidence
of Regencies and Municipalities in Indonesia, is my real masterpiece. The things out of this thesis
are signed by citation and referred to in the bibliography.
Surakarta, October 2009
Regards,
Dany Prihananty

v
ACKNOWLEDGEMENT
Praise to Allah Swt, the great mercy, who always blesses the researcher in any
condition for finishing this thesis completely.
The thesis is written and managed in order as the one of requirements in finishing
the master degree of accounting in economic faculty of Sebelas Maret University
Surakarta.
The researcher realizes that in finishing the thesis there are a lot of contributions,
suggestions, support, helps and assistance from others. Therefore in this opportunity the
researcher wants to like to express the gratitude to the Minister of National Education that
gives the researcher opportunity in having the scholarship. Great gratitude for Drs. Djoko
Suhardjanto, M.Com (Hons), Ph.D, Ak., and Drs. Sri Hartoko, M.B.A, Ak., as the
supervisors for all their time, thought, supervising, motivation, patient, critic, and support
that help much the researcher in finishing the study, personally the researcher wants to
apologize for all of the mistakes that have been made. Moreover thanks to Prof. Dr.
Bambang Sutopo, M.Com, Ak, and Y. Anni Aryani, M. Prof. Acc., Ph.D, Ak., as the
examiners in the presentation of the research. Then thanks for the researcher’s beloved
husband, mas Arif, and the lovely son, Fais Tangguh that they are always patient and
understand in waiting the researcher in finishing the master degree. For the big family;
Mamah, Papah Bapak, Ibu, and the brothers that always support the researcher in gaining
the master degree. Thanks for the community of International Class and Unggulan Class
that become the strongest and smartest community the researcher known. The last but not

vi
least thanks to Maksi management, administrators and personals that always assist the
researcher during study, and all of the sides and fellows that unable to mention one by
one.
The researcher realizes that the thesis is not perfect. Therefore the researcher
apologizes if there are many lacks exist in the research. It is expected critics and
suggestions from the readers in order to improve the better research.
May this thesis is useful for the improvement of accounting in public sector and
for all related sides.
Surakarta, September 2009
Dany Prihananty

vii
TABLE OF CONTENT
Page
TITLE i
AGREEMENT ii
APPROVAL iii
AFFIDAVIT iv
ACKNOWLEDGEMENT v
TABLE OF CONTENT vii
LIST OF TABLE x
LIST OF FIGURE xi
LIST OF APPENDIX xii
LIST OF ABBREVIATIONS AND ACRONYMS xiv
ABSTRACT xvi
CHAPTER I
INTRODUCTION 1
A. Background of the study 1
B. Identification of the problems 7
C. The purpose of the study 8
D. The contribution of the study 9
E. Writing systematic 10
CHAPTER II
LITERATURE REVIEW AND HYPOTHESIS DEVELOPMENT
11
A. Literature Review 11
1. Good governance 11
2. Agency theory 14
3. Flypaper effect 16

viii
4. Value for money 19
5. Local original revenue 20
6. General allocation fund 21
7. Local government spending 21
8. Financial performance measurement 22
9. Fiscal decentralization and independency degree 25
10. Local government financial ability 27
B. Hypothesis Development 28
C. Conceptual Schema 32
1. Step one 32
2. Step two 33
3. Step three 33
4. Step four 33
CHAPTER III
RESEARCH METHODOLOGY 34
A. Research design 34
B. Population and sample 34
C. Data source and data collection 36
D. Data variable and measurement 37
1. Independent variables 37
a. Local original revenue 37
b. General allocation fund 38
c. Flypaper effect 38
2. Dependent variables 39
a. The realization of the local government spending
2006 39
b. The prediction of the local government spending
2007 40
c. Local government independency degree 40

ix
E. Data Analysis Method 41
1. Descriptive analysis 41
2. Hypothesis testing 41
a. Multiple regression 41
b. The ANOVA – One way analysis variance 43
c. Simple regression 45
CHAPTER IV
DATA ANALYSIS 47
A. Data Description 47
1. Sample selection 47
2. Descriptive statistic 49
B. Data Analysis 52
1. Step one analysis 52
2. Step two analysis 56
3. Step three analysis 60
4. Step four analysis 64
5. Classical assumption 67
CHAPTER V
CONCLUSION, LIMITATION AND RECOMMENDATION 68
A. Conclusion 69
B. Research Limitation and Recommendation 70
REFERENCES 71

x
LIST OF THE TABLE Table 1 Descriptive statistic Table 2 Multiple regressions test result of the first hypothesis Table 3 Multiple regression test result of the first hypothesis Table 4 Multiple regression test result of the second hypothesis Table 5 Multiple regression test result of the second hypothesis Table 6 Anova test result of between-subject effect Table 7 Anova test result of post hoc test Table 8 Anova test result of homogenous subset test Table 9 Simple regression result of the forth hypothesis Table 10 Simple regression result of the forth hypothesis
Page
49
53
53
57
57
61
62
63
65
65
xi
LIST OF FIGURE
Page Figure 1
Theoretical schema of the first multiple regression Figure 2
Theoretical schema of the second multiple regression Figure 3
Theoretical schema of the simple regression
32
33
33
xii
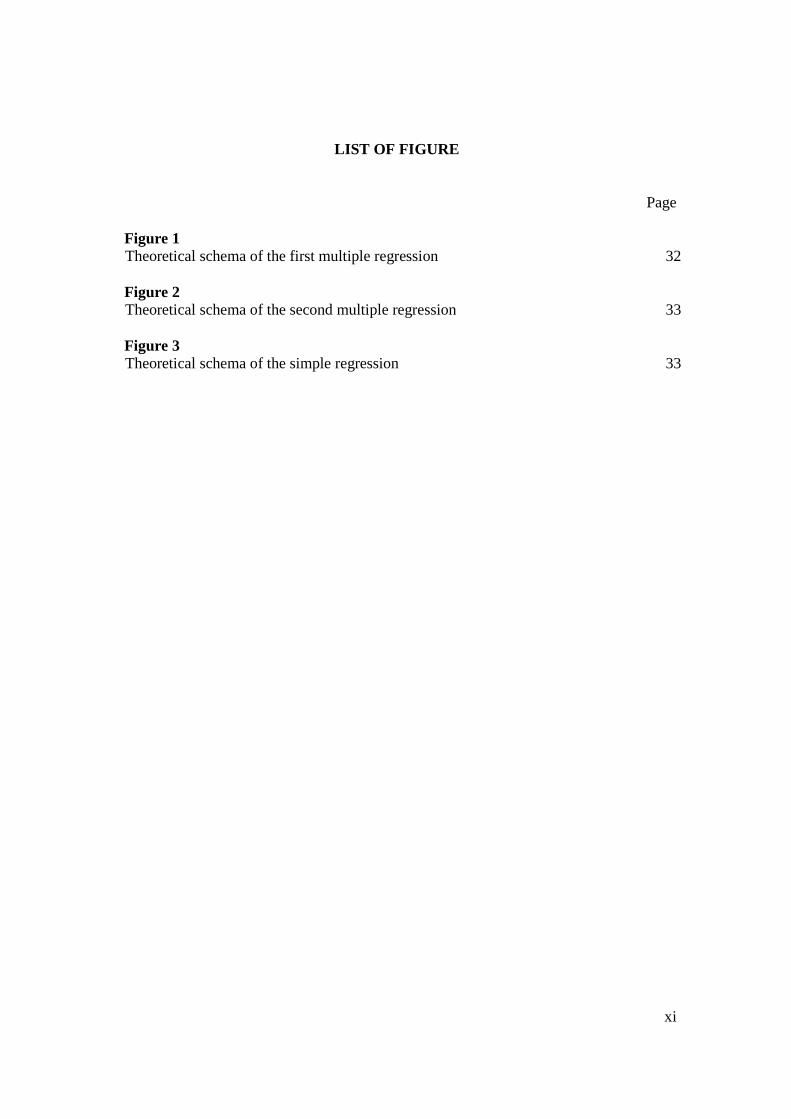
LIST OF APPENDIX
Appendix 1 Classic assumption of the first hypothesis for the data before outlier Appendix 2 Classic assumption of the second hypothesis for the data before outlier Appendix 3 Classic assumption of the forth hypothesis for the data before outlier Appendix 4 Classic assumption of the first hypothesis for the data after outlier Appendix 5 Classic assumption of the second hypothesis for the data after outlier Appendix 6 Classic assumption of the forth hypothesis for the data after outlier Appendix 7 Descriptive statistics of the sample data Appendix 8 First multiple regression of the first hypothesis Appendix 9 Second multiple regression of the second hypothesis Appendix 10 One way analysis of variance for the third hypothesis
Page
75
77
78
79
82
84
86
87
88
89
Appendix 11 Simple regression of the forth hypothesis Appendix 12 Research sample data of the local original revenue 2006; general allocation fund 2006 and local government spending 2006 Appendix 13 Research sample data of the prediction local government spending 2007; local total income 2006; and spending on employee 2006
92
93
103

xiii
LIST OF TERM USED AND ABBREVIATIONS
Term Used Indonesian term Abbreviation Aid Sumbangan Balancing Fund Dana Perimbangan Capital Spending Belanja Modal
Fiscal Decentralization Degree Derajat Desentralisasi Fiskal FDD
General Allocation Fund Dana Alokasi Umum
Government Accounting Standard Board
Independency of Local Government Kemandirian Daerah
Indonesia Financial Department Departemen Keuangan Republik Indonesia
Law Undang-undang
Local Government Budget Anggaran Pendapat dan Belanja Daerah
Local Government Budget Planning Rencana Anggaran Pendapatan Belanja Daerah
Local Government Employee Pegawai Negeri Sipil Daerah
Local Government Financial Ability Kemampuan Keuangan Daerah
LGFA
Local Government Spending Belanja Daerah
LGS
Local Original Revenue Pendapatan Asli Daerah
LOR
Local Retribution Retribusi Daerah
Local Tax Pajak Daerah
Local Total Income Total Pendapatan Daerah Municipality Kotamadya

xiv
Term Used Indonesian term Abbreviation
National Government Budget Anggaran Pendapatan dan Belanja Negara
Others Related With The Local Origin Income
Lain-lain Pendapatan Asli Daerah yang sah
Production Sharing Fund Dana Bagi Hasil
Public Expenditure Belanja Pelayanan Publik
Regency Kabupaten Role of the Internal Affair Ministry Permendagri
Separated Managed Of The Local Resources
Pengelolaan kekayaan daerah yang dipisahkan
Special Allocation Fund Dana Alokasi Khusus Spending on Duty Journey Belanja Perjalanan Dinas Spending on Civil Servant Belanja Pegawai/Personalia Spending on General Administration Belanja Administrasi Umum Spending on Goods and Services Belanja Barang dan Jasa Spending on Local Government Official Belanja Aparatur Daerah Spending on Maintenance Belanja Pemeliharaan
Spending on Operational and Maintenance Belanja Operasional dan
Pemeliharaan Spending on others Belanja Lain-lain
Spending on Production Sharing and Financial Fund
Belanja Bagi Hasil dan Bantuan Keuangan
The unconditional transfer Bantuan tidak bersyarat
Unpredicted Spending Belanja tidak tersangka
Value for Money VfM

xv
ABSTRACT
The purpose of the research is to examine the occurrence of flypaper effect in Indonesia. The research relates with the influence between local original revenue and general allocation fund to the local government spending in the financial reports. The flypaper effect is detected by the more dominant general allocation fund influencing local government spending than local original revenue.
The other objective is to examine the existence of flypaper effect in the prediction of local government spending of the next year. Local government with the different financial ability has a tendency to have different flypaper effect; it is related with their different revenue. Then it examined whether the flypaper effect different between low, medium and high financial ability area. Moreover it wants to prove that the flypaper effect has a negative influence to the independency degree of the government. The data was taken from financial report and local government budget planning.
The result of the analysis indicates that local original revenue and general allocation fund influence the local government spending and also influence the prediction of the local government spending of the next year. However, general allocation fund with the coefficient 0.245 indicates the more dominant influencing the local government spending than the local original revenue with the coefficient 0.166. It is proved that there has occurred flypaper effect.
Test resulted that the existence of flypaper effects tends to increase the amount of local government spending and the prediction of local government spending is significant. Flypaper effect is different in local governments which have different financial ability. When testing the influence of flypaper effect to the independency of local government, it is resulted that there is a negative influence between of them. The results still require confirmation through future researches.
The implication is that the regulator should encourage the local government with the limited general allocation fund in order to push the efficiency and effectiveness of the local government. In addition, local governments have to be more responsible in manage the general allocation fund and the local revenue gained.
Keywords: flypaper effect, local original revenue, general allocation fund, local government spending, local government financial report of the realization and budget planning, financial ability category, regency/municipality, Indonesia.
ABSTRAK

xvi
Tujuan dari penelitian ini untuk mengetahui terjadinya phenomena flypaper effect di Indonesia, ini meneliti hubungan antara pendapatan asli daerah, dana alokasi umum dan belanja daerah yang diambil dari laporan keuangan. Flypaper effect dapat dideteksi dengan melihat apakah variable dana alokasi umum lebih dominant mempengaruhi belanja daerah daripada pendapatan asli daerah sendiri.
Tujuan yang lain adalah untuk meneliti apakah flypaper effect juga terjadi pada penetapan perkiraan belanja daerah untuk tahun berikutnya. Pemerintah dengan kemampuan daerah yang berbeda di indikasikan mempunyai pendapatan berbeda. Maka diteliti juga apakah terjadi perbedaan antara flypaper effect di daerah yang mempunyai kemampuan daerah rendah, sedang dan tinggi. Dan juga pada penelitian ini ingin membuktikan bahwa terjadi hubungan negative antara flypaper effect dengan kemandirian pemerintah daerah. Data pada penelitian ini diambil dari laporan keuangan baik anggaran maupun realisasi.
Hasil dari analisa menunjukkan bahwa pendapatan asli daerah dan dana alokasi umum mempengaruhi belanja daerah dan juga mempengaruhi perkiraan belanja daerah untuk tahun berikutnya. Namun dana alokasi umum dengan koefisien 0,245 mengindikasikan bahwa lebih dominant daripada pendapatan asli daerah dengan koefisien 0.166 dalam mempengaruhi belanja daerah. Hal tersebut mengindikasikan terjadinya flypaper effect.
Penelitian menghasilkan bahwa terjadinya flypaper effect dalam rangka meningkatkan belanja daerah serta dalam perkiraan belanja daerah. Terdapatnya perbedaan dalam terjadinya flypaper effect di tiga kategori kemampuan keuangan daerah. Ketika di ujikan pada pengaruh flypaper effect pada kemandirian daerah, maka di hasilkan bahwa terdapat pengaruh negatif diantara keduanya.
Saran yang dihasilkan dari penelitian ini yaitu bahwa pemerintah sebaiknya mendorong pemerintah daerah dengan dana alokasi umum yang lebih terbatas untuk lebih mengefektifkan dan mengefisienkan kegiatan mereka. Selain itu pemerintah daerah juga harus lebih bertanggung jawab dalam pengelolaan pendapatan daerah dan dana alokasi umum yang didapatnya.
Kata Kunci: flypaper effect, pendapatan asli daerah, dana alokasi umum, belanja
daerah, laporan keuangan realisasi, laporan keuangan rencana anggaran, category kemampuan keuangan daerah, kabupaten/kota, Indonesia.

xvii
CHAPTER I
INTRODUCTION
This chapter explains the background of the study that motivate the researcher in
building the research, identification of the problem, purposes of study and contributions
of the study.
A. Background of the Study
The implementation of political reform in Indonesia reflects significantly on the
authority and responsibility of the decentralized local government. The aim of
reformation is to improve political accountability and accelerate social-economic
development. It is supported with the fact that all of Indonesia’s public officials from the
president to all of governors and district heads/mayors are now directly elected. This is
intended to improve the political and economic accountability of the local public officials
to their constituents (APEC, Economic Policy Report 2007).
Indonesian Local Governments in 2001 gained their own authority in running its
own governmental matters. It means that the local governments have the authority to
manage themselves, relating with the governmental matter and public issues. It is in line
with the Act no.32 in 2004 that discussed about the local government and
decentralization. Decentralization is generalized as having the right, authority and
responsibility to manage and take care all of the governmental public matter by the local
governments themselves (Halim 2007). Then the local governments become the key

xviii
players in service delivery. Therefore, the public demand of good governance is
increasing.
Holding good governance is the requirement to all governments to realize the
public aspiration in order to gain the country purposes and ideas. Good governance is a
result of the legitimacy earned by those who hold the public trust to exercise an all-
inclusive power over public resources. It just like what has been stated by Damayanti
(2007) that it is important that such power must be applied for the public interest and the
common good of the nation.
The relation between the central government and the local government is
described as a principal and an agent (Levaggi 2008). The central government, as the
principal, will give the authority to the local government, as an agent, to carry out the
public and services commodities in the local government.
The problem arises when there is asymmetry information between the central
government and the local governments. It reflects whether the central government has no
control to the used of transfer / grant. In other way, it could be a tendency as a reason to
get the unconditional transfer. In this condition, the local governments could decide by
their consideration related to the use of transfer as efficient as possible related with the
local government needed. It supported by Bae and Feiock (2004) that local government
arrangements shape the incentives of local actors, which may in turn influence fiscal
choices, by emphasizing the role of local government institutions in local fiscal choices.
In managing and rolling its governmental, the local government is funded by
balancing fund. Balancing fund consists of general allocation fund, special allocation
fund, and production sharing fund. Those are allocated as part of the national government

xix
budget and in the local original revenue (Kawedar, Rohman and Handayani 2008). Local
government is responsible for the provision of all public goods and services, except for
matters related to foreign affairs, defense, justice, religion, which are the responsibility of
central government. The central government is responsible for implementing general
policies and setting standards for public goods and service delivery of local government.
The problem that exists in this moment is that the local government depends more
on the general allocation fund allocation to finance the local government spending
without optimizing more on the local resources. When the local governments in the
present time gains the big portion of general allocation fund, then in the next period they
would try if the general allocation fund gained will also be big. Adi (2006) stated that the
proportion of general allocation fund is still the highest income compared with other
income of the local government. Aldarete (2004) also mentions that original revenues of
municipalities in Mexico are just only finance 20% of the local expenditure. This fact is
far from the purpose of decentralization, creating the local government independency
with its own resources.
Ndadari and Adi (2008) mention that increasing transfer allocation always
followed by the increasing of the higher expenditure. This shows an indication that the
increasing of expenditure related with the inefficiency spending of local government as
mentioned by Maimunah (2008). Moreover when the central government transfer
decreased, therefore it is followed by the decreasing on local government spending. It can
be seen here that decreasing of local government spending is more significant compared
with the declining of local origin revenue. This tendency shows that the dependency of
the local government to the central one is still high. In the long term this dependency

xx
must be eliminated, because it will give a bad effect to the independency of the local
government.
The prediction of grant receipt will increase in local original revenue and it should
identically affect the local government spending. Empirical research (Alderete 2004;
Davey and Peteri 1988), by contrast, has found that general allocation fund is
disproportionately on local government spending. Moreover many studies have found
that grants received increase local government spending. This anomaly has come to be
known as the flypaper effect since money sticks where it hits (Aragon 2008). Private
income is disproportionately spent on private consumption while a federal grant, income
received by the public sector, is primarily spent on public services. Aragon (2008) also
defined that flypaper effect refers to the observed greater stimulatory effect of
unconditional grants on local government spending than increases of the community
income.
Detecting the flypaper effect, it delivers to value for money. Whether value for
money (VfM) is the term used to assess whether or not an organization has obtained the
maximum benefit from the goods and services it acquires or provides, within the
resources available. The Budgeting reformation presently wants to apply the concept of
VfM or the 'three Es', economy, efficiency and effectiveness (Halim and Damayanti,
2007). Therefore, detected flypaper effect it can be seen whether the local government
has done the satisfactory arrangement to promote economy, efficiency and effectiveness
across the local government related with the decentralization. Then it can be said, that if
the flypaper effect detected means that the local government has not done the budget
efficiently and effectively (Fielding. McGillivray and Torres 2006). Thus the economy of

xxi
the local government has not increase reflected with the total amount of local original
revenue.
The relation between income and local expenditure has been discussed in many
studies and many hypotheses such as by the research by Aragon (2008), Bae and Feiock
(2004), Chang and Ho (2002), Maimunah (2008). The result is not so different. The result
of those researches related with the grant transferring that the local governments still
depend much on the transferring better than improving their own capability or resources.
Then the tendency of central government to give the transfer is used by the local
government more in their spending.
The influence of local original revenue and general allocation fund to the local
government spending in Sumatera has been analyzed by Maimunah (2008), it resulted
that the local original revenue and general allocation fund influence significantly through
the local government spending. Moreover the influence of general allocation fund is more
significant compared with the influence of the local original revenue to the. It means that
the flypaper effect occurs in this research.
Previous researches on the budgeting (Aragon 2008; Bae and Feiock 2004; Chang
and Ho 2002; Maimunah 2008) found that many dependencies exist on the grant of
central government than on its own regional income. It is defined as flypaper effect. It
gives the reflection of the facts happened for the realization of decentralization in
creating the local independency.
Each of the area or country has its own specific things, which could be related
with the geographic, economic, politic, and social culture. Local government with the
different financial ability has a tendency to have a different flypaper effect, it related with

xxii
their different income. Then it also want to examine whether the flypaper effect different
between low, medium and high financial ability area. Therefore, the researcher wants to
analyze how is the influence of general allocation fund and local original revenue to the
local government spending in Indonesia. Whether the flypaper really exists after
Indonesia in the five year period of decentralization, reflected in the local government of
regencies and municipalities that spread out in 33 provinces. Those descriptions motivate
the researcher in analyzing a research entitled; “Flypaper Effect: The Evidence of
Regencies and Municipalities in Indonesia”
B. Identification of the Problems
This study wants to know about the occurring of flypaper effect in the
municipalities and regencies of Indonesia in the year of 2006. Based on the background
of the study, then the problem statement that purposed in this study are;
a. Whether the flypaper effect occurs in 2006 of the local government of regencies and
municipalities.
b. Whether the flypaper effect occurs in the influence of local original revenue 2006 and
general allocation fund 2006 in the prediction of local government spending of the
next year, in 2007, of the regencies and municipalities in Indonesia.
c. In case the flypaper effect does exist, the researcher wonders whether there are any
differences between the flypaper effect that occurs between the local government
with the high, medium and low financial ability.

xxiii
d. Whether the flypaper effect, reflected by the fiscal decentralization degree, has a
negative significant influence to the financial performance related with the
independency degree of the local government.
C. The Purposes of the Study
The purposes of the study are stated below;
1. to identify the occurring of flypaper effect to the local government spending of
regencies and municipalities in Indonesia.
2. to gain the empirical evidence of the influence of local original revenue and general
allocation fund to the prediction of local government spending in the regencies and
municipalities in Indonesia.
3. to analyze the difference of flypaper effect between the area which has the low,
medium and high financial ability.
4. to know the dependency of the local government in line with the flypaper effect
phenomenon.
D. The Contributions of the Study
The research study may give contributions for many concerning sides.
1. The research may implication for the central government and also the local
government in order with the proper policy related the evidences based on research.

xxiv
2. It enriches the researcher knowledge related with the public sector accounting and
effect of the policy.
3. It shows to the public that the transparency and accountability can be used to measure
the condition and reality faced by the government; it is in order to realize the public to
be more conscious with the financial performance of the government.
4. The result of the research could be a reference for the academic related to the flypaper
effect, local original revenue, general allocation fund, and local government spending.
It also could be the references for any other related research in the future.
E. Writing Systematic
CHAPTER I : INTRODUCTION
This chapter describes the research background, research
problems, research objectives, and research contributions.
CHAPTER II : LITERATURE REVIEW AND HYPOTHESIS
DEVELOPMENT
This chapter describes literature review and hypothesis
development.

xxv
CHAPTER III : RESEARCH METHODOLOGY
This chapter describes the population, sample, variable
measurement, operational definition and data analysis method.
CHAPTER IV : RESEARCH RESULT AND ANALYSIS
This chapter describes descriptive analysis of data, classic
assumption analysis, research result and hypothesis testing.
CHAPTER IV : CONCLUSION AND SUGGESTION
This chapter describes conclusion, limitation and recommendation
of the study
CHAPTER II
LITERATURE REVIEW AND HYPOTHESIS DEVELOPMENT
This chapter explains about the literature review, the previous researches in
developing the research hypothesis and Conceptual Schema.
A. Literature Review
The literature review section discusses and defines about good governance,
agency theory, flypaper effect, value for money, local government spending, general
allocation fund, local original revenue, financial performance measurement, fiscal
decentralization and dependency, and local government financial ability.
1. Good governance
Holding the good governance is the requirement to all government to realizing the
aspiration of the public in order to gain the purpose and idea of the country. Good

xxvi
governance refers to government agencies’ conduct in implementing innovative policies
and programs to increase the quality of public service with the ultimate aim of increasing
economic growth (Mardiasmo 2008). It is a result of the legitimacy earned by those who
hold the public trust to exercise an all-inclusive power over public resources (Damayanti
2007). Therefore it is important that such power must be applied for the public interest
and the common good of the nation.
Tremendous political and institutional changes have marked Indonesia’s transition
to a more open and competitive society. Constitutional reforms securing direct election
have created a new accountability framework at all levels of the political system. The
decentralization process that started in 2001 is bringing control over resources closer to
the clients/end users, providing new opportunities for participation and monitoring of
service delivery.
Regions have become the key players in service delivery. As a result, users say
that quality of services has improved sharply over the past two years. According to a
survey, around 70% of users think that the quality of health and education service has
improved, reported by APEC - Economic Policy Report in 2007. The quality of
administrative matters and policy is likewise improved. The basic points of delivering
good governance are as follow:
1. Public Participation; each of the citizenship has a right in making the decision. It
could be proposed personally or using the mediation of the representative institution.
2. Rule of law; the framework of Law must stand the justice and done fairly especially
the law for the human right.

xxvii
3. Transparency; it built based on the freedom of information current. The process,
institution and information directly could be accepted by the users.
4. Responsiveness; the institutions and the processes must try to serve each of the
stakeholders.
5. Consensus orientation good governance; good governance becomes the mediator of
different necessities to gain the best choices to the larger necessity especially in the
policy and procedural matters.
6. Equity; all of the citizens have the right and opportunity to improve or to keep their
prosperousness.
7. Effectiveness and efficiency; process and institutional earn the public goods and
services as what have been defined. The products of good and services defined use
the resources that available as best as possible.
8. Accountability; the decision makers in the governmental have the responsibility to the
user institutions and stakeholders. The accountability is depended on the organization
and the decision characteristics that have been made. It related weather the decision
for the internal or external necessity.
9. Strategic vision; the leaders of the public institution must have the good governance
perspective and have the perspective in developing the human resources in the future
The all nine characteristics above are strengthened each other and they could not
stand alone (Idirwan 2007). Based on the all above description we can make a conclusion
that the good governance formed in the rolling the governmental with solid and
responsible, and also efficient and effective in keeping the constructive interaction
between the country’s domains, private sectors and public.

xxviii
This research aims at identifying the flypaper effect, it is also reflected how good
the local governments govern their governmental matters. Flypaper effect is much related
to how the local government governs and to how they have a tendency in the anomaly.
From all of the points of good governance above, we can say that if the flypaper effect
exists in the local government then the local government is no good govern.
2. Agency theory
Autonomy gives different responds between each local government. They do not
have the same preparation on it. This could be because of their different fiscal ability.
Therefore the central government gives transfer. But sometimes the transfer itself may
give the disincentive for the local government independency. The local government
depends on the transfer better than optimizing their local revenue. It indicates that there
is asymmetric behavior in responding the transfer (Aldarete 2004; Ndadari and Adi 2008)
The relation between the central government and the local government is
described as a principal and the agent, Levaggi (2008). The central government, as the
principal, will give the authority to the local government, as an agent, to carry out the
public and services commodities in the local ones. The success of fiscal ability in local
government depends on the information the agent posses about (Levaggi 2003).
The agency theory offers unique insight into information systems, outcome
uncertainty, incentives, and risk. It is an empirical valid perspective, particularly when
coupled with complementary perspective. The principal recommendation is to
incorporate an agency perspective in studies of the many problems having a cooperative
structure (Eisenhardt 1989; Moldoveanu and Martin 2001; Sloof and Praag 2006).

xxix
The problem that arise when there is asymmetry information between the central
government and the local government then it will reflected whether the central
government has no control to the used of transfer. In other way, it could be a tendency as
a reason to get the unconditional transfer (Ndadari and Adi 2008). Where in this
condition, the local government could decide by their own consideration related with the
using of transfer as efficient as possible related with the local government needed.
Bae and Feiock (2004) state that local governance arrangements shape the
incentives of local actors, which may in turn influence fiscal choices, emphasizing the
role of local government institutions in local fiscal choices. Therefore the detecting
flypaper effect could be a tendency of the asymmetry behavior by the agent of the
principal trust in directing the budget.
3. Flypaper effect
In managing and rolling its governmental, the local government is funded by
balancing fund. It consists of general allocation fund, special allocation fund, and
production sharing grant. It is allocated as part of the national government budget and
local original revenue as stated in law No.33/2004. Local government is responsible for
the provision of all public goods and services, except for matters related to foreign
affairs, defense, justice, religion, which are the responsibility of central government
Kawedar, Rohman, and Handayani (2008). Central government is responsible for
implementing general policies and setting standards for public goods and service delivery
of local government.

xxx
The existing problem presently is that the local governments depending much on
the general allocation fund to finance the local government spending without optimize
more on the local original revenue (Ndadari and Adi 2008). When in the present time the
general allocation fund allocation is big, then in the next period the local government
would try to gain the big general allocation Fund. The proportion of general allocation
fund is still the highest compared with other income of the local government, even
compared with local original revenue (Adi 2006; Maimunah 2008).
Aldarete (2004) also mentioned that the own revenues of municipalities in
Mexican just only finance the local expenditure 20% from its totally. This facts is far
from the purpose of decentralization that in creating the local government independency
with its own resources. When the central government gives grant transfer to the local
government to increase the local spending, there is a speculation that the spending of the
local government responding the transfer changing asymmetrically (Ndadari and Adi,
2008; Alderete, 2004). This asymmetry behavior can be seen with the spending from the
grant which give a personal profit; meanwhile from the grant side is decreasing. In her
research Maimunah (2008) also proved that the asymmetry behavior that shows by the
influence of general allocation fund and local original revenue to the local government
spending. The local government spending is increased far more by grant receipts than by
equivalent increases in constituent private income (Knight 2000). The big proportion of
general allocation fund has a positive significant to the Local Government Spending. This
result shows that the government grant especially general allocation fund is so dominant
in financing the local government spending.

xxxi
Ndadari and Adi (2008) also mention that increasing transfer allocation always
followed by the increasing the spending which is higher. This tendency shows if there is
an indication that the increasing of expenditure in relation the inefficiency of local
government spending. Moreover when the grant transferring from the central government
decreased then it will followed by the decreasing the local government spending. The
decreasing is more significant compared with the decreasing of local original revenue.
This tendency shows that the dependency of the local government to the central one is
still high. In the long term this dependency must be released, because it will give a bad
effect to the independency of the local government.
There is a model expects that fund or grant receipt increases the local government
income then it should identically affect local public spending (Purwoko 1999). Empirical
research, by contrast, has found that general allocation fund is disproportionately on local
government spending. Moreover many studies have found that grants received increase
public spending (Brian 2000; Bae and Feiock 2004; Aragon 2008; Maimunah 2008;
Ndadari and Adi 2008; Levaggi and Zanolla 2009). This anomaly is known as the
‘flypaper effect’ since money sticks where it hits (Aragon 2008). Private income is
disproportionately spent on private consumption while grant, income received by the
public sector, is primarily spent on public services.
Knight (2000) describes about the flypaper effect that state government public
spending is increased far more, often dollar-for-dollar, by grant receipts than by
equivalent increases in constituent private income. This anomaly has come to be known
as the flypaper effect. The other definition about Flypaper effect, it refers to the observed

xxxii
greater stimulatory effect of unconditional grants on local government spending than
increases of the community income as stated by Aragon (2008).
4. Value for money
Value for Money (VfM) is the term used to assess whether or not an organization
within the available resources has obtained the maximum benefit from the goods and
services that it acquires or provides. It does not only measures the cost of goods and
services, but also takes account of the mix of quality, cost, resource used, fitness for
purposes, timeliness and convenience to judge whether or not, when taken together, they
constitute good value. Achieving VfM may be described in terms of the 'three Es' -
economy, efficiency and effectiveness. Nowadays the budgeting reformation wants to
apply the concept of VfM or the 'three Es'. Consequently, the local government
demanded to be better in managing the transfer which always held on the 'three Es'
achievement. This supports the local government to always keep in monitoring each
Rupiah that gained and used. The consideration from the VfM concept stressed on the
input and output outcome (Halim and Damayanti 2007).
Value for money in this context may be defined as the means by which the local
government ensures the efficiency, effectiveness and economy of all its activities where:
‘efficiency’ means doing the same as before, but with fewer resources (money, staff, and
space). ‘Effectiveness’ means doing more than before with the same resources as now (or
less). ‘Economy’ means doing less with fewer resources, i.e. do savings (Bastian 2001).
Therefore in detecting the flypaper effect, it can be seen whether the local
government has done the satisfactory arrangement to promote economy, efficiency and
effectiveness related with the decentralization. While talking about the value of money,

xxxiii
then the strategic planning, financial strategy and budget setting process, key
performance indicator system, costing and pricing policies, procurement activity and
capital projects also have to be considered about (Bastian 2001). Therefore, it can be
concluded that if we can detect the flypaper effect that occurred means that the local
government has not done the budget efficiently and effectively. Thus the economy of the
local government has not increase reflected with the total amount of Local Original
Revenue.
5. Local original revenue
In financing the local government spending, beside use transfer from the central
government the local governments also use their own fund from their own income, local
original revenue. Based on the law No.33/2004, local original revenue defines as the
income that sourced from the local tax, local retribution, separated managed of the local
resources and others related with the local origin income which has a purpose to give
freedom in the local government action to search the financial matter from their own
resources relating the decentralization (Kawedar et. al 2008).
Local original revenue has an important role relating with the ability of the local
economic. The local governments which have positive Local Original Revenue growth,
they have a possibility in having a better income per capita (Adi 2006). This
improvement will give a beneficial to the local government.
6. General allocation fund
General allocation fund is the grant transfer from the central government as
reflected in the national government budget; this is the biggest component from the
balancing fund which formed as block grant. General allocation fund is formulated based

xxxiv
on the fiscal formulation gap, the different between the fiscal needed and the fiscal
capacity. The formula considers the needs and the capability local government. The
allocation is purposed to distribute the ability of the each local government. The general
allocation fund itself also has a purpose to finance the expenditure needed relating with
the decentralization. (Kawedar et al. 2008)
7. Local government spending
Based on the role of internal affair minister No.13/2006, it states that local
government spending is all of the spending from the local public cash accounts that
decreasing the equity of cash flow. This is the local government responsibility in the one
year budgeting period that will not get the return payment by the local government. Local
government spending is used in order to implement the local governmental matter which
become the authority of the local government that become obligatory and choice matter
(Kawedar et. al 2008)
Local government spending consists of spending on local government official,
public expenditure, spending on production sharing and financial Fund, unpredicted
spending, and spending on other.
Spending on local government official consists of spending on general
administration and spending on operational and maintenance. Each of them consists of
spending on employee, spending on goods and services, spending on duty journey, and
spending on maintenance. And also in spending on operational and maintenance, there is
capital spending.
Public expenditure consists of spending on general administration and spending
on operational and maintenance. Each of them consists of spending on employee,

xxxv
spending on goods and services, spending on duty journey, and spending on maintenance.
And also in spending on operational and maintenance, there is capital spending.
8. Financial performance measurement
Accountability is one of the main focuses in achieving the good governance in
Indonesia recently (Mardiasmo, Paul and Sakurai 2008). The local government will be
asked to submit the report about the results of many programs which had been
undertaken. Then, the citizen and legislative committee can assess the government’s
performance whether the government operates their job in an economic, efficient and
effective ways. Techniques such as management by objectives, performance budget, and
operations research have provided tools for enhancing performance measurement.
Performance measurement consists of three broad categories of indicators, those that
measure service efforts, those that measure service accomplishment and those that relate
efforts and accomplishment, and certain explanatory information (Sadjiarto 2000).
Governmental financial reporting basically only stress on the responsibility
whether the resources gained have been used as the budgeting or as the roles. Therefore
financial reporting just inform anything related with the government income resources,
how the spent made and the present government financial position, or compliance.
Relating with government accounting standard board as cited on Sadjiarto (2000),
in the concept statements no.2 which divided the performance measurement in three
categories; service effort measurement indicator, service accomplishment measurement
indicator, related with effort and accomplishes measurement indicator (GASB 1994).
Measure of Effort is the amount of the financial and non financial resources that
reflected in the form of money or any other unit, which used in running the program or

xxxvi
service. The measurement of service effort covers of the using ratio that compared the
resource of financial and or non financial with other measurement.
There are two kind measurements of accomplishment; output and outcomes.
Outputs measure the service quality that available. Outcomes measure the result of the
availability of the output.
Measurement that relates effort to accomplishment, the first comparison is the
comparison between the efforts and the outputs which measures the efficiency. The
information given is relating with how far the result relating with the total resources used.
User is also given the explanatory information. Explanatory explanation related
with the relevant information of the services and the explanatory of the factors which
influence the government performance. The explanatory of the factors which influence
the government performance are grouped in the two elements. They are government
exceeding control element and government under control element. Beyond the control of
government are such as demographic and environment element. The under control by
government example are such us the employee pattern and employee composition
(Sadjiarto 2000).
Parker (1996) as cited on Sadjiarto (2000) states that there are five benefits in
measuring the government performance entity;
1. Performance measurement in improving the decision quality
2. Performance measurement in improving the internal accountability
3. Performance measurement in improving the public accountably
4. Performance measurement in supporting strategic planning and deciding the goal
5. Performance measurement to enable the entity in deciding the resources effectively.

xxxvii
With the government performance data measurement, data analysis and data evaluation
then the regulator will be easier to decide the way how to defend or improve the
efficiency and effectiveness of the activities. Moreover it also gives objective information
to public related with the result achieved.
Based on Mardiasmo as cited on Zulfikar (2007), the measurement of financial
performance report based on the budgeting, this made and analyzed the variance (the
different) between actual performance and the budgeting.
9. Fiscal decentralization and independency degree
The main characteristic that the local area could done the autonomy very well if
seeing (1) the financial ability of the local government, it means that the local
government has the ability and authority to explore the financial resources, manage and
use its own financial to spend to its governmental process; (2) the dependency for the
central grant or help must be minimized as possible. Therefore local original revenue
must be the biggest source of financial that supported by the policy of balancing financial
for the central and local government (Halim 2007).
The two characteristics mentioned will affect the relationship pattern between
central government and local ones. Conceptually, the financial relation pattern between
the central and local government must appropriate with the ability of the district in order
to finance the governmental process. In line with Musgrave and Musgrave as cited on
Halim (2007), to measure the local financial performance we can use fiscal
decentralization degree between the central and local government. Moreover, in seeing
the local financial performance, we can use the local government independency degree. It
measures how far the local incomes fulfill the local needed (Halim 2007).

xxxviii
The formulation used to measure the fiscal decentralization degree is to divide the
aid or fund from the central government, general allocation fund, with the local total
income. Than the researcher uses this formula to reflect the flypaper effect seems the
definition of the two is alike.
The formulation used in measuring the independency of local government
independency degree (LGID) is dividing the local original revenue (LOR) with local
government spending (LGS).
10. Local government financial ability
Local government financial ability (LGFA) is one of the indicators of the local
government ability in performing the decentralization.
The category of local government financial ability is a classification to decide the
group related with financial ability of certain local government, and it is formulated. The
data used as the base of grouping the local government financial ability is the data in the
local government budget of the related year.
The category of local government financial ability (LGFA) is formulated with the
local total revenue minus spending on civil servant, local government employee.
IncomeLocalTotalFund
onDegreentralizatiFiscalDece =
ingnmentSpendLocalGoverLOR
LGID =
LGFA = Local Total Revenue – Spending on Civil Servant

xxxix
Local government financial ability categorized in the three groups; high, medium
and low just like what roles of the internal affair ministry No.21 2007. The grouping
categories of local government financial ability in regencies or municipalities are
following;
1. The local government which grouped in the “high” category if the financial ability
beyond Rp. 400,000,000,000. 00 (four hundred million rupiahs)
2. The local government which grouped in the “medium” category if the financial
ability beyond Rp. 200,000,000,000.00(two hundred million rupiahs) but under Rp.
400,000,000,000. 00 (four hundred million rupiahs)
3. The local government which grouped in the “low” category if the financial ability
under than Rp. 200,000,000,000. 00 (two hundred million rupiahs)
B. Hypothesis Development
The relation between income and local expenditure has been discussed in many
studies and many hypotheses (Knight 2000; Chang and Ho 2002; Bae and Feiock 2004;
Adi 2006; Aragon 2008; Maimunah 2008). The empirical evidence of the researches
results is not so different.
Based on the previous researches of the budgeting, found that much dependency
on the grant of central government better than on its own regional income or it is defined
as flypaper effect.
The influence of local original revenue and general allocation fund to the local
government spending in Sumatera has been analyzed, and the result that local original
revenue and general allocation fund influence significantly through the local government

xl
spending. Moreover the influence of general allocation fund is more dominant compared
with the influence of the local original revenue to the local government spending
(Maimunah 2008) it means that the flypaper effect occurs in this research. Other
researches (Knight 2000; Bae and Feiock 2004; Aragon 2008; Levaggi and Zanola 2009)
are in line with Maimunah’s finding that there flypaper effect also occurs. Based on the
findings, the first hypothesis is;
H1= the influence of general allocation fund on local government spending is more dominant compared with the local original revenue.
Flypaper effect can predict the behavior tendency of the local government in
predicting the local government spending allocation for the next year (Ndadari and Adi
2008). Or it can be said that general allocation fund influences more significant in
predicting the next local government spending compared with local original revenue.
Therefore the researcher wonders weather the budgeting or the allocation of the
next year local government spending will much affected by the general allocation fund
given by the central government better than the Local Original Revenue that gained for
the previous year. That will imply the dependency of local government is more to the
grant given by the central government than its own local income related with the
exploring its own resources.
Ndadari and Adi (2008) also state that local governments have done the
asymmetry behavior. It is stated clearly that when the local governments gain the smaller
general allocation fund from the previous year then the local government spending will
decrease. The decreasing of the local government spending is not in line with if the last
year local original revenue decline. The local government spending decline is not much

xli
affected by the decreasing of previous local original revenue. Thus when the local
government gained the bigger general allocation fund then the next year local
government spending will increase but without following by the increasing in local
original revenue significantly.
Occurring of the asymmetry behavior that due to the local government desire to
gain grant in the same amount of even bigger in the next year (Alderete 2004), it means
that the local government has limited original revenue but in once the local government
allocate the spending beyond the revenue. It is with the reason that the local governments
are pushed with the needed. Therefore the second hypothesis is as following;
H2= Flypaper effect occurs in the influence of local original revenue and general allocation fund in the predicting of local government spending.
In this study the researcher also curious to know the differentiation between the
flypaper effects that occurs in the area with the low, medium and high financial ability of
the local government. It is related with the previous research by Maimunah (2008). She
did not find the differentiation between of the flypaper effect that occurs in the areas
which have low allocation of local original revenue and areas which have high allocation
of local original revenue area. But seeing from the theoretical framework by Halim
(2002) as cited in Maimunah (2008), there is a significant difference local original
income between areas which have low and high ratio of fiscal decentralization degree.
Therefore, in this research the researcher tends to know about the different of flypaper
effect between the three categories of financial ability. They are low, medium and high
financial ability local government.
H3 = there are differences between the flypaper effect that occurs between the local region with high, medium and low financial ability.

xlii
Thus it is guessed weather the flypaper effect has a tendency related with the
dependency of local governments due to the grant or help which given by the central
government. So that, in here the researcher wants to check the independency degree of
the local government. Higher local government independency degree, it means if the
local government having more capability in financing its own spending without help from
the central government (Zulfikar 2007). Fiscal decentralization degree shows the effect of
the fund of the central government contribution to the whole local total revenue; therefore
we can see all of the financial performance completely. In here the fiscal decentralization
ration also reflected the flypaper effect.
The researcher assumes that the higher contribution of general allocation fund
seeing in the fiscal decentralization degree will give the reflection of the low ability of
the local government in financing with its own capability and it has a negative significant
influence to the financial performance of the local government. The local government
should have a positive financial performance which means as the independency of the
local government in financing all of the needed and support the autonomy in the local
government. Then come to the fourth hypothesis;
H4 = the flypaper effect has a negative significant influence to the independency degree of the local government
C. Conceptual Schema
The conceptual scheme formed in the three frameworks below. It is described in
the three different schemes related with the different variables used.
1. Step one
1. Local Original Revenue (X1)

xliii
Figure 1 Step one theoretical schema
2. Step two
Figure 2 Step two theoretical schema
3. Step three
Local Government Spending t (Y1t)
Prediction of Local Government Spending t+1(Y2t+1)
General Allocation Fund (X2)
Local Original Revenue (X1)
General Allocation Fund (X2)

xliv
There is no specific schema for the third hypothesis related with the hypothesis
built. The step three, the researcher wants to differentiate flypaper effect that occurs in
the three different areas.
4. Step four
Figure 3 Step four theoretical Schema
CHAPTER III
RESEARCH METHODOLOGY
The previous chapter has been discussed related with theoretical review and
hypothesis development. The chapter III explains about the research design, data, tools
and hypothesis testing.
A. Research Design
The type of research is empirical research to test the influence of local original
revenue and general allocation fund toward local government spending. Moreover this
study wants to detect whether flypaper effect anomaly occurs in the local government in
Indonesia. The independent variables in this research are local original revenue, general
Flypaper Effect (X3)
Local Government Independency Degree
(Y3)

xlv
allocation fund, and flypaper effect. The dependent variables tested in the research are
local government spending t, the prediction of local government spending of t+1, and
independency degree of the local government.
B. Population and Sample
Sekaran (2003) states that, population refers to the entire group of people, events,
or thins of interest that the researcher wishes to investigate. Then population can be
explained as collection or numbers of people or events that are interesting to be analyzed.
The research population is all Indonesian local government financial statement of
regencies and municipalities. The total population is 455 local governments; they are
formed in 369 regencies and 86 municipalities.
This data included as the cross section data. According to the time dimension,
this research is included into cross section because in this research only take one period
of data. This is in line with Jogiyanto (2005) that the cross section is the time dimension
of research that involve only one certain time with a lot of samples. Moreover this
research has a lot of data as samples to be analyzed.
Sample is part of population; it consists of elements having similar characteristics
with population (Sekaran 2003). Sampling method used is purposive sampling. It is
related with the desired information availability (Sekaran 2003). In this study the
researcher collects all of information from the populations which have the complete
available information as wanted to be analyzed.
Based on the statements of Rosche (1975), Krejcie and Morgan (1970) as well as
Cohen (1969) that cited by Sekaran (2003) the sample in multiple regression analysis
minimally should be ten times of the independent variables. Then as also cited on

xlvi
Sekaran (2003), Krejcie and Morgan (1970) as well as Cohen (1969) suggest that if the
population 455 therefore the sample should be around 210.
C. Data Source and Data Collection
This study uses secondary data which is taken from the official website of the
Indonesia Financial Department through www.sikd.djapk.go.id. Gujarati (2004) defines
secondary data as data collected by someone else, such as the government and private
organizations. The data is the financial report of the regencies and municipalities in
Indonesia in 2006 and local government budget planning of 2007. The financial annual
report chosed related with the high credibility, moreover the financial report used for any
other related sides to gain the information (Deegan and Rakin 1997). As cited on
Unerman (1999), Woodward (1998) stated that with annual reports usually more
accessible to researchers than other corporate reports.
The data are local original revenue, general allocation fund, local government
spending of the realization financial statement in 2006, prediction of local government
spending taken from the local government budget planning of 2007, local total income
and spending on employee. The reason why the researcher takes the data from the 2006 is
because the researcher found that this is the most possible way to find the real condition
of Indonesia as a whole, related with the data availability. Moreover, seeing Indonesia
after the 5 years decentralization period can reflected the condition of the local
government in Indonesia. The budget related with transfer from central government for
local government in 2006 increased significantly, than it motivates the researcher in
taking the 2006 data (APEC, Economic Policy Report 2007).
Local government that used as the data must fulfill these criteria;

xlvii
1. The local governments are formed as regencies and municipalities.
2. The financial report covered the data needed in the research. The data must fulfilled
data are local original revenue 2006, general allocation fund 2006, local government
spending 2006, prediction local government spending of 2007, local total income
2006, and spending on civil servant 2006.
D. Research Variable and Measurement
The definition of the independent and dependent variables of the research is as
followed;
1. Independent variables
The Independent variable is that the influences the dependent variable in either a
positive or negative way (Sekaran 2003). The independent variables of the research are
local original revenue, general allocation fund, and flypaper effect.
a. Local original revenue
Based on the law No.33/2004, local original revenue defines as the income
that sourced from the local tax, local retribution, separated managed of the local
resources and others revenue. Those related with the local original revenue which has
a purpose to give freedom in the local government action to search the financial
matter from their own resources relating the decentralization (Kawedar et. al 2008).
b. General allocation fund
General allocation fund is the fund transferred from the central government
sourced from national government budget , this is the biggest component sourced the
balancing fund, which formed as block grant. General allocation fund formulated
based on the fiscal formulation gap (the different between the fiscal needed and the

xlviii
fiscal capacity) where the formula considers the needs and the local capability. It is
allocated for the purpose to distribute the ability of the each local government. The
general allocation fund itself also has a purpose to finance the expenditure needed
relating with the decentralization. (Kawedar et. al 2008)
c. Flypaper effect
Davey and Peteri (1988) state that each of the transfer from the central
government basically just a help or fund for the local government, it based on their
study on Europe. They state that the fund actually does not necessary if the local
government not to extravagant in spending and working harder the tax collection.
The formulation used to measure the flypaper effect is using the fiscal
decentralization degree. The researcher uses this formula to reflect the flypaper effect
seems the definition of the two is alike. The formula is to divide the fund from the
central government, general allocation fund with the local total income. As the model
of ratio in counting flypaper effect has been used by Aragon (2008) then the
researcher uses this formula of ratio also to reflect the flypaper effect.
2. Dependent variables
Dependent variable is variable having primary focus in research, or primary
variable that makes the investigation can be proved (Sekaran 2003). The dependent
variables of this research are local government spending 2006, the prediction of local
government spending of 2007, and local government independency.
IncomeLocalTotalFund
onDegreentralizatiFiscalDece =

xlix
a. The realization of the local government spending t
Local government spending consists of spending on local government official,
public expenditure, spending on production sharing and financial fund, unpredicted
spending, and spending on other.
Spending on local government official consists of spending on general
administration and spending on operational and maintenance. Each of them consists
of spending on employee, spending on goods and services, spending on duty journey,
and spending on maintenance. And also in spending on operational and maintenance,
there is capital spending.
Public expenditure consists of spending on general administration and
spending on operational and maintenance. Each of them consists of spending on
employee, spending on goods and services, spending on duty journey, and spending
on maintenance. And also in spending on operational and maintenance, there is
capital spending.
b. The prediction of the local government spending t+1
Local government spending of the prediction of 2007 also consist the same
material as realization the local government spending of 2006. Local government
spending consists of spending on local government official, public expenditure,
spending on production sharing and financial fund, unpredicted spending, and
spending on other.
c. Local government independency degree

l
The formulation used in measuring the local government independency degree
(LGID) is dividing the local original revenue (LOR), with local government
spending.
E. Data Analysis Method
The analysis of the research used descriptive analysis and hypothesis analysis.
The data analysis used SPSS program version 16.
1. Descriptive analysis
The descriptive analysis consists of counting mean, median, standard
deviation, maximum and minimum from each sample data. This analysis purposed to
give the description related with the distribution and data sample behavior.
2. Hypothesis testing
Analysis tools used are multiple regression; ANOVA – One way analysis of
variance and simple regression.
a. Multiple regression
The multiple regressions used to see the influence of the independent
variables (local original revenue and general allocation fund) at once, than the
researcher can see the flypaper effect that occurs.
The first hypothesis test (H1) used to analyze the influence of the independents
variables, local original revenue 2006 (X1t) and general allocation fund 2006 (X2), to
ingnmentSpendLocalGoverLOR
LGID =

li
the local government spending 2006 (Y1t). Moreover the researcher wants to see the
flypaper effect that occurs which reflected by the different significance of the
dependence variables to the independent variables. If the general allocation fund 2006
(X2) has more significant influence to the local government spending 2006 (Y1t)
compared with local original revenue 2006 (X1), it can be concluded that there is
flypaper effect anomaly in this influence. The multiple regression of the first
hypothesis is as following;
Y1t = α + b1 X1 + b2 X2 + e
The second hypothesis test (H2) used to analyze the influence of the
independents variables, local original revenue 2006 (X1) and general allocation fund
2006 (X2), to the prediction of local government spending 2006 (Y2). The researcher
wants to see whether the Flypaper effect occurs in the influence of local original
revenue 2006 (X1) and General allocation fund 2006 (X2) in the predicting of local
government spending 2007 (Y2) of the next year of the regencies and municipalities
in Indonesia. The formula of multiple regression in H2 is stated below;
Y2t+1 = α + b1 X1 + b2 X2 + e
Where; Variables Measurement Local Original Revenue 2006 (X1)
Total local original revenue in the realization 2006
General Allocation Fund 2006 (X2)
Total general allocation fund in 2006

lii
Local Government Spending 2006 (Y1t)
Total spending on local government 2006 that covers spending on local government official, public expenditure, spending on production sharing and financial fund, unpredicted spending, and spending on other
Prediction on Local Government Spending 2007 (Y2t+1)
Total prediction on local government spending 2007 that covers spending on local government official, public expenditure, spending on production sharing and financial fund, unpredicted spending, and spending on other
b. The ANOVA – One way analysis of variance
The ANOVA – One way analysis of variance used to see the difference
flypaper effect in three different groups of local government financial ability
(LGFA).
Analysis of variance is a method to test the relation between one
dependent variable with one or more independent variable (Ghozali 2005). Using
the one way analysis of variance, the researcher seeks the difference that might
occur. In this test category of local government financial ability as the
independent variable and flypaper effect reflected as fiscal decentralization degree
as dependent variable.
The third hypothesis test (H3) used to know the difference of flypaper
effect occur between in the three group categories of local government financial
ability, based on the role of the internal affair ministry No21/2007. First the

liii
researcher groups the category of local government financial ability based on the
formula;
a. First group category is “Low”, this reflected by the local government with
low financial ability. This categorized with the local governments that have
the financial ability under Rp.200,000,000,000.00 (two hundred million
rupiahs).
b. Second group category is “Medium”, it is reflected by the local governments
with medium financial ability. This categorized with the local government
that have the financial ability beyond Rp.200,000,000,000.00 (two hundred
million rupiahs) but under Rp.400,000,000,000.00 (four hundred million
rupiahs).
c. Third group category is “High”, it is reflected by the local governments with
high financial ability. The local government that have the financial ability
beyond Rp. 400,000,000,000. 00 (four hundred million rupiahs).
After grouped the financial ability, than the researcher calculate the value
of flypaper effect that reflected as fiscal decentralization degree. The formula is
as follow;
LGFA = Local Total Income – Spending Employee
IncomeLocalTotalFund
onDegreentralizatiFiscalDece =

liv
c. The simple regression
The simple regression used to see answer the forth hypothesis. The forth
hypothesis test (H4) used to analyze whether the flypaper effect (X3), reflected by the
fiscal decentralization degree, has a negative significant influence to financial
performance related with the independency degree of the local government (Y3). The
formula of simple regression in H4 is following;
Y3 = α + b X3 + e
Where, Variables Measurement
Flypaper Effect (X3)
Fiscal decentralization degree = general allocation fund/local total income
Independency Degree of the Local Government (Y3)
Independency degree = local original revenue / local government spending
In order to ensure that the data analyzed is valid, consistent and
efficient on the regression coefficient interpretation there should be handle
a classic assumption. It becomes the qualification to multiple regression
analysis and hypothesis test (Gujarati 2004). The classic assumption test in
the research covered Normality test, Multicolinearity test and
Hetescesdasticity test.
The Normality test functions to test whether in the regression
model, disturbance variables or residual has a normal distribution. The
Multicolinearity test has a purpose to test whether the regression model

lv
independent variables has correlation. Then the Hetescesdasity test aims to
test existence of different variance from the one observation residue to the
other observation in the regression model (Ghozali 2005).
CHAPTER IV
DATA ANALYSIS
As has been discussed before that the research purposes to analysis the influence
between local original revenue, general allocation fund and local government spending; it
is in order to detect the flypaper effect anomaly in the local government of Indonesia. The
research uses 337 data sample of the local government financial report that has been
published by Indonesia Financial Department. This chapter reveals about the data
description, research result, discussion and comparison related with the previous
researches. The analysis used in the research are multiple regression, one way Anova and
single regression using the SPSS version 16 as the tool of operation.
A. Data Description

lvi
Data description explains about the data of population and sample taking in the
research.
1. Sample selection
The samples of the research taken from the realization and budget planning of
local government financial statement that published by Indonesia Financial Department.
Actually the researcher has intention to use all of the 455 population data of financial
reports. Unfortunately related to the data availability in informing all of the points related
to analyzed, there are only 400 financial statements that covered all of the information.
Finding some data with extreme value, the researcher did outlier data, and then
finally the researcher took 337 Log data from 400 to gain the normal distributed data and
pass the classic assumption test. Finally, the researcher examined the data and tests the
data within SPSS for windows 16.00 program. The sample was taken from 337 local
governments in Indonesia.
The variables used in this research are local original revenue 2006, general
allocation fund 2006, realization of local government spending 2006, the prediction of
local government spending 2007, flypaper effect (as reflected as fiscal decentralization
degree) and local government independency degree.
Seeing the dimension of time, that only takes in one period of financial statement
report and abundant data, this data of the research included as the cross section data. The
cross section is the time dimension of research that involve only one certain time with a
lot of samples (Jogiyanto 2005)
The choice of using financial statement report in 2006 is based on the availability
of the data Indonesia Financial Department that covered almost all of the population as

lvii
the first intention of the researcher gaining all of the population as data. In here the
researcher wants to see the real condition of all of the local government of regencies and
municipalities in Indonesia. Therefore the researcher expects that the result of the
analysis reflected the real condition of the decentralization in Indonesia after the five year
period.
2. Descriptive statistic
The table stated below explains about the result of the descriptive statistic analysis
from the each research variable. The information covered the mean, standard deviation,
minimum value, and maximum value.
Table 1 Descriptive Statistic
Variables Minimum Maximum Mean Standard
Deviation
Local original revenue 2006 (X1)
1263.71 178026.17 28884.63 27750.37
General allocation fund
(X2) 72991.00 830714.90 314889.97 137296.44
Local government
spending 2006 (Y1t) 115254.49 1271536.32 424715.14 185432.89
Prediction on local
government spending 2007 (Y2t+1)
242378.71 1577315.63 600268.08 258421.48
Flypaper effect (X3) 0.04 0.83 0.63 0.12
Independency Degree
of the Local Government (Y3)
0.01 0.39 0.12 0.05

lviii
Based on the statistical descriptive from the table, the mean of the local original
revenue 2006 (X1) value after 28884.63 where Sidoarjo regency received the biggest
amount of local original revenue in 2006, Rp.178,026,170,000.00. Mamasa regency
received the smallest number Local Original Revenue in 2006, Rp. 1,263,710,000.00.
There are 114 (34%) local government financial statement having local original revenue
above the mean value. There are 223 (66%) local government financial statement having
the local original revenue below the mean.
The mean value of the general allocation fund in 2006 (X2) is 314889.97. It is
detected that Garut regency received the most general allocation fund in 2006, Rp.830,
714,900,000.00. Tarakan municipality got the fewest general allocation fund, Rp.72,
991,000,000. 00. There are 144 (43%) local government financial statements that general
allocation fund in 2006 are above the mean. There are 193 (57%) financial statements
which general allocation funds in 2006 are below the mean value.
The highest local government spending in the realization of 2006 (Y1t) of local
government in Indonesia is Tangerang regency, Rp.1,271,536,320,000.00. The lowest
local government spending realization in 2006 of local government financial report is
Nias Selatan regency with the local government spending in the realization of 2006,
Rp.115,254,490,000.00. The mean point in the local government spending realization of
2006 is 424715.14. There are 148 (44%) local government financial statements which
have realization of local government spending in 2006 beyond the mean. Therefore there
are 189 (56%) local government financial statements which have local government
spending realization in 2006 below the mean.
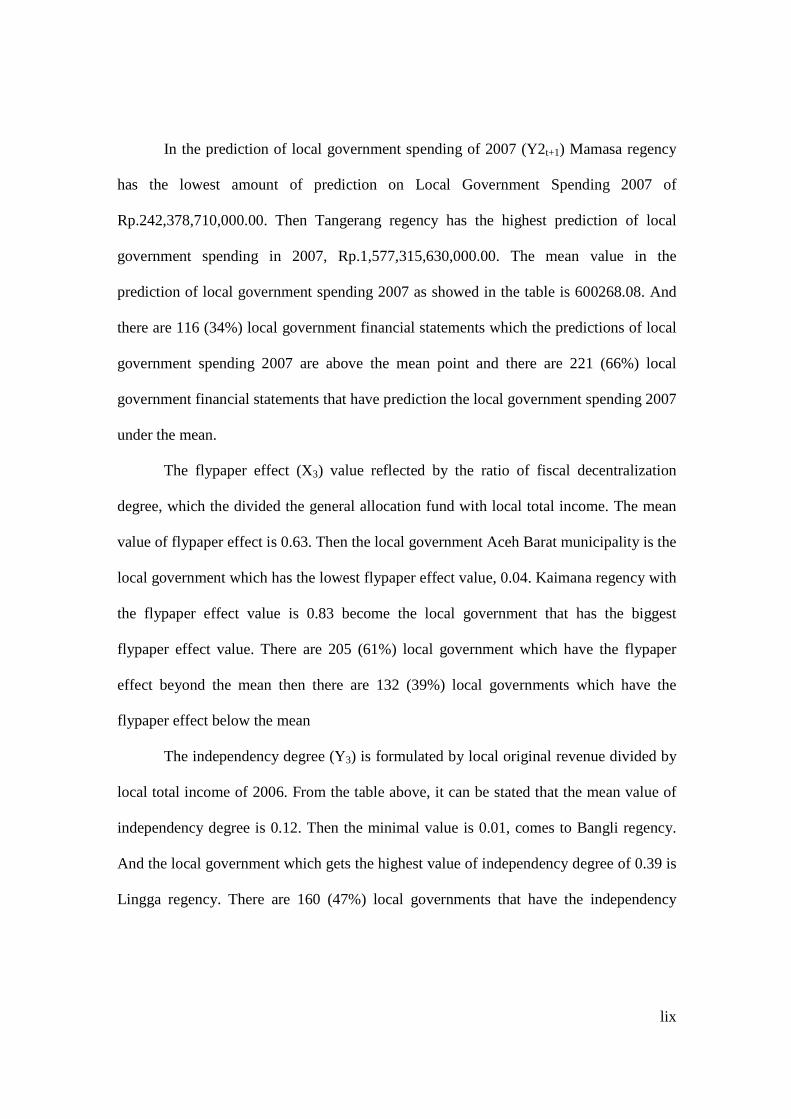
lix
In the prediction of local government spending of 2007 (Y2t+1) Mamasa regency
has the lowest amount of prediction on Local Government Spending 2007 of
Rp.242,378,710,000.00. Then Tangerang regency has the highest prediction of local
government spending in 2007, Rp.1,577,315,630,000.00. The mean value in the
prediction of local government spending 2007 as showed in the table is 600268.08. And
there are 116 (34%) local government financial statements which the predictions of local
government spending 2007 are above the mean point and there are 221 (66%) local
government financial statements that have prediction the local government spending 2007
under the mean.
The flypaper effect (X3) value reflected by the ratio of fiscal decentralization
degree, which the divided the general allocation fund with local total income. The mean
value of flypaper effect is 0.63. Then the local government Aceh Barat municipality is the
local government which has the lowest flypaper effect value, 0.04. Kaimana regency with
the flypaper effect value is 0.83 become the local government that has the biggest
flypaper effect value. There are 205 (61%) local government which have the flypaper
effect beyond the mean then there are 132 (39%) local governments which have the
flypaper effect below the mean
The independency degree (Y3) is formulated by local original revenue divided by
local total income of 2006. From the table above, it can be stated that the mean value of
independency degree is 0.12. Then the minimal value is 0.01, comes to Bangli regency.
And the local government which gets the highest value of independency degree of 0.39 is
Lingga regency. There are 160 (47%) local governments that have the independency

lx
degree higher then the mean. There are 177 (53%) local governments which have the
independency degree lower then mean.
B. Data Analysis
The test of hypothesis could be done after all classic assumption fulfilled. The
data analysis was tested through SPSS program for Windows 16.00. Hypothesis testing
was done through multiple regression, one way ANOVA, and simple regression.
Regression test was done by measuring goodness of fit regression model to measure the
appropriateness of sample regression function in predicting actual value. Regression
model goodness of fit could be seen statistically from determination coefficient, F value,
and t value.
1. Step one analysis
The first step, multiple regression analysis, is to test the influence between the
independent variables (local original revenue and general allocation fund of the
realization in 2006) to the dependent variable (local government spending of the
realization of 2006). The purpose is to detect the occurring of flypaper effect in 2006.
Following is the table of regression analysis;
Table 2 Multiple Regressions Test Result
First Hypothesis
Variables Value
R2 0.241 Adjusted R2 0.237 F test 53.065 p-value 0.000
Table 3

lxi
Multiple Regression Test Result First Hypothesis
Variables Coefficient t-value significant
Constant 3.541 13.764 0.000 Log X1 0.166 6.926 0.000 Log X2 0.245 4.916 0.000
*) significant 5% Dependent variable = Local Government Spending 2006 (Y2t)
Determination Coefficient (R2) is measured how far the independent variables can
explain the dependent variable. The adjusted R2 of the table shows 0.237. The
combination of the independent variables can explain the dependent variable in the range
23.7% and the rest of 76.3% explained by other factors outside of the model.
The F value is used to decide whether the regression model could be used to
predict the dependent variable. It can be said that the independent variables of the
research influence the dependent variable. The result shows that the F value is 53.065
with the probability 0.000. The probability much smaller than 0.05, the regression model
can be used to predict the local government spending 2006 (Y1), or it also can be said that
local original revenue (X1) and general allocation fund (X2) at the same time influence
local government spending 2006 (Y1).
The significance of the each independent variable to the dependent variable can
be detected by the ρ value. When the ρ value smaller than the significance level, it can be
said that the independent variables partially influence significantly to the dependent
variable. Therefore when the ρ value bigger than the significant level, it can be said that
the independent variables partially do not influence significantly to the dependent
variable.

lxii
Local original revenue of 2006 (X1) influences significantly to the local
government spending of 2006 (Y1). It is showed by the ρ value 0.000 in the significant
level of 5%. Positive coefficient showed in the table reflects the positive relation between
local original revenue of 2006 (X1) and local government spending of 2006 (Y1). It
means when the local original revenue bigger, therefore the local government spending
2006 will also increase. The research result is consistent with research of Maimunah
(2008); Ari (2006) that also found the positive influence relation between local original
revenue and local government spending.
General allocation fund of 2006 (X2) significantly influences to the local
government spending 2006 (Y1). The ρ value in this test is 0.000 in the significant level
of 5%. It also means that there is a positive relation between general allocation fund of
2006 (X2) and local government spending of 2006 (Y1). It means that when the general
allocation fund raises then the local government spending 2006 will also increase. The
research result is consistent with Maimunah (2008); Alderete (2004); Ndadari and Adi
(2008), they also found the positive influence relation between grant or fund from the
central government (general allocation fund) and local government spending.
The all independent variables of the regression model, we can see that two of
them have significant probability. The significant probability of local original revenue
2006 (X1) is 0.000 and general allocation fund 2006 (X2) is 0.000, < 0.05. Then we can
say then local government spending 2006 (Y1) significantly influenced by local original
revenue 2006 (X1) and general allocation fund 2006 (X2), with the formulation is as
following.

lxiii
Log Y1 = 3.541 + 0.166 Log X1 + 0.245 LogX2
The constanta of 3.541 it means that the independent variable considered as
constant. The regression coefficient of local original revenue 2006 (X1) is 0.166. It means
that every addition of local original revenue 2006 (X1), 10 (in million rupiahs), will
increase the local government spending 0.166 (in million rupiahs). The regression
coefficient of general allocation fund 2006 (X2) is 0.245. It means that every addition of
general allocation fund 2006 (X2) 10 (in million rupiahs) will increase the local
government spending 2006 (Y1) 0.245 (in million rupiahs).
From the table, it can be seen that the flypaper effect occurs. The flypaper effect
detected if the grant given by the government influence more significant than the local
owned income. The result is as what predicted before. The result of unstandardized beta
coefficient, it can be seen that the general allocation fund 2006 (X2) coefficient (0.245)
more dominantly influence than local original revenue 2006 (X1) coefficient (0.245), so
we can conclude that there is exist flypaper effect in influencing the local government
spending 2006 (Y1). It is in line with the previous researchers (Knight 2000; Bae and
Feiock 2004; Aragon 2008; Maimunah 2008; Levaggi and Zanola 2009). Therefore, from
the result of analysis above we can conclude that flypaper effect occurs in the local
government spending 2006 (Y1).
2. Step two analysis
The second regression tests the influence between the independent variables, local
original revenue 2006 (X1) and general allocation fund 2006 (X2), to the dependent
variable (local government spending of the prediction of 2007). The purpose is to detect
the occurring of flypaper effect in the influence of local original revenue 2006 (X1) and

lxiv
general allocation fund 2006 (X2), in the predicting of local government spending 2007
(Y2t+1) of the regencies and municipalities in Indonesia. Following is the table of
regression analysis;
Table 4 Multiple Regressions Test Result
Second Hypothesis
Variables Value
R2 0.044 Adjusted R2 0.038 F test 7.653 p-value 0.001
Table 5 Multiple Regression Test Result
Second Hypothesis
Variables Coefficient t-value significant
Constant 4.831 17.955 0.000 Log X1 0.053 2.124 0.034 Log X2 0.125 2.401 0.017
*) significant 5% Dependent variable = Prediction on Local Government Spending 2007 (Y2t+1)
Determination Coefficient (R2) is measured how far the independent variables can
explain the dependent variable. The adjusted R2 of the table shows 0.038. The
combination of the independent variables can explain the dependent variable in the range
3.8% and the rest of 96.2% explained by other factors outside of the model.
The F value is used to decide whether the regression model could be used to
predict the dependent variable. It can be said that the independent variables of the
research influence the dependent variable. The result shows that the F value is 7.653 with

lxv
the probability 0.001. Probability smaller than 0.05, then the regression model can be
used to the predicting of local government spending 2007 (Y2t+1), or it also can be said
local original revenue 2006 (X1) and general allocation fund 2006 (X2) at the same time
influence the predicting of local government spending 2007 (Y2t+1).
Local original revenue of 2006 (X1) influences significantly to the prediction local
government spending 2007 (Y2t+1). It is showed by the ρ value 0.034 in the significant
level of 5%. Positive coefficient showed in the table reflects the positive relation between
local original revenue of 2006 (X1) and prediction of local government spending 2007
(Y2t+1). General allocation fund 2006 (X2) also influences significantly to the prediction
of local government spending 2007 (Y2t+1). The ρ value in this test is 0.017 in the
significant level of 5%. It also means that there is a positive relation between general
allocation fund 2006 (X2) and prediction of local government spending 2007 (Y2t+1). It
means when the general allocation fund 2006 (X2) is bigger then the prediction of local
government spending 2007 (Y2t+1) also increases.
All independent variables of the regression model, it can be seen that two of them
have significant probability. The significant probability of local original revenue 2006
(X1) is 0.034 and general allocation fund 2006 (X2) is 0.017, < 0.05. Then we can say the
prediction of local government spending 2007 (Y2t+1) significantly influenced by Local
Original Revenue 2006 (X1) and general allocation fund 2006 (X2), with the formulation
is as following.
Log Y2t+1 = 4.831 + 0.53 Log X1 + 0.125 Log X2
The constanta of 4.831 it means that the independent variable considered as
constant. The regression coefficient of local original revenue 2006 (X1) is 0.053. It means

lxvi
that every addition of local original revenue 2006 (X1) 10 (in million rupiahs) will
increase the prediction of local government spending 2007 (Y2t+1) 0.53 (in million
rupiahs). The regression coefficient of general allocation fund 2006 (X2) is 0.125. It
means that every addition of general allocation fund 2006 (X2) 10 (in million rupiahs)
will increase the prediction of local government spending 2007 (Y2t+1) 0.125 (in million
rupiahs).
From the table, it can be seen that the flypaper effect occurs. The flypaper effect
is detected when the grant given by the government influence more dominant than the
local owned income. The result is as what predicted before. The result of unstandardized
beta coefficient, it can be seen that the general allocation fund 2006 coefficient (0.053) is
more dominant influencing the prediction of local government spending 2007 (Y2t+1)
than local original revenue 2006 coefficient (0.125), so we can conclude that there is exist
flypaper effect in influencing the prediction of local government spending 2007 (Y2t+1).
It is in line with the previous researchers (Aldarete 2004; Ndadari and Adi 2008).
Therefore, from the result of analysis above we can conclude that flypaper effect occurs
in the prediction of local government spending 2007 (Y2t+1) of the next year in
Indonesian regencies and municipalities.
3. Step three analysis
The ANOVA – One way analysis of variance used to see the difference of
flypaper effect in three different groups of local government financial ability.
Analysis of variance is a method to test the relation between one dependent
variable with one or more independent variable. Using the one way analysis of variance,
the researcher seeks the difference that might occur. In this test category of local

lxvii
government financial ability as the independent variable and flypaper effect reflected as
fiscal decentralization degree as dependent variable. In this test the researcher uses three
categories. The result of the analysis is as following;
Levenge’s test of homogeneity of variance calculated with SPSS to test the Anova
assumption whether each of the independent variable group has the same variance.
Lavenge statistic significant > 0.05 it means that the groups have same variance.
From the Levenge test result, we see that the F value is 11.839 and it is not
significant. The ρ < 0.05, it means that the variance is different. This could be against as
stated by Ghozali (2003), because he said that this is not fatal and the analysis still could
be continued.
Table 6 Anova Test Result of
Between-Subjects Effects
Source F Sig
Corrected Model 21.527 .000
Intercept 2053.374 .000
Category of Area 1.991 .000 R-Square = 0.114 Adjusted R-square = 0.109
From the table 6, the F value is 2053.374 for the Intercept and significant in 0.05,
then also for the category area of financial ability is 21.527 and significant in 0.05.
Related to the category area of financial ability variable is significant in the level
0.05, to we can conclude that the category area of financial ability influence the flypaper
effect or fiscal decentralization degree. It can be concluded that there is difference of
flypaper effect (fiscal decentralization degree) between categories. The adjusted R

lxviii
squared is 0.109 means that the variability of Flypaper effect or decentralization degree
can be explained in 10.9% by the variability of financial ability category area
Table 7 Anova test result of Post Hoc Test
Category of Area
Category of Area
Mean Difference
Sig
1 2 3
0.0022 0.1633
0.9980 0.001*
2 1 3
-0.0022 0.1611
0.9980 0.000*
Tukey HSD
3 1 2
-0.1633 -0.1611
0.001* 0.000*
1 2 3
0.0022 0.1633
1.0000 0.001*
2 1 3
-0.0022 0.1611
1.0000 0.000*
Bonferroni
3 1 2
-0.1633 -0.1611
0.001* 0.000*
*Statistically significant on the level 0.05
From the Tukey HSD or Bonferoni output shows that there is difference of
flypaper effect between the area 1, low financial ability area, area 2, medium financial
ability area and area 3, high financial ability area. The different between area 1 and area 2
is 0.0022 and statistically is not significant (p=0.998 much above 0.05). The different
between the area 1 and area 3 is .1633 and statistically significant with p = 0.001. The
different between area 2 and area 3 is 0.1611 statistically significant with p = 0.000.
Table 8
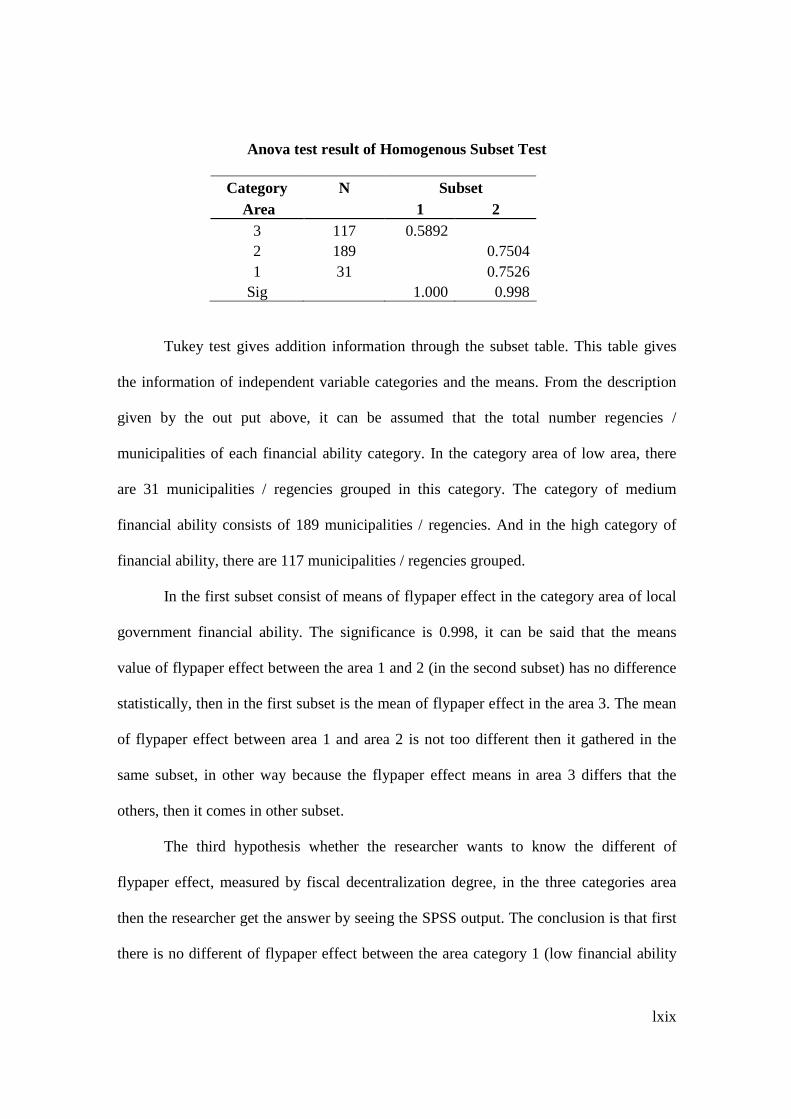
lxix
Anova test result of Homogenous Subset Test
Category N Subset Area 1 2
3 117 0.5892 2 189 0.7504 1 31 0.7526
Sig 1.000 0.998
Tukey test gives addition information through the subset table. This table gives
the information of independent variable categories and the means. From the description
given by the out put above, it can be assumed that the total number regencies /
municipalities of each financial ability category. In the category area of low area, there
are 31 municipalities / regencies grouped in this category. The category of medium
financial ability consists of 189 municipalities / regencies. And in the high category of
financial ability, there are 117 municipalities / regencies grouped.
In the first subset consist of means of flypaper effect in the category area of local
government financial ability. The significance is 0.998, it can be said that the means
value of flypaper effect between the area 1 and 2 (in the second subset) has no difference
statistically, then in the first subset is the mean of flypaper effect in the area 3. The mean
of flypaper effect between area 1 and area 2 is not too different then it gathered in the
same subset, in other way because the flypaper effect means in area 3 differs that the
others, then it comes in other subset.
The third hypothesis whether the researcher wants to know the different of
flypaper effect, measured by fiscal decentralization degree, in the three categories area
then the researcher get the answer by seeing the SPSS output. The conclusion is that first
there is no different of flypaper effect between the area category 1 (low financial ability

lxx
area) and the area category 2 (medium financial ability area). Second, there is different of
flypaper effect between the area category 1 (low financial ability area) and the area
category 3 (high financial ability area). Third, there is different of flypaper effect between
the area category 2 (medium financial ability area) and the area category 3 (high financial
ability area).
4. Step four analysis
The third regression is to test the influence between the flypaper effects to the
independency degree of the local government. The purpose is to detect the negative
influence of flypaper effect to the independency degree of the regencies and
municipalities in Indonesia. Following is the table of regression analysis;
Table 9 Simple Regression Result
Forth Hypothesis
Variables Value
R2 0.015 Adjusted R2 0.012 F test 5.133 p-value 0.024
Table 10 Simple Regression Result
Forth Hypothesis
Variables Coefficient t-value significant
Constant -1.336 -48.900 0.000 X3 -0.235 -2.266 0.024
*) significant 5%

lxxi
Dependent variable = Independency Degree (Y3)
Determination Coefficient (R2) is measured how far the independent variables can
explain the dependent variable. The adjusted R2 of the table shows 0.012. The
independent variable can explain the dependent variable in the range 1.2% and the rest of
98.8% explained by other factors outside of the model.
The F value is used to decide whether the regression model could be used to
predict the dependent variable. It can be said that the independent variable of the research
influence the dependent variable. The result of the test, it shows that the F value is 5.133
with the probability 0.024. Related that the probability much smaller than 0.05, then the
regression model can be used to predict the Independency of the local government, or it
also can be said that flypaper effect influences local government independency.
Flypaper effect influences significantly to the local government independency. It
is showed by the ρ value 0.024 in the significant level of 5%. Negative coefficient
showed in the table reflects the negative relation between flypaper effect and local
government independency. It means that smaller the flypaper effect then the
independency degree of local government increases.
The independent variable of the simple regression model, it can be seen that it has
significant probability. The significant probability of flypaper effect is 0.024, < 0.05.
Therefore we can say then local government independency degree is significantly
influenced by flypaper effect, with the formulation is as following.
Log Y3 = -1.336 - 0.235 Log X3
The constanta of -1.336 it means that the independent variable considered as
constant. The regression coefficient of flypaper effect (X3) is minus 0.235. It means that
lxxii
every addition of flypaper effect of 10 will decrease the independency degree (Y3) in
0.235.
The result of unstandardized beta coefficient, we can see that the fiscal
decentralization degree, flypaper effect (X3), has a negative significant influence to the
independency degree of local government.
As the statistical result above, it proved that there is a negative significant
influence between flypaper effect and independency degree of local government. This is
in line with the statements by Mahmudi (2007); Zulfikar (2007) and Landiyanto (2005).
5. Classical assumption
Classical assumption is the requirement to the regression test. The classical
purposed to have confidence and to ensure the data is valid. The researcher did three
times classical tests in order to do three times regression tests with different variables.
The classical assumption test in the variables of the first hypothesis covered
Normality test, Multicollinearity test, and Heteroscesdasticity test. The variables of the
first hypothesis are local original revenue 2006, general allocation fund 2006 and local
government spending 2006.
The second hypothesis’ variables are local original revenue 2006, general
allocation fund 2006 and prediction on local government spending 2007. Then the
researcher took Normality test and Heteroscesdasticity test as the classical assumption.
For the forth hypothesis’ variables as the simple regression are flypaper effect and
independency degree. The classical assumption tests taken are Normality and
Heteroscesdasticity. The result of the classical assumption can be seen in the appendix 6,
appendix 7 and appendix 8.

lxxiii
CHAPTER V
CONCLUSION, LIMMITATION AND RECOMMENDATION
A. Conclusion
With the data analysis, it is gained the result related with the flypaper effect
phenomenon that exists in Indonesia. The results of the research can be concluded as
follow.
It is proved that flypaper effect does exist in 2006, after the five year period of the
decentralization. This is reflected with the evidence of the more dominant influencing of
general allocation fund to the local government spending than the local original revenue.
There is flypaper effect exist in the influence of local original revenue and general
allocation fund to predict the local government spending of the 2007. There is an
indication of asymmetric behavior of local actor or the local government in predicting the
Local Public Spending. The result of the research shows that the general allocation fund
still has a big influence to the local government spending in regencies or municipalities.
There is different of flypaper effect between the local government financial ability
area categories Then it can be said that the ability of local government in finance their
own district will differ their dependency to the central government’ transfer.
The dependency of the local governments to the central will make them not
perform well in the financial performance and it will effect to their independency.
Contrary it also can be said that the grant from the central government, general allocation

lxxiv
fund, can cover the gap between local spending and income of the regencies and
municipalities local government.
B. Research Limitation and Recommendation
The research result could be used by other sides that interest and deal with the
budgeting matter. The researcher hopes attracting the other next researchers in studying
essence of information in financial report and it could also may related with any other
subject disciplines.
The research has some limitations and it needs improvement dealing with the
future research. The limitations that may exist in the research are;
1. The research only takes two year events of financial reports to detect the flypaper
effect phenomenon; even researcher takes almost all of the population as the data. It
would be better if in the next research used the time series data.
2. There is a good description about the behavior proxy in allocating resources by the
principal and agents. It will need a deeper and feasible research for example by field
research or experiment research with the local government executive and legislative
as subject of research.
3. In this study, the researcher does not analyze the affectivity and efficiency of the
using of budget. For example it doesn’t consider the quantity, structure, age, and the
educational background of the employee and the inhabitant. It is recommended if the
future researches explore more and relate about it.

lxxv
REFERENCES
Adi, P. H., 2006, “Hubungan antara pertumbuhan ekonomi daerah, belanja pembangunan dan pendapatan asli daerah (studi pada kabupaten dan kota se Jawa-Bali)”, Simposium Nasional Akuntansi IX. Padang.
Alderete, J. C., 2004, “Asymmetric responses of local expenditures to changes in
intergovernmental grants”, Discussion Paper, Department of Economics, Stanford University.
APEC – Economic Policy Report, 2007, “Indonesia: developments in public sector
governance”. www.apec.org/apec/.../economy_reports.MedialibDownload.v1.html?.../apec.../2007... -
Aragon, F., 2008, “The flypaper effect revisited”, Discussion Paper, STICERD, London
School of Economics.
Bae, S.S., and Feiock, R.C., 2004, “The flypaper effect revisited: intergovernmental grants and local governance”, International Journal of Public Administration, Vol.13 No.5, pp. 577–596.

lxxvi
Bastian, I., 2001, Akuntansi Sektor Publik di Indonesia, First Edition. Pusat Pengembangan Akuntansi - Fakultas Ekonomi Universitas Gadjah Mada. Yogyakarta
Chang, T. and Ho, Y. H., 2002, “Tax or spend, what cause what: Taiwan experience”
International Journal of Business and Economic, Vol.1 No.2, pp. 157-165.
Dadan and Tim JPIP Jawa Pos, 2005, “Desentralisasi fiskal dan pertarungan kewenangan pusat – daerah”, http://www.yipd.or.id/berita_agenda/index.php?act=detail&p_id=2405&p_cat=
Damayanti, T. W., 2007, Pencapaian Akuntabilitas Publik Melalui Pengelolaan Yang
Baik (Good Governance). In Halim, Abdul & Damayanti, Theresia. Pengelolaan Keuangan Daerah, Seri Bunga Rampai Manajemen Keuangan Daerah. The Second Edition. Unit Penerbitan dan Percetakan Sekolah Tinggi Ilmu Manajemen YKPN. Yogyakarta.
Davey, K. and Peteri, G., 1988. “Local government finance; general issue”. Local
Government l. pp.135-145 Deegan, C. dan Rankin, M., 1997, “The materiality of environmental information to users
of annual reports”. Accounting, Auditing and Accountability Journal. Vol. 10 No.4. pp: 562–583.
Eisenhardt, K., 1989. “Agency theory: an assessment and review”. The Academy of
Management Review, Vol.14 No.1, pp 57-74. Fielding, D.,McGillivray, M. and Torres, S., 2006. “A wider approach to aid
effectiveness-correlated impacts on health, wealth, ferility and education”. Research Paper of United Nations University. No.2006/23.
Gan, J. W., and Hongfei, C. G., 2005, “Intergovernmental fiscal transfer system - a new
model from a comparison between Sweden and China”, A Discussion Paper of Kristianstad University.
Ghozali, I., 2005, Aplikasi Analisis Multivariate dengan program SPSS, Badan Penerbit
Universitas Diponegoro.
Gujarati, D., 2004. Basic Econometrics – Fourth Edition. The Mc Graw Hill Companies. Halim, A., and Damayanti, T. W., 2007, “Pengelolaan Keuangan Daerah, Seri Bunga
Rampai Manajemen Keuangan Daerah”. The Second Edition. Unit Penerbitan dan Percetakan STIM YKPN. Yogyakarta.
Halim, A., 2002. “Analisis varian pendapatan asli daerah dalam laporan perhitungan
anggaran pendapatan dan belanja daerah kabupaten/kota di Indonesia”. In

lxxvii
Maimunah, Mutiara. 2008. Jurnal Riset Akuntansi Indonesia. Vol 11. No.1. pp 37-51.
Idirwan, 2007, Akuntabilitas dan good governance. In Halim, A. and Damayanti, T.,
Pengelolaan Keuangan Daerah, Seri Bunga Rampai Manajemen Keuangan D aerah, The Second Edition. Unit Penerbitan dan Percetakan STIM YKPN, Yogyakarta.
Jogiyanto, 2005, Business Research Methodology, Badan Percetakan Fakultas Ekonomi,
Yogyakarta.
Kawedar, W., Rohman, A. and Handayani, S. 2008. Akuntansi Sektor Public; Pendekatan Penganggaran Daerah dan Akuntansi Keuangan daerah. Badan Penerbit Universitas Diponegoro. Semarang.
Knight, B., 2000, The flypaper effect unstuck: evidence on endogenous grants from the
federal highway aid program. A Critical Perspective, Division of Research and Statistics Board of Governors of the Federal Reserve System Washington.
Landiyanto, E. A., 2005. “Kinerja keuangan dan strategi pembangunan kota di era
otonomi daerah: studi kasus kota Surabaya”, CURES Working Paper No. 05/01, Fakultas Ekonomi Universitas Airlangga. Surabaya Indonesia.
Levaggi, R. and Smith, P., 2003. “Decentralization in health care: lessons from public
economics”, Conference on Economics and Health Policy Centre for Health Economics, University of York
Levaggi, R., 2008. “Decentralisation vs fiscal federalism in the presence of impure public
goods”, Working Papers 0812, University of Brescia, Department of Economics. Levaggi, R., and Zanola, R., 2009. “The flypaper effect: evidence from the Italian
national health system”, Working Paper. University of Economic Science. University of Brescia. Italy
Mahmudi, 2007, Analisis Laporan Keuangan Pemerintah Daerah. First Edition. Unit
Penerbitan dan Percetakan Sekolah Tinggi Ilmu Manajemen YKPN. Yogyakarta. Maimunah, M., 2008, “Flypaper effect pada dana alokasi umum (dau) dan pendapatan
asli daerah (pad) terhadap belanja daerah pada kabupaten/kota di pulau Sumatra”, Jurnal Riset Akuntansi Indonesia. Vol 11. No.1. pp: 37-51.
Mardiasmo, D., 2008, “Implementation of good governance by regional governments in
Indonesia: the challenges”, Discussion Paper. School of Management Faculty of Business. Queensland University of Technology. Brisbane

lxxviii
Moldoveanu, M. and Martin, R., 2001. “Agency theory and the design of efficient governance mechanisms”, A Discussion of Rotman School of Management. University of Toronto. February 2
Ndadari, L. W., and Adi, P. H., 2008. ”Perilaku asimetris pemerintah daerah terhadap
transfer pemerintah pusat”, The 2nd National Conference UKWMS. Indonesia. Permendagri, 2007, Peraturan menteri dalam negeri nomor 21 tahun 2007.
www.depdagri.go.id/file_profil_uk/permen%20no.21-2007.doc Purwoko, 2000, “Kajian tentang peranan dau sebagai salah satu sumber pembiayaan
daerah otonomi”. http://www.fiskal.depkeu.go.id Sadjiarto, A., 2000, “Akuntabilitas dan pengukuran kinerja pemerintah”, Jurnal
Akuntansi dan Keuangan – Fakultas Ekonomi Universitas Kristen Petra, Vol.2 No.2. pp :138-150. http://puslit.petra.ac.id/journals/accounting/
Sloof, R. and Praag, M., 2006, “Performance measurement, expectancy and agency
theory: an experimental study”, University of Amsterdam and Tinbergen Institute. Netherlands
Sekaran, U,. 2003. Research methods for business. a skill building approach, The Forth
Edition. United State of America. Unerman, J., 2000, “Methodological issues - Reflections on quantification in corporate
social reporting content analysis”, Accounting Auditing & Accountability Journal, Vol. 13 No. 5, pp. 667-680.
Zulfikar, 2007, Kinerja keuangan dan strategi pembangunan kota di era otonomi daerah –
studi kasus di kota Dumai. In Halim, A., and Damayanti, T., Pengelolaan Keuangan Daerah, Seri Bunga Rampai Manajemen Keuangan Daerah. The Second Edition. Unit Penerbitan dan Percetakan STIM YKPN. Yogyakarta.

lxxix

lxxx