Embed Size (px)
Citation preview

Repo r t
Intel Corporation Fluorides Control Technology
Assessment and Ambient Air Quality Modeling Assessment of Fluorides
and Hydrogen Fluoride
Prepared for Oregon Department of Environmental Quality
December 2014
2020 SW Fourth Avenue, Suite 300
Portland, OR 97201

This page intentionally left blank

ES111914104811PDX III
Contents Section Page
Acronyms and Abbreviations ...................................................................................................................... v
1 Introduction ............................................................................................................................... 1‐1
2 Fluorides Control Technology Assessment .................................................................................. 2‐1 2.1 De minimis Emission Rate Assessment .................................................................................. 2‐1 2.2 Fluoride Use in Semiconductor Manufacturing ..................................................................... 2‐3 2.3 Fluoride as a Regulated Air Pollutant .................................................................................... 2‐3 2.4 Fluoride Emissions at Intel ..................................................................................................... 2‐3 2.5 Assessment ............................................................................................................................ 2‐4
2.5.1 Oxidation and Dry Scrubbing .................................................................................... 2‐5 2.5.2 Modified Packed‐Bed Wet Scrubber ........................................................................ 2‐6
2.6 Conclusions ............................................................................................................................ 2‐8
3 Ambient Air Quality Modeling Assessment of Fluorides and Hydrogen Fluoride ......................... 3‐1 3.1 Standards and Criteria Levels ................................................................................................ 3‐1 3.2 Modeling Approach ............................................................................................................... 3‐2 3.3 Source Characterization ......................................................................................................... 3‐2 3.4 Results .................................................................................................................................... 3‐3
4 References .................................................................................................................................. 4‐1
Appendixes
A BACT Database Search Results B Cost Estimate Worksheets
Tables
2‐1 Estimated Annual Fluoride Emissions ................................................................................................. 2‐2 2‐2 Average Fluoride Emission Rate and Exhaust Flow ............................................................................ 2‐4 2‐3 Cost Effectiveness of Oxidation & Dry Scrubbing System................................................................... 2‐6 2‐4 Fluoride Control Cost Comparison Wet Chemical Scrubber ............................................................... 2‐7 3‐1 Published Hydrogen Fluoride and Hydrogen thresholds .................................................................... 3‐2 3‐2 Results of Hydrogen Fluoride and Fluoride Analysis .......................................................................... 3‐3
Figures
2‐1 Typical Arrangement of Abatement Devices, Fans, and Stacks at an Intel Fab .................................. 2‐1 2‐2 F‐Gas Process Flow.............................................................................................................................. 2‐3

This page intentionally left blank

ES111914104811PDX V
Acronyms and Abbreviations ˚F degrees Fahrenheit
ACDP Air Contaminant Discharge Permit
ACFM Actual Cubic Feet per Minute
BACT Best Available Control Technology
DEQ (Oregon) Department of Environmental Quality
EPA U.S. Environmental Protection Agency
Fabs semiconductor fabrication facilities
F‐gases fluorine‐containing gases
F Fluorides
FR Federal Register
gpm gallons per minute
HF hydrogen fluoride
HFC hydrofluorocarbon
ICs Integrated circuits
KW kilowatt
kW‐hr kilowatt‐hour
lb/ft3 pounds per standard cubic foot
lb/hr Pounds per hour
MAO Mutual Agreement and Order
MMBTU/hr Million British thermal units per hour
N/A not applicable
NAAQS National Ambient Air Quality Standards
NESHAP National Emission Standards for Hazardous Air Pollutants
NF3 Nitrogen Trifluoride
NSPS New Source Performance Standards
NSR New Source Review
PFC perfluorocarbon
POU Point of Use
PSD Prevention of Significant Deterioration
RBLC RACT/BACT/LAER Clearinghouse
RTO Recuperative Thermal Oxidizer
SF6 sulfur hexafluoride
tpy tons per year
USD U.S. Dollar

This page intentionally left blank
SECTION 1
ES111914104811PDX 1-1
Introduction Intel Corporation (Intel) owns and operates two semiconductor manufacturing facilities in Oregon. One facility is located at 2501 NW 229th Avenue, Hillsboro, Oregon (Ronler Acres Campus). The second facility is located at 3585 SW 198th Avenue, Aloha, Oregon (Aloha Campus). Combined, the two campuses are the Facility that operates under a single Standard Air Contaminant Discharge Permit (ACDP), 34‐2681‐SI‐01. The Aloha Campus commenced operations in 1976 and the Ronler Acres Campus commenced development in 1994. The current version of the ACDP was issued to the Facility by the Oregon Department of Environmental Quality (DEQ) in 2007.
In 2001, the Environmental Quality Commission adopted regulations requiring that regulated sources apply, as part of the next permit action, for Plant Site Emission Limits (PSELs) for each regulated air pollutant emitted at or above the de minimis emission rate. Inorganic fluoride compounds other than hydrogen fluoride measured using an EPA Method 13 test are regulated under Oregon law as “Fluorides.” In early 2012 Intel identified to DEQ that the Facility required a Fluorides PSEL.
In April 2014, DEQ entered into a Mutual Agreement and Order (MAO, No. AQ/AC‐NWR‐14‐027) with Intel settling allegations that Intel should have requested a Fluorides PSEL prior to 2012. As part of the MAO, Intel agreed to submit by December 31, 2014 a Fluorides control technology assessment for each emission point emitting more than the de minimis amount of Fluorides. Intel also agreed to submit an ambient air quality modeling assessment of Fluorides and hydrogen fluoride (HF), including a comparison of accepted, risk‐based, chronic exposure thresholds to modeled concentrations at the nearest residences.
This report provides a Fluorides control technology assessment in Section 2 and a description of the Fluorides and HF ambient air quality modeling analysis performed for the Facility in Section 3. Section 4 contains references cited in the text. Appendix A contains database search results from of EPA’s RACT/BACT/LAER Clearinghouse (RBLC) database, the California Air Resources Board BACT Clearinghouse and the South Coast Air Quality Management District, Section I ‐ SCAQMD LAER/BACT Determinations database. Appendix B contains cost estimating worksheets.

This page intentionally left blank

SECTION 2
ES111914104811PDX 2-1
Fluorides Control Technology Assessment This section presents the Fluorides control technology assessment for the Facility. The de minimis emission rate for Fluorides is defined in Oregon Administrative Rule 340‐200‐0020(33), Table 4, as 0.3 tpy. This assessment includes a review of federal and state databases to identify previous control technology assessments for Fluoride emissions from the semiconductor industry. None were found in the databases searched.
2.1 De minimis Emission Rate Assessment Under the MAO, a Fluoride emissions control technology assessment is required for each emission point that emits more than the de minimis amount of Fluorides (0.3 tpy). Semiconductor fabrication operations are the primary source of Fluoride emissions at Intel. Based on analytical source testing Intel has calculated Fluoride emissions from each semiconductor fabrication facility (Fab). The abatement systems and stacks through which Fluoride emissions are emitted are in a manifold arrangement and specific stack emission rates can vary. An example of a typical arrangement of the abatement devices, fans, and stacks at an Intel Fab is shown in Figure 2‐1.
FIGURE 2‐1 Typical Arrangement of Abatement Devices, Fans, and Stacks at an Intel Fab
The arrangement shown in Figure 2‐1 exemplifies the robust nature of the air pollution control systems at Intel. Redundancy is provided at both the scrubber and exhaust fan level thereby ensuring pollutants are controlled should one scrubber or one exhaust fan fail to operate. However, specific stack emission rates can vary with exhaust fan speed and differential pressure in the system.
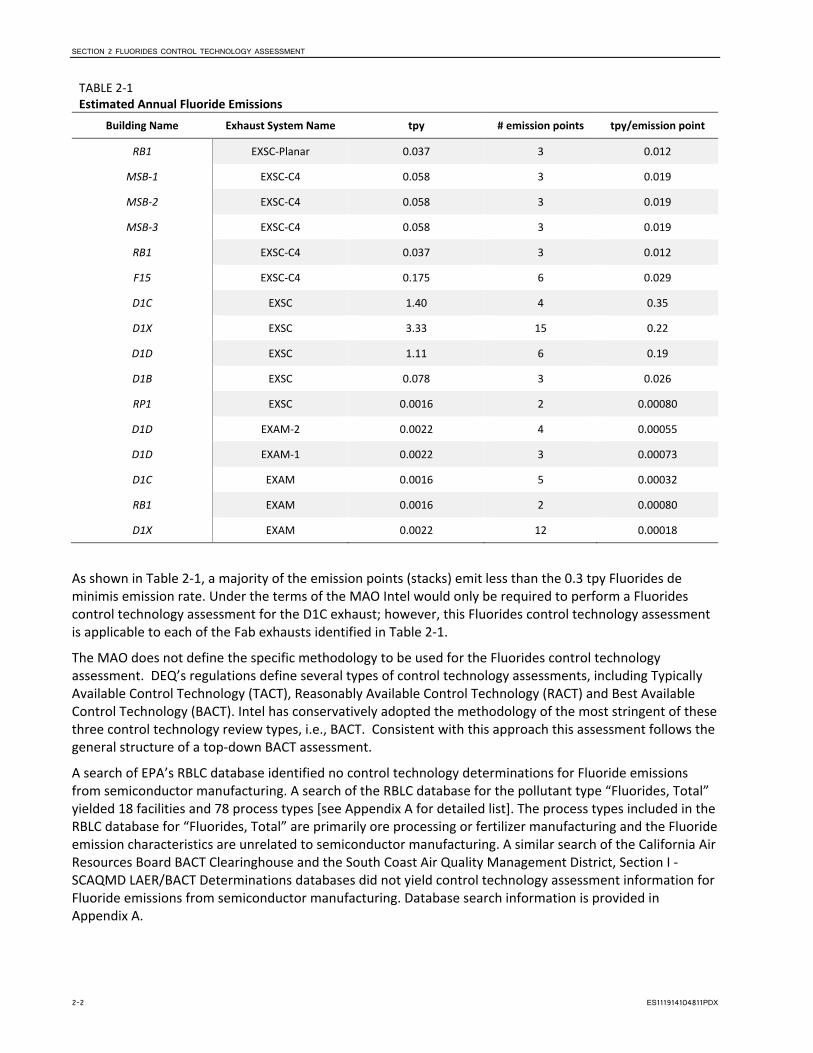
Table 2‐1 provides the estimated annual Fluoride emissions from each building air pollution control system, the number of emission points associated with the system and the annual average “potential to emit” of Fluorides from each emission point.
SECTION 2 FLUORIDES CONTROL TECHNOLOGY ASSESSMENT
2-2 ES111914104811PDX
TABLE 2‐1 Estimated Annual Fluoride Emissions
Building Name Exhaust System Name tpy # emission points tpy/emission point
RB1 EXSC‐Planar 0.037 3 0.012
MSB‐1 EXSC‐C4 0.058 3 0.019
MSB‐2 EXSC‐C4 0.058 3 0.019
MSB‐3 EXSC‐C4 0.058 3 0.019
RB1 EXSC‐C4 0.037 3 0.012
F15 EXSC‐C4 0.175 6 0.029
D1C EXSC 1.40 4 0.35
D1X EXSC 3.33 15 0.22
D1D EXSC 1.11 6 0.19
D1B EXSC 0.078 3 0.026
RP1 EXSC 0.0016 2 0.00080
D1D EXAM‐2 0.0022 4 0.00055
D1D EXAM‐1 0.0022 3 0.00073
D1C EXAM 0.0016 5 0.00032
RB1 EXAM 0.0016 2 0.00080
D1X EXAM 0.0022 12 0.00018
As shown in Table 2‐1, a majority of the emission points (stacks) emit less than the 0.3 tpy Fluorides de minimis emission rate. Under the terms of the MAO Intel would only be required to perform a Fluorides control technology assessment for the D1C exhaust; however, this Fluorides control technology assessment is applicable to each of the Fab exhausts identified in Table 2‐1.
The MAO does not define the specific methodology to be used for the Fluorides control technology assessment. DEQ’s regulations define several types of control technology assessments, including Typically Available Control Technology (TACT), Reasonably Available Control Technology (RACT) and Best Available Control Technology (BACT). Intel has conservatively adopted the methodology of the most stringent of these three control technology review types, i.e., BACT. Consistent with this approach this assessment follows the general structure of a top‐down BACT assessment.
A search of EPA’s RBLC database identified no control technology determinations for Fluoride emissions from semiconductor manufacturing. A search of the RBLC database for the pollutant type “Fluorides, Total” yielded 18 facilities and 78 process types [see Appendix A for detailed list]. The process types included in the RBLC database for “Fluorides, Total” are primarily ore processing or fertilizer manufacturing and the Fluoride emission characteristics are unrelated to semiconductor manufacturing. A similar search of the California Air Resources Board BACT Clearinghouse and the South Coast Air Quality Management District, Section I ‐ SCAQMD LAER/BACT Determinations databases did not yield control technology assessment information for Fluoride emissions from semiconductor manufacturing. Database search information is provided in Appendix A.

SECTION 2 FLUORIDES CONTROL TECHNOLOGY ASSESSMENT
ES111914104811PDX 2-3
2.2 Fluoride Use in Semiconductor Manufacturing Semiconductor devices are integrated circuits (ICs) which in today’s applications consist of billions of devices manufactured and interconnected on a single semiconductor substrate, or wafer. A semiconductor wafer is silicon based. Without the unique characteristics of nature’s silicon/silicon dioxide system, miniaturization of semiconductor devices required for today’s computing applications would not be possible.
Fluorine compounds are used in semiconductor manufacturing applications primarily to etch, or remove, silicon and clean reaction chambers. The ability of fluorine compounds to etch silicon materials in the manner required to produce microelectronic circuitry is unsurpassed. Fluoride use to miniaturize semiconductor devices is as fundamental and necessary as the silicon based substrates themselves.
2.3 Fluoride as a Regulated Air Pollutant Fluorides became regulated in 1977 when six New Source Performance Standards (NSPS) were promulgated for aluminum and phosphate fertilizer manufacturing sources. Fluorides were defined by rule as inorganic fluoride compounds (other than HF) that are measured by EPA Method 13. In 1980, the Clean Air Act was amended and a number of non‐criteria pollutants, including Fluorides, were added to EPA’s New Source Review (NSR) program. Oregon adopted its own NSR program in 1981 and that program was approved into the State Implementation Plan in 1982. From the outset, this Oregon NSR program adopted the federal definition of Fluorides and a 3‐tpy Significant Emission Rate. In 2001, DEQ revised its regulations to include de minimis emission rates for a variety of regulated pollutants including Fluorides. The Fluorides de minimis emission rate was established as 0.3 tpy and that de minimis rate has not subsequently changed.
2.4 Fluoride Emissions at Intel As previously discussed, fluorine compounds are used in the semiconductor manufacturing process to etch silicon materials and enable device miniaturization required for today’s computing application. Before their use in the manufacturing process, the following types of fluorine containing compounds may be brought to the site:
Perfluorocarbon (PFC) gases – Organofluorine compounds that contain carbon and fluorine
Hydrofluorocarbon (HFC) gases – Organofluorine compounds that contain carbon, fluorine and hydrogen
Inorganic Fluorine containing gases – These include Nitrogen Trifluoride (NF3) and Sulfur Hexafluoride (SF6)
Aqueous chemicals – These primarily include acidic solutions of HF
Collectively, the fluorine containing gases previously described are referred to in the industry as “F‐gases.” F‐gases are the primary source of Fluoride emissions in semiconductor manufacturing. Schematically, the process flow for F‐gas use in semiconductor manufacturing is provided in Figure 2‐2.
FIGURE 2‐2 F‐Gas Process Flow

SECTION 2 FLUORIDES CONTROL TECHNOLOGY ASSESSMENT
2-4 ES111914104811PDX
Conversion of F‐gases to “Fluorides” subsequent to their use in the manufacturing process depends on a number of factors including the following:
Chemical characteristics of the gas used
Type of process tool used
Whether the F‐gas is used to etch a wafer or used for cleaning the process chamber
Point‐of‐Use Abatement (these devices are primarily used for personnel safety, protection of downstream equipment and the abatement of greenhouse gases)
In general, these factors influence the fate of the F‐gases and the extent to which:
They remain unreacted
They are converted to Fluorides
They are converted to HF and are effectively removed in the packed bed wet scrubber exhaust systems
Prior to entering the centralized wet scrubber system, a significant proportion of the reacted F‐gases are converted to HF. However, some of the gases remain in their original form or are converted and contribute to Fluoride emissions.
Fluorides are primarily emitted through the Fab’s corrosive scrubbed exhaust system, which is typically referred to at Intel as the “EXSC” system. For this control technology assessment, the average Fluoride emissions and exhaust management system airflows for the four primary Fabs at the Ronler Acres campus (Fabs D1B, D1C, D1D, & D1X) were established to define typical operating conditions, as provided in Table 2‐2.
TABLE 2‐2 Average Fluoride Emission Rate and Air Flow
Average Fluoride Emission Rate— lb/hr 0.23
Average Fluoride Emission Rate –tpy 0.99
Average System Air Flow—standard cubic feet per minute (scfm) 274,000
2.5 Assessment The Fab exhaust management system including point of use (POU) devices is vital and integral to the process of manufacturing semiconductor devices. In addition to protecting downstream equipment and the safety of Fab personnel, the system manages airflow out of the cleanroom space to limit micro‐contamination of the semiconductor devices during manufacturing. As such, control methods to reduce Fluoride emissions from Fab processes are limited to treatment at the end of the Fab exhaust management system.
Table 2‐2 identifies a relatively small mass pollutant‐loading rate entrained in a large volume of air. The large air volume characteristic is a requirement of all semiconductor exhaust ventilation systems. Exhaust air flow rates from process tools and gas delivery systems are driven by fire and safety code requirements in addition to process cleanliness requirements.
As previously described, Intel, as well as the majority of the semiconductor industry, uses a centralized packed‐bed water‐based wet scrubber to control emissions of Fluorides, HF, and other acid gases. The scrubbers consist of a chamber containing packing material that provides a large surface area for liquid‐gas contact. The scrubbing liquid is introduced above the packing and flows down through the bed. Gases that are soluble in the scrubbing solution and have sufficient residence time in the chamber are absorbed and removed from the air stream. For inorganic acid gas control, a caustic such as sodium hydroxide is added to the solution to enhance the rate of absorption.
SECTION 2 FLUORIDES CONTROL TECHNOLOGY ASSESSMENT
ES111914104811PDX 2-5
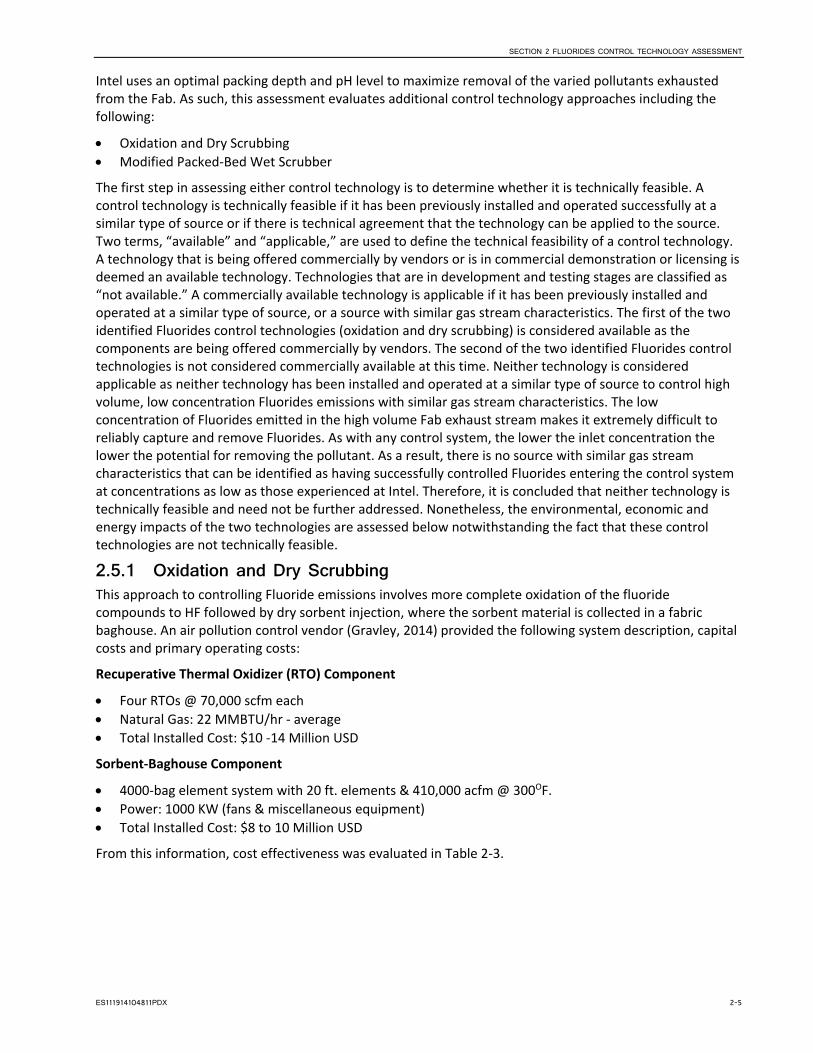
Intel uses an optimal packing depth and pH level to maximize removal of the varied pollutants exhausted from the Fab. As such, this assessment evaluates additional control technology approaches including the following:
Oxidation and Dry Scrubbing
Modified Packed‐Bed Wet Scrubber
The first step in assessing either control technology is to determine whether it is technically feasible. A control technology is technically feasible if it has been previously installed and operated successfully at a similar type of source or if there is technical agreement that the technology can be applied to the source. Two terms, “available” and “applicable,” are used to define the technical feasibility of a control technology. A technology that is being offered commercially by vendors or is in commercial demonstration or licensing is deemed an available technology. Technologies that are in development and testing stages are classified as “not available.” A commercially available technology is applicable if it has been previously installed and operated at a similar type of source, or a source with similar gas stream characteristics. The first of the two identified Fluorides control technologies (oxidation and dry scrubbing) is considered available as the components are being offered commercially by vendors. The second of the two identified Fluorides control technologies is not considered commercially available at this time. Neither technology is considered applicable as neither technology has been installed and operated at a similar type of source to control high volume, low concentration Fluorides emissions with similar gas stream characteristics. The low concentration of Fluorides emitted in the high volume Fab exhaust stream makes it extremely difficult to reliably capture and remove Fluorides. As with any control system, the lower the inlet concentration the lower the potential for removing the pollutant. As a result, there is no source with similar gas stream characteristics that can be identified as having successfully controlled Fluorides entering the control system at concentrations as low as those experienced at Intel. Therefore, it is concluded that neither technology is technically feasible and need not be further addressed. Nonetheless, the environmental, economic and energy impacts of the two technologies are assessed below notwithstanding the fact that these control technologies are not technically feasible.
2.5.1 Oxidation and Dry Scrubbing This approach to controlling Fluoride emissions involves more complete oxidation of the fluoride compounds to HF followed by dry sorbent injection, where the sorbent material is collected in a fabric baghouse. An air pollution control vendor (Gravley, 2014) provided the following system description, capital costs and primary operating costs:
Recuperative Thermal Oxidizer (RTO) Component
Four RTOs @ 70,000 scfm each
Natural Gas: 22 MMBTU/hr ‐ average
Total Installed Cost: $10 ‐14 Million USD
Sorbent‐Baghouse Component
4000‐bag element system with 20 ft. elements & 410,000 acfm @ 300OF.
Power: 1000 KW (fans & miscellaneous equipment)
Total Installed Cost: $8 to 10 Million USD
From this information, cost effectiveness was evaluated in Table 2‐3.

SECTION 2 FLUORIDES CONTROL TECHNOLOGY ASSESSMENT
2-6 ES111914104811PDX
TABLE 2‐3 Cost Effectiveness of Oxidation & Dry Scrubbing System Fluoride Control Technology Assessment
Cost Element Capital Cost ($) Annual Cost ($/yr)
RTO Capital Cost 12,000,000
RTO Capital Cost Recovery (15 yr. equipment lifetime @ 7% interest) 1,317,600
Natural Gas: 22 MMBTU/hr @ $5/MMBTU 963,600
Adsorbent‐Baghouse System Capital Cost 9,000,000
Adsorbent‐Baghouse System Capital Cost (15 yr. equipment lifetime @ 7% interest)
988,200
Power (1000 KW @ $0.06/kW‐hr) 525,600
Total Annual Cost 3,795,000
TPY Fluoride Removed @ assumed 95% eff. (from Table 2‐2 )a 0.94
$/ton Fluoride Removed 4,037,234
aThe 95% removal efficiency is an assumed value used to conservatively calculate cost effectiveness. It is not known if this removal efficiency can be accomplished as the system has not been demonstrated to be technically feasible.
Because of the very low concentration of Fluorides contained in the Fab Exhaust Management System the cost of controlling the Fluoride emissions is extraordinarily high on a per ton of pollutant removed basis. Controlling Fluoride emissions with a RTO/Sorbent‐Baghouse system is not cost effective.
The environmental impacts of an RTO/Sorbent‐Baghouse system are also high. As with any sorbent system, these controls would generate a significant amount of solid waste that would have to be disposed of off‐site. The mining and processing of the sorbent, the transport of the sorbent to and from the Intel facility and the waste itself all have significant environmental impacts. In addition, the combustion of natural gas in the RTOs result in the generation of greenhouse gases and various criteria pollutants including CO and NOx. For a natural gas requirement of 22 MMBTU/hr annual emission of these pollutants would be on the order of1:
CO2: 11,240 tpy;
CO: 8.0 tpy;
NOx: 9.5 tpy.
Energy impacts are also material. Pressure drop associated with the controls must be overcome with additional energy usage.
In summary, the use of an RTO/Sorbent‐Baghouse system is not technically feasible for an application such as this based on the very low concentration and high volume exhaust stream. However, even if the control system was technically feasible, it should be eliminated based on an assessment of its economic, environmental and energy impacts.
2.5.2 Modified Packed-Bed Wet Scrubber Theoretically, Fluorides can also be treated using a two‐stage wet scrubber by adding a reducing agent such as sodium sulfite to ultimately remove fluorine compounds in the scrubbing section as sodium fluoride. Such systems are not commercially available and significant experimentation would be required to bring such a control system to the implementation stage. EPA has issued the following guidance on performing control technology assessments:
1 Based on a CO2 emission factor of 53.02 kg/MMBTU, a CO emission factor of 84 lb/MMCF, and a NOx emission factor of 100 lb/MMCF.

SECTION 2 FLUORIDES CONTROL TECHNOLOGY ASSESSMENT
ES111914104811PDX 2-7
A control technique is considered available, within the context presented above, if it has reached the licensing and commercial sales stage of development. A source would not be required to experience extended time delays or resource penalties to allow research to be conducted on a new technique. Neither is it expected that an applicant would be required to experience extended trials to learn how to apply a technology on a totally new and dissimilar source type. Consequently, technologies in the pilot scale testing stages of development would not be considered available for BACT review. EPA New Source Review Workshop Manual; p. B.18 (1990).
This guidance clearly states that control technologies that are, at best, at the pilot stage, need not be considered technically feasible. Nonetheless, pilot scale information was retrieved from an air pollution control vendor (HEE Environmental Engineering, see Section 8 – References) as part of this assessment. Pilot scale system characteristics are as follows:
Air flow: 700 actual cubic feet per minute (acfm)
Stage One: Water scrubbing to remove HF and provide dilution of reducing agent in second stage
Stage Two: Water scrubbing with sodium hydroxide and sodium sulfite
Total Blowdown: 18.6 gallons per minute (gpm)
Technical Feasibility: Concerns over severe fouling resulting from the formation of H2SiF6
Fluoride Loading: In terms of exhaust system airflow, this pilot system is about 1/390th size of a full fab exhaust management system. Economies of scale may improve slightly the cost effectiveness of this control technology (on a $/ton of pollutant removed basis). As such it is conservatively assumed that the Fluoride loading is only 1/100th the size of a full fab exhaust system or approximately 0.0023 lb/hr
Purchased Equipment Cost: $203,903
Table 2‐4 below summarizes the cost feasibility assessment and a detailed cost assessment is provided in Appendix B.
TABLE 2‐4 Fluoride Control Cost Comparison Wet Chemical Scrubber
Option 1 Option 2
Cost Component Fluoride Base Case
No Additional Control
2‐Stage Wet Chemical Scrubbing System
Total Capital Investment 0 $450,626
Total Annual Cost 0 $196,991
TPY Fluoride Removed @ assumed 95% eff.a 0 0.0096
$/ton Fluoride Removed 0 $20,583,528
aThe 95% removal efficiency is an assumed value used to conservatively calculate cost effectiveness. It is not known if this removal efficiency can be accomplished as the system has not been demonstrated to be technically feasible.
As shown in Table 2‐4, using a modified packed‐bed wet chemical scrubber to control the relatively small amount of Fluoride entrained in the Fab exhaust management system is not economically practical.
The environmental impacts of a Packed Bed Wet Scrubber system are also high. The system requires the use of sodium hydroxide and sodium sulfite. The pilot system requires at least 18.6 gpm of fresh water and would also discharge at that same rate chemically contaminated wastewater. A full‐scale system could thus

SECTION 2 FLUORIDES CONTROL TECHNOLOGY ASSESSMENT
2-8 ES111914104811PDX
require up to 10 million gallons a day of water and a corresponding amount of wastewater requiring treatment and discharge2.
Energy impacts are also material. Pressure drop associated with the controls must be overcome with additional energy usage.
In summary, the use of a Packed‐Bed Wet Chemical Scrubber system is not technically feasible for an application such as this because it is not commercially available and has never been demonstrated at a scale remotely close to that which would be encountered in the current application. However, even if the control system was technically feasible, it would be eliminated based on an assessment of its economic, environmental and energy impacts.
2.6 Conclusions The concentrations and overall mass of Fluorides entrained in the Fab exhaust management system are extremely small. This assessment evaluated two technologies to control Fluorides:
1) Oxidation and Dry Scrubbing,
2) Modified Packed‐Bed Wet Scrubber.
Neither technology is considered technically feasible at this time. In addition, both technologies are prohibitively expensive and have significant environmental and energy impacts. For these reasons, neither technology is appropriate for control of the very low concentrations of Fluorides encountered in the Fab exhaust and the existing baseline technology is the best available for this application.
2 Based on the full scale system requiring about 390 times as much water as the pilot system.

SECTION 3
ES111914104811PDX 3-1
Ambient Air Quality Modeling Assessment of Fluorides and Hydrogen Fluoride As stated in Section 1 of this report, Intel agreed as part of the MAO to perform modeling for Fluorides and HF, including a comparison of accepted, risk‐based, chronic exposure thresholds to modeled concentrations at the nearest residences. This section summarizes the ambient air modeling for Fluorides and HF completed to fulfill this requirement.
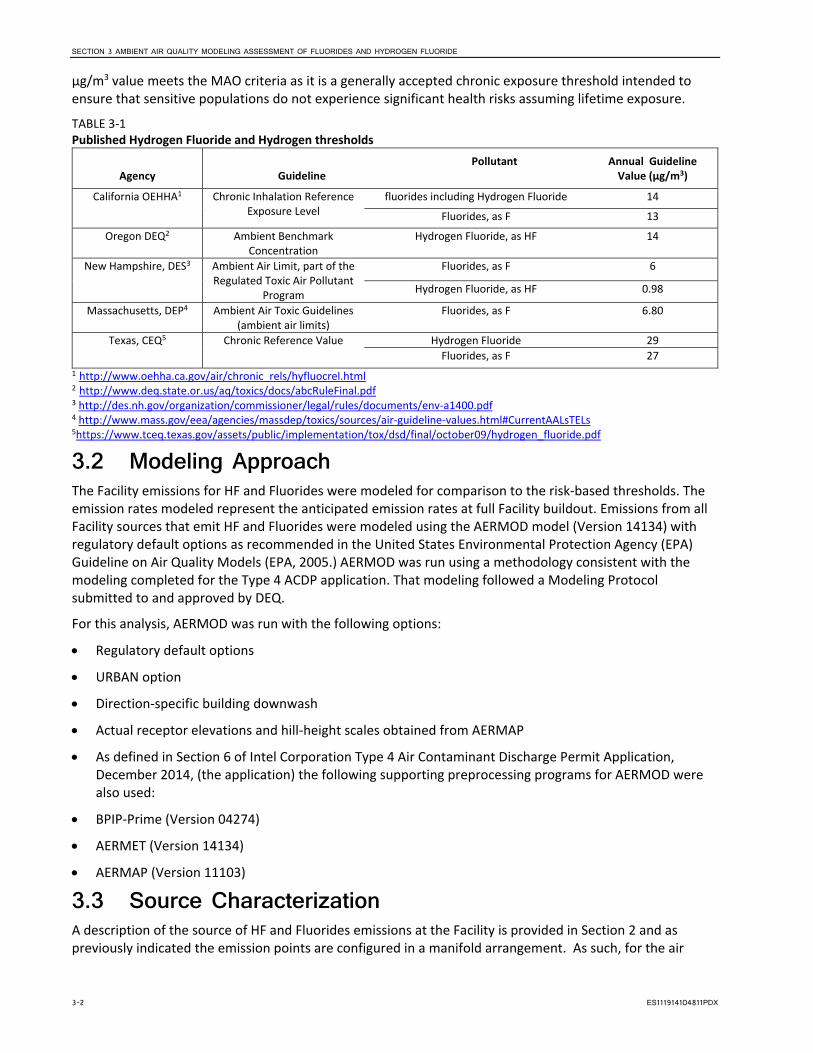
3.1 Standards and Criteria Levels The MAO specifically requires “Ambient air quality modeling of hydrogen fluoride and Fluorides including a comparison of accepted risk‐based chronic exposure thresholds to modeled concentrations at the nearest residences.” Since neither HF nor Fluorides have a national ambient air quality standard, an acceptable threshold for these pollutants was determined by reviewing existing annual standards from state agencies. Table 3‐1 details findings of the regulatory review.
The most appropriate risk‐based chronic exposure threshold to use for HF is the Oregon ambient benchmark concentration (ABC). ABCs are defined under DEQ’s regulations as “the concentration of an air toxic in outdoor air that would result in an excess lifetime cancer risk level of one in a million (1 x 10‐6) or a non‐cancer hazard quotient of one.”3 ABCs are established by rule in units of micrograms per cubic meter on an annual average basis. 4 ABCs are developed by the Oregon Air Toxics Science Advisory Committee (ATSAC) and adopted by the Environmental Quality Commission after public notice and comment. The HF ABC was recently adopted (2006) by the Environmental Quality Commission after review by the ATSAC and extensive public review and participation. The Oregon ABC is based on the 2003 HF reference concentration (RfC) adopted by the California Office of Environmental Health Hazard Assessment (OEHHA).5 In adopting this ABC, DEQ recognized that EPA’s 1999 National Air Toxics Assessment employed a 30 µg/m3 RfC, but DEQ opted to recommend to the Environmental Quality Commission the adoption of the lower 2003 OEHHA RfC.6 In October 2009, the Texas Commission on Environmental Quality adopted 29 µg HF/m3 and 27 µg F/m3 as that state’s Chronic Reference Values for HF and F. New Hampshire has adopted a 0.98 µg/m3 threshold, but this value deviates substantially from the other accepted values and was not recommended for adoption by the ATSAC and so is not considered appropriate for use in this evaluation. Therefore, the HF ABC meets the MAO criteria as it is a generally accepted chronic exposure threshold intended to ensure that sensitive populations do not experience significant health risks assuming lifetime exposure.
The most appropriate risk‐based chronic exposure threshold to use for Fluorides is the OEHHA chronic inhalation REL of 13 µg/m3. At the same time that the Fluorides REL was adopted, OEHHA also adopted a Fluorides (excluding HF) chronic inhalation REL of 13 µg/m3. Oregon has not adopted an ABC for Fluorides. As shown in Table 3‐1, New Hampshire and Massachusetts have adopted lower thresholds for Fluorides under their state programs of 6 and 6.8 µg/m3, respectively. These values deviate substantially from the California and Texas values and are not considered appropriate for use in this assessment. Therefore, the 13
3 OAR 340‐246‐0030(2)
4 OAR 340‐246‐0090
5 A RfC is an estimate of a continuous inhalation exposure concentration to people (including sensitive subgroups) that is likely to be without risk of deleterious effects during a lifetime. EPA employs the term RfC. California’s equivalent to a RfC is a Reference Exposure Level (REL).
6 See, Summary of Air Toxics Science Advisory Committee Deliberations, p.C54 of August 10, 2006 rulemaking package submitted by DEQ to the Environmental Quality Commission
SECTION 3 AMBIENT AIR QUALITY MODELING ASSESSMENT OF FLUORIDES AND HYDROGEN FLUORIDE
3-2 ES111914104811PDX
µg/m3 value meets the MAO criteria as it is a generally accepted chronic exposure threshold intended to ensure that sensitive populations do not experience significant health risks assuming lifetime exposure.
TABLE 3‐1 Published Hydrogen Fluoride and Hydrogen thresholds
Agency Guideline Pollutant Annual Guideline
Value (µg/m3)
California OEHHA1 Chronic Inhalation Reference Exposure Level
fluorides including Hydrogen Fluoride 14
Fluorides, as F 13
Oregon DEQ2 Ambient Benchmark Concentration
Hydrogen Fluoride, as HF 14
New Hampshire, DES3 Ambient Air Limit, part of the Regulated Toxic Air Pollutant
Program
Fluorides, as F 6
Hydrogen Fluoride, as HF 0.98
Massachusetts, DEP4 Ambient Air Toxic Guidelines (ambient air limits)
Fluorides, as F 6.80
Texas, CEQ5 Chronic Reference Value Hydrogen Fluoride 29
Fluorides, as F 27
1 http://www.oehha.ca.gov/air/chronic_rels/hyfluocrel.html 2 http://www.deq.state.or.us/aq/toxics/docs/abcRuleFinal.pdf 3 http://des.nh.gov/organization/commissioner/legal/rules/documents/env‐a1400.pdf 4 http://www.mass.gov/eea/agencies/massdep/toxics/sources/air‐guideline‐values.html#CurrentAALsTELs 5https://www.tceq.texas.gov/assets/public/implementation/tox/dsd/final/october09/hydrogen_fluoride.pdf
3.2 Modeling Approach The Facility emissions for HF and Fluorides were modeled for comparison to the risk‐based thresholds. The emission rates modeled represent the anticipated emission rates at full Facility buildout. Emissions from all Facility sources that emit HF and Fluorides were modeled using the AERMOD model (Version 14134) with regulatory default options as recommended in the United States Environmental Protection Agency (EPA) Guideline on Air Quality Models (EPA, 2005.) AERMOD was run using a methodology consistent with the modeling completed for the Type 4 ACDP application. That modeling followed a Modeling Protocol submitted to and approved by DEQ.
For this analysis, AERMOD was run with the following options:
Regulatory default options
URBAN option
Direction‐specific building downwash
Actual receptor elevations and hill‐height scales obtained from AERMAP
As defined in Section 6 of Intel Corporation Type 4 Air Contaminant Discharge Permit Application, December 2014, (the application) the following supporting preprocessing programs for AERMOD were also used:
BPIP‐Prime (Version 04274)
AERMET (Version 14134)
AERMAP (Version 11103)
3.3 Source Characterization A description of the source of HF and Fluorides emissions at the Facility is provided in Section 2 and as previously indicated the emission points are configured in a manifold arrangement. As such, for the air

SECTION 3 AMBIENT AIR QUALITY MODELING ASSESSMENT OF FLUORIDES AND HYDROGEN FLUORIDE
ES111914104811PDX 3-3
dispersion modeling analysis, the sum of emissions from all scrubbers exhausting to a given manifold were be modeled as emitting from one “pseudo‐stack” representing each set of scrubber stacks.
The scrubber emissions and stack properties were determined using the manufacturer’s engineering specifications, engineering calculations, and site specific stack testing data and are provided in section 3 of the Type 4 ACDP application.
3.4 Results The results of the HF and Fluorides air dispersion modeling analyses are presented in Table 3‐2. The Facility impacts for HF are less than the Oregon benchmark of 14 µg/m3 for HF. The Facility impacts for Fluorides are lower than the California OEHHA chronic inhalation REL of 13 µg/m3.
TABLE 3‐2 Results of Hydrogen Fluoride and Fluoride Analysis
Pollutant Averaging Period
Maximum Modeled Concentration (µg/m³)
Chronic Exposure Threshold (µg/m3)
Under Chronic Exposure Threshold?
HF Annual 0.50 14 Yes
F Annual 0.38 13 Yes

This page intentionally left blank

4-1
SECTION 4
References Doherty, Michael K./HEE Environmental Engineering, LLC. 2014. “Scrubber/ Fan System Proposal.” Letter to Intel Corporation. March 18.
Gravley, Rod/Tri‐Mer. 2014. “Fluoride Control.” Personal communication (e‐mail) to John Browning. August 20.
Lantec Products, Inc. 2003. HEE Environmental Engineering for Two‐Stage Scrubbing. Scrubber Data Sheet.
Volbeda, John/HEE Environmental Engineering. 2014. Utility Consumption Estimates. March 14.

This page intentionally left blank

Appendix A BACT Database Search Results

This page intentionally left blank

A-1
APPENDIX A
BACT Database Search Results The U.S. Environmental Protection Agency has maintained the Technology Transfer Network, Clean Air Technology Center – RACT/BACT/LAER Clearinghouse (RBLC) from 2004 to present for the United States only (http://cfpub.epa.gov/rblc/index.cfm?Action=search.BasicSearch). A search of the RBLC database provided no Best Available Control Technology (BACT) determinations for Fluoride emissions from the process type “semiconductor manufacturing.” Search results and explanations are provided below.
Fluoride (Pollutant Name: Fluorides, Total)
Date posted RBLC ID Company Explanation Date accessed
4/24/2014 IN‐0185 MAG PELLET LLC Iron ore concentrate pelletizing plant. Not comparable to semiconductor manufacturing.
10/2/2014
4/16/2013 IN‐0167 MAGNETATION LLC Iron ore concentrate pelletizing plant. Not comparable to semiconductor manufacturing.
10/2/2014
11/19/2012 FL‐0336 PINELLAS CO. DEPT OF ENVIR AND INFRASTRUCTURE PINELLAS COUNTY RES RECOVERY FACILITY
Landfill, waste combustion, and associated activities. Not comparable to semiconductor manufacturing.
10/2/2014
5/10/2012 MN‐0085 ESSAR STEEL MINNESOTA LLC Taconite ore mining and processing facility that also produces finished steel. Not comparable to semiconductor manufacturing.
10/2/2014
2/16/2011 TX‐0579 AGRIFOS FERTILIZER INC. PHOSPHATE FERTILIZER PLANT
Phosphate fertilizer plant. Not comparable to semiconductor manufacturing.
10/2/2014
12/29/2010 OH‐0342 THE TIMKEN COMPANY FAIRCREST STEEL
Steel plant. Not comparable to semiconductor manufacturing.
10/2/2014
2/8/2010 IN‐0140 NUCOR STEEL Stationary steel mini‐mill. Not comparable to semiconductor manufacturing.
10/2/2014
1/11/2010 OH‐0331 AK STEEL CORPORATION MANSFIELD WORKS
Steel shop using electric arc furnaces. Not comparable to semiconductor manufacturing.
10/2/2014
10/6/2009 IN‐0146 EVONIK DEGUSSA CORPORATION‐TIPPECANOE LABORATORIES
Pharmaceutical manufacturing plant. Not comparable to semiconductor manufacturing.
10/2/2014
12/23/2008 OH‐0330 RUMPKE SANITARY LANDFILL Municipal solid waste landfill. Not comparable to semiconductor manufacturing.
10/2/2014
12/22/2008 MN‐0077 UNITED STATES STEEL CORPORATION MINNESOTA ORE OPERATIONS ‐ MINNTAC
Iron ore pelletizing plant. Not comparable to semiconductor manufacturing.
10/2/2014
5/6/2008 OH‐0315 NEW STEEL INTERNATIONAL, INC., HAVERHILL
Steel mini‐mill. Not comparable to semiconductor manufacturing.
10/2/2014

APPENDIX A BACT DATABASE SEARCH RESULTS
2 ES111914104811PDX
Fluoride (Pollutant Name: Fluorides, Total)
Date posted RBLC ID Company Explanation Date accessed
4/8/2008 NE‐0047 ENDICOTT CLAY PRODUCTS Brick and tile manufacturing. Not comparable to semiconductor manufacturing.
10/2/2014
9/7/2007 MN‐0070 MINNESOTA STEEL INDUSTRIES, LLC Mine mouth electric arc furnace steel mill. Not comparable to semiconductor manufacturing.
10/2/2014
9/11/2006 NE‐0033 AG PROCESSING INC AGP SOY PROCESSING FACILITY
Coal boiler at soy processing facility. Not comparable to semiconductor manufacturing.
10/2/2014
6/26/2005 MN‐0061 MESABI NUGGET LLC ERIE NUGGET
Iron nugget processing. Not comparable to semiconductor manufacturing.
10/2/2014
3/9/2005 NE‐0031 OMAHA PUBLIC POWER DISTRICT OPPD ‐ NEBRASKA CITY STATION
Electrical generating plant. Not comparable to semiconductor manufacturing.
10/2/2014
3/16/2004 FL‐0259 CARGILL FERTILIZER, INC. RIVERVIEW FACILITY
Phosphate fertilizer plant. Not comparable to semiconductor manufacturing.
10/2/2014
California Air Resources Board BACT Clearinghouse (http://arb.ca.gov/bact/bactnew/rptpara.htm).
Search was performed on 12/3/2014. The Clearinghouse includes three categories for Semiconductor Manufacturing Operations. None of these categories had BACT entries as of 12/2/2014. The Clearinghouse does not contains a Pollutant category for Fluoride. A search conducted using the “other” category did not return results comparable to semiconductor manufacturing.
South Coast Air Quality Management District, Section I ‐ SCAQMD LAER/BACT Determinations (http://www.aqmd.gov/home/permits/bact/guidelines/i‐‐‐scaqmd‐laer‐bact)
Search was performed on 12/3/2014. SCAQMS lists determinations by the type of process or equipment. Semiconductor Manufacturing did not appear on the list. The only electronics‐related equipment listed was “Circuit Board Photoresist” which did not include a BACT determination for Fluoride. No other comparable process or equipment was found.
Appendix B Cost Estimate Worksheets

This page intentionally left blank

Pilot Packed Bed
Wet Scrubber
System
700 acfm Reference
DIRECT COSTS
Purchased Equipment Cost (PEC) = 203,903$ HEE
Interconnecting ducting, control panels
instruementation panels, pumps, fans
Direct installation costs (DIC)
Foundations & Supports 0.12(PEC) 24,468$ CCM Sect. 5.2, Ch. 1a
Handling and erection 0.40(PEC) 81,561$ CCM Sect. 5.2, Ch. 1
Electrical 0.01(PEC) 2,039$ CCM Sect. 5.2, Ch. 1
Piping 0.30(PEC) 61,171$ CCM Sect. 5.2, Ch. 1
Insulation 0.01(PEC) 2,039$ CCM Sect. 5.2, Ch. 1
Painting 0.01(PEC) 2,039$ CCM Sect. 5.2, Ch. 1
Site Preparation 0.01(PEC) 2,039$ Estimate
Buildings ‐$ Not Required
TOTAL DIRECT COSTS (DC = PEC+DIC) = 379,260$ Calculated Total
INDIRECT COSTS
Indirect Costs (installation)
Engineering 0.10(PEC) 20,390$ CCM Sect. 5.2, Ch. 1a
Construction and field expenses 0.10(PEC) 20,390$ CCM Sect. 5.2, Ch. 1
Contractor fees 0.10(PEC) 20,390$ CCM Sect. 5.2, Ch. 1
Start‐up 0.01(PEC) 2,039$ CCM Sect. 5.2, Ch. 1
Performance test 0.01(PEC) 2,039$ CCM Sect. 5.2, Ch. 1
Contingencies 0.03(PEC) 6,117$ CCM Sect. 5.2, Ch. 1
TOTAL INDIRECT COSTS (IC) = 71,366$ Calculated Total
TOTAL CAPITAL INVESTMENT (TCI) (DC) + (IC) = 450,626$ Calculated Total
ANNUAL COSTS
Direct Annual Costs, DAC
Operating Labor
Operator 1/2 hr./shift @ $20/hr = 10,950$ CCM Sect. 5.2, Ch. 1
Supervisor 15% of operator = 1,643$ CCM Sect. 5.2, Ch. 1
Operating Materials
Solvent (water) $0.0037/gal & 18.6 gpm blowdown 36,172$ Estimate
Wastewater Disposal $0.0039/gal & 18.6 gpm blowdown = 38,127$ Estimate
Maintenance
Labor 1/2 hr./shift @ $20/hr = 10,950$ CCM Sect. 5.2, Ch. 1
Material 100% of maintenance labor = 10,950$ CCM Sect. 5.2, Ch. 1
TOTAL DIRECT ANNUAL COSTS (DAC) = 108,791$ Calculated Total
Indirect Annual Costs, IAC
Overhead 60% of total labor & material 20,696$ CCM Sect. 5.2, Ch. 1
Adminstrative Charges 0.02(TCI) 9,013$ CCM Sect. 5.2, Ch. 1
Property Tax 0.01(TCI) 4,506$ CCM Sect. 5.2, Ch. 1
Insurance 0.01(TCI) 4,506$ CCM Sect. 5.2, Ch. 1
Capital recoveryb 0.1098(TCI) 49,479$ CCM Sect. 5.2, Ch. 1
TOTAL INDIRECT ANNUAL COSTS (IAC) = 88,199$ Calculated Total
TOTAL ANNUAL COSTS (TAC) (DAC) + (IAC) = 196,991$ Calculated Total
TOTAL TONS REMOVED PER YEAR (Fluoride) = 0.0096 Based on Fluoride Removal CalculationC
COST EFFECTIVENESS ($ per ton of pollutant removed) = 20,583,528$ Calculated
Intel ‐ BACT
Cost Effectiveness Evaluation
Packed Bed Wet Scrubber for Fluoride Control
Notes:
a CCM Sect. 5.2, Ch. 1 = EPA Air Pollution Control Cost Manual - Sixth Edition (EPA 452/B-02-001). Section 5.2 Chapter 1 includes Includes cost estimatation concepts and methodology for Wet Scrubbers for Acid Gas.bCapital recovery assumes a 15-year life at 7%.cFluoride removal based on a loading rate of 0.0023 lb/hr or 0.010 tpy @ 95% DRE