Embed Size (px)
Citation preview
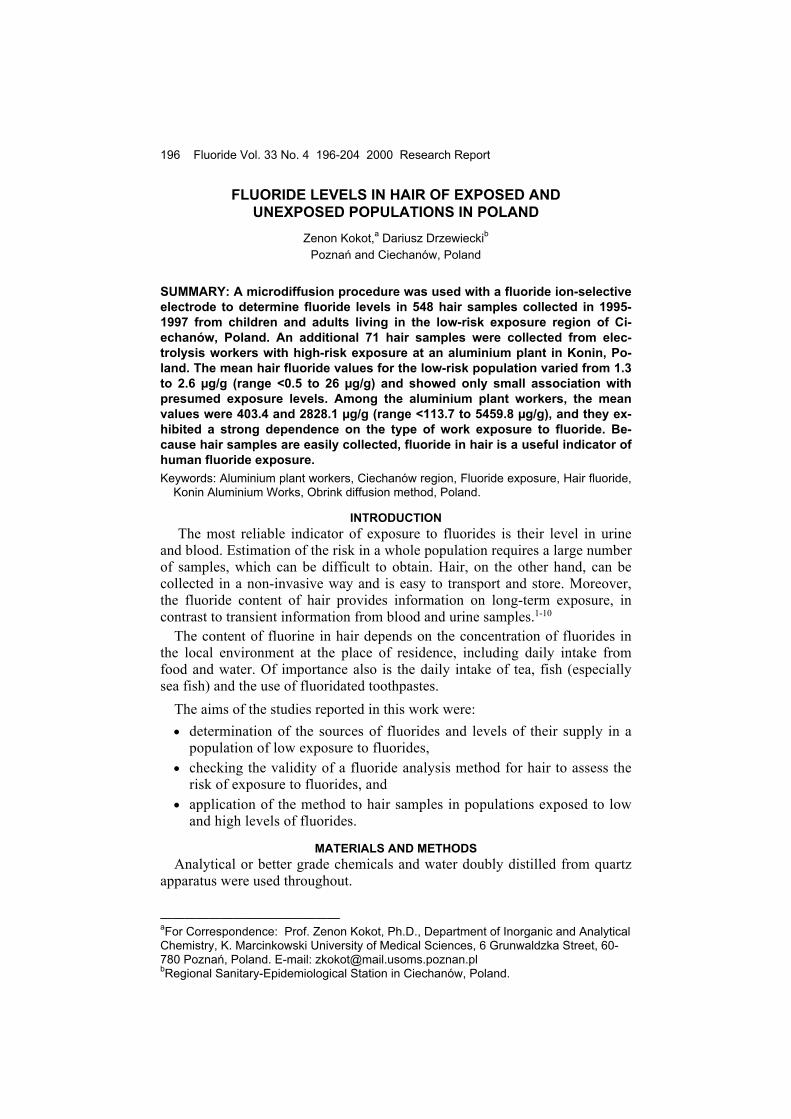
196 Fluoride Vol. 33 No. 4 196-204 2000 Research Report
———————————————aFor Correspondence: Prof. Zenon Kokot, Ph.D., Department of Inorganic and AnalyticalChemistry, K. Marcinkowski University of Medical Sciences, 6 Grunwaldzka Street, 60-780 Poznań, Poland. E-mail: [email protected] Sanitary-Epidemiological Station in Ciechanów, Poland.
FLUORIDE LEVELS IN HAIR OF EXPOSED ANDUNEXPOSED POPULATIONS IN POLAND
Zenon Kokot,a Dariusz Drzewieckib
Poznań and Ciechanów, Poland
SUMMARY: A microdiffusion procedure was used with a fluoride ion-selectiveelectrode to determine fluoride levels in 548 hair samples collected in 1995-1997 from children and adults living in the low-risk exposure region of Ci-echanów, Poland. An additional 71 hair samples were collected from elec-trolysis workers with high-risk exposure at an aluminium plant in Konin, Po-land. The mean hair fluoride values for the low-risk population varied from 1.3to 2.6 µg/g (range <0.5 to 26 µg/g) and showed only small association withpresumed exposure levels. Among the aluminium plant workers, the meanvalues were 403.4 and 2828.1 µg/g (range <113.7 to 5459.8 µg/g), and they ex-hibited a strong dependence on the type of work exposure to fluoride. Be-cause hair samples are easily collected, fluoride in hair is a useful indicator ofhuman fluoride exposure.Keywords: Aluminium plant workers, Ciechanów region, Fluoride exposure, Hair fluoride,
Konin Aluminium Works, Obrink diffusion method, Poland.
INTRODUCTION The most reliable indicator of exposure to fluorides is their level in urine
and blood. Estimation of the risk in a whole population requires a large numberof samples, which can be difficult to obtain. Hair, on the other hand, can becollected in a non-invasive way and is easy to transport and store. Moreover,the fluoride content of hair provides information on long-term exposure, incontrast to transient information from blood and urine samples.1-10
The content of fluorine in hair depends on the concentration of fluorides inthe local environment at the place of residence, including daily intake fromfood and water. Of importance also is the daily intake of tea, fish (especiallysea fish) and the use of fluoridated toothpastes.
The aims of the studies reported in this work were:• determination of the sources of fluorides and levels of their supply in a
population of low exposure to fluorides,• checking the validity of a fluoride analysis method for hair to assess the
risk of exposure to fluorides, and• application of the method to hair samples in populations exposed to low
and high levels of fluorides.
MATERIALS AND METHODSAnalytical or better grade chemicals and water doubly distilled from quartz
apparatus were used throughout.
Fluoride levels in hair in Poland 197
Fluoride 33 (4) 2000
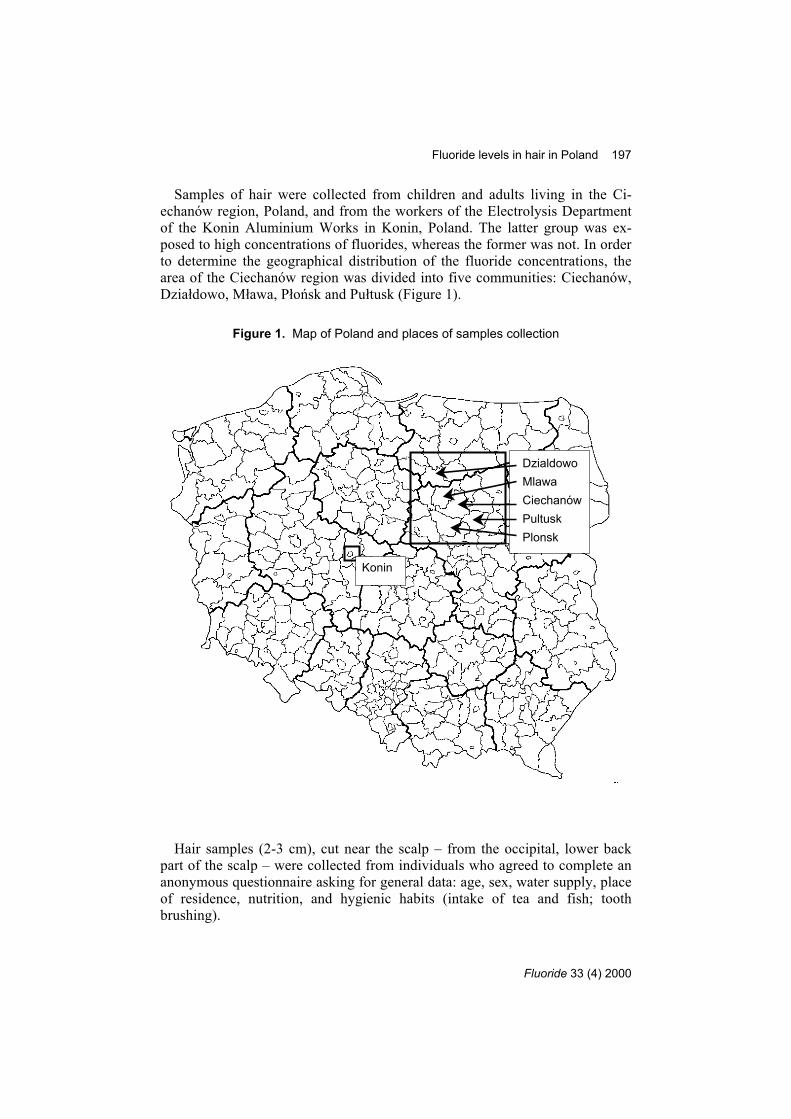
Samples of hair were collected from children and adults living in the Ci-echanów region, Poland, and from the workers of the Electrolysis Departmentof the Konin Aluminium Works in Konin, Poland. The latter group was ex-posed to high concentrations of fluorides, whereas the former was not. In orderto determine the geographical distribution of the fluoride concentrations, thearea of the Ciechanów region was divided into five communities: Ciechanów,Działdowo, Mława, Płońsk and Pułtusk (Figure 1).
Figure 1. Map of Poland and places of samples collection
Hair samples (2-3 cm), cut near the scalp – from the occipital, lower backpart of the scalp – were collected from individuals who agreed to complete ananonymous questionnaire asking for general data: age, sex, water supply, placeof residence, nutrition, and hygienic habits (intake of tea and fish; toothbrushing).
Konin
Dzialdowo Mlawa Ciechanów Pultusk Plonsk
198 Kokot, Drzewiecki
Fluoride 33 (4) 2000
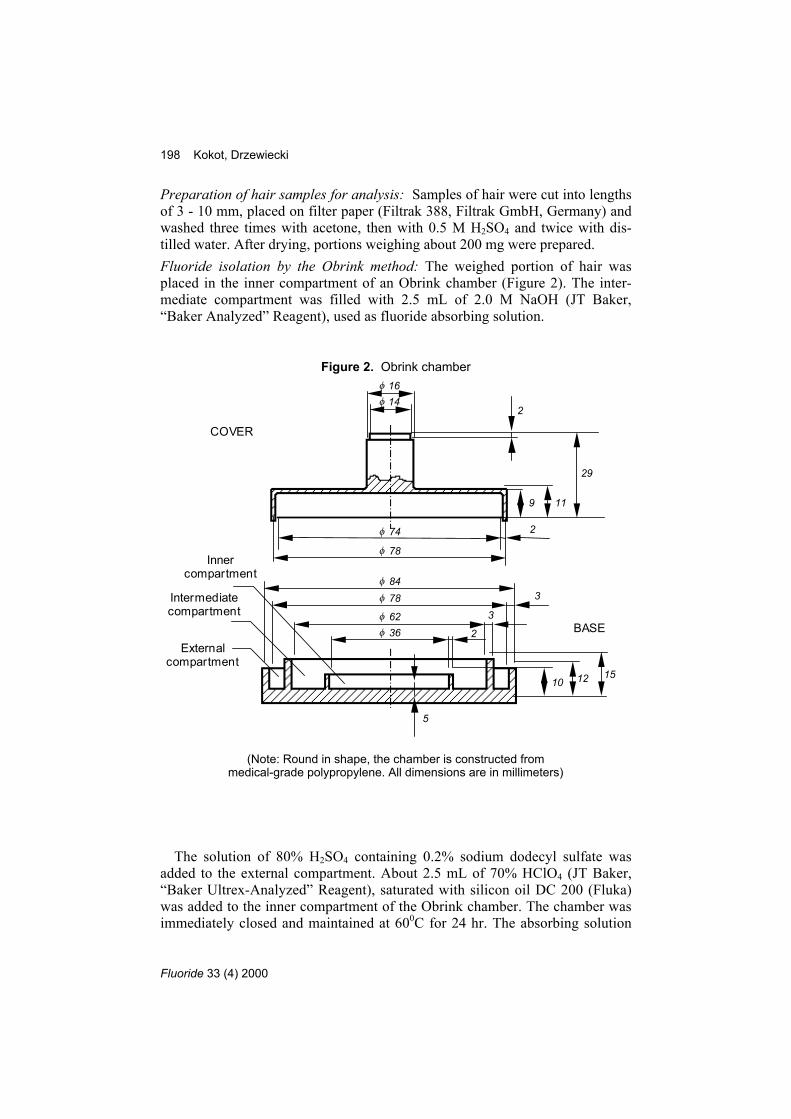
Preparation of hair samples for analysis: Samples of hair were cut into lengthsof 3 - 10 mm, placed on filter paper (Filtrak 388, Filtrak GmbH, Germany) andwashed three times with acetone, then with 0.5 M H2SO4 and twice with dis-tilled water. After drying, portions weighing about 200 mg were prepared.Fluoride isolation by the Obrink method: The weighed portion of hair wasplaced in the inner compartment of an Obrink chamber (Figure 2). The inter-mediate compartment was filled with 2.5 mL of 2.0 M NaOH (JT Baker,“Baker Analyzed” Reagent), used as fluoride absorbing solution.
Figure 2. Obrink chamber
The solution of 80% H2SO4 containing 0.2% sodium dodecyl sulfate wasadded to the external compartment. About 2.5 mL of 70% HClO4 (JT Baker,“Baker Ultrex-Analyzed” Reagent), saturated with silicon oil DC 200 (Fluka)was added to the inner compartment of the Obrink chamber. The chamber wasimmediately closed and maintained at 600C for 24 hr. The absorbing solution
(Note: Round in shape, the chamber is constructed frommedical-grade polypropylene. All dimensions are in millimeters)
Inner compartment
Intermediate compartment
External compartment
COVER
BASE
9
10
11
29
2
2
2
3
3
5
12 15
φ 14 φ 16
φ 36 φ 62
φ 78 φ 84
φ 78
φ 74
Fluoride levels in hair in Poland 199
Fluoride 33 (4) 2000
was then transferred quantitatively in five 1-mL water portions into a 10-mLvolumetric flask, neutralised with 2.0 M HClO4 in the presence of phe-nolophthalein. Immediately after neutralisation 2 mL of acetate buffer (pH 5.3)was added and the mixture diluted to 10 mL. The contents of the volumetricflask were poured into a closed polypropylene container, and samples stored inthis way were stable for least one week.11
The fluoride concentration in the samples was determined potentiometricallywith an ion-selective electrode. The following electrodes were used: an ion-selective fluoride electrode made by Detector, Warsaw (Poland), saturated chlo-rine-argentine electrode made by Hydromet, Gliwice (Poland), and a glass-complex electrode type ESAgP-301W made by Eurosensor. The other equip-ment included a digital pH meter N-5170 made by Tel-Eko, Wrocław (Poland),a magnetic stirrer made by Tel-Eko Wrocław, water bath, laboratory drier, andObrink chambers made of medical-grade polypropylene.Validation of the method for determination of fluoride concentrations: Vali-dation of the method of microdiffusion and determination of fluoride concen-tration by ion-selective electrode was performed with the same reagents andinstruments which were used for hair samples. Instead of the hair sample, theinner compartment of the Obrink chamber contained semicircular bands of fil-ter paper (Filtrak 388, Filtrak GmbH, Germany) covered with a layer of NaFand dried. In the inner compartments of six Obrink chambers were placedbands of filter paper containing 1.0, 2.0, 3.0, 5.0, 10.0 and 20.0 µg of fluoride(as F-). The procedure was the same as with the hair samples.Determination of certain parameters of drinking water: General hardness ofdrinking water was determined by the complexometric method according toPN-71/C-04551 using eriochromic black as an indicator.12 Chlorides were de-termined by the argentometric method (PN-75/C-04617) using potassiumchromate as an indicator.13
RESULTS AND DISCUSSIONDuring 1995 and 1997, 619 hair samples were collected and analysed, with
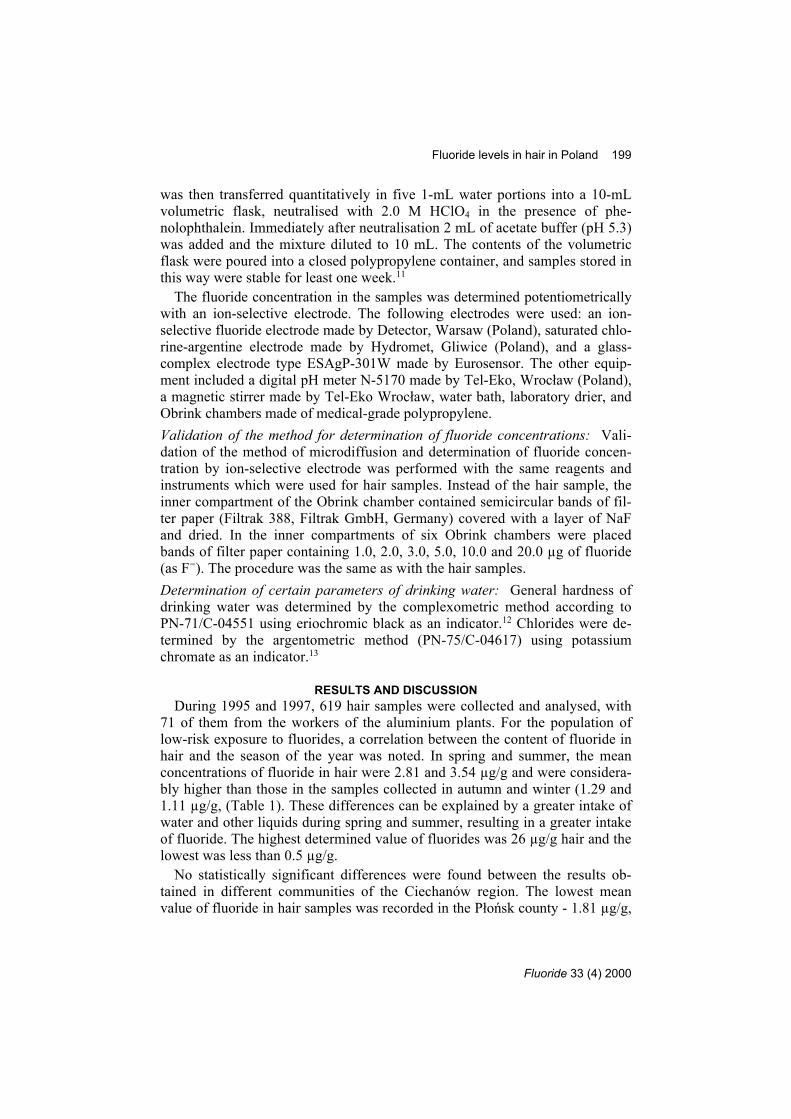
71 of them from the workers of the aluminium plants. For the population oflow-risk exposure to fluorides, a correlation between the content of fluoride inhair and the season of the year was noted. In spring and summer, the meanconcentrations of fluoride in hair were 2.81 and 3.54 µg/g and were considera-bly higher than those in the samples collected in autumn and winter (1.29 and1.11 µg/g, (Table 1). These differences can be explained by a greater intake ofwater and other liquids during spring and summer, resulting in a greater intakeof fluoride. The highest determined value of fluorides was 26 µg/g hair and thelowest was less than 0.5 µg/g.
No statistically significant differences were found between the results ob-tained in different communities of the Ciechanów region. The lowest meanvalue of fluoride in hair samples was recorded in the Płońsk county - 1.81 µg/g,
200 Kokot, Drzewiecki
Fluoride 33 (4) 2000
and the highest in the Ciechanów county - 2.32 µg/g. These results suggest asimilar level of exposure to fluorides in the whole region.
Table 1. Mean content of fluoride (µg/g) in the hair of inhabitantsof Ciechanów, Działdowo, Mława, Płońsk and Pułtusk counties
County Season of the yearSpring Summer Autumn Winter Whole year
Ciechanów 5.92 ± 2.80n=10
7.26 ± 3.67n=10
0.82 ± 0.15n=27
0.87 ± 0.13n=31
2.32 ± 0.82n=78
Działdowo 3.01 ± 0.96n=25
2.97 ± 1.14n=16
1.20 ± 0.22n=50
0.98 ± 0.14n=29
1.76 ± 0.31n=120
Mława 3.38 ± 0.81n=35
3.29 ± 0.99n=28
1.35 ± 0.27n=47
1.06 ± 0.14n=39
2.11 ± 0.33n=149
Płońsk 1.53 ± 0.33n=22
3.06 ± 1.07n=26
1.58 ± 1.00n=20
0.68 ± 0.08n=19
1.81 ± 0.44n=87
Pułtusk 1.57 ± 0.18n=23
3.29 ± 2.12n=23
1.61 ± 0.53n=27
1.71 ± 0.18n=35
1.99 ± 0.49n=108
Mean 2.81 ± 0.47n=117
3.54 ± 0.74n=107
1.29 ± 0.18n=171
1.11 ± 0.09n=153
2.00 ± 0.20n=548
n – number of samples
A comparison of results obtained for city and country residents also revealedno significant differences: the mean values of fluoride concentration in hairsamples from the urban and rural areas were 2.0 and 2.1 µg/g.
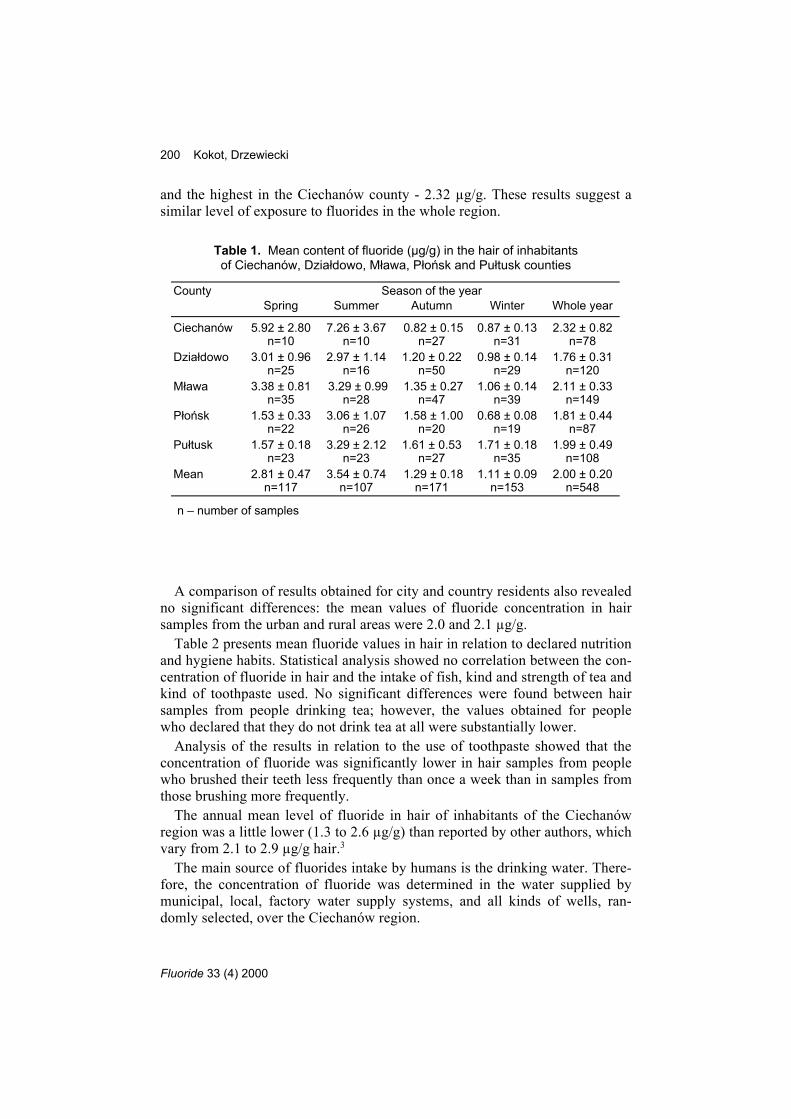
Table 2 presents mean fluoride values in hair in relation to declared nutritionand hygiene habits. Statistical analysis showed no correlation between the con-centration of fluoride in hair and the intake of fish, kind and strength of tea andkind of toothpaste used. No significant differences were found between hairsamples from people drinking tea; however, the values obtained for peoplewho declared that they do not drink tea at all were substantially lower.
Analysis of the results in relation to the use of toothpaste showed that theconcentration of fluoride was significantly lower in hair samples from peoplewho brushed their teeth less frequently than once a week than in samples fromthose brushing more frequently.
The annual mean level of fluoride in hair of inhabitants of the Ciechanówregion was a little lower (1.3 to 2.6 µg/g) than reported by other authors, whichvary from 2.1 to 2.9 µg/g hair.3
The main source of fluorides intake by humans is the drinking water. There-fore, the concentration of fluoride was determined in the water supplied bymunicipal, local, factory water supply systems, and all kinds of wells, ran-domly selected, over the Ciechanów region.
Fluoride levels in hair in Poland 201
Fluoride 33 (4) 2000
Table 2. Mean content of fluoride in hair samples accordingto different criteria of fluoride exposure
Option Description Number ofsamples
Mean F con-tent [µg/g]
SD
Tea consumption Type Leaves 85 1.8 ± 0.6
Granulated 331 1.8 ± 0.2 Strength Weak 113 1.8 ± 0.5
Medium 261 1.8 ± 0.3Strong 47 1.9 ± 0.7
Volume None 9 1.1 ± 0.41-2 glasses/day 183 1.8 ± 0.43-4 glasses/day 184 1.9 ± 0.4above 4 glasses/day 54 1.6 ± 0.3
Fish consumption Very small 166 2.0 ± 0.4Up to 0,5 kg 165 1.7 ± 0.40,5-1 kg 65 1.6 ± 0.41-2 kg 23 1.3 ± 0.4Above 2 kg 12 2.0 ± 0.8
Toothpaste With fluoride 396 1.8 ± 0.2Without fluoride 26 1.6 ± 0.7
Tooth brushing Twice or more a day 286 1.7 ± 0.2Once a day 115 1.7 ± 0.42-3 times a week 22 2.5 ± 2.2Once a week 4 2.6 ± 2.0Less than once a week 4 1.0 ± 2.1
Residence Town 372 2.0 ± 0.3Village 176 2.1 ± 0.3
Education Elementary school 61 2.3 ± 0.9High school 211 2.1 ± 0.3University 52 1.7 ± 0.4
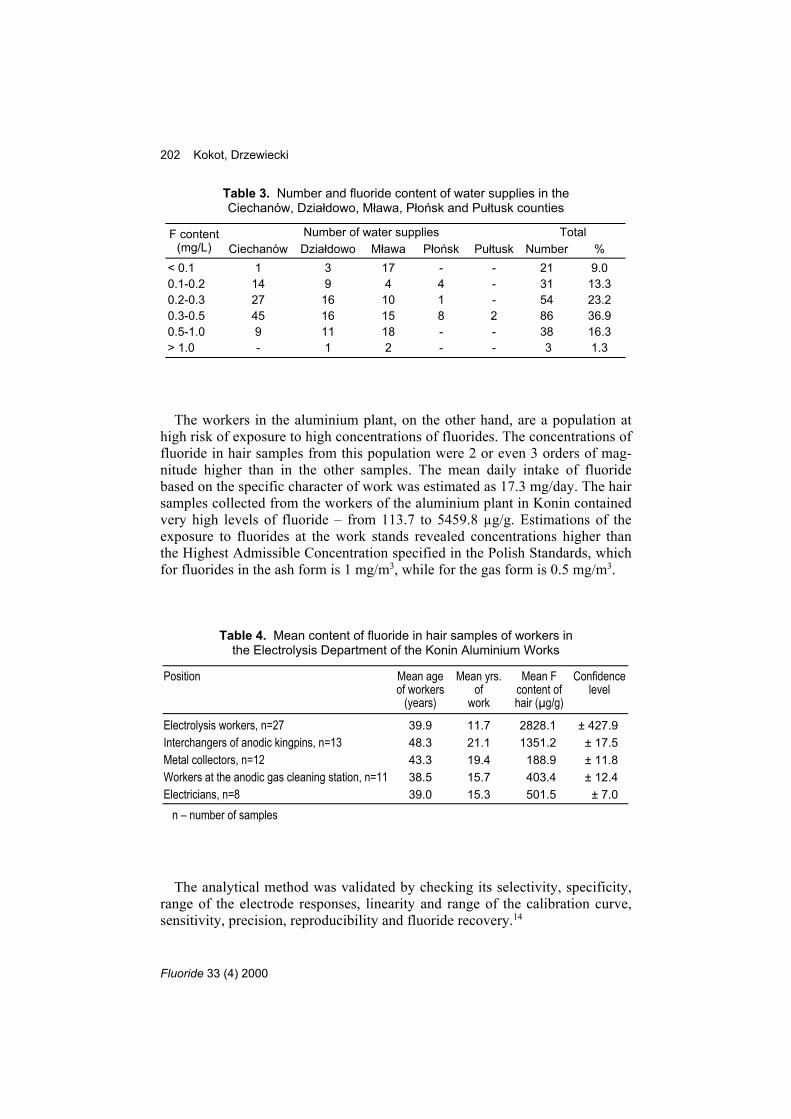
As seen in Table 3, over 50% of the water sources have a fluoride concen-tration around 0.3 mg/L. This is the lowest value of fluoride concentration rec-ommended by the Health Ministry regulations of May 1990. Almost 99% ofthe population drink water containing fluorides at a concentration below 1mg/L, and only 1% use water with fluoride concentration above 1 mg/L, but nohigher than the highest permissible 1.5 mg/L. Water was also analysed for theconcentrations of chlorides, pH value and general hardness. A significant posi-tive correlation was observed between general hardness and chloride concen-tration, with an inverse one between the concentration of fluoride and pH.
202 Kokot, Drzewiecki
Fluoride 33 (4) 2000
Table 3. Number and fluoride content of water supplies in theCiechanów, Działdowo, Mława, Płońsk and Pułtusk counties
Number of water supplies TotalF content(mg/L) Ciechanów Działdowo Mława Płońsk Pułtusk Number %
< 0.1 1 3 17 - - 21 9.00.1-0.2 14 9 4 4 - 31 13.30.2-0.3 27 16 10 1 - 54 23.20.3-0.5 45 16 15 8 2 86 36.90.5-1.0 9 11 18 - - 38 16.3> 1.0 - 1 2 - - 3 1.3
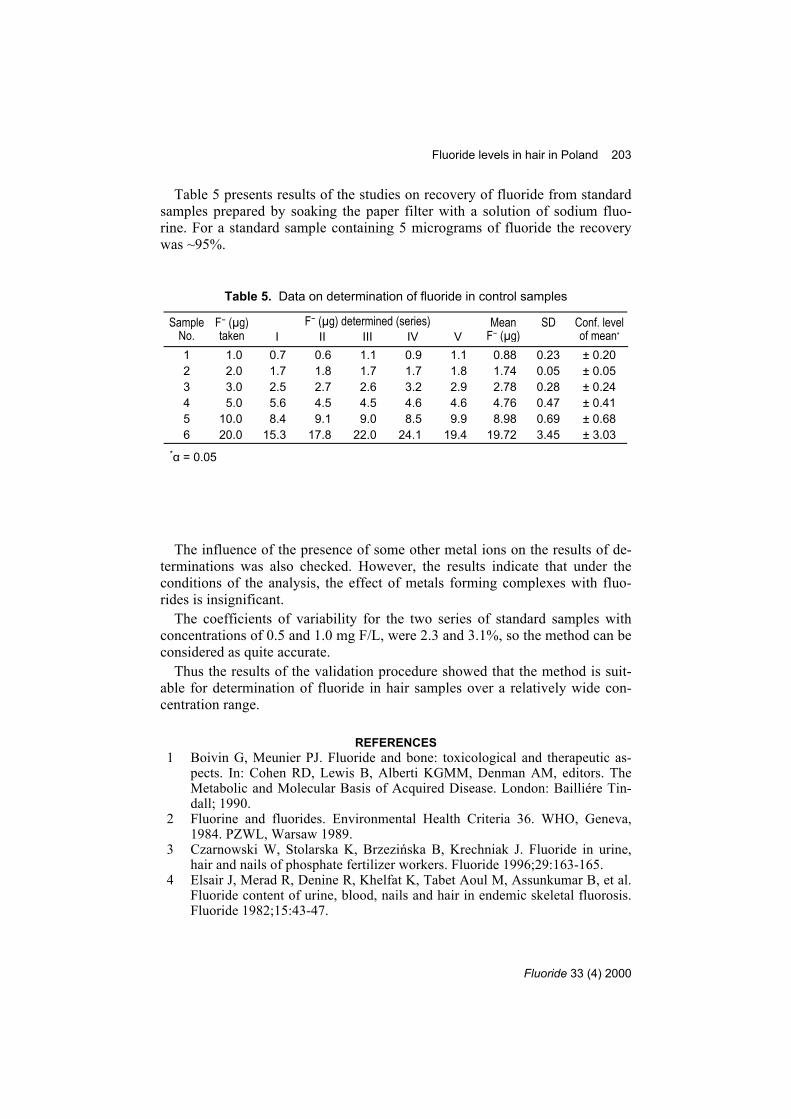
The workers in the aluminium plant, on the other hand, are a population athigh risk of exposure to high concentrations of fluorides. The concentrations offluoride in hair samples from this population were 2 or even 3 orders of mag-nitude higher than in the other samples. The mean daily intake of fluoridebased on the specific character of work was estimated as 17.3 mg/day. The hairsamples collected from the workers of the aluminium plant in Konin containedvery high levels of fluoride – from 113.7 to 5459.8 µg/g. Estimations of theexposure to fluorides at the work stands revealed concentrations higher thanthe Highest Admissible Concentration specified in the Polish Standards, whichfor fluorides in the ash form is 1 mg/m3, while for the gas form is 0.5 mg/m3.
Table 4. Mean content of fluoride in hair samples of workers inthe Electrolysis Department of the Konin Aluminium Works
Position Mean ageof workers
(years)
Mean yrs.of
work
Mean Fcontent ofhair (µg/g)
Confidencelevel
Electrolysis workers, n=27 39.9 11.7 2828.1 ± 427.9Interchangers of anodic kingpins, n=13 48.3 21.1 1351.2 ± 17.5Metal collectors, n=12 43.3 19.4 188.9 ± 11.8Workers at the anodic gas cleaning station, n=11 38.5 15.7 403.4 ± 12.4Electricians, n=8 39.0 15.3 501.5 ± 7.0
n – number of samples
The analytical method was validated by checking its selectivity, specificity,range of the electrode responses, linearity and range of the calibration curve,sensitivity, precision, reproducibility and fluoride recovery.14
Fluoride levels in hair in Poland 203
Fluoride 33 (4) 2000
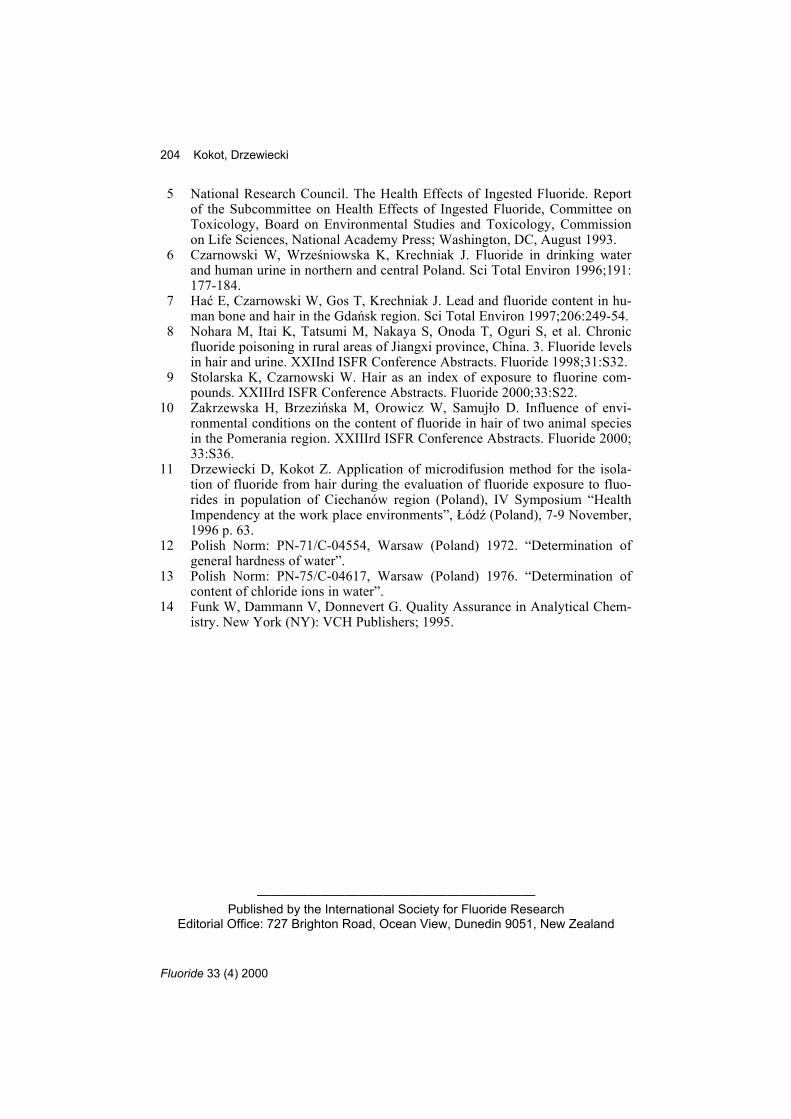
Table 5 presents results of the studies on recovery of fluoride from standardsamples prepared by soaking the paper filter with a solution of sodium fluo-rine. For a standard sample containing 5 micrograms of fluoride the recoverywas ~95%.
Table 5. Data on determination of fluoride in control samples
F- (µg) determined (series)SampleNo.
F- (µg)taken I II III IV V
MeanF- (µg)
SD Conf. levelof mean*
1 1.0 0.7 0.6 1.1 0.9 1.1 0.88 0.23 ± 0.202 2.0 1.7 1.8 1.7 1.7 1.8 1.74 0.05 ± 0.053 3.0 2.5 2.7 2.6 3.2 2.9 2.78 0.28 ± 0.244 5.0 5.6 4.5 4.5 4.6 4.6 4.76 0.47 ± 0.415 10.0 8.4 9.1 9.0 8.5 9.9 8.98 0.69 ± 0.686 20.0 15.3 17.8 22.0 24.1 19.4 19.72 3.45 ± 3.03
*α = 0.05
The influence of the presence of some other metal ions on the results of de-terminations was also checked. However, the results indicate that under theconditions of the analysis, the effect of metals forming complexes with fluo-rides is insignificant.
The coefficients of variability for the two series of standard samples withconcentrations of 0.5 and 1.0 mg F/L, were 2.3 and 3.1%, so the method can beconsidered as quite accurate.
Thus the results of the validation procedure showed that the method is suit-able for determination of fluoride in hair samples over a relatively wide con-centration range.
REFERENCES 1 Boivin G, Meunier PJ. Fluoride and bone: toxicological and therapeutic as-
pects. In: Cohen RD, Lewis B, Alberti KGMM, Denman AM, editors. TheMetabolic and Molecular Basis of Acquired Disease. London: Bailliére Tin-dall; 1990.
2 Fluorine and fluorides. Environmental Health Criteria 36. WHO, Geneva,1984. PZWL, Warsaw 1989.
3 Czarnowski W, Stolarska K, Brzezińska B, Krechniak J. Fluoride in urine,hair and nails of phosphate fertilizer workers. Fluoride 1996;29:163-165.
4 Elsair J, Merad R, Denine R, Khelfat K, Tabet Aoul M, Assunkumar B, et al.Fluoride content of urine, blood, nails and hair in endemic skeletal fluorosis.Fluoride 1982;15:43-47.
204 Kokot, Drzewiecki
Fluoride 33 (4) 2000
5 National Research Council. The Health Effects of Ingested Fluoride. Reportof the Subcommittee on Health Effects of Ingested Fluoride, Committee onToxicology, Board on Environmental Studies and Toxicology, Commissionon Life Sciences, National Academy Press; Washington, DC, August 1993.
6 Czarnowski W, Wrześniowska K, Krechniak J. Fluoride in drinking waterand human urine in northern and central Poland. Sci Total Environ 1996;191:177-184.
7 Hać E, Czarnowski W, Gos T, Krechniak J. Lead and fluoride content in hu-man bone and hair in the Gdańsk region. Sci Total Environ 1997;206:249-54.
8 Nohara M, Itai K, Tatsumi M, Nakaya S, Onoda T, Oguri S, et al. Chronicfluoride poisoning in rural areas of Jiangxi province, China. 3. Fluoride levelsin hair and urine. XXIInd ISFR Conference Abstracts. Fluoride 1998;31:S32.
9 Stolarska K, Czarnowski W. Hair as an index of exposure to fluorine com-pounds. XXIIIrd ISFR Conference Abstracts. Fluoride 2000;33:S22.
10 Zakrzewska H, Brzezińska M, Orowicz W, Samujło D. Influence of envi-ronmental conditions on the content of fluoride in hair of two animal speciesin the Pomerania region. XXIIIrd ISFR Conference Abstracts. Fluoride 2000;33:S36.
11 Drzewiecki D, Kokot Z. Application of microdifusion method for the isola-tion of fluoride from hair during the evaluation of fluoride exposure to fluo-rides in population of Ciechanów region (Poland), IV Symposium “HealthImpendency at the work place environments”, Łódź (Poland), 7-9 November,1996 p. 63.
12 Polish Norm: PN-71/C-04554, Warsaw (Poland) 1972. “Determination ofgeneral hardness of water”.
13 Polish Norm: PN-75/C-04617, Warsaw (Poland) 1976. “Determination ofcontent of chloride ions in water”.
14 Funk W, Dammann V, Donnevert G. Quality Assurance in Analytical Chem-istry. New York (NY): VCH Publishers; 1995.
——————————————————————Published by the International Society for Fluoride Research
Editorial Office: 727 Brighton Road, Ocean View, Dunedin 9051, New Zealand