Embed Size (px)
Citation preview
Judith Hebelen Rodriguez1
Eduardo Daniel Wannaz1
Marıa Luisa Pignata1
Andreas Fangmeier2
Jurgen Franzaring2
1Faculty of Physical and Natural
Sciences, Multidisciplinary Institute of
Plant Biology, Section Pollution and
Bioindicators, National University of
Cordoba, Cordoba, Argentina2Institute of Landscape and Plant
Ecology, Plant Ecology and
Ecotoxicology, Universitat Hohenheim,
Stuttgart, Germany
Research Article
Fluoride Biomonitoring around a Large AluminiumSmelter Using Foliage from Different Tree Species
In order to study the pollution gradient in the vicinity of a large aluminium production
facility in Patagonia (Argentina), a passive biomonitoring was performed employing
foliage from three tree species. Primary scope was to identify pollution gradients and to
select suitable tree species which can be used as biomonitor plants in the study area.
Therefore, leaves of Eucalyptus rostrata, Populus hybridus and different needle ages of Pinus
radiata were collected at different distances from the industry and the fluoride con-
centration was analysed in washed and unwashed samples in order to determine the
amount of external fluoride. Washing reduced the F-concentrations by 24, 39 and 51%
on average in E. rostrata, P. hybridus and P. radiata, respectively, indicating that species-
specific characteristics determine the accumulation and wash-off of dust-associated
fluorine. F-concentrations varied from 6 to 3652 ppm F in unwashed samples indicating
a steep pollution gradient in the study area. The influence of F-emissions was discern-
ible in all samples up to a distance of 3500 m from the smelter. E. rostrata accumulated
more fluorine than the other species at equal distance from the emission source. The
present study confirms that aluminium smelting results in high F deposition in the
study area. Establishing a biomonitor network around large emitters is suitable and
feasible to evaluate the efficiency of air control measures.
Keywords: Eucalyptus; Fluoride bioindication; Patagonia; Pinus; Populus
Received: October 20, 2011; revised: May 10, 2012; accepted: May 21, 2012
DOI: 10.1002/clen.201100584
1 Introduction
Among pollutants emitted into the atmosphere, fluoride com-
pounds belong to the most phytotoxic. The gases HF and SiF4 are
one to three orders of magnitude more toxic than other air pollu-
tants [1]. Because plant foliage is effectively scavenging atmospheric
pollutants many studies have used different plant species as bio-
monitors of airborne fluoride [2–6]. The most suited biomonitors are
species that are relatively tolerant to F because an inverse relation-
ship between the degree of sensitivity and fluoride accumulation has
often been reported [1, 7]. Biomonitoring may also be regarded as an
effective tool for detecting potential health risks to animals and
humans in the vicinity of sources of fluoride, taking into account
that grazing is the main uptake route for fluoride in dairy cattle and
that the consumption of fluoride contaminated food has been shown
to be associated with dental and skeletal fluorosis [8]. Although it has
been reported that background concentrations in most plant species
range from 1 to 10 mg g�1 [9], this range may vary according to
geographical and climatic conditions of the study area [1]. Due to
the increasing industrialisation fluoride emissions have increased
globally. Nevertheless, emission control is restricted to sporadic
investigations and is often insufficient to identify and avoid harmful
effects on the environment [2, 10]. Numerous reports in relation to
fluoride pollution in the vicinity of aluminium industries have
indicated extensive damage to the vegetation [3, 6, 11–13]. During
the aluminium smelting process, fluoride is emitted into the atmo-
sphere in gaseous and particulate forms. While gases are absorbed
through the stomata of leaves F containing particulates are depos-
ited on the leaves from which large amounts may be washed off
again by precipitation [3].
One of the largest aluminium production plants of South America
is situated at the Atlantic coast of Patagonia (Argentina). Some
ecological implications of the industrial activity in this area had
been described in the early 1980s, when the production capacity was
about 140 kt year�1 [14–17]. In recent years, the plant production
expanded up to c. four times (CNV, accessed 20.09.2010) although
environmental monitoring studies are still scarce. The Al-industry
has its own system of fluoride monitoring in air at various points in
the city (Aluar, accessed 01.03.2012). Although, the maximum emis-
sion limits in air are set to 16 mg m�3 HF, values approximately forty
times higher than those reported for air quality limits set in many
countries to protect sensitive plant species [18–20]. In this paper we
report on a study of the air quality performed in the vicinity of the
described smelter in Patagonia. Primary scope was to identify pol-
lution gradients and to select suitable tree species which can be used
as biomonitor plants in the study area.
Correspondence: Dr. J. Hebelen Rodriguez, Faculty of Physical andNatural Sciences, Multidisciplinary Institute of Plant Biology, SectionPollution and Bioindicators, National University of Cordoba, Av. VelezSarsfield 1611, X5016CGA Cordoba, ArgentinaE-mail: [email protected]
Abbreviations: EC, electrical conductivity; SLA, specific leaf area
Clean – Soil, Air, Water 2012, 00 (0), 1–5 1
� 2012 WILEY-VCH Verlag GmbH & Co. KGaA, Weinheim www.clean-journal.com
2 Materials and methods
2.1 Study area and sampling
The study was performed in the city of Puerto Madryn in the Chubut
province (Argentina) in the vicinity of a aluminium production
plant. The city is located on the west coast of the Golfo Nuevo
and has a population size of about 57 000 inhabitants (INDEC,
accessed 01.08.2010). However, this number doubles during the
summer holidays because the place is one of the most important
resorts in Patagonia and the country. The continental area is charac-
terised by semiarid conditions, with a mean annual precipitation of
238 mm year�1 and an average annual temperature of about 13.68C(CENPAT, accessed 01.08.2010). The topography of the area is nearly
flat and strong south-westerly winds from the continent to the sea
dominate throughout most of the year. The climatic conditions prior
to leaf sampling (January to February 2010) were characterised by a
mean temperature of 20.58C, a cumulative precipitation of 24.6 mm,
a relative humidity of 43%, a global radiation of 7580.8 Wh m�2 day
and south-westerly winds of 19 km h�1 (CENPAT, accessed
01.08.2010). The vegetation is characterised by small shrubs and
subshrubs [21], therefore the city has been forested with tree species
like pine, eucalyptus and poplar, which have been indicated as
suitable biomonitors of fluoride [1, 13]. Leaves of Eucalyptus rostrata
Schlecht., Populus hybridus L. and needles of Pinus radiata D. Don were
collected, when present, at forty sampling points in the vicinity of
the aluminium factory in the third week of February 2010 (Fig. 1).
Samples consisted of 150–200 leaves or needles and were randomly
collected in each sampling site from a single tree according to the
standardised method after VDI [22].
2.2 Plant analyses
In order to address the quantity of surface deposited fluorine,
washed and unwashed leaves and needles were considered in the
F analyses separately. For the washing procedure, leaves and needles
were washed in 500 mL PE flasks with 200 mL deionised water and
shaken for 5 min. The fluoride analysis followed the method
described in VDI [23] and was based on an alkali melt. Fluoride levels
were determined with an ion-sensitive electrode (ISE F 800 DIN, WTW
Weilheim, Germany) coupled to a ionometer (Inolab pH/Ion 735
WTW Weilheim, Germany). Further details on these analyses are
described in Franzaring et al. [4]. The calibration was made using NaF
standard solutions. To assure the quality of the fluoride analyses a
certified standard was used. In addition to the F-analyses, leaf area
and fresh and dry biomass were determined so that specific leaf area
(SLA) (only determined for P. hybridus and E. rostrata) and dry matter
contents of the leaf samples could be calculated.
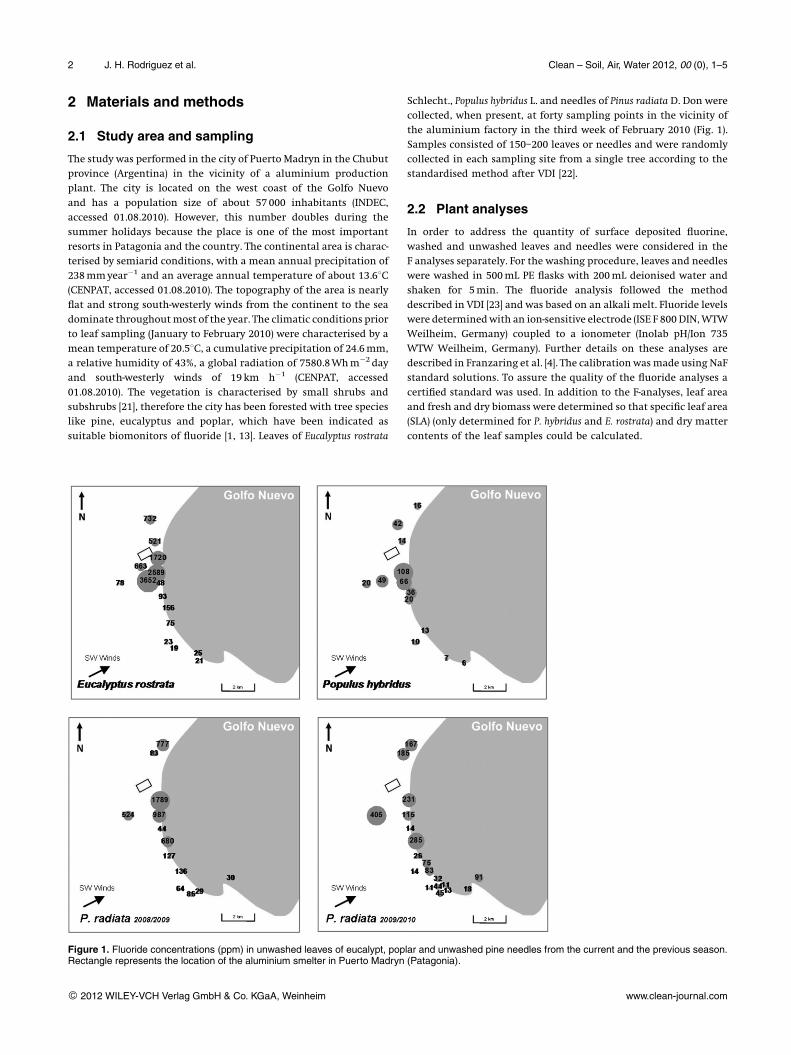
Figure 1. Fluoride concentrations (ppm) in unwashed leaves of eucalypt, poplar and unwashed pine needles from the current and the previous season.Rectangle represents the location of the aluminium smelter in Puerto Madryn (Patagonia).
2 J. H. Rodriguez et al. Clean – Soil, Air, Water 2012, 00 (0), 1–5
� 2012 WILEY-VCH Verlag GmbH & Co. KGaA, Weinheim www.clean-journal.com
2.3 Water analyses
Fluoride analyses were also performed in the solutions that resulted
from the washing of a known quantity and number of leaves.
Twenty-five milliliters of these water samples were mixed with
the same volume of total ionic strength adjustment buffer (TISAB,
WTW Weilheim, Germany). Water samples and standards were
measured with the fluoride-sensitive electrode as specified above.
Furthermore, pH and electrical conductivity (EC) of the solutions
were determined using a pH meter (Altronix TPX II) and an EC-meter
with a glass electrode (Oakton WD-35610).
2.4 Statistical analysis
A regression analysis was performed in order to determine the
relationships between the accumulation of fluoride and distance
from the emission source. In addition, in order to compare signifi-
cant differences between linear regression models for washed and
unwashed samples for each species, and between different pinus
needle ages, the data were analysed contrasting the linear regression
models. All analyses were performed using Excel and InfoStat
software.
3 Results
In the unwashed samples, F concentrations ranged between 6 and
3652 ppm in the deciduous tree species (Tab. 1), while they varied
between 11 and 405 ppm in the conifer (current needles, Tab. 2).
Whereas leaf properties were not addressed in pine, mean leaf size,
dry matter content and SLA were determined in eucalypt and poplar
leaves. These parameters had to be measured in order to calculate
fluoride contents per leaf area. As can be seen in Tab. 1, poplar (mean
leaf size of 35 cm2/leaf) has larger leaves than eucalypt (mean leaf
size of 17 cm2/leaf) on average and the lower SLA in the latter species
indicates that leaves in E. rostrata are much more compact. Latter is
also confirmed by the higher dry matter content in leaves of eucalypt
as compared to poplar. Leaf size, density and dry matter content did
not show strong variation in the study area and were unrelated to
fluoride emissions. E. rostrata showed higher values of F by leaf area
compared to P. hybridus (Tab. 1).
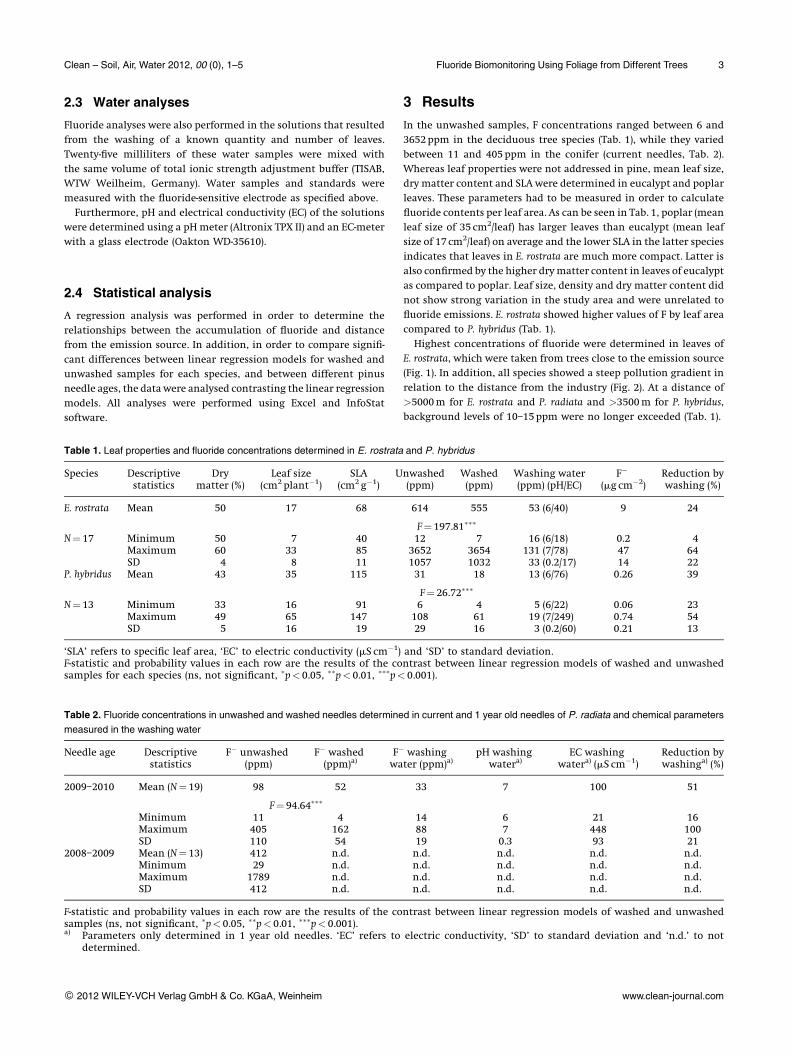
Highest concentrations of fluoride were determined in leaves of
E. rostrata, which were taken from trees close to the emission source
(Fig. 1). In addition, all species showed a steep pollution gradient in
relation to the distance from the industry (Fig. 2). At a distance of
>5000 m for E. rostrata and P. radiata and >3500 m for P. hybridus,
background levels of 10–15 ppm were no longer exceeded (Tab. 1).
Table 1. Leaf properties and fluoride concentrations determined in E. rostrata and P. hybridus
Species Descriptivestatistics
Drymatter (%)
Leaf size(cm2 plant�1)
SLA(cm2 g�1)
Unwashed(ppm)
Washed(ppm)
Washing water(ppm) (pH/EC)
F�
(mg cm�2)Reduction bywashing (%)
E. rostrata Mean 50 17 68 614 555 53 (6/40) 9 24
F¼ 197.81���
N¼ 17 Minimum 50 7 40 12 7 16 (6/18) 0.2 4Maximum 60 33 85 3652 3654 131 (7/78) 47 64SD 4 8 11 1057 1032 33 (0.2/17) 14 22
P. hybridus Mean 43 35 115 31 18 13 (6/76) 0.26 39
F¼ 26.72���
N¼ 13 Minimum 33 16 91 6 4 5 (6/22) 0.06 23Maximum 49 65 147 108 61 19 (7/249) 0.74 54SD 5 16 19 29 16 3 (0.2/60) 0.21 13
‘SLA’ refers to specific leaf area, ‘EC’ to electric conductivity (mS cm�1) and ‘SD’ to standard deviation.F-statistic and probability values in each row are the results of the contrast between linear regression models of washed and unwashedsamples for each species (ns, not significant, �p< 0.05, ��p< 0.01, ���p< 0.001).
Table 2. Fluoride concentrations in unwashed and washed needles determined in current and 1 year old needles of P. radiata and chemical parameters
measured in the washing water
Needle age Descriptivestatistics
F� unwashed(ppm)
F� washed(ppm)a)
F� washingwater (ppm)a)
pH washingwatera)
EC washingwatera) (mS cm�1)
Reduction bywashinga) (%)
2009–2010 Mean (N¼ 19) 98 52 33 7 100 51
F¼ 94.64���
Minimum 11 4 14 6 21 16Maximum 405 162 88 7 448 100SD 110 54 19 0.3 93 21
2008–2009 Mean (N¼ 13) 412 n.d. n.d. n.d. n.d. n.d.Minimum 29 n.d. n.d. n.d. n.d. n.d.Maximum 1789 n.d. n.d. n.d. n.d. n.d.SD 412 n.d. n.d. n.d. n.d. n.d.
F-statistic and probability values in each row are the results of the contrast between linear regression models of washed and unwashedsamples (ns, not significant, �p< 0.05, ��p< 0.01, ���p< 0.001).a) Parameters only determined in 1 year old needles. ‘EC’ refers to electric conductivity, ‘SD’ to standard deviation and ‘n.d.’ to not
determined.
Clean – Soil, Air, Water 2012, 00 (0), 1–5 Fluoride Biomonitoring Using Foliage from Different Trees 3
� 2012 WILEY-VCH Verlag GmbH & Co. KGaA, Weinheim www.clean-journal.com
Washing the leaves reduced the F content by 51% on average in
pine needles, while in the poplar leaves the F content was lowered by
39% after washing. In contrast, only 24% of the accumulated F could
be washed off on average from the Eucalyptus leaves (Tab. 1). In
addition, through contrast analyses, significant differences between
regression models of washed and unwashed samples for all species
were observed (Tab. 1). The fluoride concentration in the washing
water corresponded to the amount of F washed, whose values reflect
the difference between the F concentration in unwashed leaves
minus the F concentration in washed leaves. With regard to
the pH values, no significant difference was found in the washing
water from different species, but for EC the highest values were
observed in P. radiata and the lowest in E. rostrata (Tabs. and 2).
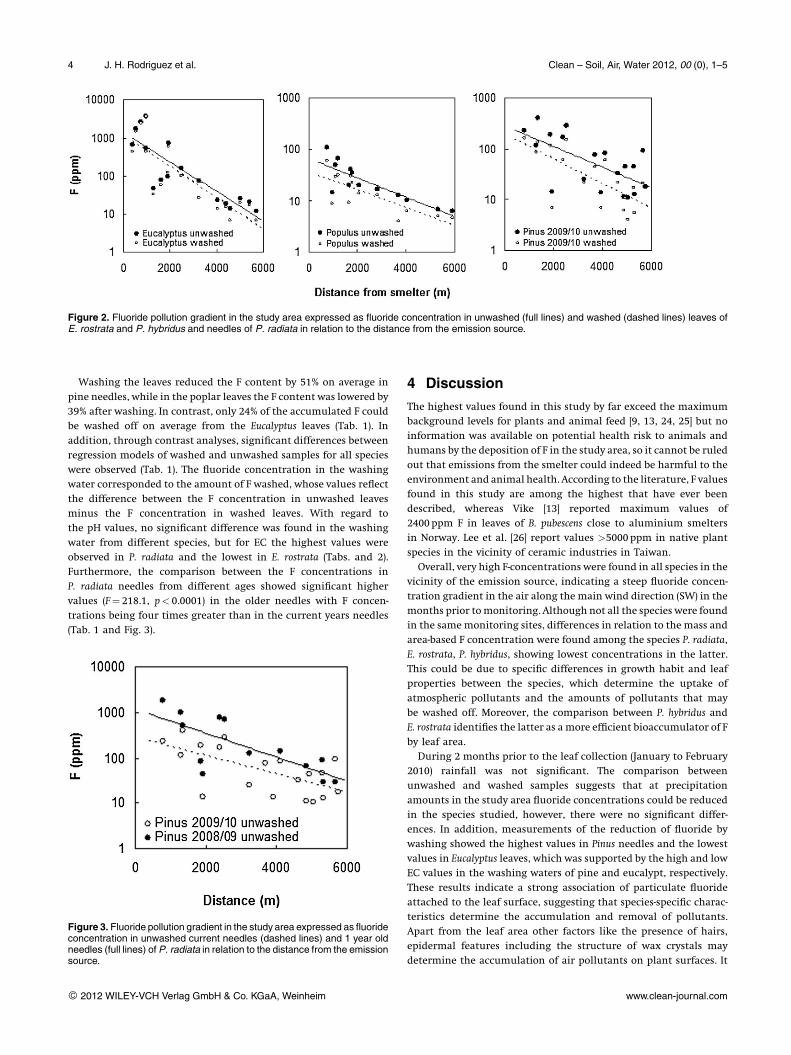
Furthermore, the comparison between the F concentrations in
P. radiata needles from different ages showed significant higher
values (F¼ 218.1, p< 0.0001) in the older needles with F concen-
trations being four times greater than in the current years needles
(Tab. 1 and Fig. 3).
4 Discussion
The highest values found in this study by far exceed the maximum
background levels for plants and animal feed [9, 13, 24, 25] but no
information was available on potential health risk to animals and
humans by the deposition of F in the study area, so it cannot be ruled
out that emissions from the smelter could indeed be harmful to the
environment and animal health. According to the literature, F values
found in this study are among the highest that have ever been
described, whereas Vike [13] reported maximum values of
2400 ppm F in leaves of B. pubescens close to aluminium smelters
in Norway. Lee et al. [26] report values >5000 ppm in native plant
species in the vicinity of ceramic industries in Taiwan.
Overall, very high F-concentrations were found in all species in the
vicinity of the emission source, indicating a steep fluoride concen-
tration gradient in the air along the main wind direction (SW) in the
months prior to monitoring. Although not all the species were found
in the same monitoring sites, differences in relation to the mass and
area-based F concentration were found among the species P. radiata,
E. rostrata, P. hybridus, showing lowest concentrations in the latter.
This could be due to specific differences in growth habit and leaf
properties between the species, which determine the uptake of
atmospheric pollutants and the amounts of pollutants that may
be washed off. Moreover, the comparison between P. hybridus and
E. rostrata identifies the latter as a more efficient bioaccumulator of F
by leaf area.
During 2 months prior to the leaf collection (January to February
2010) rainfall was not significant. The comparison between
unwashed and washed samples suggests that at precipitation
amounts in the study area fluoride concentrations could be reduced
in the species studied, however, there were no significant differ-
ences. In addition, measurements of the reduction of fluoride by
washing showed the highest values in Pinus needles and the lowest
values in Eucalyptus leaves, which was supported by the high and low
EC values in the washing waters of pine and eucalypt, respectively.
These results indicate a strong association of particulate fluoride
attached to the leaf surface, suggesting that species-specific charac-
teristics determine the accumulation and removal of pollutants.
Apart from the leaf area other factors like the presence of hairs,
epidermal features including the structure of wax crystals may
determine the accumulation of air pollutants on plant surfaces. It
Figure 2. Fluoride pollution gradient in the study area expressed as fluoride concentration in unwashed (full lines) and washed (dashed lines) leaves ofE. rostrata and P. hybridus and needles of P. radiata in relation to the distance from the emission source.
Figure 3. Fluoride pollution gradient in the study area expressed as fluorideconcentration in unwashed current needles (dashed lines) and 1 year oldneedles (full lines) of P. radiata in relation to the distance from the emissionsource.
4 J. H. Rodriguez et al. Clean – Soil, Air, Water 2012, 00 (0), 1–5
� 2012 WILEY-VCH Verlag GmbH & Co. KGaA, Weinheim www.clean-journal.com
may also be hypothesised that the excretion of sticky secondary
compounds may favour the adsorption of particulates and partly
explain why eucalypt has a higher accumulation efficiency. Probably
the large amount of extracellular fluids excreted by Eucalyptus leaves
as described by Goodger et al. [27] relates to the higher chemical
affinity of deposited dusts. Finally, the comparison between differ-
ent needle ages of Pinus showed much higher fluoride concentrations
in the oldest leaf organs, reflecting a greater accumulation of fluo-
rides upon the longer exposure time.
The analysis of F concentrations in leaves confirmed a significant
pollution gradient with the highest fluoride content in samples
collected in the vicinity of the emission source. In the comparison
among species, E. rostrata showed the highest values of fluoride
accumulated which is due to the foliar characteristic such as mass
and area as well as a higher capacity of retention on leaf surfaces. The
impact of the smelter show that this is severe in an area close to the
source of up to four kilometres, but the effects decrease at a greater
distance. Further studies in relation to the environmental and
human health should be carried out, investigating the F concen-
trations in the natural steppe vegetation and in vegetables and fruits
that are used for consumption.
Acknowledgments
This work was funded by the Ministry of Science, Technology and
Productive Innovation (Ministerio de Ciencia, Tecnologıa e
Innovacion Productiva, MINCyT) of Argentina and the
International Bureau (IB) of the Federal Ministry of Education and
Research (Bundesministerium fur Bildung und Forschung, BMBF) of
Germany, Cooperation Project No. AL0802. The first author J. H.
Rodriguez was suported by a scholarship of Consejo Nacional de
Investigaciones Cientıficas y Tecnicas (CONICET). The authors are
grateful to Msc. Ana Marıa Beeskow (CENPAT, CONICET) for provid-
ing advice in the identification of tree species. Mr. S. Weller is
thanked for language revisions.
The authors have declared no conflict of interest.
References
[1] L. H. Weinstein, A. W. Davison, Native Plant Species Suitable asBioindicators and Biomonitors for Airborne Fluoride, Environ. Pollut.2003, 125, 3–11.
[2] A. Klumpp, G. Klumpp, M. Domingos, M. D. da Silva, Fluoride Impacton Native Tree Species of the Atlantic Forest Near Cubatao, Brazil,Water Air Soil Pollut. 1996, 87, 57–71.
[3] E. Vike, Uptake, Deposition and Wash Off of Fluoride andAluminium in Plant Foliage in the Vicinity of an AluminiumSmelter, Water Air Soil Pollut. 2005, 160, 145–159.
[4] J. Franzaring, H. Hrenn, C. Schumm, A. Klumpp, A. Fangmeier,Environmental Monitoring of Fluoride Emissions UsingPrecipitation, Dust, Plant and Soil Samples, Environ. Pollut. 2006,144, 158–165.
[5] J. Franzaring, A. Klumpp, A. Fangmeier, Active Biomonitoring ofAirborne Fluoride Near an HF Producing Factory Using StandarisedGrass Cultures, Atmos. Environ. 2007, 41, 4828–4840.
[6] A. Rey-Asensio, A. Carballeira, Lolium perenne as a Biomonitor ofAtmospheric Levels of Fluoride, Environ. Int. 2007, 33, 583–588.
[7] VDI, Maximum immission values to protect vegetation – Maximumconcentrations for hydrogen fluoride, draft, in VDI/DIN-Handbuch
Reinhaltung der Luft, Maximale Immissions-Werte, Vol. 1A, BeuthVerlag, Berlin 2009, p. 43.
[8] M. Ando, M. Tadano, S. Yamamoto, K. Tamura, S. Asanuma,T. Watanabe, T. Kondo, et al., Health Effects of Fluoride PollutionCaused by Coal Burning, Sci. Total Environ. 2001, 271, 107–116.
[9] L. H. Weinstein, Fluoride and Plant Life, J. Occup. Med. 1977, 19,49–78.
[10] M. Zaballa Romero, E. Stabentheiner, W. Kosmus, W. Gossler, R.Lazar, D. Grill, The Use of Bioindication Plants for the Assessment ofAir Pollutants in the City of Cochabamba, Bolivia, Phyton 2005, 45,405–415.
[11] C. Real, J. R. Aboal, J. A. Fernandez, A. Carballeira, The Use of NativeMosses to Monitor Fluorine Levels and Associated TemporalVariations – in the Vicinity of an Aluminium Smelter, Atmos.Environ. 2003, 37, 3091–3102.
[12] E. Vike, A. Habjørg, Variation in Fluoride Content and Leaf Injury inPlants Associated with Three Aluminium Smelters in Norway, Sci.Total Environ. 1995, 163, 25–34.
[13] E. Vike, Air-pollutants Dispersal Patterns and Vegetation Damage inthe Vicinity of Three Aluminum Smelters in Norway, Sci. TotalEnviron. 1999, 236, 75–90.
[14] J. Ares, Fluoride Cycling Near a Coastal Emission Source, J. Air WasteManage. Assoc. 1979, 28, 344–349.
[15] J. Ares, A. Villa, G. Mondaroni, Air Pollutant Uptake by XerophyticVegetation, Environ. Exp. Bot. 1980, 20, 259–269.
[16] J. O. Ares, A. Villa, A. M. Gayoso, Chemical and Biological Indicatorsof Fluoride Input in the Marine Environment Near an IndustrialSource (Argentina), Arch. Environ. Contam. Toxicol. 1983, 12, 589–602.
[17] C. E. Murphy, J. Ares, The Uptake of Hydrogen Fluoride by a Forest,Ecol. Model. 1982, 15, 265–285.
[18] VDI, VDI 2310, Part 3: Maximum immission values to protectvegetation, maximum immission values for hydrogen fluoride, inVDI/DIN-Handbuch Reinhaltung der Luft, Vol. 1, Beuth Verlag, Berlin1989, p. 48.
[19] EU, European Union Risk Assessment Report: Hydrogen Fluoride, CAS-No.:7664-39-3, 1st Priority List, Vol. 8, European Commission, Belgium,Brussels 2001, p. 134.
[20] MOE, Ontario Air Standards For Hydrogen Fluoride, StandardsDevelopment Branch, Ontario Ministry of the Environment,Toronto, ON 2005, p. 112.
[21] M. B. Bertiller, A. M. Beeskow, Las flores de la Patagonia, Alrededores dePuerto Madryn y Penınsula Valdes, I. Arbustos y subarbustos, CENPAT-CONICET, Puerta Madryn, Argentina 1998, p. 22.
[22] VDI, 3957 Part 11, Biological measuring techniques for the deter-mination and evaluation of effects of air pollution on plants (bio-indication) – Sampling of leaves and needles for a biomonitoring ofthe accumulation of air pollutants (passive biomonitoring), inUmweltmeteorologie, Vol. 1B, Beuth Verlag, Berlin 2007, p. 26.
[23] VDI, 3795 BaBltt 2, Bestimmung von Immissionskomponeneten in biolo-gischem Material, Bestimmung des Fluorgehaltes in biologischen Probensowie in IRMA-Losungen, Elektrometrische Bestimmung, Beuth Verlag,Berlin 1981, p. 4.
[24] EC, Directive 2002/32/EC of the European Parliament and of the Council of 7May 2002 on undesirable substances in animal feed, OJ L 140/10-21,European Commission, Brussels 2002.
[25] EC, Commission directive 2005/87/EC of 5 December amending Annex I toDirective 2002/32/EC of the European Parliament and of the Council onundesirable substances in animal feed as regards lead, fluorine and cad-mium, OJ L 318/19-24, European Commission, Brussels 2005.
[26] Y. H. Lee, T. H. Shyu, M. Y. Chiang, Fluoride Accumulation and LeafInjury of Tea and Weeds in the Vicinity of a Ceramics Factory,Taiwan. J. Agric. Chem. Food Sci. 2003, 41, 87–94.
[27] Q. D. Goodger, B. Cao, I. Jayali, S. J. Williams, I. E. Woodraw, Non-volatile Components of the Essential Oil Secretory Cavities ofEucalyptus Leaves: Discovery of Two Glucose Monoterpene Esters,Cuniloside B and Froggattiside A, Phytochemistry 2009, 70, 1187–1194.
Clean – Soil, Air, Water 2012, 00 (0), 1–5 Fluoride Biomonitoring Using Foliage from Different Trees 5
� 2012 WILEY-VCH Verlag GmbH & Co. KGaA, Weinheim www.clean-journal.com