Embed Size (px)
Citation preview
Fluorescent Substances in Protein Hydrolyzates
1. Acid “Hydrolyzates” of Individ,ual Amino Acids1
34. LEDV’INA2 AND F. S, LABELLA:
Received November 19, 1969
Several structural proteins which we have been investigating contain certain fluorescent substances in addition to the normally occurring amino acids. Some of these fluorescent substances are derived from constituent amino acids in the proteins, whereas others are as yet un- identified. In attempting to isolate and characterize the various flue- rescent materials, some of which appear to be involved in protein cross-linking, it is necessary tlo distinguish between those occurring naturally and others producecl as artifact’s during protein purificat,ion and acid hydrolysis. In t’his and t.he accompanying paper, we have examined the fluorescence of purified amino acids, before and after treatment with acid, and in several highly purified proteins and peptidca. By examining both the fluoresccncc spectra and t’he fluorescence in- tensity of various subst’ances productbd by the conditions of acid hy- drolysis, as well as during separaGon and isolation of the fluorescent moieties, we hope to establish conditions t,hat will permit us to dia- tinguish between natura,lly occurring and artif act’ually produced compounds.
MATERIALS AXD METHODS
Matetiall. The following compounds were used as purchased from Mann Research Laboratories : glycine, alanin?: valine, leucine, isoleucine, glutamic acid, aspartie acid, threoninc i&o), phenylalanine, tryptophan,
‘Supported by the Medical Research Council of Canada., the American Heart Association, the Manitoba Heart Association. and the Canadian Arthritis and Rheumatism Society.
’ Visiting Scientist of the Medica. Research Council of Canada. Permanent address : Department of Biochemistry, Faculty of Medicine, Charles University, Hradec Kralove, Czechoslovakia.
3 Medical Research Associate, Medical R,esearch Cmnail of Cans&. 174
FLUORESCEXT SUBSTANCES IN PRCWEIKS. I 175
proline, cystine, methionine, lysine, arginine, all as Dr.,-isomers, and L-cysteine. L-tyrosine was obtained from Nutritional Biochemical Cor- poration, and L-aspa,ragine, I;-glutamine, L-cysteic acid, and m-kynuren- ine sulfate from Sigma Chemical Corporation; L-hi&dine from British Drug Houses Ltd., and 3-chlorotyrosine from K R; Ii Laboratories, Inc. Dityrosine was prepared in our laboratory from L-tyrosine, hydrogen peroxide, and horseradish peroxidase (1).
T’reahnent of Amino Acids with HCZ. Each of the amino acids was subjected to a procedure analogous to that of acid hydrolysis of proteins. The amino acid was heated with a 3Wfold excess of 6N HCl (fluoro- metric grade, Hartman-Leddon Company, Philadelphia) under nitrogen in sealed ampoules at a 1lO’C for 54 hours. The cooled contents of the ampoules were transferred quantitatively through a funnel with a coarse fritted disc and HCl was removed by evaporation under reduced pres- sure at 42”.
Gel Filtration of Acid “Hydrolyxates.” Each of t’he acid-trea#ted amino acid solutions was eluted with 0.5 M acetic acid from a 46 X 0.9 cm column of Bio-Gel P-Z (200-400 mesh, Bio-Rad Labora,tories). The effluent was monitored with an ISCO ultraviolet analyzer (model UA-2, dual-beam optica’ unit, 280 nm) and 3.0 m1 fractions were collected.
Fluorescence Measuremen~ts. Fluorescence wa,s determined with an Aminco-Bowman spectrofluorometer. All spectra are uncorrected and the values are expressed in arbitrary units.
Descending Chromatography. This carried out on What’man 1 paper using butanol/acet,ic acid/water (60: 15:25). Components were localized by noting fluorescence under ultraviolet light, by ninhydrin spray, and by a rragent believed to be specific for t.yrosine derivatives (2).
RESULTS
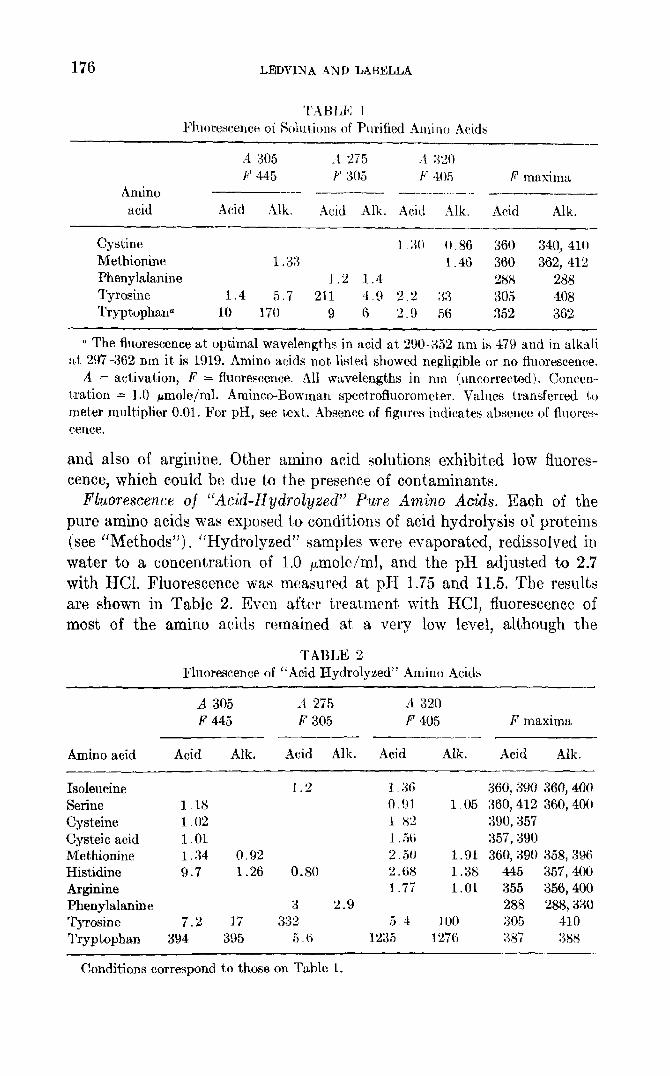
Fluorescence of “Nonhydrolyxed” Pure Amino Acids. Of the typical amino acids found in prot,eins, it is generally considered that only trypto- phan and tyrosine, and Do a lesser extent phenyla’lanine, are fluorescent in the ultraviolet region (3). To confirm this point, we examined the fluorescence of 22 amino acids dissolved in dilute HCl, pH 1.75, at a concentration of 1.0 ,pmole/ml, The pH was c.arefuIly controlled and blank values were subtracted from the fluorescent readings. The acidified samples were measured at 3 different wavelengths (see Table I; the basis for this choice of wavelengths is given in the “Discussion”), the samples adjusted to pH ‘11.5 by the addition of NaOB, and fluorescence measure- ments repeated at the same wavelengths. In a.ddition to the fluorescence emitted by t,he aromatic amino acids, significant fluorescence was seen in solutions of the sulfur-cont’aining amino acids, methionina and cystine,
176 LEDVlNA AND LABELLA
Amino acid
Cystine Methionine Phenylalanine Tyrosine Tryptophana
- A 305 .I 275 .1 3’20 Ii’ 445 P 305 F 405 F’ maxima
-.- --.-1__ I- -... .-..I I ..-- _-__.______ Acid :Uk. Arid Alk. Acid Alk. Acid Alk.
- I .x0 0.86 360 340, 410
1.3;s 1.46 360 362, 412 1.2 1.4 288 288
1.4 5.7 211 4.9 2.2 x3 305 408 10 170 9 6 2 9 56 352 362
U The fluorescence at optimal wavelengths in acid at 290-35‘2 nm is 479 and in alkali at 297362 nm it is 1919. Amino acids not listed showed negligible or no fhlorescence.
A = act,ivation, P = fluorescence. Ail wavelengths in nm (uncorrected). Concen- tration = 1 .O bmole/ml. An&co-Bowman spect’rofluoromet,er. Values transferred to meter multiplier 0.01. For pH, see text,. Absence of figures indicates absence of ~~IWW- cence.
and also of arginine. Other amino acid solutions exhibited low fluores- cence, which could be due to the presence of contaminants.
Fluorescence of “Acid-Hydrolyzed” Pure Amino Acids. Each of the pure amino acids was exposed to conditions of acid hydrolysis of proteins (see “Methods”). “Hydrolyzed” samples were evaporated, redissolved in water to a concentration of 1.0 pmole/ml, and the pH a,djusted to 2.7 with HCI. Fluorescence was measured at. pH 1.75 and 11.5. The results are shown in Table 2. Even after treatment with HCI, fluorescence of most of the amino acids remained at a very low level, although the
Fluorescence of “Acid Hydrolyzed” Amino Acids
A 305 F445
ii 275 P305
A 320 P 405 F maxima
Amino acid Acid Alk. Acid Alk. Acid Alk. Acid Alk.
Isoleucine Serine Cysteine Cysteic acid Methionine Histidine Arginine Phenylalanine Tyrosine Tryptophan
1.2 1 .Y6 1.18 cl.!)1 1.02 1.82 1.01 1 .5fi 1.34 0.w 2.30 9.7 1.26 0.80 2.68
1.77 3 2.9
7.2 17 332 5.4 394 395 5.6 1235
360,390 360,400 1.05 360,412 360,400
390,357 357,390
1.91 360,390 358,396 1.38 445 357,400 1.01 355 356,400
28% 288,330 100 305 410
1276 3x7 38X
Conditions correspond to those on Table 1.
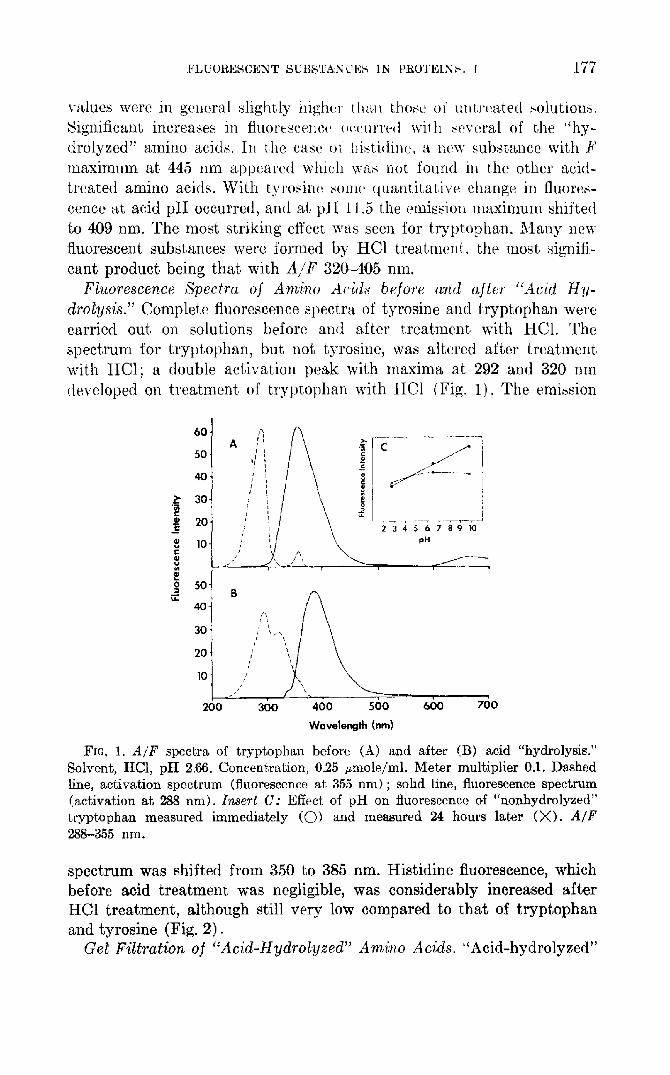
I-ulues were in gcircnbl slightly high(lr I I~:LII thoS;ci 0C Iirrl.rtAated Solutionti. Significant increases in Auort:ticc-!llct~ orv~1~1~~~~1 \vii 11 ~cvcral of tJ~(: “hy- drolyzed” amino acids. 1111 t,hc C:W of l)iatitlinc, a ww suh~tancc wit’h P maximum at 445 nm a,ppearetl which VW not found in t.he other acid- treated amino acids. With t8yrosinc NUN quantitative change in fluorcs- cence at acid pH occurred, and at pH 11.5 the emission maximum shifted to 409 nm. The most striking effect, was seen for tjryptophan. Many new fluorescent substances were formed by HCl treatmt~nt, t,he most signifi- cant product being tha,t with A/F 320405 nm.
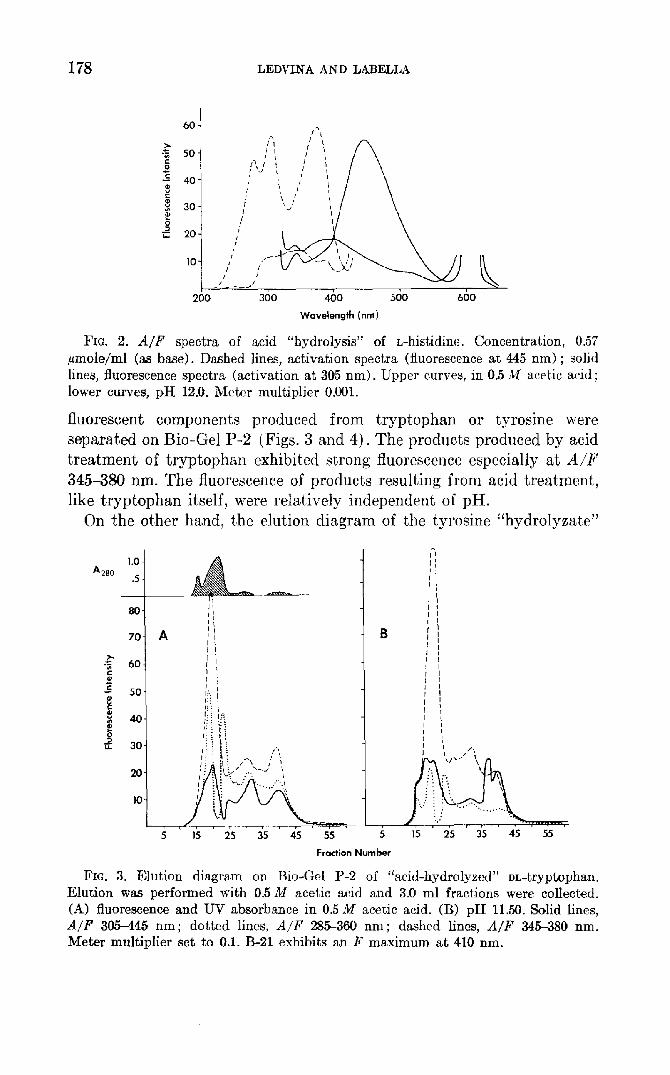
Fluorescence Spectra of Amino Acids before and after “Acid Hy- droEysis.” Complete fluorescence spect’rn of tyrosine and tryptophan were carried out on solutions before and after treat,ment with HCl. The spectrum for trypt,ophan, but not tyrosine, was altered after treatment with HCl; a double activation peak with maxima at 292 and 320 nm developed on treatment’ of tryptophan with HCI (Fig. 1). The emission
2345678910
400 500
Wavelength hn)
4
600 700
FIG. 1. A/F spectra of tryptophan before (A) and after (B) acid “hydrolysis.” Solvent, HCI, pH 2.66. Concentration, 0.25 ,umole/ml. Meter multiplier 0.1. Dashed line, activation spectrum (fluorescence at 355 nm) ; solid line, fluorescence spectrum (activation at 288 nm). Insert C: Effect of pH on fluorescence of “nonhydrolyzed” tryptophan measured immediately (0) and measured 24 hours later (X). A/F 288-355 nm.
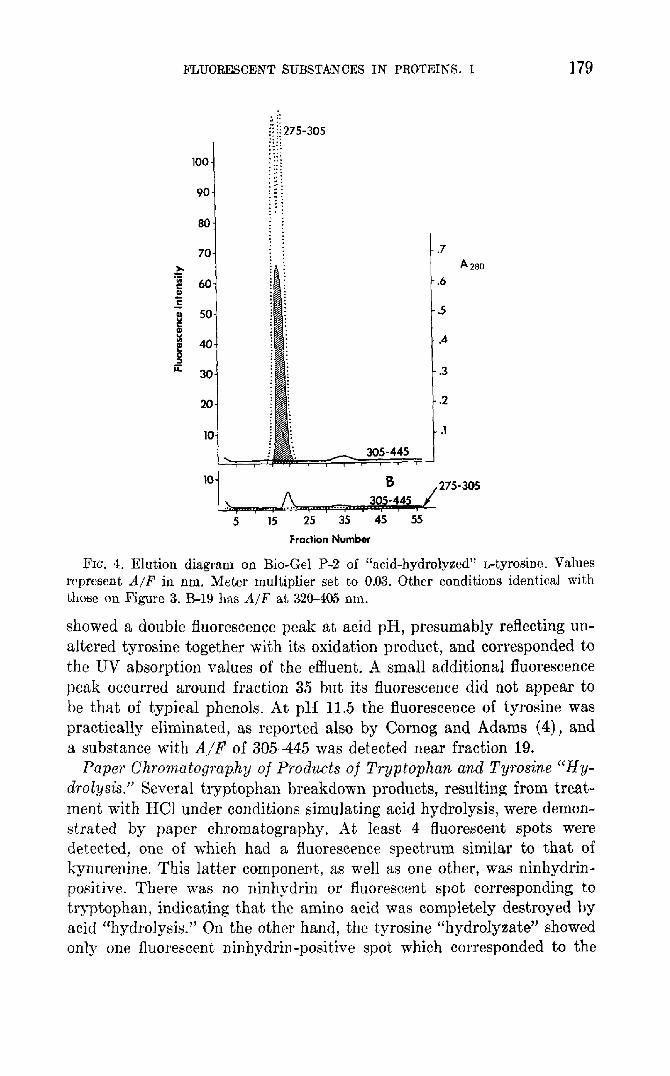
spectrum was shifted from 350 to 385 nm. Histidine fluorescence, which before acid treatment was negligible, was considerably increased after HCl treatment, although still very low compared to that of tryptophan and tyrosine (Fig. 2) .
Gel Nh-attin of “Acid-Hydrolyzed” Amino Acids. “Acid-hydrolyzed”
178 LEDVINA AND LABELLA
200 300 400 500 600
Wavelength (nm)
Fza. 2. A/F spectra of acid “hydrolysis” of L-histidine. Concentration, 0.57 pmole/ml (as base). Dashed lines, activation spectra (fluorescence at 445 nm) ; solid lines, fluorescence spectra (activation at 305 nm). Upper curves, in 0.5 M acetic acid ; lower curves, pH 12.0. Meter multiplier 0.001.
fluorescent components produced from trypt’ophan or tyrosine were separated on Bio-Gel P-2 (Figs. 3 and 4). The products produced by acid treatment of tryptophan exhibited strong fluorescence especially at A/P 345380 nm. The fluorescence of products resulting from acid treat’ment, like tryptophan itself, were relatively independent of pH.
On the other hand, the elution diagram of the tyrosine “hydrolyzate”
1.0 A 280 .5
:
80 1
70. A >
5 60
5 r
g
50.
40. 5 >
L 30.
20-
Fraction Number
FIG. 3. Elution diagram on &o-Gel P-2 of “acid-hydrolyzed” DL-tryptophan. Elution wss performed with 0.5 M acetic acid and 3.0 ml fractions were collected. (A) fluorescence and W absorbance in 0.5 hf acetic acid. (EL) pH 11.50. Solid lines, A/F 3OSS45 nm; dotted lines, A/F 285-360 nm; dashed lines, A/F 345-380 nm. Meter multiplier set to 0.1. B-21 exhibits an F maximum at 410 nm.
FLUORESCENT SUBSTBNCES IN PROTEINS+ I 179
::;: . .
.I..
loo- ::
: “: : ::: ::” . . :3: 90- ::: .-: ::. : : :
80- : :
.7 A 280
.6
.5
.4
10
Lr 0
r+ J 275-305
305-44s I. . . . .,.. 5 15 25 35 45 5~5
Fraction Number
FIG. 4. Elution diagram on Eo-Gel P-2 of “acid-hydrolyzed” L-tyrosine. Values represent A/F in nm. Meter multiplier set to 0.03. Other conditions identical with thvse on Figure 3. B-19 has A/F at 320405 nm.
showed a double fluorescence peak at acid pH, presumably reflecting un- altered tyrosine together with its oxidation product, and corresponded to the UV absorption values of the effluent. A small additional fluorescence peak occurred around fraction 35 but its fluorescence did not appear to be that of typical phenols. At pH 11.5 the fluorescence of tyrosine was
practically eliminated, as reported also by Cornog and Adams (4)) and a substance with A./F of 305445 was detected near fraction 19.
Paper Chro~matogra.p,hy of Products of Tryptophan and Tyrosine “Hy- drolysis.” Several tryptophan breakdown products, resulting from treat- ment with HC1 under conditions simulating acid hydrolysis, were demon- skated by paper chromatography. At least 4 fluorescent spots were detected, one of which had a fluorescence spectrum similar to that of kynurenine. This latter component, as well as one other, was ninhydrin- positive. There was no ninhydrin or fluorescent spot corresponding to tryptophan, indicating that the amino acid was completely destroyed by acid “hydrolysis.” On the other hand, the tyrosine “hydrolyzate” showed only one fluorescent ninhydrin-positive spot which corresponded to the
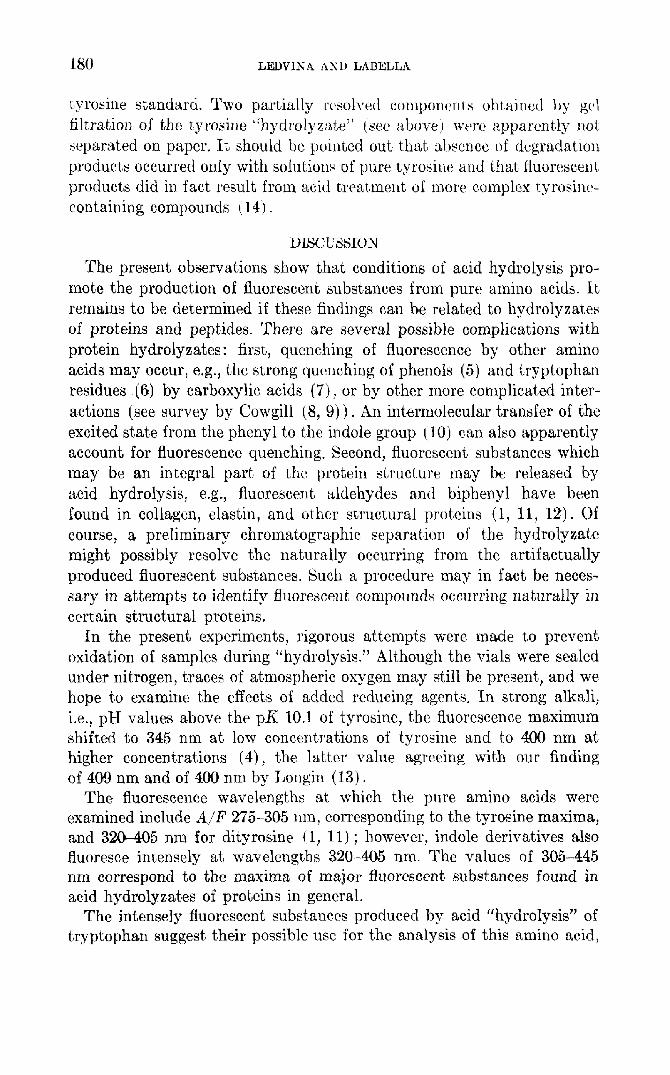
tly.rosine standard. Two partially rctsolved con~pc~n~:~~ t s obtained by gt!I filtration of the t,yrosine “hydrolyz:tle” (see above) wtlre appa~~tly r10t separated on paper, It should be pointed out that absence of degradation products occurred onIy with soIutiolls of pure tyrosine and that fluorescent, products did in fact result from acid t,reatment of more complex tyrosincb- containing compounds ( 14 j .
The present observations show that conditions of acid hydrolysis pro- mote the production of fluorescent substances from pure amino acids. It remains to be determined if these findings can be related to hydrolyzates of proteins and peptides. There are several possible complications with protein hydrolyzates: first, quenching of fluorescence by ot’her amino acids may occur, e.g., the strong quenching of phenols (5) and tryptophan residues (6) by carboxylic acids (7), or by other more complicated inter- actions (see survey by Cowgill (8, 9) ) . An intermolecular transfer of the excited state from the phenyl to the indole group { 10) can aIso apparently account for fluorescence quenching. Second, fluorescent substances which may be an integral part of the protein structure may b,e released by acid hydrolysis, e.g., fluorescent aldehydes ancl biphenyl have been found in collagen, elastin, and ot’her structural proteins (1, 11, 12). Of course, a preliminary chromatographic separation of the hydrolyzate might possibly resolve the naturally occurring from the artifactually produced fluorescent substances. Such a procedure may in fact be neces- sary in attempts to identify fluorescent compounds occurring naturally in certain structural proteins.
In the present experiments, rigorous attempt’s were made to prevent oxidation of samples during “hydrolysis.” Although the vials were sealed under nitrogen, t’races of atmospheric oxygen may still be present, and we hope to examine the effects of added reducing agents. In strong alkali, i.e., pH values above the pK 10.1 of tyrosine, the fluorescence maximum shifted to 345 nm at low concentrations of tyrosine and to 400 nm at higher concentrations (4)) the latter value agreeing wit,h our finding of 409 nm and of 400 nm by Longin (13).
The fluorescence wavelengths at’ which the pure amino acids were examined include A/F 275-305 nm, corresponding to the tyrosine maxima, and 32&405 nm for dityrosine (,l, 11) ; however, indole derivatives also fluoresce intensely at wavelengths 320-405 nm. The values of 305-445 nm correspond to the maxima of major fluorescent substances found in acid hydrolyzates of proteins in general.
The intenseIy ffuorescent substances produced by acid “hydrolysis” of tryptophan suggest t’heir possible use for the analysis of this amino acid,
FIJJORESCENT SUBST~C~ IN PROTEINS. I 181
thus eliminating the necessity for its calorimetric determination or a separate alkaline hydrolysis.
SUMMARY
Fluorescence of solutions of pure amino acids and their degradation products produced by conditions simulating acid hydrolysis of proteins was studied. Fluorescence data at three different wavelengths are presented for 22 amino acids at acid and alkaline pH, both before and after treatment with 6 N HCl. Acid treatment increased the fluorescence intensity of solutions of phenylalanine or histidine slightly, more so for tyrosine, and very markedly for tryptophan. Gel filtration of “acid- hydrolyzed” amino acids revealed several newly formed fluorescent com- pounds from tryptophan and one from tyrosine.
REFERENCES
1. K~LEY, F., LABELLA, F., AND QUEEN, G., Biochem. Biophgs. Res. Commun, 34, 156 (1969).
2. ACHER, R., AND CROCKER, C., Biochim. Biophys. Acta 9, 704 (1952). 3. UDENFRIEND, S., “Fluorescence Assay in Biology and Medicine,” pp. 125-190.
Academic Press, New Yo’rk/London, 1964. 4. CORNOG, J. L., JR., AND ADAMS, W. R., Biochim. Bio$ays. Acta 66, 356 (1963). 5, WOLD, F., AND WEBER, G., Federation Proc. 22,348 (1963) _ 6. EDELHOCH, R., BRAND, L., AND WILCHEK, M., Biuchmtitry 6, 547 (1967). 7. Cow~m, R. W., &whim. Biophys. Acta 100, 36 (1963). 8. COWGILL, R. W., Biochim. Biophys. Acta 168, 417 (1968). 9. CGWGILL, R. W., B&him. Biophys. Acta 168, 431 (1968).
10. WEBE&, G., Btichem. .I. 75, 33!j (1960). 11. L.&ELLA, F., KEELEY, F., VIVIAN, S., AND THORNHILL, D., Biochem. Biophys. Res.
Commun. 26, 748 (1967). 12. ANDWSEN, S. O., Acta Physiol, Stand. 66, Suppl. 263 (1966). 13. JANGIN, P., Compt. Rend. 248, 1971 (1959). 14. Unpublished observations.


![carboxybenzyl)-amino]isophthalic acid ligand Supporting … · 2017-03-28 · Supporting Information Fluorescent sensing of nitro-aromatics by Zn(II) and Cd(II) based coordination](https://img.pdfslide.us/doc/110x75/5e54f001b6e90b080d0b98d1/carboxybenzyl-aminoisophthalic-acid-ligand-supporting-2017-03-28-supporting.jpg)