Embed Size (px)
Citation preview

Fluorescence Lifetime Imaging Microscopy (FLIM) provides optically encoded information about processes in live cells. Atomic force microscopy, on the other hand, provides nanometer-resolved surface topography and mechanical information, and has recently been expanded to nanometer-resolved live cell mechanical property mapping. The integration of the two advanced live cell imaging techniques into one tool, with the capability to acquire simultaneous nanometer-mechanical and optical/biochemical information promises to provide new insights into cell mechanics. This application note describes the integration, demonstrated combined performance, and overlaid data of a cellular model system on the MicroTime 200 from PicoQuant and Bruker’s BioScope Catalyst™ Atomic Force Microscope (AFM), on the basis of an IX71/81 Inverted Optical Microscope with PiFoc focus control.
Benefits of Combined Techniques
Characteristics of surfaces on a single molecule level can be examined using both confocal fluorescence microscopy and atomic force microscopy. The techniques analyze different aspects of the sample, for example, one can investigate molecular dynamics with time-resolved fluorescence spectroscopy and characterize
surface topography with atomic force microscopy. Thus, a combination of both techniques into a single instrument enhances the methodology and opens up new investigation schemes, including:
• Live Cell Imaging Cell growth and differentiation are associated with changes in cell shape and content. Changes in cell surface properties, such as membrane elasticity and protein concentration and localization during cell development, can be monitored by synchronized acquisition of atomic force microscopy and fluorescence images. The topographical changes in cell shapes depend on changes in the cell cytoskeleton. The reorganization of those proteins can be associated with changes in protein conformation, localization, or orientation. The variation in the environment and in the protein structure itself can influence the fluorophore behavior.
• High-Resolution Molecular-Scale Imaging Atomic force microscopy can reveal the packing and structure of both native and reconstituted membranes. Such membranes often consist of a heterogeneous distribution of lipid, sterol, and protein
Application Note #137
Performing Enhanced Multiparameter Cell Imaging with Combined Fluorescence Lifetime Imaging Microscopy and Atomic Force Microscopy
Mechanical dissipation
AFM & FLIM aligned
Fluorescent nano beads
Glyoblastoma cells: FLIM
©20
12 B
ruke
r C
orpo
ratio
n. A
ll rig
hts
rese
rved
. Bio
Sco
pe C
atal
yst,
MIR
O, N
anoS
cope
, Pea
kFor
ce Q
NM
and
Sca
nAsy
st a
re t
rade
mar
ks o
r
regi
ster
ed t
rade
mar
ks o
f B
ruke
r C
orpo
ratio
n. A
ll ot
her
trad
emar
ks a
re t
he p
rope
rty
of t
heir
resp
ectiv
e co
mpa
nies
. AN
137,
Rev
. A0

measurements, such as Fluorescence Lifetime Imaging (FLIM), the system is equipped with a 3D piezo scanning system with an effective scan range of 80µm x 80µm x 80µm. In the standard configuration, the sample is placed on the scanner and moved across the stationary excitation beam (“sample scanning“). In an alternative configuration, the objective is mounted on the scanner and moved below the stationary sample (“objective scanning”). This special configuration allows free access to the sample from above and is therefore well suited to applications requiring special sample compartments or for integration with other techniques requiring patch-clamps, cryostats, or as demonstrated here, atomic force microscopy (see figure 1).
Imaging living cells with atomic force microscopy in near-physiological conditions has seen steady advances over the last two decades.2-4 The BioScope Catalyst™ from Bruker is a high-performance AFM designed specifically for biological applications.5 The AFM uses a flat sample scanner design that isolates the piezos from damage by fluids. The open design of the AFM head allows virtually unrestricted optical and physical access from above the sample. The scanning range is 150 x 150µm in closed-loop operation, with extremely quiet sensors to ensure high-resolution
components. The simultaneous study of atomic force microscopy with fluorescence techniques could reveal an association of such structures with protein compartmentalization and thereby reveal their function.
• Force and Mechanical Studies Another well-established atomic force microscopy technique is single-molecule force spectroscopy, wherein single molecules or pairs of molecules are mechanically interrogated to measure inter- and intra-molecular forces. By the parallel observation of fluorescence parameters, e.g., FRET processes induced by the movement, it is possible to determine inter- or intra-molecular distances.
Combined System Description
The MicroTime 200 from PicoQuant is a confocal time-resolved fluorescence microscope with single-molecule sensitivity.1 It is built around an inverted microscope body and uses the method of Time-Correlated Single Photon Counting (TCSPC) for time-resolved data acquisition along with single photon sensitive detectors and picosecond pulsed diode lasers for excitation. For image
2
Figure 1. Combined setup of the BioScope Catalyst and the MicroTime 200. The AFM with its sample stage is mounted on the inverted microscope body of the MicroTime 200, which is configured for objective scanning.

SPAD
Laser
Sample scanning AFM
Start/Stop line signals
Fluorescent specimen
Objective
3D piezopositioning
TCSPCelectronics
AFMcontroller
imaging and precise force measurements. The tip can be moved independently with a maximum range of more than 20µm (in Z-direction), which enables measurements of large samples, such as living cells. The complete AFM also includes a sample stage with tip-sample alignment and tip-optics alignment, suited for the IX71/81 inverted microscope body from Olympus. The AFM control software is optimized for exceptional ease of use, including Bruker’s exclusive ScanAsyst® AFM imaging mode that automatically optimizes atomic force microscopy imaging parameters. It also includes microscope image registration and overlay (MIRO®) software, which enables direct calibration and correlation of AFM images with light microscopy images. Finally, using the new PeakForce QNM® mode, one can additionally access nanomechanical information such as sample modulus, tip-sample adhesion, and dissipation by measuring and analyzing force curves at every image point while simultaneously imaging sample topography at high resolution.
The BioScope Catalyst AFM is optimally suited for combination with the MicroTime 200 as it fulfills all necessary requirements:
1. The BioScope Catalyst is a sample-scanning AFM,
2. The controller of the BioScope Catalyst provides a scan synchronization signal,
3. The scan head of the BioScope Catalyst fits mechanically onto the Olympus IX71/81 microscope body without interfering with normal light microscopy operation,
4. The sample baseplate of the BioScope Catalyst allows adjustment of the AFM tip in x, y and z relative to the confocal beam.
One of the key goals in the combination of the MicroTime 200 with the BioScope Catalyst is to enable simultaneous recording of AFM and optical images of the same sample region. It is therefore necessary to design a setup where the confocal volume of the MicroTime 200 can be precisely aligned with the AFM tip. This can be achieved by using the objective scanning mode of the MicroTime 200 to precisely locate the AFM tip within the optical scan range. The sample baseplate itself, and thus the complete AFM, can be moved in x and y directions, which is useful for the pre-alignment of the cantilever tip relative to the optical axis of the MicroTime 200. The sample is then placed onto the scan stage of the AFM (see figure 2). All scanning procedures are directly controlled by the AFM software, and therefore the functionality of the AFM is not compromised in any way.
Figure 2. Schematic of the combined setup: The sample is placed on the scanner of the AFM and the data acquisition of the MicroTime 200 is synchronized with the scanner movement by including corresponding electronic marker signals into the collected photon data stream.
3
Synchronization of the Two Systems
The combination of the MicroTime 200 with the BioScope Catalyst allows the parallel acquisition of fluorescence lifetime and AFM images. The key for this procedure is the special time-tagged time resolved (TTTR) mode of the PicoQuant TCSPC unit, which allows the insertion of external synchronization signals (“markers”) in the continuously recorded data stream of photon arrival times. In case of the AFM scanning systems, these markers are signals at the beginning and end of each scanning line, which basically divide the acquired photon stream into the scan lines and further allow the assignment of photons into image pixels.6 The required “line start” and “line stop” synchronization signals are readily available from the AFM controller.
Optical alignment
Before starting measurements, the AFM cantilever tip and the laser focus of the microscope must be aligned. The cantilever is observable through the eyepieces of the MicroTime 200. In one eyepiece, a cross hair is visible, which is aligned to the optical axis of the microscope (see figure 3A). The first coarse alignment can be done by moving the AFM sample baseplate until the cantilever tip is placed directly under the cross hair (see figure 3B).

the MicroTime 200 PIFOC objective nano-positioner. To avoid damage of the AFM probe, only small steps in Z should be performed (~2µm). The resulting image is shown in figure 4. In the end, a bright spot in the image center, which represents the cantilever tip, should be visible (see figure 4F).
4
Fine alignment of the laser beam path with the cantilever tip can then be done with the MicroTime 200 using the acquisition of scattered and reflected light. The first coarse alignment is sufficient to direct the cantilever tip into the scan area of the MicroTime 200. A good start position in the z direction is 80µm, the lowest available position for
Figure 3. Cantilever with tip in the eyepiece of MicroTime 200 aligned to the cross hair (left image). The coarse positioning can be done by using the three micrometer screws at the sample stage (red arrows in right image).
Figure 4. Backscatter images of AFM cantilever with a SiN tip. The bright spot in the image center is the tip apex. After iteratively zooming in and scanning the AFM tip, the laser focus of the MicroTime 200 can be directly positioned at the tip apex. The sample stage is moved 2µm in z-direction for every image B-F.

5
The laser focus is aligned with the AFM by performing point measurements on the cantilever tip. Fine alignment of the focal plane should be done using the photon count rate of the probe as an indicator. This alignment procedure has been shown to work with bare silicon and with silicon nitride AFM tips on glass surfaces, e.g., glass bottom culture dishes. In cases where the tip apex does not give a sharp bright spot in the optical picture, one can use the shape of the tip to determine the position of the tip apex, as
shown in figure 5. The correct confocal plane can be found, again by using the photon count rate as an indicator. Since the laser power needed for this calibration procedure is very low, photobleaching during the alignment is not an issue.
Imaging of Fluorescent Beads
In a first experiment, fluorescent beads (TetraSpeck, 100nm diameter, Molecular Probes) on a glass cover slide were imaged with the combined setup of the MicroTime 200 and the BioScope Catalyst. The results are shown in figure 6.
The AFM was used in ScanAsyst mode. The excitation wavelength was 470nm with an LP510 filter in front of a single photon avalanche diode (SPAD) from MPD (Olympus 60X 1.2 NA water objective). To acquire a synchronized image, the MicroTime 200 was used as slave of the BioScope Catalyst scanner. After a scan, up to eight data channels are visible in the AFM software and an intensity modulated FLIM image in the MicroTime 200 software. The images clearly show how both techniques allow the beads to be imaged, but they also show the differences. Not all features are visible in the AFM or the FLIM image (see figure 6A-C). Only with such a synchronized acquisition technique is this difference visible. A 3D representation of AFM height and fluorescence image is displayed in figure 7.
To analyze the quality of synchronization, a series of eight combined AFM-fluorescence images of a ~300nm high fluorescent bead was acquired. The fluorescence channel of the SPAD was introduced into an auxiliary photon counting input of the AFM controller so that the fluorescence intensity was acquired simultaneously with the AFM data by the AFM software. The NanoScope XY drift analysis feature was used to measure drift rates for the AFM itself and for the correlation between AFM and optical images. The
Figure 5. Backscatter image of a probe tip with marked tip apex (red cross), which is determined by the shape of the tip base.
Figure 6. Synchronised acquisition of fluorescence beads measuring fluorescence lifetime and topography. (A) intensity modulated FLIM image (B) AFM image and (C) merged AFM and FLIM image. Not all beads that are visible in the AFM picture also show fluorescence in the FLIM image. Scale bar is 5µm.
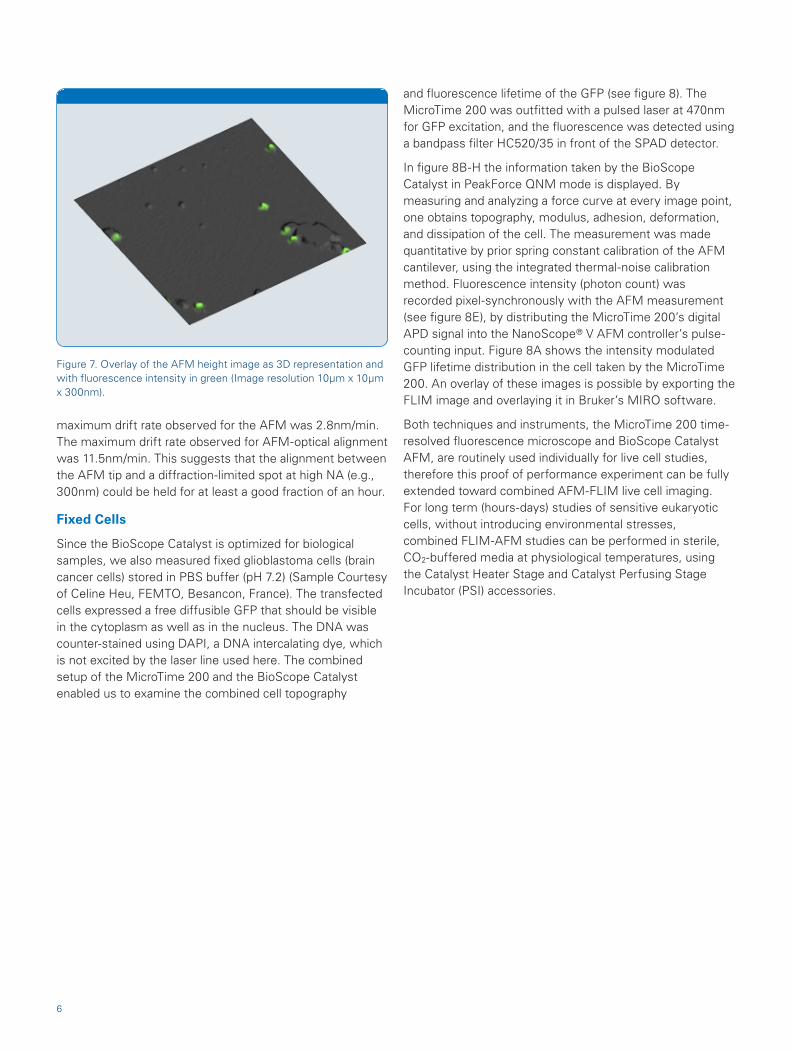
and fluorescence lifetime of the GFP (see figure 8). The MicroTime 200 was outfitted with a pulsed laser at 470nm for GFP excitation, and the fluorescence was detected using a bandpass filter HC520/35 in front of the SPAD detector.
In figure 8B-H the information taken by the BioScope Catalyst in PeakForce QNM mode is displayed. By measuring and analyzing a force curve at every image point, one obtains topography, modulus, adhesion, deformation, and dissipation of the cell. The measurement was made quantitative by prior spring constant calibration of the AFM cantilever, using the integrated thermal-noise calibration method. Fluorescence intensity (photon count) was recorded pixel-synchronously with the AFM measurement (see figure 8E), by distributing the MicroTime 200’s digital APD signal into the NanoScope® V AFM controller’s pulse-counting input. Figure 8A shows the intensity modulated GFP lifetime distribution in the cell taken by the MicroTime 200. An overlay of these images is possible by exporting the FLIM image and overlaying it in Bruker’s MIRO software.
Both techniques and instruments, the MicroTime 200 time-resolved fluorescence microscope and BioScope Catalyst AFM, are routinely used individually for live cell studies, therefore this proof of performance experiment can be fully extended toward combined AFM-FLIM live cell imaging. For long term (hours-days) studies of sensitive eukaryotic cells, without introducing environmental stresses, combined FLIM-AFM studies can be performed in sterile, CO2-buffered media at physiological temperatures, using the Catalyst Heater Stage and Catalyst Perfusing Stage Incubator (PSI) accessories.
6
maximum drift rate observed for the AFM was 2.8nm/min. The maximum drift rate observed for AFM-optical alignment was 11.5nm/min. This suggests that the alignment between the AFM tip and a diffraction-limited spot at high NA (e.g., 300nm) could be held for at least a good fraction of an hour.
Fixed Cells
Since the BioScope Catalyst is optimized for biological samples, we also measured fixed glioblastoma cells (brain cancer cells) stored in PBS buffer (pH 7.2) (Sample Courtesy of Celine Heu, FEMTO, Besancon, France). The transfected cells expressed a free diffusible GFP that should be visible in the cytoplasm as well as in the nucleus. The DNA was counter-stained using DAPI, a DNA intercalating dye, which is not excited by the laser line used here. The combined setup of the MicroTime 200 and the BioScope Catalyst enabled us to examine the combined cell topography
Figure 7. Overlay of the AFM height image as 3D representation and with fluorescence intensity in green (Image resolution 10µm x 10µm x 300nm).

Conclusions
The combination of AFM and time-resolved confocal microscopy opens up many new ways of investigating single-molecule dynamics. The presented combination of the MicroTime 200 and the BioScope Catalyst has been shown to be relatively straightforward without need of modifications to the systems. An alignment procedure has been developed and first results demonstrate the capabilities of such a combined setup. Prospective
applications include live cell imaging and the investigation of the impact of protein changes on cell shape and structure and vice versa; high-resolution molecular-scale imaging by merging of sub-nanometer AFM topographic imaging with optically encoded functionality; and force and mechanical studies that investigate inter- and intramolecular distances using atomic force spectroscopy and nanomanipulation on the single-molecule levely.
7
Figure 8. Synchronized acquisition of fixed glioblastoma cells expressing GFP using the MicroTime 200 in combination with the BioScope Catalyst. (A) Fluorescence lifetime distribution in the cell. (Image size 100 x 100µm) acquired by by MicroTime 200, and aligned using MIRO within the NanoScope software. (B-H) Data taken by the BioScope Catalyst AFM in PeakForce QNM mode showing topography, and spatially resolved quantitative mechanical cell properties. (E) Photon count from the MicroTime 200, synchronously recorded by NanoScope AFM controller.
©20
12 B
ruke
r C
orpo
ratio
n. A
ll rig
hts
rese
rved
. Bio
Sco
pe C
atal
yst,
MIR
O, N
anoS
cope
, Pea
kFor
ce Q
NM
and
Sca
nAsy
st a
re t
rade
mar
ks o
r
regi
ster
ed t
rade
mar
ks o
f B
ruke
r C
orpo
ratio
n. A
ll ot
her
trad
emar
ks a
re t
he p
rope
rty
of t
heir
resp
ectiv
e co
mpa
nies
. AN
137,
Rev
. A0
Bruker Nano Surfaces Divison
Santa Barbara, CA · USA+1.805.967.1400/[email protected]
www.bruker .com
References
1. http://www.picoquant.com/products/microtime200/microtime200.htm.
2. Z. Shao et al., Adv Phys 45 (1996) 1–86.
3. H.W. Wu et al., Scanning 20 (1998) 389–97.
4. C. Rotsch and M. Radmacher, Biophys J 78 (2000) 520–35.
5. http://www.bruker-axs.com/bioscope-catalyst-atomic-force-microscope.html
6. http://www.picoquant.com/technotes/technote_lsm_upgrade_kit.pdf – section “Synchronization”
Authors
Johannes H Kindt ([email protected]) and Alexandre Berquand (Bruker Nano Surfaces Division)
Marcelle König, Marcus Sackrow, Andrea Bleckmann, Felix Koberling (PicoQuant GmbH)