Embed Size (px)
Citation preview
Fluorescence Properties ofLabeled Proteins Near SilverColloid Surfaces
Badri P. MaliwalJoanna Malicka
Ignacy GryczynskiZygmunt GryczynskiJoseph R. LakowiczCenter for Fluorescence
Spectroscopy,University of Maryland at
Baltimore,Department of Biochemistry
and Molecular Biology,725 West Lombard Street,
Baltimore, MD 21201
Received 21 November 2002;accepted 21 February 2003
Abstract: The fluorescence properties of a monolayer of labeled avidin molecules were studiednear silver island films. We first adsorbed a monolayer of biotinylated-BSA as a base that was usedto capture labeled avidin molecules. For labeled avidin on silver island films, we observed anincrease of the fluorescence intensity of between 18 and 80 with one-photon excitation and up toseveral hundredfold or larger with two-photon excitation. The probes were moderately morephotostable in the presence of silver islands. There was also a dramatic decrease in the lifetimeswith the amplitude-weighted values decreasing from 7- to 35-fold. The data suggest that thesespectral changes are due to both increased rates of excitation near the metallic particles andincreases in the rates of radiative decay. Because these silver island surfaces are very heteroge-neous, we are hopeful that larger increases in intensity and photostability can be obtained forprobes situated at an optimal distance from the ideal island surfaces. © 2003 Wiley Periodicals,Inc. Biopolymers (Biospectroscopy) 70: 585–594, 2003
Keywords: fluorescence; two-photon excitation; multiphoton; photostability; radiative rate; sur-face plasmon resonance; radiative decay engineering; metal-enhanced fluorescence
INTRODUCTION
Gold and silver nanoparticles exhibit strong absorp-tion bands that are absent in the bulk metals. Theseabsorption bands, which are known as the surface
plasmon resonance, result in strong absorption andscattering and create an enhanced local electromag-netic field near the surface of the particles. The plas-mon resonances are highly dependent on the size andshape of the metal nanoparticles and the dielectric
Correspondence to: B. P. Maliwal ([email protected]).Contract grant sponsor: National Institute of Biomedical Imag-
ing and Bioengineering; contract grant number: NIH-EB00682.Contract grant sponsor: National Center for Research Resource;
contract grant number: RR-08119.Biopolymers (Biospectroscopy), Vol. 70, 585–594 (2003)© 2003 Wiley Periodicals, Inc.
585
properties of the surrounding environment.1 Thesenear field enhancements have given rise to surface-enhanced spectroscopies such as surface-enhancedRaman spectroscopy (SERS), surface-enhanced reso-nant Raman scattering (SERRS), and surface-en-hanced fluorescence (SEF). A great deal of researchhas been focused on SERS and SERRS for under-standing surface phenomena and their analytical andbioanalytical applications.2–4
In comparison with SERS and SERRS, SEF hasbeen explored much less. Unlike SERRS and SERS,the optimal SEF signal occurs at a certain distancefrom the nanoparticle surface. The fluorophores indirect contact with the metal islands are quenched.Early theoretical and experimetal work using bothrough film surfaces and particles suggested that thereis a distance-dependent enhancement of the fluores-cence intensity that was more pronounced for lowerquantum yield probes. This enhancement is accompa-nied by a significantly reduced fluorescence lifetime.The phenomena of increased intensities with de-creased lifetimes suggest an increased radiative ratefor the affected fluorophores. Furthermore, the in-creased rates of energy transfer were predicted fromtheoretical considerations because of interactions ofdonors and acceptors with the plasmon resonance.5–12
More recent experiments using Langmuir–Blodgett(LB) films have shown a distance-dependent enhance-ment of the fluorescence of spatially localizedprobes.13–16 There are also reports of enhanced fluo-rescence from monolayers of fluorophores attached toproteins and the distance dependence of the enhance-ment17,18 and reports of potential bioanalytical appli-cations.19–21 It should be noted that near field scan-ning optical microscope studies have shown the pres-ence of a highly enhanced localized plasmonresonance field near sharp tips and the resulting en-hanced one-22 and two-photon absorption,23,24 as wellas greatly accelerated resonance energy transfer.25
In our laboratory we verified SEF and its inversedependence on the quantum yield of probes in exper-iments where a small volume of the probe was sand-wiched between two quartz slides that were coatedwith heterogeneous silver island films. We furtherconfirmed earlier observations of associated loweringof lifetimes.26,27 Surprisingly, we were able to ob-serve silver island enhanced intrinsic fluorescencefrom nucleic acids that have very low quantumyields.28 We were also able to confirm predictions ofenhanced energy transfer rates,27 and we observed theexpected highly enhanced two-photon excitation thatis attributable to the presence of silver island surfacefilms.29 The photostability of the fluorescent probesappeared to increase in the presence of silver islands,
which has significant practical implications. The phe-nomenon of SEF, which has significantly higher in-tensity for both one-photo and multi-photon excitationand higher total photon output, stability, and energytransfer over much longer distances, can result in newapplications of fluorescence in biomedical researchand diagnostics.
To date, our published experiments have been con-ducted on probes in free solution between silver islandfilms about 1 �m apart. These observations includedboth slightly affected and largely unaffected popula-tions. To characterize SEF where the fluorophores arespatially localized, we adapted a BSA–biotin–avidinsystem used by Hoshi et al.30 and Sokolov et al.18 Inthis system biotinylated BSA is adsorbed to silverisland films to create a monolayer base. To this baseare bound avidin molecules labeled with fluorophores.This results in a population of fluorophores localizedabout 5–12 nm from the silver island surfaces. Weexamined the fluorescence intensity with one- andtwo-photon excitation, the photostability with one-photon excitation, and the fluorescence lifetimes ofthe affected molecules.
MATERIALS AND METHODS
All common chemicals, 3-aminopropyltriethoxysilane(APS), biotinylated BSA, and avidin were purchased fromSigma–Aldrich. The amine reactive forms of the fluoro-phores Pacific Blue succinimidyl ester, Lissamine rhoda-mine sulfonyl chloride, Texas Red sulfonyl chloride, andMalachite Green isothiocyanate were purchased from Mo-lecular Probes. The absorption spectra were collected on aHewlett–Packard VectraXM series 3 UV–visible spectro-photometer. The steady-state fluorescence in cuvettes wasmeasured with a Varian Cary Eclipse. Front face measure-ments of the coated slides were performed on a SLM 8000spectrofluorometer.
Labeling of Avidin
Typically, 1.5–2 mg of avidin was dissolved in 1–1.5 mL of0.2M bicarbonate buffer (pH 9.0) and mixed with 20–30�amounts of reactive fluorophore in a small amount of di-methyl formamide (final concentration � 10%). The reac-tion was allowed to proceed for 3–6 h and the labeledprotein was separated from the unreacted probe by passingit over a Sephadex G-25 column.
Preparation of Silver Islands on QuartzSlides
The microscope quartz slides were first cleaned overnightwith a mixture of concentrated sulfuric acid and 30% hy-
586 Maliwal et al.
drogen peroxide (10:1 v/v). The slides were washed thor-oughly with deionized distilled water and dried. These cleanslides were soaked for 5 min in a 1% APS solution andwashed. The details of silver deposition were described inearlier publications.27,28 Half of each slide was coated withsilver islands and the other half was not silvered.
Preparation of Labeled ProteinMonolayers
We used an adaptation of the method of Hoshi et al.30 andSokolov et al.18 The quartz slides with the silver islandswere first exposed to 250 �L of 5 �M biotinylated BSA forat least 16 h. The coated quartz slides were thoroughlywashed to remove all of the free biotin–BSA. The slideswere then further equilibrated for at least 1 h with 250 �Lof 2 �M labeled avidin in 1 mM HEPES and 0.1M NaCl (pH7.5). The slides were again thoroughly washed with bufferto remove any unbound avidin. Two such coated quartzslides with the islands facing each other were assembled andused for all the fluorescence experiments.
Fluorescence Measurements on LabeledAvidin Coated Quartz Slides
Both the steady-state and frequency-domain measurementswere carried out using front face illumination. The excita-tion was vertically polarized and the emission was observedthrough a vertical polarizer in the steady-state measure-ments. Magic angle observation was used in the emissionpath for the frequency-domain measurements. The excita-tion sources were a doubled Ti-sapphire for Pacific Blue(395 nm) and a dye laser for Lissamine (570 nm), TexasRed (580 nm), and Malachite Green (600 nm). The frequen-cy-domain data were analyzed as a sum of exponentialcomponents,
I�t� � ¥ �iexp��t/�i� (1)
where �i is the amplitude and �i is the decay time (¥�i �1.0). The average lifetime, which is the average time thefluorophore remains in the excited state, is given by
�� �¥ �i�i
2
¥ �i�i� ¥ fi�i (2)
where
fi ��i�i
¥j
�j�j(3)
is the fractional contribution of each component to thesteady-state data. The amplitude-weighted lifetime is givenby
��� � ¥ �i�i (4)
This value represents the area under the decay curve.The quantum yields (QYs) were measured on samples
with less than 0.02 optical density (OD). The slit widthswere 2.5 nm for the excitation and 5 nm for the emission.For reference we used either quinine sulfate in sulfuric acid(QY � 0.55) or rhodamine B in water (QY � 0.48).
Theory
Following excitation a fluorophore in free space can eitheremit a photon with a radiative deactivation rate (�) or returnto the ground state by a nonradiative deactivation rate (knr).For simplicity we are omitting the transitions to the tripletstate and chemical processes leading to photodegradation.The quantum yield (Q) and lifetime (�) of the fluorophore isgiven by
Q ��
� � knr(5)
� �1
� � knr(6)
The presence of nanosized noble metal particles in theproximity of a fluorophore can affect its fluorescence in twoways:
1. Illumination at the plasmon absorption of the nano-size metal particle creates an enhanced near-fieldintensity (Im) that results in higher fluorescence be-cause of increased rates of excitation. We define theexcitation rate enhancement factor as the ratio of theenhanced excitation intensity in the presence ofmetal particles (Ienh) and the excitation intensity (I)in the absence of particles (Gexc � Ienh/I).
2. Interactions between the plasmon band and the flu-orophore dipole influence both the nonradiative andradiative deactivation rates. The new radiative rateis given by �m � Nr�, and the nonradiative rate isgiven by knr
m � Nnrknr. We are not assuming anycorrelation between the enhancement factors Nr andNnr.
The fluorescence quantum yield (Qm) and lifetime (�m)in the presence of metal particles are given by
Qm �Nr�
Nr� � Nnrknr�
�m
�m � knrm (7)
�m �1
Nr� � Nnrknr�
1
�m � knrm (8)
The presence of the metal particles will change both theemission quantum yield and the fluorescence lifetime. Thechange in the quantum yield is described by the emissionfactor (Gqy) and the change in the fluorescence lifetime bythe lifetime factor (G�):
Fluorescence Properties of Labeled Proteins 587
Gqy �Qm
Q�
Nr�� � knr�
Nr� � Nnrknr� Nr
�m
�(9)
G� ��m
��
� � knr
Nr� � Nnrknr(10)
Both radiative Nr and nonradiative Nnr factors can have asignificant effect on the fluorescence emission. The relativecontributions of these factors will depend on the separationand the relative orientation between the fluorophore and themetal particles. For very small separations, the Nnrknr valuewill probably dominate and fluorescence quenching is ex-pected. For larger separations the value of Nnrknr rapidlydecreases and Nr� is expected to become the dominantfactor, resulting in fluorescence enhancement. It is intuitivethat the maximum value of the quantum yield enhancementfactor cannot exceed a value Gqy � 1/Q (when Nr,3 , Qm
1) that corresponds to a decrease in the fluorescencelifetime to zero. We expect a significant emission enhance-ment factor for weak fluorophores (Q � 1) and smallereffects for higher quantum yield fluorophores.
In the cases of both low and high quantum yield fluoro-phores the fluorescence intensity can also be increased bya change in the excitation rate (Gexc). It is important tostress that the observed fluorescence enhancement (Gfl
� GexcGqy) reflects the changes in both the excitation anddecay rates. For this simplified model, there are three inde-pendent variables that affect the fluorescence observed inthe presence of metal particles: Gexc, Nr, and Nnr. To solvesuch a system it is necessary to have three independentexperiments. If we can independently measure the fluores-cence lifetimes, based on Eqs. (7)–(10) we obtain for theone-photon excitation process
Gfl�1� � Gexc � Gqy � GexcNr
�m
�(11)
If the lifetimes are measured, the observed enhancement ofthe fluorescence now depends on two variables, Gexc and Nr
[eq. (11)]. In practice, the fluorescence enhancement (Gfl(1))
is not enough to determine whether the measured enhance-ment is due to the field enhancement (Gexc) or to theemissive rate and/or quantum yield enhancement (Nr and/orGqy). In order to overcome this problem, we used two-photon excitation.
The two-photon excitation process depends on thesquared power of the excitation intensity, but it leads to thesame excited state as one-photon excitation. The fluores-cence lifetimes do not depend on the mode of excitation.Because it is the excited molecule that interacts with themetal nanoparticle, it is reasonable to assume that the en-hancement factor is the same for one- and two-photonexcitation. By analogy to Eq. (11), one can calculate thefluorescence enhancement for two-photon excitation (Gfl
(2)):
Gfl�2� � Gexc
2 � Gqy � Gexc2 Nr
�m
�(12)
Dividing (12) by (11) leads to very simple relation betweenthe observed fluorescence enhancement for one- and two-photon excitation:
Gfl�2�
Gfl�1� � Gexc (13)
Thus, by employing these three measurements (the fluores-cence enhancement with one- and two-photon excitationand the fluorescence lifetimes), we have a simple way ofevaluating all enhancement factors in the presence of metalparticles.
RESULTS AND DISCUSSION
Avidin Deposition
In our experiments the fluorescence intensity will beproportional to the amount of labeled avidin bound tothe unsilvered and silvered slides. Hence, we consid-ered the extent of avidin binding to both types ofslides. We measured the adsorption of avidin to thedeposited BSA–biotin base layer on the unsilveredand silver island coated quartz slides by measuring theabsorption between 200 and 240 nm. Because of thesize of the tetramer (515 peptide bonds), avidin has alarge molar extinction of about 1,500,000 cm�1 M�1
at 210 nm. The ODs were around 0.005–0.006 at 210nm for both the bare and silver deposited slides. Theseabsorbance values suggest complete coverage withBSA as found in earlier reports.18,30 The differencesin the absorbance values between the bare quartz andthe island deposited surfaces are small and there is avariable baseline due to silver island absorption. Us-ing these values, an upper limit on the excess boundavidin on the silver deposited side is less than a factorof 2, if there is an excess. We calculated the excesssurface area due to the silver islands. For a semi-spherical island with a radius of 50 nm and interislandspacing of 150 nm [a conservative assumption be-cause all our atomic force microscopy (AFM) imagesshow considerably more spacing], the islands willincrease the total area by less than 10%. Therefore, allthe intensity observations that follow reflect the sur-face-enhanced phenomena and not differences in theamount of bound avidin molecules.
Silver Islands
The island deposited slides had an OD of 0.30–0.35.From visual inspection it was obvious that weachieved a significantly dense island population.Based on the AFM images for a range of islandpreparations,27–29 we expect there should be gaps/
588 Maliwal et al.
cavities of a minimum of hundreds of nanometersbetween these islands. The colloidal silver depositsexist as heterogeneous islands of various shapes andsizes, not as a continuous mirror.
Extent of Labeling and Quantum Yieldsin Cuvette
The extent of the labeling was calculated from themolar extinctions of avidin at 280 nm, the respectiveprobes at their absorption maxima, and the absorptionof the probes at 280 nm. The calculated number ofprobes are 14 for Pacific Blue, 4.5 for Lissamine, 2.5for Texas Red, and 2.5 for Malachite Green moleculesper avidin tetramer. The respective absorption andemission maxima of the labeled avidin in buffer were395 and 458 nm for Pacific Blue, 573 and 595 nm forLissamine, 590 and 620 nm for Texas Red, and 630and 655 nm for Malachite Green. The quantum yieldsin cuvettes for the labeled avidin in the presence offourfold BSA–biotin were 0.20 for Pacific Blue, 0.16for Lissamine, 0.08 for Texas Red, and �0.001 forMalachite Green. These quantum yields are signifi-cantly lower than those observed for free probes insolution. It is not unusual that fluorophores are sig-nificantly quenched when attached to a protein sur-face.
Enhanced Fluorescence for LabeledAvidin Monolayers
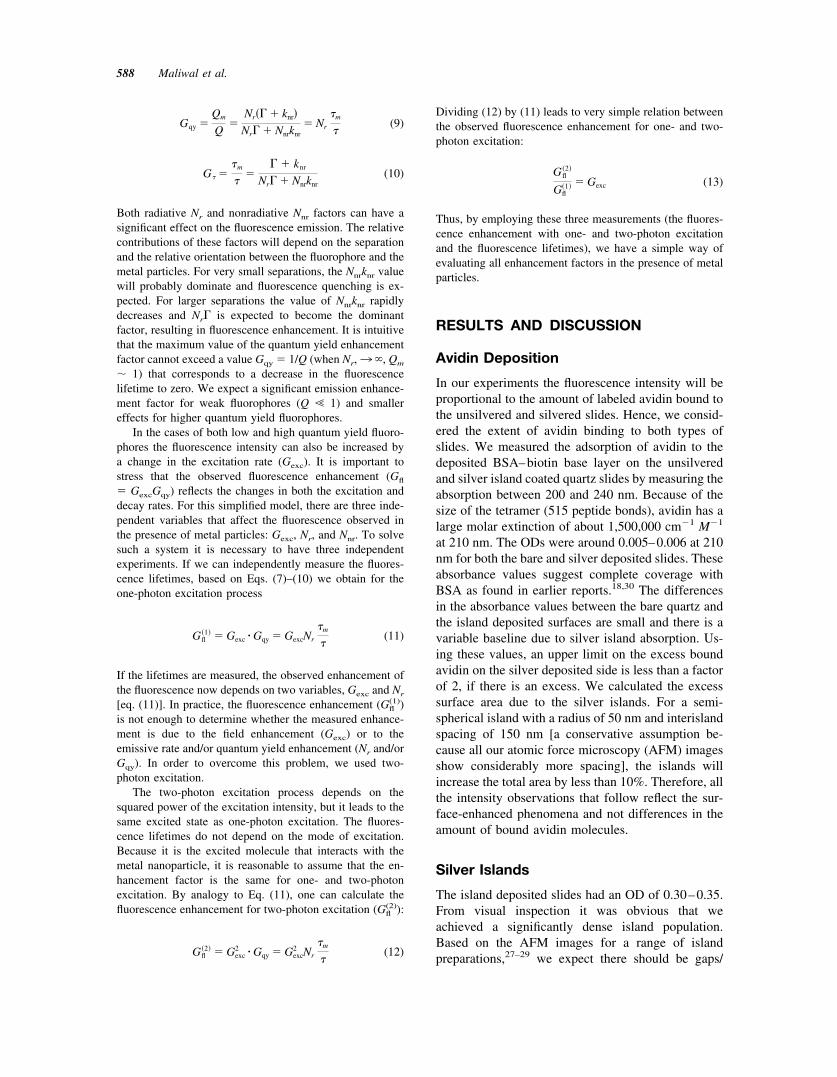
The emission spectra of the Pacific Blue labeled avi-din monolayer on bare and silver island depositedquartz slides are shown in Figure 1(a). The coumarinprobe shows an emission maxima around 460 nm andthe shape of the spectrum is the same on both sur-faces. We observed an enhancement factor of about28 for this probe that is due to silver islands. Thisvalue is a global average for the whole slide, and itwas calculated by scanning at several different sites.The calculated value includes corrections for innerfilter effects at both the excitation and emission wave-lengths. The results for Lissamine, Texas Red, andMalachite Green labeled avidin monolayers areshown in Figure 1(b). We did not observe any signif-icant distortion in the emission spectra in any of theseprobes. The respective average enhancement factorsare 16, 46, and 80 for these three probes. The mostenhanced Malachite Green is also the fluorophorewith the lowest quantum yield.
These fluorescence enhancements are more pro-nounced than those seen by Sokolov and coworkers18
with fluorescein on similar BSA–biotin–avidin mono-layers in the presence of nonaggregated silver colloid
film surfaces. They also observed higher enhancementwith a weaker fluorophore NBD [6-(N-(7-nitrobenz-2-oxa-1,3-diazol-4-yl)amino)hexanoate] in an antibody–antigen system using the same silver colloid film sur-faces. Aroca et al.13–16 used LB films and observed up to50-fold enhanced fluorescence in the presence of silverislands with several probes. There are reasons for be-lieving that these enhancement factors are a lower limitto what can be achieved. Our silver deposits are highlyheterogeneous and we see an average over a range ofsizes and shapes of islands. Recent research on theintrinsic surface-enhanced Raman properties of singleAg and Au nanoparticles suggests that a small fraction ofcolloidal particles show extremely large enhance-ments.31–33 The same is likely to be true for silvercolloids/islands SEF. The fluorescence enhancement de-pends on the size, shape, spacing between the islands,distance of the probe from the surface, and strength ofinteractions between the metal surface and the probe.
FIGURE 1 Emission spectra of labeled avidin moleculesbound to BSA-coated silver island films. The numbers in-dicate the relative intensities of labeled avidins on silverisland films as compared to quartz.
Fluorescence Properties of Labeled Proteins 589
With improved fabrication, it should be possible to re-alize far greater fluorescence enhancement factors.
Enhanced Photostability
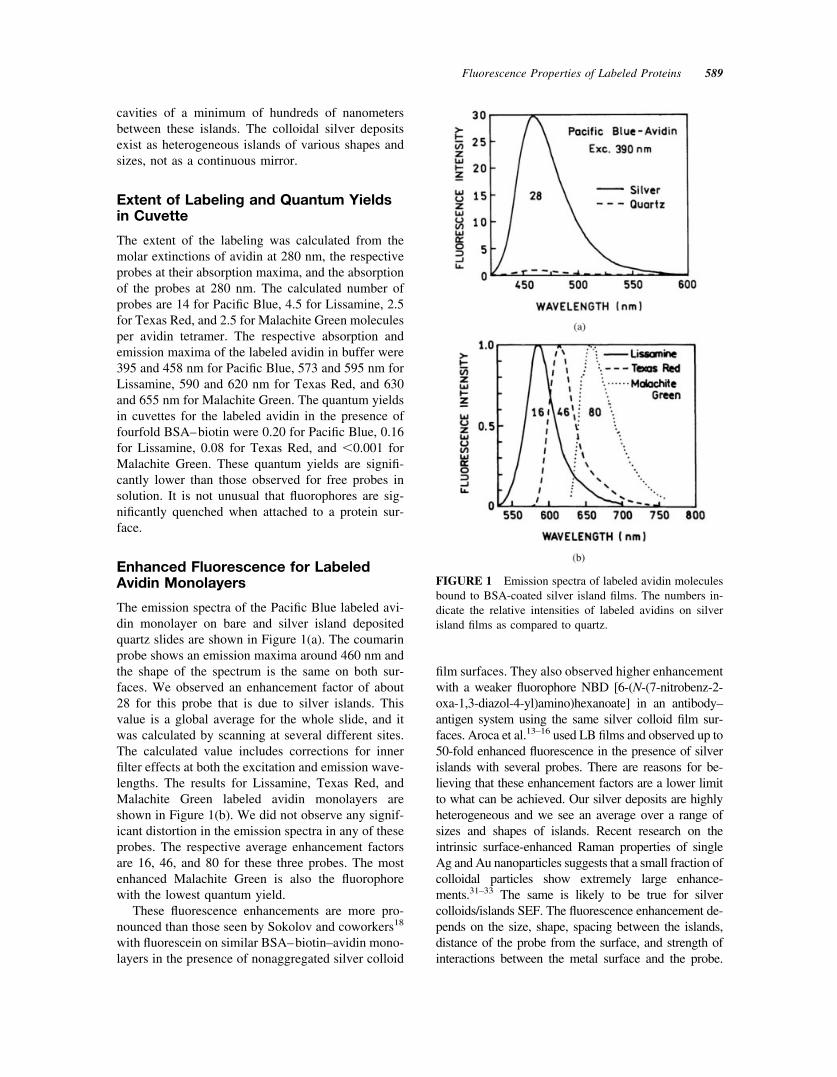
We also studied the photostability of Pacific Blue,Lissamine, and Texas Red labeled avidin monolayersin the presence of silver island surfaces. The excita-tion power was less than 1 mW in all experiments.Each probe was examined with the same incidentintensity on silver islands and on quartz slides. How-ever, the absolute power levels were different for eachprobe because the aim was to find experimental con-ditions in which we could observe bleaching on thebare quartz slide. The results are shown in Figure 2.For the purpose of comparison, we have normalizedthe intensity to 1 for both the silver islands and thebare quartz. In each case the emission intensity issignificantly higher in silver island films. In all threecases we observe a modest increase in photostabilityin the presence of silver islands. One of the factorsthat probably contributes to this enhanced stability isshortened lifetimes for the affected probes (see be-low). As the fluorophores spend less time in theexcited state they can undergo more excitation–deex-citation cycles prior to photodecomposition. Recallingthat the time-zero intensities are much higher with thesilver islands, the area under these curves and hencethe number of observable photons per fluorophore aredramatically increased. That is, because the rate ofphotobleaching is the same or lower in the presence of
the silver island films, the number of observable pho-tons per fluorophore is increased by the enhancementfactors shown in Figure 1. The only other report ofenhanced stability besides our own27 is a recent pub-lication by Ditlbacher et al.34 From a practical per-spective, better stability will be a major advantage forapplications such as microscopy or DNA arrays wherehigh excitation powers are used and bleaching/photo-degradation is a problem.
Two-Photon Excitation
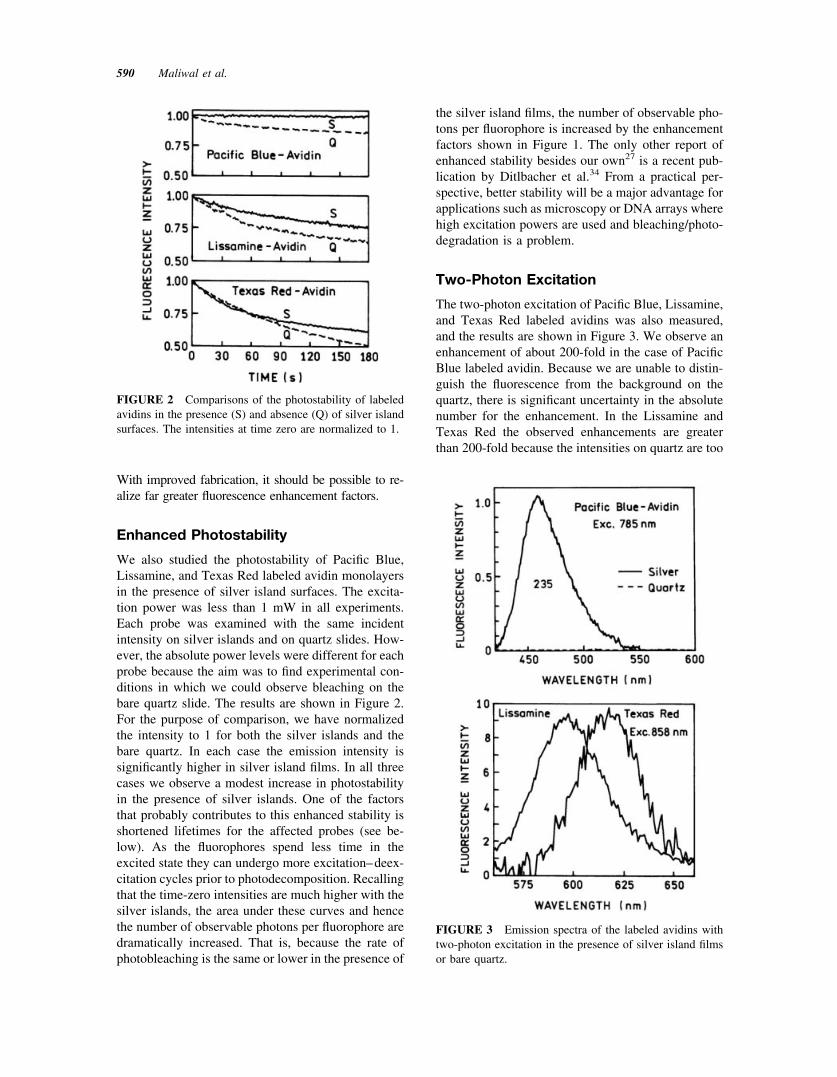
The two-photon excitation of Pacific Blue, Lissamine,and Texas Red labeled avidins was also measured,and the results are shown in Figure 3. We observe anenhancement of about 200-fold in the case of PacificBlue labeled avidin. Because we are unable to distin-guish the fluorescence from the background on thequartz, there is significant uncertainty in the absolutenumber for the enhancement. In the Lissamine andTexas Red the observed enhancements are greaterthan 200-fold because the intensities on quartz are too
FIGURE 3 Emission spectra of the labeled avidins withtwo-photon excitation in the presence of silver island filmsor bare quartz.
FIGURE 2 Comparisons of the photostability of labeledavidins in the presence (S) and absence (Q) of silver islandsurfaces. The intensities at time zero are normalized to 1.
590 Maliwal et al.
weak to measure. The relative intensities of Lissamineand Texas Red are significantly lower than that seenfor Pacific Blue. Part of the reason may be that wehave an optimal wavelength in the coumarin deriva-tive Pacific Blue35 whereas the maxima for the othertwo probes are outside the wavelength range of theTi-sapphire laser (780–850 nm). Further, because thecoumarin absorption and emission maxima and theplasmon absorption maximum coincide, there is likelyto be stronger interaction between the surface plas-mon and this probe.
These results are consistent with our earlier obser-vations with several probes in solution near silverisland surfaces,29 which had enhanced two-photonexcitation attributable to the presence of an enhancedplasmon field near a nanosized metal tip,23,24 and totalinternal reflection measurements. What is noteworthyis the magnitude of the two-photon enhancement dueto plasmon resonance.
Fluorescence Lifetime Measurements
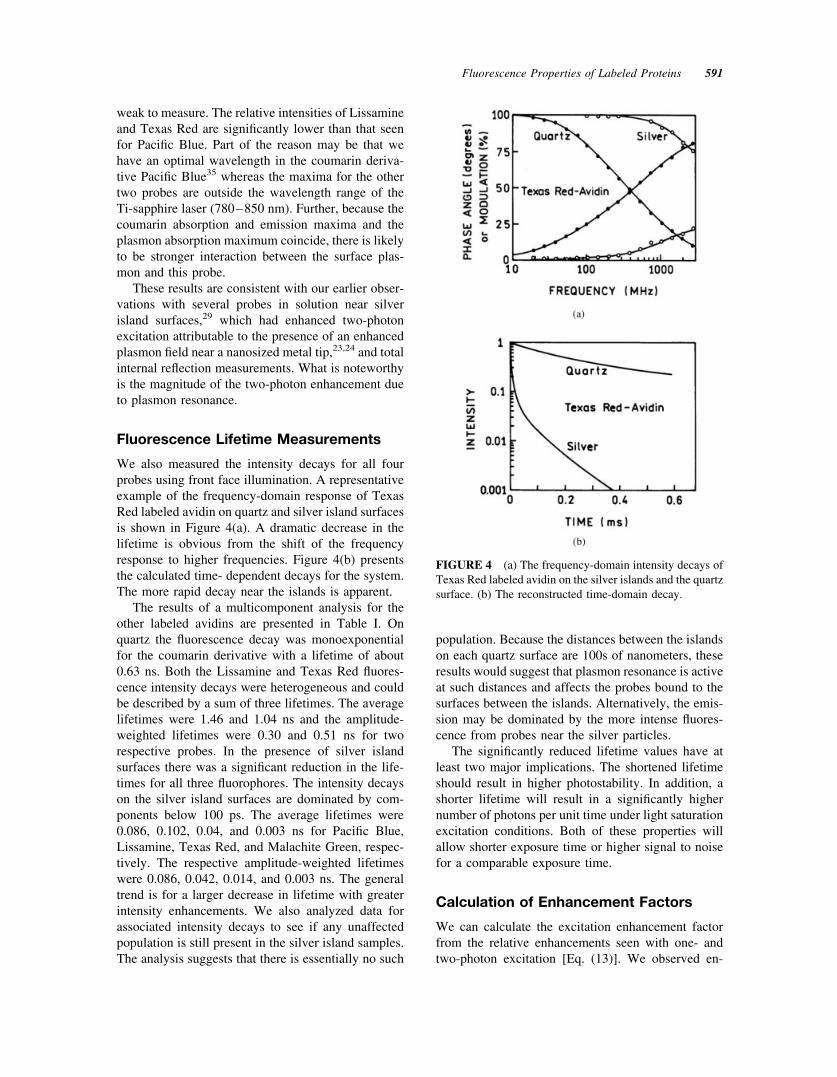
We also measured the intensity decays for all fourprobes using front face illumination. A representativeexample of the frequency-domain response of TexasRed labeled avidin on quartz and silver island surfacesis shown in Figure 4(a). A dramatic decrease in thelifetime is obvious from the shift of the frequencyresponse to higher frequencies. Figure 4(b) presentsthe calculated time- dependent decays for the system.The more rapid decay near the islands is apparent.
The results of a multicomponent analysis for theother labeled avidins are presented in Table I. Onquartz the fluorescence decay was monoexponentialfor the coumarin derivative with a lifetime of about0.63 ns. Both the Lissamine and Texas Red fluores-cence intensity decays were heterogeneous and couldbe described by a sum of three lifetimes. The averagelifetimes were 1.46 and 1.04 ns and the amplitude-weighted lifetimes were 0.30 and 0.51 ns for tworespective probes. In the presence of silver islandsurfaces there was a significant reduction in the life-times for all three fluorophores. The intensity decayson the silver island surfaces are dominated by com-ponents below 100 ps. The average lifetimes were0.086, 0.102, 0.04, and 0.003 ns for Pacific Blue,Lissamine, Texas Red, and Malachite Green, respec-tively. The respective amplitude-weighted lifetimeswere 0.086, 0.042, 0.014, and 0.003 ns. The generaltrend is for a larger decrease in lifetime with greaterintensity enhancements. We also analyzed data forassociated intensity decays to see if any unaffectedpopulation is still present in the silver island samples.The analysis suggests that there is essentially no such
population. Because the distances between the islandson each quartz surface are 100s of nanometers, theseresults would suggest that plasmon resonance is activeat such distances and affects the probes bound to thesurfaces between the islands. Alternatively, the emis-sion may be dominated by the more intense fluores-cence from probes near the silver particles.
The significantly reduced lifetime values have atleast two major implications. The shortened lifetimeshould result in higher photostability. In addition, ashorter lifetime will result in a significantly highernumber of photons per unit time under light saturationexcitation conditions. Both of these properties willallow shorter exposure time or higher signal to noisefor a comparable exposure time.
Calculation of Enhancement Factors
We can calculate the excitation enhancement factorfrom the relative enhancements seen with one- andtwo-photon excitation [Eq. (13)]. We observed en-
FIGURE 4 (a) The frequency-domain intensity decays ofTexas Red labeled avidin on the silver islands and the quartzsurface. (b) The reconstructed time-domain decay.
Fluorescence Properties of Labeled Proteins 591
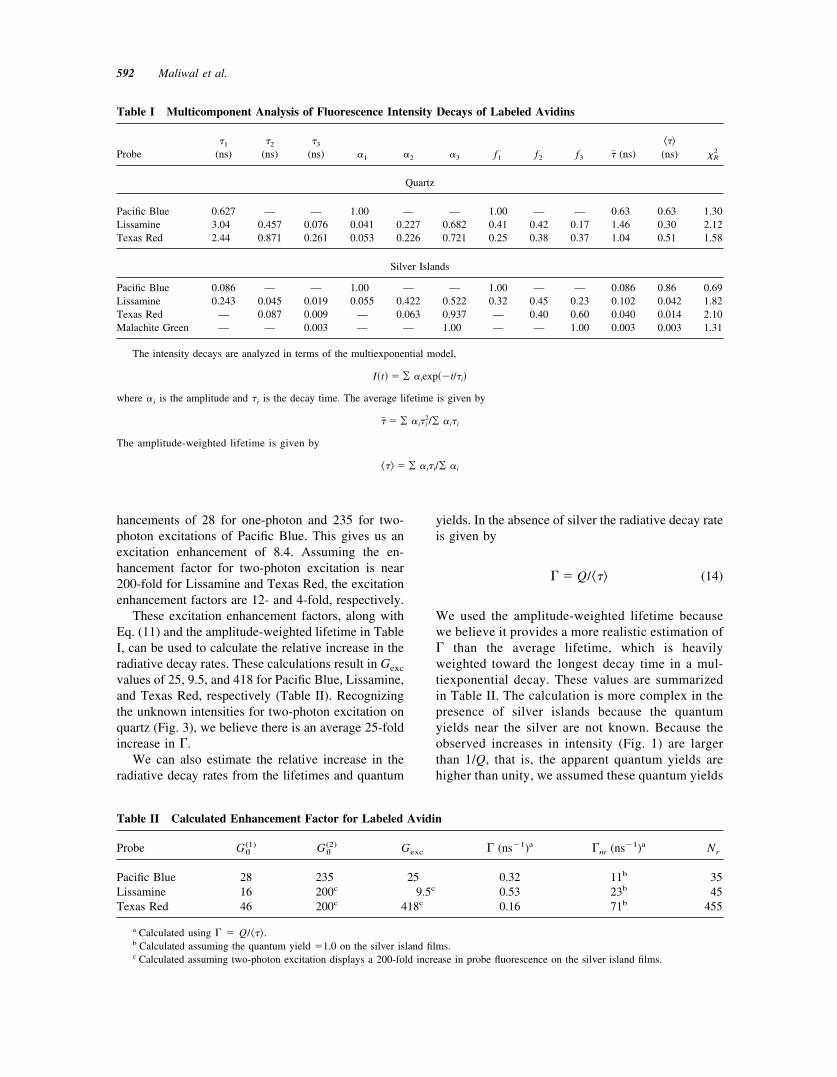
hancements of 28 for one-photon and 235 for two-photon excitations of Pacific Blue. This gives us anexcitation enhancement of 8.4. Assuming the en-hancement factor for two-photon excitation is near200-fold for Lissamine and Texas Red, the excitationenhancement factors are 12- and 4-fold, respectively.
These excitation enhancement factors, along withEq. (11) and the amplitude-weighted lifetime in TableI, can be used to calculate the relative increase in theradiative decay rates. These calculations result in Gexc
values of 25, 9.5, and 418 for Pacific Blue, Lissamine,and Texas Red, respectively (Table II). Recognizingthe unknown intensities for two-photon excitation onquartz (Fig. 3), we believe there is an average 25-foldincrease in �.
We can also estimate the relative increase in theradiative decay rates from the lifetimes and quantum
yields. In the absence of silver the radiative decay rateis given by
� � Q/��� (14)
We used the amplitude-weighted lifetime becausewe believe it provides a more realistic estimation of� than the average lifetime, which is heavilyweighted toward the longest decay time in a mul-tiexponential decay. These values are summarizedin Table II. The calculation is more complex in thepresence of silver islands because the quantumyields near the silver are not known. Because theobserved increases in intensity (Fig. 1) are largerthan 1/Q, that is, the apparent quantum yields arehigher than unity, we assumed these quantum yields
Table I Multicomponent Analysis of Fluorescence Intensity Decays of Labeled Avidins
Probe�1
(ns)�2
(ns)�3
(ns) �1 �2 �3 f1 f2 f3 �� (ns)���(ns) �R
2
Quartz
Pacific Blue 0.627 — — 1.00 — — 1.00 — — 0.63 0.63 1.30Lissamine 3.04 0.457 0.076 0.041 0.227 0.682 0.41 0.42 0.17 1.46 0.30 2.12Texas Red 2.44 0.871 0.261 0.053 0.226 0.721 0.25 0.38 0.37 1.04 0.51 1.58
Silver Islands
Pacific Blue 0.086 — — 1.00 — — 1.00 — — 0.086 0.86 0.69Lissamine 0.243 0.045 0.019 0.055 0.422 0.522 0.32 0.45 0.23 0.102 0.042 1.82Texas Red — 0.087 0.009 — 0.063 0.937 — 0.40 0.60 0.040 0.014 2.10Malachite Green — — 0.003 — — 1.00 — — 1.00 0.003 0.003 1.31
The intensity decays are analyzed in terms of the multiexponential model,
I�t� � ¥ �iexp��t/�i�
where �i is the amplitude and �i is the decay time. The average lifetime is given by
�� � ¥ �i�i2/¥ �i�i
The amplitude-weighted lifetime is given by
��� � ¥ �i�i/¥ �i
Table II Calculated Enhancement Factor for Labeled Avidin
Probe Gfl(1) Gfl
(2) Gexc � (ns�1)a �m (ns�1)a Nr
Pacific Blue 28 235 25 0.32 11b 35Lissamine 16 200c 9.5c 0.53 23b 45Texas Red 46 200c 418c 0.16 71b 455
a Calculated using � � Q/���.b Calculated assuming the quantum yield �1.0 on the silver island films.c Calculated assuming two-photon excitation displays a 200-fold increase in probe fluorescence on the silver island films.
592 Maliwal et al.
were 1.0. These calculations indicate the radiativedecay rates are increased by 35-, 45-, and 455-foldfor Pacific Blue, Lissamine, and Texas Red, respec-tively. We stress that these results must be recog-nized as qualitative, but we suggest that silverparticles result in both increased excitation andlarger radiative decay rates of nearby fluorophores.
CONCLUSION
Fluorescence is enhanced in the proximity of me-tallic silver particles. The optimal enhancement de-pends upon the distance and the spectral propertiesof the probe and how efficiently it interacts with thesurface plasmon. Because the surface plasmon de-pends on the size, shape, and dielectric environ-ment of the colloid particles, it should be possibleto optimize the interaction for a given fluorophoreand metal. The enhanced intensity is accompaniedby a reduced lifetime near the nanometer aggre-gated colloid surface. One of the implications ofthese changes is a greater signal from a fluorescentprobe leading to higher sensitivity and the ability todetect the fluorescent signal at lower concentra-tions. Furthermore, reduced lifetimes will allow theuse of higher excitation powers. Similarly, a sig-nificantly enhanced multiphoton signal is alsopromising in extending the use of metal particlesfor localized excitation in samples, cells, or tissues.
One goal in the development of fluorescentprobes has been to find ways to maintain highquantum yields after the probe is coupled to aprotein surface. Frequently, the covalent attach-ment results in significant quenching. A relatedphenomenon is self-quenching as the probe densityincreases. The presence of silver colloid nanopar-ticles may overcome both of these limitations. Inpractical terms it will allow for greater labeling andthe option to use a significantly larger base ofavailable probes. The initial quantum yield of afluorophore will be much less important, and a lowquantum yield may be an advantage if the goal is todetect fluorophores bound near metallic particles.Another promising area is combining enhanced flu-orescence due to silver islands with an applicationthat also enhances the local field such as evanescentwaves in total internal reflection or surface plasmonresonance.19,20 Such a combination may result inlarger signals, a localized detector, and increasedsensitivity for both one-photon and multiphotonexcitation.
The authors acknowledge the support of this work by theNational Institute of Biomedical Imaging and Bioengineer-ing and the National Center for Research Resources.
REFERENCES
1. Kreibig, U.; Volmer, M. Optical Properties of MetalClusters; Springer: New York, 1995.
2. Moskovits, M. Rev Mod Phys 1985, 47, 783–825.3. Campion, A.; Kambhampati, P. Chem Soc Rev 1998,
27, 241–250.4. Kneipp, K.; Kneipp, H.; Itzkan, I.; Dasari, R. R.; Feld,
M. S. Chem Rev 1999, 99, 2957–2975.5. Kuhn, H. J Chem Phys 1970, 53, 101.6. Drexhage, K. H. In Progress in Optics; Wolf, E., Ed.;
North-Holland: Amsterdam, 1974; Vol. XII, pp 163–232.
7. Chance, R. R.; Prock, A.; Silbey, R. Adv Chem Phys1978, 37, 1–65.
8. Gersten, J.; Nitzan, A. J Chem Phys 1981, 75, 1139–1152.
9. Weitz, D. A.; Garoff, S.; Gersten, J. I.; Nitzan, A.J Chem Phys 1983, 78, 5324–5338.
10. Leitner, A.; Lippitsch, M. E.; Draxler, S.; Riegler, M.;Aussenegg, F. R. Appl Phys B 1985, 36, 105–109.
11. Das, P. C.; Metiu, H. J Phys Chem 1985, 89, 4680–4689.
12. Kummerlen, J.; Leitner, A.; Brunner, H.; Aussenegg,F. R.; Wokaun, A. Mol Phys 1993, 80, 1031–1046.
13. DeSaja-Gonzalez, J.; Aroca, R.; Nagao, Y.; Desaja,J. A. Spectrochim Acta A 1997, 53, 173–181.
14. Tarcha, P. J.; DeSaja-Gonzalez, J.; Rodriguez-Llorente,S.; Aroca, R. Appl Spectrosc 1999, 53, 43–48.
15. Constantino, C. J. L.; Aroca, R. F. J Raman Spectrosc2000, 31, 887–890.
16. Antunes, P. A.; Consantino, C. J. L.; Aroca, R. F.; Duff,J. Langmuir 2001, 17, 2958–2964.
17. Chumanov, G.; Sokolov, K.; Gregory, B. W.; Cotton,T. M. J Phys Chem 1995, 99, 9466–9471.
18. Sokolov, K.; Chumanov, G.; Cotton, T. M. Anal Chem1998, 70, 3898–3905.
19. Attridge, J. W.; Daniels, P. B.; Deacon, J. K.; Robinson,G. A.; Davidson, G. P. Biosens Bioelectron 1991, 6,201–214.
20. Lieberman, T.; Knoll, W. Colloid Surface A 2000, 171,115–130.
21. Stich, N.; Gandhum, A.; Matushin, V.; Mayer, C.;Baker, G.; Schalkhammer, T. J Nanosci Nanotechnol2001, 1, 397–405.
22. Hamann, H. F.; Kuno, M.; Gallagher, A.; Nesbitt, D. J.J Chem Phys 2001, 114, 8596–8609.
23. Sanchez, E. J.; Novotny, L.; Xie, X. S. Phys Rev Lett1999, 82, 4014–4017.
24. Kawata, Y.; Xu, C.; Denk, W. J Appl Phys 1999, 85,1294–1301.
25. Fiurasek, J.; Chernobrod, B.; Prior, Y.; Avebukh, I. Sh.Phys Rev B 2001, 63, 405–420.
Fluorescence Properties of Labeled Proteins 593
26. Lakowicz, J. R. Anal Biochem 2001, 298, 1–24.27. Lakowicz, J. R.; Shen, Y.; D’Auria, S.; Malicka, J.;
Fang, J.; Gryczynski, Z.; Gryczynski, I. Anal Biochem2002, 301, 261–277.
28. Lakowicz, J. R.; Shen, Y.; Gryczynski, Z.; D’Auria, S.;Gryczynski, I. Biochem Biophys Res Commun 2001,286, 875–879.
29. Gryczynski, I.; Malicka, J.; Shen, Y.; Gryczynski, Z.;Lakowicz, J. R. J Phys Chem 2002, 106, 2191–2195.
30. Hoshi, T.; Anzai, J.; Osa, T. Anal Chem 1995, 67,770–774.
31. Nie, S.; Emory, S. R. Science 1997, 275, 1102–1107.32. Kneipp, K.; Wang, Y.; Kneipp, H.; Perelman, L. T.;
Itzkan, I.; Dasari, R. R.; Feld, M. S. Phys Rev Lett1997, 78, 1667–1670.
33. Zeisel, D.; Deckert, V.; Zenobi, R.; Vo-Dinh, T. ChemPhys Lett 1998, 283, 381–385.
34. Diltbacher, H.; Felidj, N.; Krenn, J. R.; Lamprecht, B.;Leitner, A.; Aussenegg, F. R. Appl Phys B 2001, 73,373–377.
35. Fischer, A.; Cremer, C.; Stelzer, E. H. K. Appl Opt1995, 34, 1989–2003.
594 Maliwal et al.