Embed Size (px)
Citation preview
University of BaselDepartment of Physics
Fluorescence Imaging of Single Spins inNitrogen-Vacancy Centers Using a
Confocal MicroscopeFortgeschrittenenpraktikum I/II
September 17, 2018
Abstract
The main goal of this experiment is to understand the basic working princi-
ple of a confocal microscope. In addition we will use the confocal microscope
to discover some of the exciting properties of Nitrogen-Vacancy centers. The
experiment is designed such that experimental work, e.g. aligning the micro-
scope, as well as understanding physical phenomena are balanced.
1

Contents
1 Introduction 3
2 The Confocal Microscope 4
3 The Nitrogen-Vacancy Center 5
4 Notes on Experimental Procedure 6
4.1 Safety and General Information . . . . . . . . . . . . . . . . . . . . . 6
4.2 Short Introduction to the Software . . . . . . . . . . . . . . . . . . . 8
4.2.1 GUI 1: Experiment Control . . . . . . . . . . . . . . . . . . . 10
4.2.2 GUI 2: Starting a Measurement . . . . . . . . . . . . . . . . . 11
4.2.3 GUIs 3 and 4: Plotting Data . . . . . . . . . . . . . . . . . . . 11
4.2.4 GUI 5: Saving and Commenting your Data . . . . . . . . . . . 11
4.3 Experimental Setup . . . . . . . . . . . . . . . . . . . . . . . . . . . . 12
4.3.1 Overview . . . . . . . . . . . . . . . . . . . . . . . . . . . . . 12
4.3.2 Fine alignment . . . . . . . . . . . . . . . . . . . . . . . . . . 13
5 Tasks and Data Analysis 17
5.1 Homework . . . . . . . . . . . . . . . . . . . . . . . . . . . . . . . . . 17
5.2 Fine Alignment of Confocal Microscope . . . . . . . . . . . . . . . . . 17
5.3 Calibration of Sample Stage . . . . . . . . . . . . . . . . . . . . . . . 18
5.4 In�uence of Pinhole on Resolution . . . . . . . . . . . . . . . . . . . . 19
5.5 Saturation Curves . . . . . . . . . . . . . . . . . . . . . . . . . . . . . 19
2
1 Introduction
The main goal of this experiment is to understand the basic working principle ofa confocal microscope. In addition we will use the confocal microscope to discoversome of the exciting properties of Nitrogen-Vacancy centers. The experiment isdesigned such that experimental work, e.g. aligning the microscope, as well asunderstanding physical phenomena are balanced.
The �rst two chapters this short manual give a short overview about the two keyingredients of this experiment, NV centers in diamond and the general structure of aconfocal microscope, respectively. Each chapter �nishes with several questions, thatare mandatory to answer before the experiment can be done. Some bibliographicalreferences are given as well, but students are encouraged to look for literature oftheir own choice.
The thirds chapter contains information about the experiment itself. Please read thispart of the manual very carefully. It contains safety information, a short introductionto the measurement software as well as a short description of the experimental setupitself.
The tasks of this experiment are given in chapter �ve. Please stick to the proposedorder and do not jump from one experiment to another.
3
2 The Confocal Microscope
In a conventional wide-�eld �uorescence microscope, light coming from a light sourceilluminates large areas of the specimen. Consequently, all parts of the specimenin the optical path are excited at the same time and the emitted �uorescence isdetected all at once. This approach gives an intense signal on the cost of a ratherhigh background signal and low spatial resolution.
In a confocal microscope only very small areas of the specimen are illuminated atthe same time, as an objective with a high numerical aperture is used, with lightcoming from a coherent light source. Additionally, a pinhole in front of the detectoreliminates signal coming from other regions in the sample than the region close tothe microscope's focal plane. Compared to conventional wide-�eld microscopy, con-focal imaging comes with higher lateral and axial resolution, but with lower signalintensities.
The experiment at hand uses a standard confocal microscope setup. Please an-swer the following questions carefully to make yourself comfortable with the generalstructure of a confocal microscope:
1. Explain the general structure of a confocal microscope on the basis of a suitableschematic. Draw the optical path and explain why a pinhole in front of thedetector signi�cantly increases resolution.
2. Compare the structure of a confocal microscope to the structure of a conven-tional wide-�eld microscope. What are the advantages and disadvantages ofthe two microscopes?
3. Derive equations for the lateral resolution ∆r‖ and the axial resolution ∆zof a confocal microscope. How can the resolution be improved? How wouldchanging the pinhole's diameter e�ect lateral and axial resolutions?
4. One way to determine the resolution of a confocal microscope is to measurethe width of the Gaussian beam after the objective. This can be done usingthe so-called knife edge method. Make yourself familiar with this methodand explain how you would extract information about the beam waist of theconfocal microscope.
References:
• http://www.olympusmicro.com/primer/techniques/confocal/index.html
• L. Novotny and B. Hecht, Principles of Nano-Optics: Second Edition, Cam-bridge University Press, 2012.
4
• M. Minsky, Memoir on Inventing the Confocal Scanning Microscope, Scanning10, 128 (1988).Go on Marvin Minsky's website to have access to the full text(http://web.media.mit.edu/ minsky/papers/ConfocalMemoir.html).
• http://massey.dur.ac.uk/resources/grad_skills/KnifeEdge.pdf
3 The Nitrogen-Vacancy Center
The Nitrogen-Vacancy (NV) center is a point lattice defect in diamond and hasattracted great interest within the last decades due to its long list of outstandingphysical properties. The NV center's electronic spin can for example be manipulatedcoherently using magnetic �elds. It is also worth noting that such experimentscan be performed at room temperature (as it is done here in this lab course) ascoherence times reach, even at such high temperatures, the ms range. Besides that,the NV center also serves as a single photon source and is thus suited for photonicexperiments.
For the experiment at hand, it is su�cient to understand how NV centers react onthe illumination with green light. Please go through the following questions andanswer them carefully:
1. Describe the structure of a NV center (use a schematic). Do they occur natu-rally or do NV centers need to be created?
2. As the NV center can be seen as a quasi atom, it can be assigned a groundstate and an excited state. Describe the electronic structure of a NV center(use a schematic of an NV−'s energy diagram).
3. How does a NV center react upon green light illumination?
4. In the context of the previous question, describe what a �uorescence map isand how it usually is recorded.
5. Make yourself familiar with the concept of a saturation curve. Why is thismeasurement performed and what characteristic parameters can be extracted?What function is used for �tting (see e.g. Riedel et al., Physical ReviewApplied 2, 064011 (2014)).
References:
• Rondin et al., Magnetometry with nitrogen-vacancy defects in diamond, Re-ports on Progress in Physics 77, 056503 (2014).
• Childress et al., Atom-like crystal defects: From quantum computers to biolog-ical sensors, Physics Today 67, 38-43 (2014).
• Riedel et al., Low-Loss Broadband Antenna for E�cient Photon Collectionfrom a Coherent Spin in Diamond, Physical Review Applied 2, 064011 (2014).
5
4 Notes on Experimental Procedure
4.1 Safety and General Information
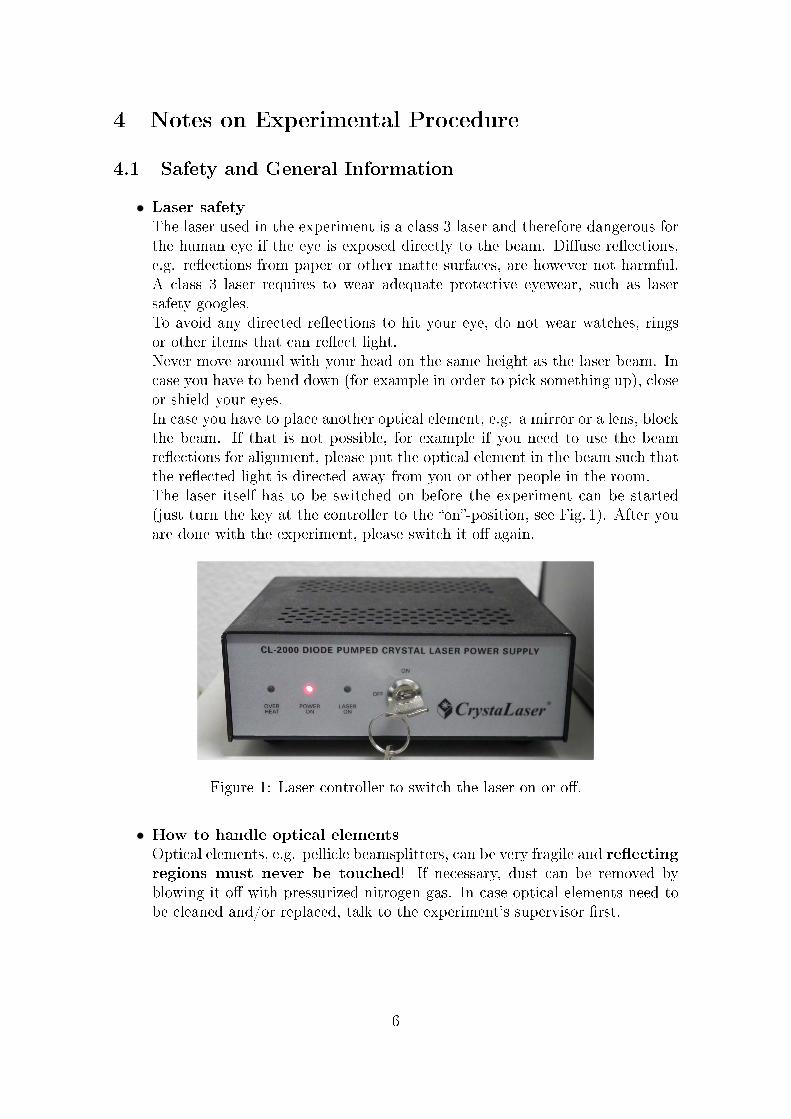
• Laser safetyThe laser used in the experiment is a class 3 laser and therefore dangerous forthe human eye if the eye is exposed directly to the beam. Di�use re�ections,e.g. re�ections from paper or other matte surfaces, are however not harmful.A class 3 laser requires to wear adequate protective eyewear, such as lasersafety googles.To avoid any directed re�ections to hit your eye, do not wear watches, ringsor other items that can re�ect light.Never move around with your head on the same height as the laser beam. Incase you have to bend down (for example in order to pick something up), closeor shield your eyes.In case you have to place another optical element, e.g. a mirror or a lens, blockthe beam. If that is not possible, for example if you need to use the beamre�ections for alignment, please put the optical element in the beam such thatthe re�ected light is directed away from you or other people in the room.The laser itself has to be switched on before the experiment can be started(just turn the key at the controller to the �on�-position, see Fig. 1). After youare done with the experiment, please switch it o� again.
Figure 1: Laser controller to switch the laser on or o�.
• How to handle optical elementsOptical elements, e.g. pellicle beamsplitters, can be very fragile and re�ectingregions must never be touched! If necessary, dust can be removed byblowing it o� with pressurized nitrogen gas. In case optical elements need tobe cleaned and/or replaced, talk to the experiment's supervisor �rst.
6
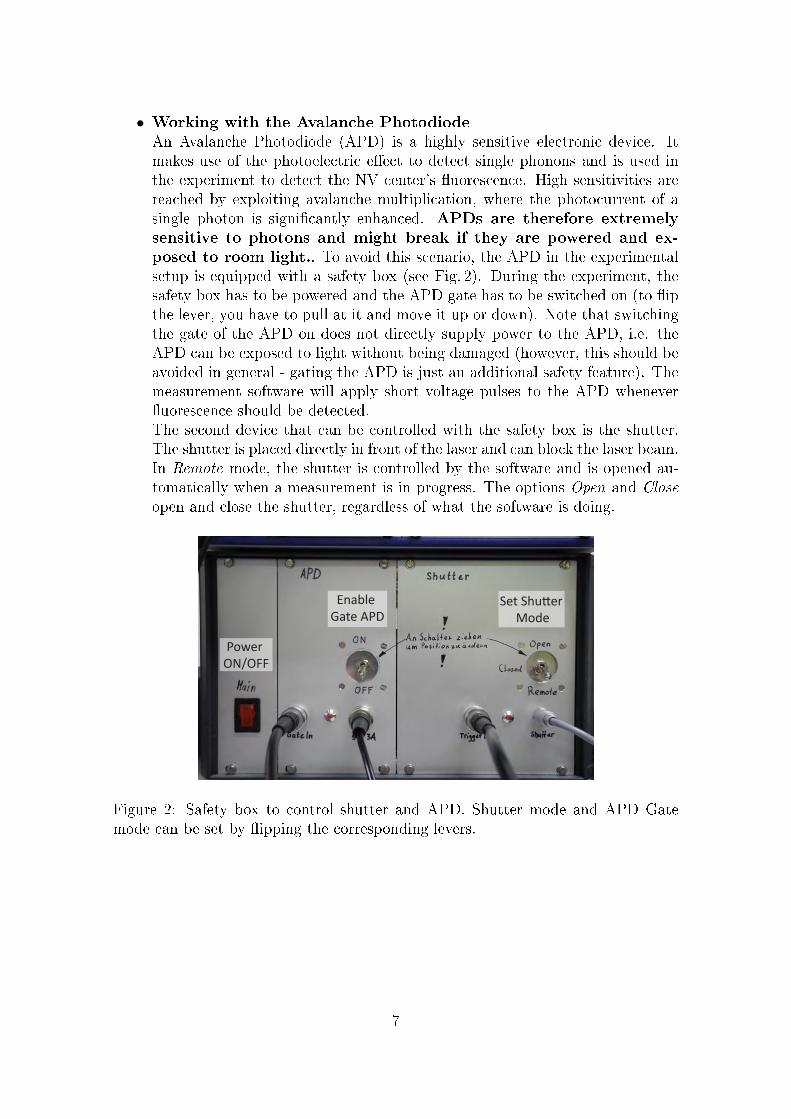
• Working with the Avalanche PhotodiodeAn Avalanche Photodiode (APD) is a highly sensitive electronic device. Itmakes use of the photoelectric e�ect to detect single phonons and is used inthe experiment to detect the NV center's �uorescence. High sensitivities arereached by exploiting avalanche multiplication, where the photocurrent of asingle photon is signi�cantly enhanced. APDs are therefore extremelysensitive to photons and might break if they are powered and ex-posed to room light.. To avoid this scenario, the APD in the experimentalsetup is equipped with a safety box (see Fig. 2). During the experiment, thesafety box has to be powered and the APD gate has to be switched on (to �ipthe lever, you have to pull at it and move it up or down). Note that switchingthe gate of the APD on does not directly supply power to the APD, i.e. theAPD can be exposed to light without being damaged (however, this should beavoided in general - gating the APD is just an additional safety feature). Themeasurement software will apply short voltage pulses to the APD whenever�uorescence should be detected.The second device that can be controlled with the safety box is the shutter.The shutter is placed directly in front of the laser and can block the laser beam.In Remote mode, the shutter is controlled by the software and is opened au-tomatically when a measurement is in progress. The options Open and Closeopen and close the shutter, regardless of what the software is doing.
Power ON/OFF
Enable Gate APD
Set Shutter Mode
Figure 2: Safety box to control shutter and APD. Shutter mode and APD Gatemode can be set by �ipping the corresponding levers.
7
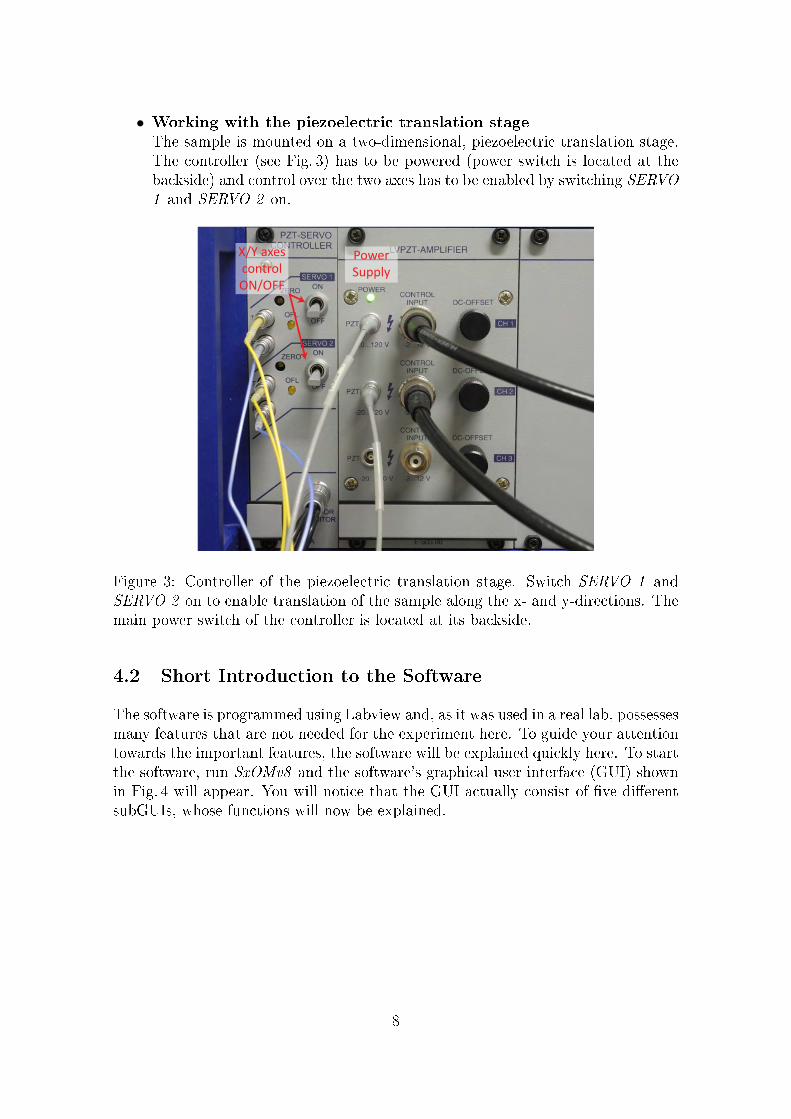
• Working with the piezoelectric translation stageThe sample is mounted on a two-dimensional, piezoelectric translation stage.The controller (see Fig. 3) has to be powered (power switch is located at thebackside) and control over the two axes has to be enabled by switching SERVO1 and SERVO 2 on.
X/Y axescontrolON/OFF
PowerSupply
Figure 3: Controller of the piezoelectric translation stage. Switch SERVO 1 andSERVO 2 on to enable translation of the sample along the x- and y-directions. Themain power switch of the controller is located at its backside.
4.2 Short Introduction to the Software
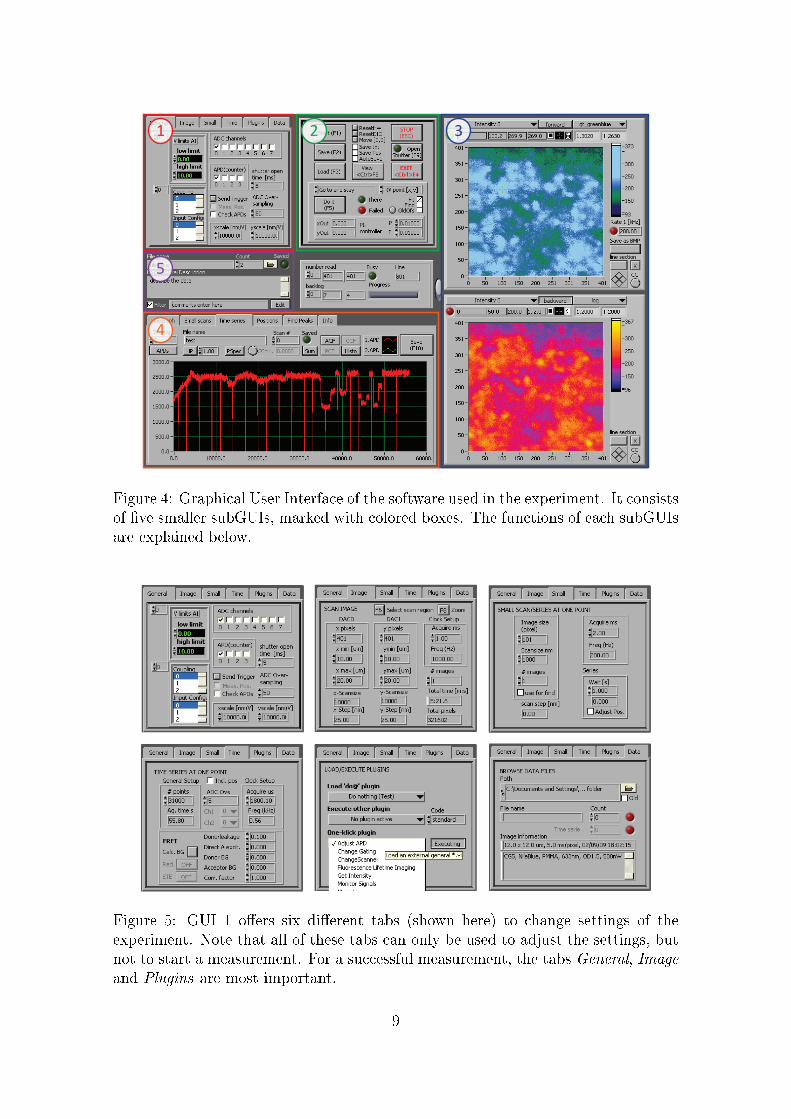
The software is programmed using Labview and, as it was used in a real lab, possessesmany features that are not needed for the experiment here. To guide your attentiontowards the important features, the software will be explained quickly here. To startthe software, run SxOMv8 and the software's graphical user interface (GUI) shownin Fig. 4 will appear. You will notice that the GUI actually consist of �ve di�erentsubGUIs, whose functions will now be explained.
8
1 2 3
4
5
Figure 4: Graphical User Interface of the software used in the experiment. It consistsof �ve smaller subGUIs, marked with colored boxes. The functions of each subGUIsare explained below.
Figure 5: GUI 1 o�ers six di�erent tabs (shown here) to change settings of theexperiment. Note that all of these tabs can only be used to adjust the settings, butnot to start a measurement. For a successful measurement, the tabs General, Imageand Plugins are most important.
9
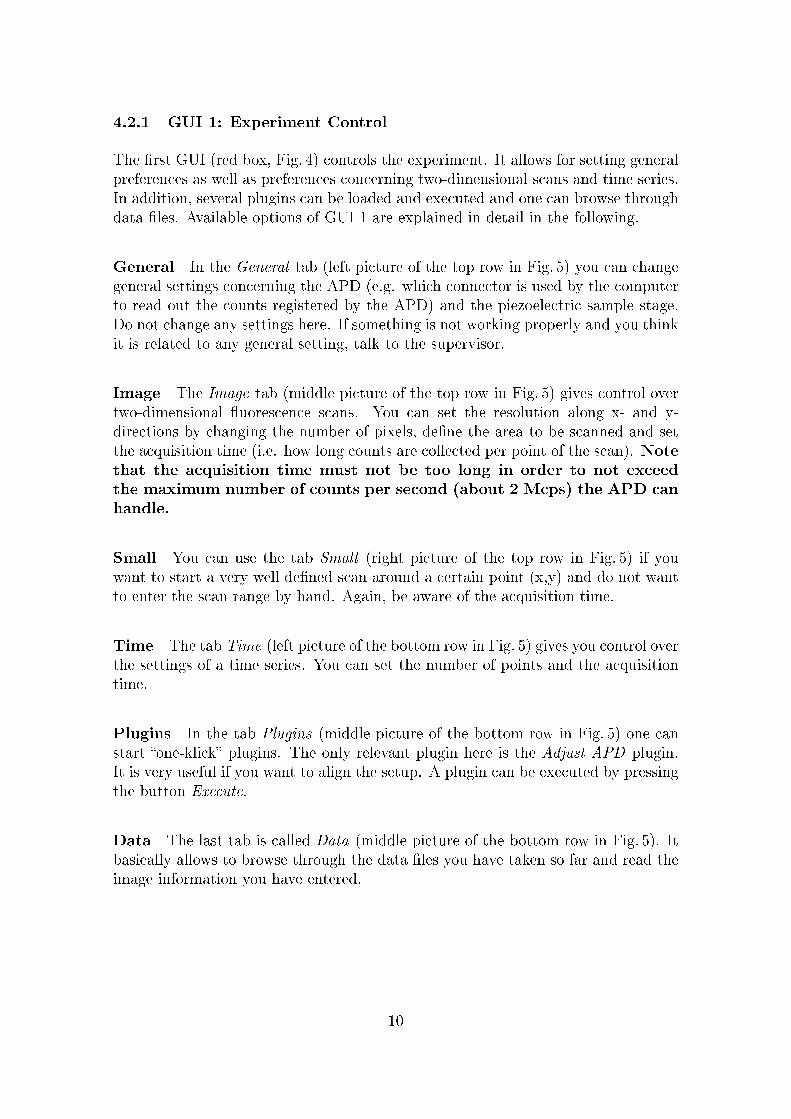
4.2.1 GUI 1: Experiment Control
The �rst GUI (red box, Fig. 4) controls the experiment. It allows for setting generalpreferences as well as preferences concerning two-dimensional scans and time series.In addition, several plugins can be loaded and executed and one can browse throughdata �les. Available options of GUI 1 are explained in detail in the following.
General In the General tab (left picture of the top row in Fig. 5) you can changegeneral settings concerning the APD (e.g. which connector is used by the computerto read out the counts registered by the APD) and the piezoelectric sample stage.Do not change any settings here. If something is not working properly and you thinkit is related to any general setting, talk to the supervisor.
Image The Image tab (middle picture of the top row in Fig. 5) gives control overtwo-dimensional �uorescence scans. You can set the resolution along x- and y-directions by changing the number of pixels, de�ne the area to be scanned and setthe acquisition time (i.e. how long counts are collected per point of the scan). Notethat the acquisition time must not be too long in order to not exceedthe maximum number of counts per second (about 2 Mcps) the APD canhandle.
Small You can use the tab Small (right picture of the top row in Fig. 5) if youwant to start a very well de�ned scan around a certain point (x,y) and do not wantto enter the scan range by hand. Again, be aware of the acquisition time.
Time The tab Time (left picture of the bottom row in Fig. 5) gives you control overthe settings of a time series. You can set the number of points and the acquisitiontime.
Plugins In the tab Plugins (middle picture of the bottom row in Fig. 5) one canstart �one-klick� plugins. The only relevant plugin here is the Adjust APD plugin.It is very useful if you want to align the setup. A plugin can be executed by pressingthe button Execute.
Data The last tab is called Data (middle picture of the bottom row in Fig. 5). Itbasically allows to browse through the data �les you have taken so far and read theimage information you have entered.
10
4.2.2 GUI 2: Starting a Measurement
While the �rst subGUI can only change measurement settings, the second subGUI(green box in Fig. 4) is used to start measurements. Note that GUI 2 is divided intotwo parts. Its upper half deals with two-dimensional scans only and thus requirescorrect settings made in the tab Image of GUI 1. In contrast to the upper half, thelower half deals with all other measurements for which you can change settings inthe GUI 1 (i.e. small scans and time traces, see description above). You can choosewhich experiment you want to perform and where you want to perform it by selectingthe corresponding entry of the two drop-down menus. The other buttons are labeledin a self-explanatory way. Please do not forget to check the buttons Save
txt and Save pos, as this saves both the position and the correspondingcounts of your �uorescence in a text-�le.
4.2.3 GUIs 3 and 4: Plotting Data
As explained above, GUI 1 sets up the measurement and GUI 2 is used to start thedesired experiment. The corresponding data is shown in GUI 3 (two-dimensionalscans; blue box in Fig. 4) and GUI 4 (all other experiments; orange box in Fig. 4).GUI 3 is again divided into two plots, with the upper (lower) showing the signal of theforward (backward) scan. Again, buttons are labeled according to their functions.A handy tool is the cursor. You can position it by entering the desired coordinates(in pixels) in the second and third �eld from the left, right below the drop-downmenu where the plotted signal is chosen. Another way to set the cursor is by justusing the mouse and drag the cursor to its �nal position. Being able to move thecursor around is quite useful for alignment. You can, by using the Go to and staycommand, move the focus of the confocal microscope to a certain position and staythere. Besides that, GUI 4 has several tabs that are used to plot the signal acquiredduring small scans and time series.
4.2.4 GUI 5: Saving and Commenting your Data
The last subGUI is GUI 5 (purple box in Fig. 4). Is is used to change the names ofthe saved data sets and also allows for commenting what the data actually includes.Make use of this opportunity as it helps a lot during data analysis. You can set thepath where your data �les are saved to by click on the folder icon.
11
4.3 Experimental Setup
4.3.1 Overview
Sideview objective
telescope “green”
telescope “red”+ pinhole
lense + filter
dichroic mirror
sample on xy-stage
objective on z-stage
mirror for fine alignment
APD
laser shutter and density filters
controller fine alignment
(objective and APD)
red alignment laser
50/50beam splitter
x
y
z
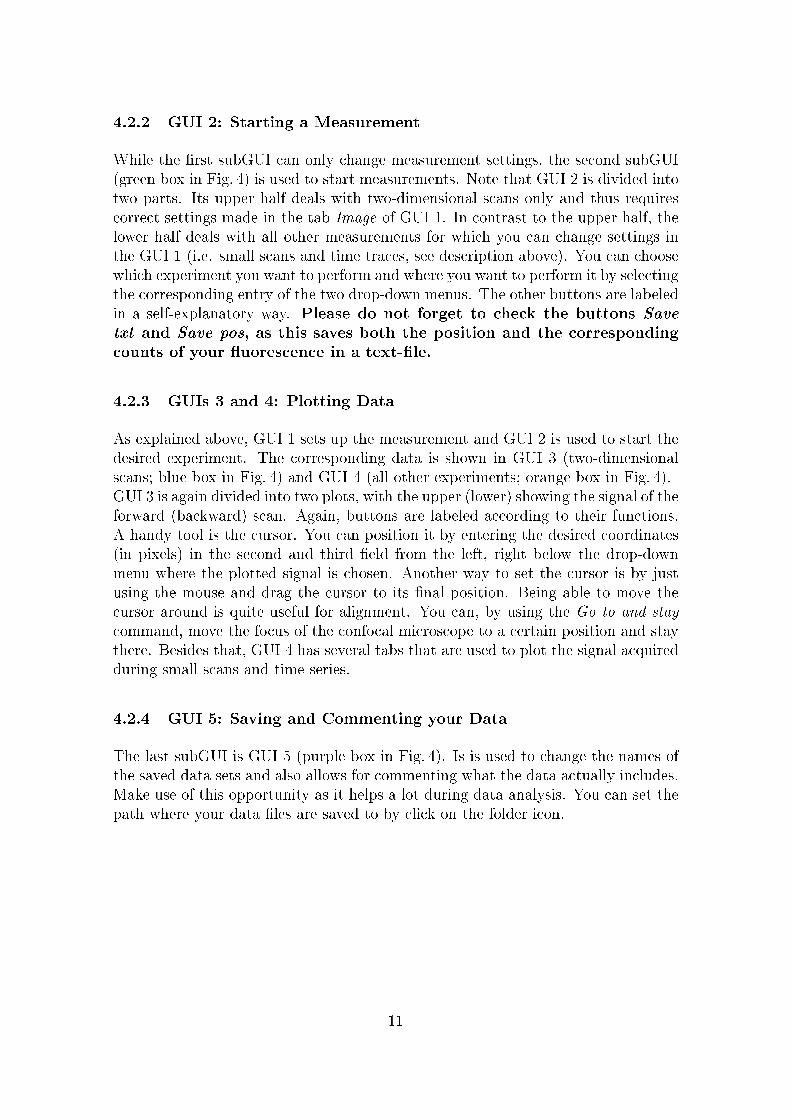
Figure 6: Topview of the experimental setup. The green light (dashed green line)passes a telescope and is than guided to an oil-immersion objective (see inset), whichfocuses it onto the diamond sample. The NV center's red emission (dashed red line)is collected by the same objective, passes a second telescope with a pinhole and is�nally focused onto a photodetector.
Fig. 6 shows an overview of the experimental setup. The setup mainly consists ofa standard confocal microscope with a green excitation arm and a red detectionarm. Before the green light (dashed green line) is focused onto the sample by anoil-immersion objective, it passes a shutter, several density �lters as well as a tele-scope. The NV center's red emission (dashed red line) is collected by the sameoil-immersion objective and, after passing a second telescope with a pinhole of �xedsize (the pinhole can be changed), is focused onto an APD.Several parts of the experiment are mounted on translation stages for better exper-imental control. The sample is mounted on a xy-translation stage, such that onecan scan over a large sample area. The oil-immersion objective sits on a motorizedz-translation stage to ensure that single NV centers can be positioned in the con-focal microscope's focus. Finally, the APD is attached to a xyz-stage, where the
12
x- and y-directions (z-direction) are (is) controlled by motorized adjusting screws(a manual adjusting screw) to maximize the detected signal. Both, the objective'sz-stage as well as the APD's xy-stage have to be controlled by using an externalcontroller with a joystick (see explanation below). The xy-stage, where the sampleis mounted on, is controlled by the measurement software.Another detail to mention is the red alignment laser. It can be coupled into theoptical path of the confocal microscope by �ipping up the 50/50 beamsplitter. Thealignment laser is useful if you are adding a pinhole to the setup and want to doa rough alignment step (see below). Note however that, if you are using thealignment laser, you need to shield the APD from the rest of the setup.Otherwise the red laser will also illuminate the chip of the APD and thiscan damage it, even if the APD is not powered.
4.3.2 Fine alignment
The setup is aligned to a degree where only �ne adjustments are necessary forsu�cient measurement quality. There are in total four elements that need to beoptimized to receive su�cient spatial resolution as well as an optimized count rateat the APD. A description of the four elements and the corresponding alignmentprocedure is given below. To align the setup, it is most convenient to use the AdjustAPD plugin (see section 4.2). Please note that the subsequently explained alignmentprocedures have to be iterated several times to ensure proper alignment.
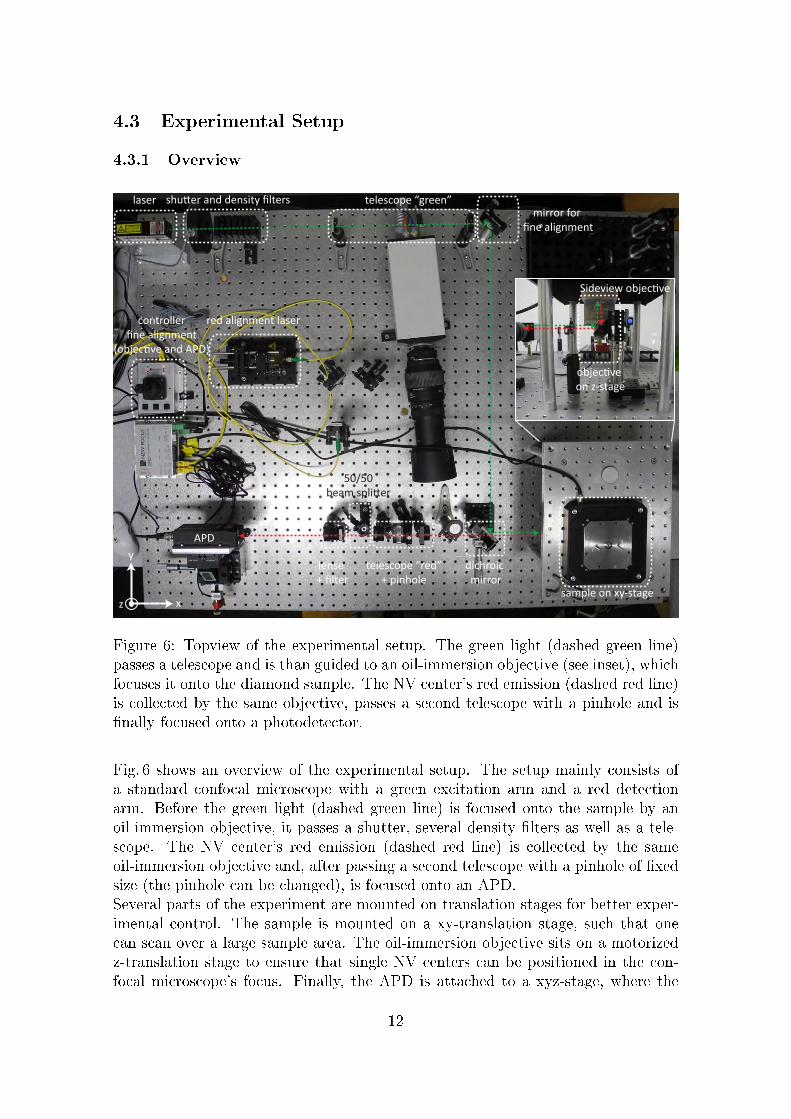
mirror for fine adjustment
Figure 7: Left: During rough alignment, the green beam is positioned on top ofthe red beam. Right: Please use this mirror only for �ne adjustment of the beams'overlap.
13

Motor X axis Y axis
A APD(y axis) APD(z axis)
B APD(y axis) not used
C Objective(z axis) APD(y axis)
Table 1: Assignment of motorized adjusting screws to controller motors. Use motorA to control the adjusting screws attached to the APD and motor C to position theobjective.
Overlap detection and excitation arm A confocal microscope works properlyif the focus of the green excitation arm coincides with the focus of the red detectionarm. During the rough alignment of the setup this is ensured by positioning thegreen beam on top of the red beam. For the �nal measurement this procedure ishowever not precise enough. Once a diamond sample is mounted and the setup isroughly aligned, one needs to optimize the overlap of both arms by changing thepath of the green arm slightly and maximize the count rate of the detected red�uorescence. To change the green beam's position, please use the designated mirroronly (mirror for �ne alignment, Fig. 6).
Position of NV center After maximizing the overlab of both arms, one alsoneeds to position the NV center of interest in the focus of the confocal microscope.For this, choose an appropriate position in x and y (use the software's Go to andstay command) and change the z-position of the oil-immersion objective. This canbe done with the controller that controls the motorized adjusting screws (see Fig. 6,controller �ne alignment). The joystick can be moved along two axes, where eachaxes controls one adjusting screw. Hence, only two screws can be controlled at thesame time. Therefore, as we have three motorized screws, one needs to choose theMotor that is used to drive the intended screws - see Tab. 1 for more information.
14
+x
+y
-x
-y
a LED indicates which motor is
used
press to select motor
A,B or C
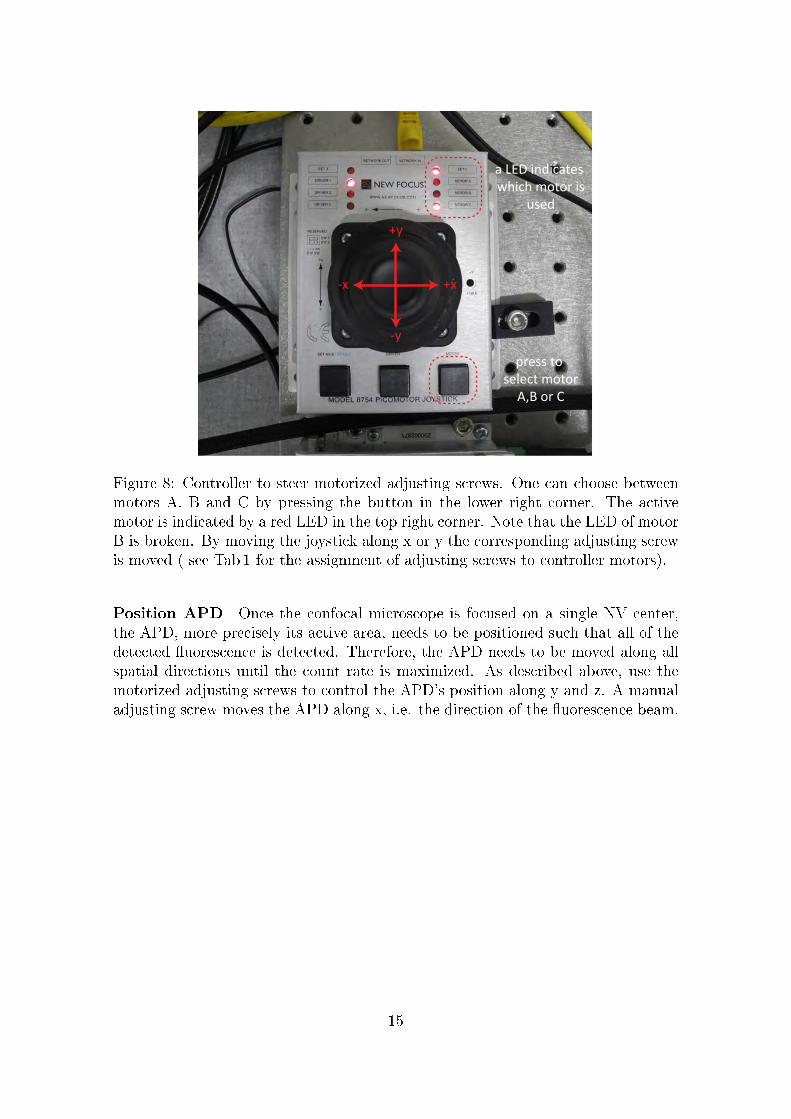
Figure 8: Controller to steer motorized adjusting screws. One can choose betweenmotors A, B and C by pressing the button in the lower right corner. The activemotor is indicated by a red LED in the top right corner. Note that the LED of motorB is broken. By moving the joystick along x or y the corresponding adjusting screwis moved ( see Tab 1 for the assignment of adjusting screws to controller motors).
Position APD Once the confocal microscope is focused on a single NV center,the APD, more precisely its active area, needs to be positioned such that all of thedetected �uorescence is detected. Therefore, the APD needs to be moved along allspatial directions until the count rate is maximized. As described above, use themotorized adjusting screws to control the APD's position along y and z. A manualadjusting screw moves the APD along x, i.e. the direction of the �uorescence beam.
15
pinholeadjusting
screws
x
y-screw
z-screw
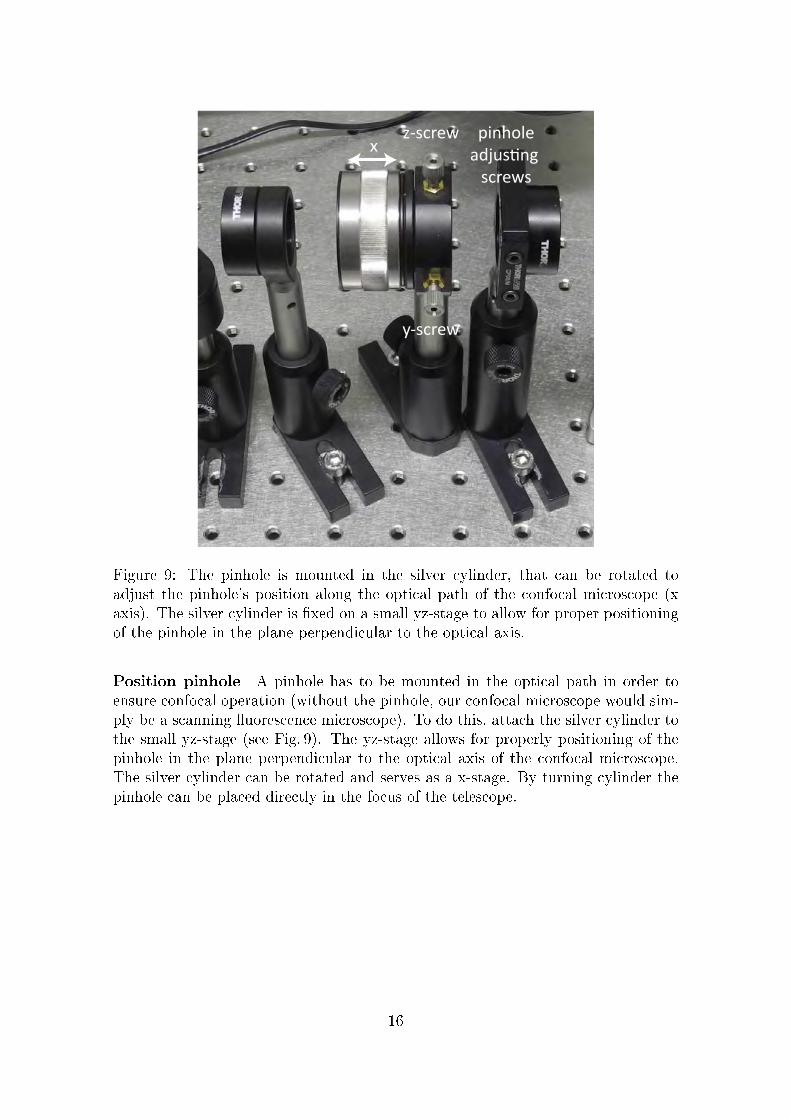
Figure 9: The pinhole is mounted in the silver cylinder, that can be rotated toadjust the pinhole's position along the optical path of the confocal microscope (xaxis). The silver cylinder is �xed on a small yz-stage to allow for proper positioningof the pinhole in the plane perpendicular to the optical axis.
Position pinhole A pinhole has to be mounted in the optical path in order toensure confocal operation (without the pinhole, our confocal microscope would sim-ply be a scanning �uorescence microscope). To do this, attach the silver cylinder tothe small yz-stage (see Fig. 9). The yz-stage allows for properly positioning of thepinhole in the plane perpendicular to the optical axis of the confocal microscope.The silver cylinder can be rotated and serves as a x-stage. By turning cylinder thepinhole can be placed directly in the focus of the telescope.
16
5 Tasks and Data Analysis
The goal of this experiment is to understand the basic principles of a confocalmicroscope and to use it to examine optical properties of Nitrogen-Vacancy (NV)centers.
5.1 Homework
To be able to understand the following it is essential to be able to answer the ques-tions regarding theoretic principles of confocal microscopy (see chapter 2) and NVcenters (see chapter 3).
From the experimental point of view, make yourself accustomed with the experi-mental setup and how it works. For this read section 4.3 carefully and answer thefollowing questions:
• Compare the standard structure of a confocal microscope to the experimentalsetup and identify similarities and di�erences.
• Explain the purpose of the two telescopes (labeled with green telescope andred telescope in Fig. 6).
• Fig. 6 shows that a �lter is mounted on the lense that is used to focus the redlight onto the APD. Can you think of any reason that motivates the existenceof this �lter?
5.2 Fine Alignment of Confocal Microscope
The setup is roughly aligned but the alignment needs to be improved for the follow-ing measurements. Fine alignment of the setup is achieved by performing the fouralignment procedures (see section 4.3) while looking at the red �uorescence of singleNV centers. Once the setup is aligned well, one can clearly distinguish betweensingle NV centers.Mount Sample A (a polycrystalline piece of diamond glued on a glass slide) on thexy-translation sample stage and �x it there by placing the two permanent magnetson top of the glass slide. Make sure there is no pinhole mounted in the red telescope,as this would make �ne alignment unnecessarily complicated. Switch on the greenlaser, enable APD gating and align the setup by maximizing the detected count rate.
Hints
• Use the Align APD plugin of the software.
17
• As already stated, the four alignment steps need to be repeated in an alternatedway. In the beginning, it is very likely that you will measure a rather weaksignal. This might be caused by bad alignment or simply because you aremeasuring sample background. It is therefore advisable to perform a two-dimensional �uorescence scan to check whether you are focused on a singleNV center or not.
• The room light needs to be switched o� whenever you are measuring to protectthe APD from any damage.
5.3 Calibration of Sample Stage
A major goal of this experiment is to characterize the in�uence of a pinhole on thespatial resolution of a confocal microscope (see section 5.4). Analyzing spatial res-olution quantitatively however requires detailed knowledge about the piezoelectrictranslation stage where the sample is mounted on. More precisely, we need to knowthe �gure of merit nm/V, i.e. what distance the piezoelectric stage travels when aspeci�c bias signal is applied. Sample stage calibration is done by using Sample B,which consists of a patterned palladium (Pd) layer on a thin layer of silicon dioxide(SiO2). The dimensions of the Pd structures are known (see Fig. XXX). Under illu-mination with green light, Pd will appear bright in the confocal microscope whereasthe (SiO2) remains dark. This contrast in intensity can be used to determine a valuefor nm/V.
Problem 1:Mount Sample B and bring it into the focus of the confocal microscope (for exampleby using the Align APD plugin of the software). Try to �nd an area on the samplewhere you observe a pattern that looks like a chessboard. To determine the �gureof merit nm/V, record �uorescence scans for 5000nm/V, 7500nm/V, 10000nm/V,15000nm/V and 20000nm/V (the value for nm/V can be set in GUI 1, see Fig. 5).Each square of the pattern is 4µm by 4µm large. Determine a correct value fornm/V and explain your approach.
Problem 2:So far, you have been working with a confocal setup where the APD's chip servedas the pinhole (the size of the chip is about 180µm). The setup however also givesyou the opportunity to use smaller pinholes. What do you expect to see in yourexperiment in terms of spatial resolution when using smaller pinholes? Compare �u-orescence scans taken with pinhole sizes of 100µm, 50µm and 25µm and describeyour observation.
18

Problem 3:Compare the experiment you have done to the knife-edge approach, which is used todetermine the waist of a Gaussian beam. Are there similarities? Use the knife-edgeapproach to determine the beam waist of the confocal microscope and explain yourapproach. Compare the beam waist for di�erent pinhole sizes.
NoteA pinhole needs to be positioned in the beam rather precisely such that you candetect some signal. Whenever you add a pinhole to the setup or want to change it,you should start with a rough alignment, where you employ the red alignment laserand the beam splitter on the left of the red telescope. The red alignment laser willbe sent backwards through the pinhole and the goal of the rough alignment proce-dure is to maximize its transmission. The transmission can be quanti�ed by usinga power meter. As explained above, you have to shield the APD from thered alignment laser, i.e. by blocking the optical path towards the APD.Once the transmission is maximized, you can continue with optimizing the countscoming from a single NV center (this time of course without the red alignment laserand without the beam splitter in the optical path).
5.4 In�uence of Pinhole on Resolution
The spatial resolution of a confocal microscope strongly depends on the size of itspinhole, as already observed in the previous experiment. Perform a two-dimensionalscan of a single NV center without a pinhole and for pinholes of size 100µm, 50µmand 25µm. Determine the spatial resolution of the confocal microscope by �ttingthe �uorescence scan data. Compare your �ndings and explain what you observe.
5.5 Saturation Curves
The optical properties of NV centers can be characterized in di�erent ways. One ofthe easier ways is to perform so-called saturation curves, where one can extract thesaturation count rate of NV centers, the corresponding saturation power of greenexcitation as well as the strength of background �uorescence. During a saturationcurve measurement, the excitation power, i.e. the power of the green laser, is de- orincreased and the change of �uorescence counts is monitored. Perform this experi-ment for at least two di�erent pinhole sizes on two di�erent NV centers.Extract the relevant parameters by �tting the taken data and compare the result-ing curves. Can you observe signi�cant di�erences? Explain where these di�er-ences come from. Which power would you choose if you wanted to perform a g(2)-measurement, where you want to detect single photon counting events and have anoptimal signal-to-background ration?
19

NoteUse a power meter to determine the power of green excitation (the power shouldbe measured after the dichroic mirror, i.e. right before the oil-immersion objective).The density �lters can be �ipped in and out of the green path. In addition, a density�lter wheel allows for �ner adjustment of excitation power.
20