Embed Size (px)
Citation preview

1
Supporting information
Fluorescence Imaging Lysosome Changes During Cell Division
and Apoptosis with a Nile Blue Based Near-infrared Emission
Jiangli Fan*a, Huijuan Dong
a, Mingming Hu
a, Jingyun Wang
b, Hua Zhang
a, Hao Zhu
a, Wen
Suna, Xiaojun Peng*
a
a State Key Laboratory of Fine Chemicals, Dalian University of Technology, No. 2 Linggong Road, High-tech District,
Dalian 116024, China. Fax: +86 411 84986306; Tel: +86 411 84986327; E-mail: [email protected],
[email protected]. b Department School of Life Science and Biotechnology, Dalian University of Technology, Dalian, China.
Content
Materials and methods.. ..................................................................................................................S2
Synthesis.. .......................................................................................................................................S2
Cell incubation.. ..............................................................................................................................S3
Determination of quantum yields.. ..................................................................................................S3
Lysosome staining in live cells .. ....................................................................................................S4
Cytotoxicity experiments .. .............................................................................................................S4
Photodegradation Experiments .. ....................................................................................................S4
Temporal tracking of lysosome morphology of apoptotic Hela cells .. ...........................................S5
Live cell division.. ...........................................................................................................................S5
Fig. S1 Absorbance and emission spectra of NBM .. .....................................................................S5
Table S1 Photophysical properties of NBM in various solvents.. ...................................................S5
Table S2 Fluorescence intensity of NBM at room temperature……………………………….… S6
Fig. S2 The ionic interference experiment………………………………………………………..S7
Fig. S3 The fluorescence image of NSCs cell staining with NBM .................................................S7
Fig. S4, S5 Photostability in solution and cell ................................................................................S8
Fig. S6 Cytotoxicity by MTT method .............................................................................................S9
Fig. S7 The fluorescence image of MCF-7, Hela and HepG-2 cells stained with NBM ................S9
Fig. S8 Top mass of compound 1 .................................................................................................. S10
Fig. S9 1H-NMR of compound 1 .................................................................................................. S10
Fig. S10 Top mass of NBM .......................................................................................................... S11
Fig. S11 1H-NMR of NBM ........................................................................................................... S11
Fig. S12 13
C-NMR of NBM .......................................................................................................... S12
Electronic Supplementary Material (ESI) for Chemical CommunicationsThis journal is © The Royal Society of Chemistry 2013
2
Materials and methods
All of the solvents used were of analytic grade. NBM was dissolved in dimethyl sulphoxide (DMSO)
to produce 5 mM stock solutions. Aliquots were then diluted to 1 µM with a Britton-Robinson buffer
solution containing 40 mM acetic acid, phosphoric acid, and boric acid. Slight variations in the pH of
the solutions were achieved by adding minimal volumes of NaOH or HCl. 1H-NMR and
13C-NMR
spectra were recorded on a VARIAN INOVA-400 spectrometer. Chemical shifts (δ) were reported as
ppm (in CDCl3 or CD3SOCD3), with TMS as the internal standard). Mass spectrometric (MS) data
were obtained with HP1100LC/MSD MS and an LC/Q-TOF-MS instruments. Fluorescence
measurements were performed on a VAEIAN CARY Eclipse fluorescence spectrophotometer (Serial
No. FL0812-M018). Excitation and emission slit widths were modified to adjust the fluorescence
intensity to a suitable range. Absorption spectra were measured on a Perkin Elmer Lambda 35
UV/VIS spectrophotometer. All pH measurements were performed using a Model PHS-3C meter
calibrated at room temperature (23 ± 2oC) with standard buffers of pH 9.18 and 6.86.
Synthesis
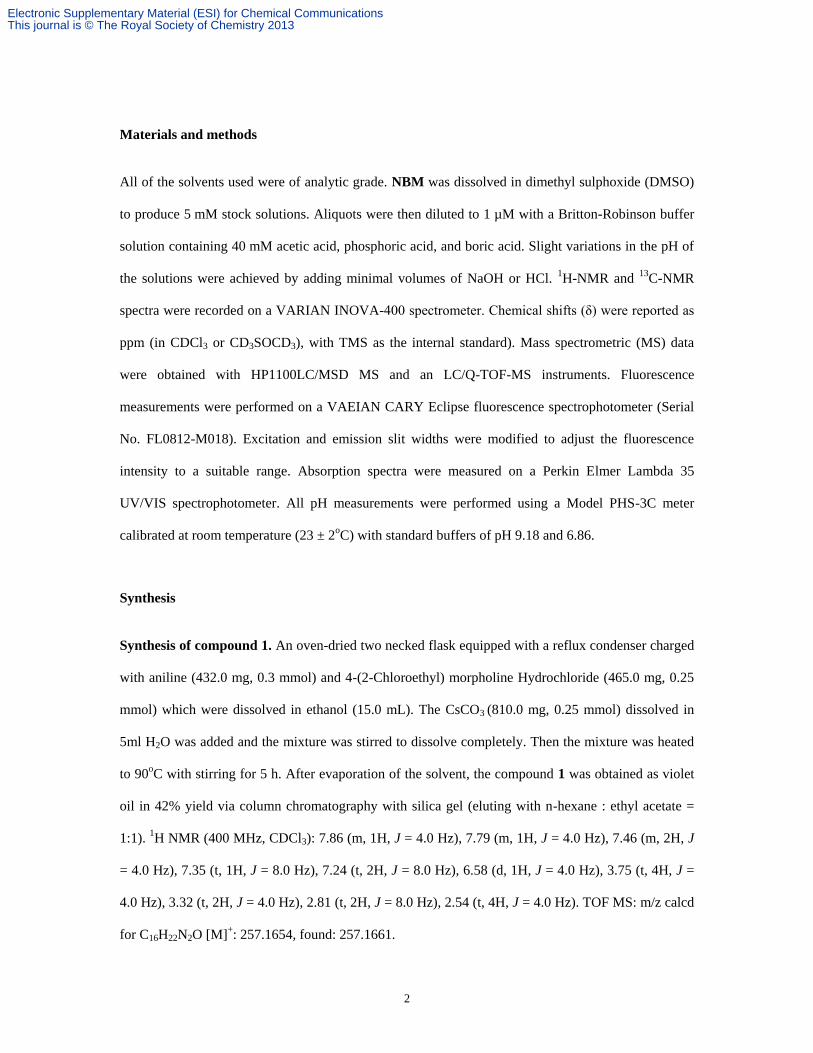
Synthesis of compound 1. An oven-dried two necked flask equipped with a reflux condenser charged
with aniline (432.0 mg, 0.3 mmol) and 4-(2-Chloroethyl) morpholine Hydrochloride (465.0 mg, 0.25
mmol) which were dissolved in ethanol (15.0 mL). The CsCO3 (810.0 mg, 0.25 mmol) dissolved in
5ml H2O was added and the mixture was stirred to dissolve completely. Then the mixture was heated
to 90oC with stirring for 5 h. After evaporation of the solvent, the compound 1 was obtained as violet
oil in 42% yield via column chromatography with silica gel (eluting with n-hexane : ethyl acetate =
1:1). 1H NMR (400 MHz, CDCl3): 7.86 (m, 1H, J = 4.0 Hz), 7.79 (m, 1H, J = 4.0 Hz), 7.46 (m, 2H, J
= 4.0 Hz), 7.35 (t, 1H, J = 8.0 Hz), 7.24 (t, 2H, J = 8.0 Hz), 6.58 (d, 1H, J = 4.0 Hz), 3.75 (t, 4H, J =
4.0 Hz), 3.32 (t, 2H, J = 4.0 Hz), 2.81 (t, 2H, J = 8.0 Hz), 2.54 (t, 4H, J = 4.0 Hz). TOF MS: m/z calcd
for C16H22N2O [M]+: 257.1654, found: 257.1661.
Electronic Supplementary Material (ESI) for Chemical CommunicationsThis journal is © The Royal Society of Chemistry 2013

3
Preparation of NBM: Ice bath, 5-(dimethylamino)-2-nitrosophenol (270.4 mg; 1.05 mmol) in ethanol
(5.0 mL), compound 1 (199.0 mg; 1.20 mmol) were mixed, and concentrated hydrochloride acid (1.0
mL) were added. Then the mixture was vacuum filtered and the filtrate was refluxed for 4.5 h and
monitored by TLC (CH2Cl2: CH3OH = 10:1). The solid was obtained by recrystalization with ethanol.
Then, the green solid was dried under vacuum (224.4 mg, 53%) with metallic luster was obtained. 1H
NMR (400 MHz, CD3OD), δ: 3.33 (m, 8H, J = 4 Hz), 3.63(s, 3H), 4.01 (s, 5H), 4.23 (d, 2H, J = 4 Hz),
7.00 (d, 1H, J = 4 Hz), 7.18 (s, 1H), 7.41 (d, 1H, J = 8Hz), 7.87 (m, 1H), 7.96 (t, 2H, J = 8Hz), 8.54 (d,
1H, J = 8Hz), 8.97 (d, 1H, J = 8Hz); 13
C NMR (100 MHz, CD3OD), δ: 38.11, 39.98, 52.27, 54.59,
63.65, 93.25, 95.75, 116.66, 123.02, 123.30, 124.15, 129.46, 131.29, 131.64, 132.00, 132.91, 133.13,
148.55, 151.92, 156.80, 157.58ppm; TOF MS: m/z calcd for C24H27N4O2+ [M]
+: 403.2134, found:
403.2143.
Cell incubation: The mammalian cells MCF-7, Hela, and Raw 264.7 were cultured in Dulbecco’s
modified Eagle’s medium (DMEM, Invitrogen) supplemented with 10% fetal bovine serum
(Invitrogen). The cells were seeded in 24-well flat-bottomed plates and then incubated for 24 h at
37oC under 5% CO2. NBM (50 nM) was then added to the cells and incubated for another 30 min
followed. The cells were washed three times with phosphate-buffered saline (PBS). Fluorescence
imaging was performed using an OLYMPUS FV-1000 inverted fluorescence microscope with a
100×objective lens.
Determination of quantum yields: The fluorescence quantum yield of NBM was determined
according to the method below.
))()()((
))()()()((2
2
sexuus
uexssusu
AFA
AFA
Where φ is fluorescence quantum yield; FA is integrated area under the corrected emission
spectra; A is the absorbance at the excitation wavelength; λex is the excitation wavelength; η is the
refractive index of the solution; the subscripts u and s refer to the unknown and the standard,
respectively. We chose fluorescein as standard, which has the fluorescence quantum yield of 0.98 in
water.
Electronic Supplementary Material (ESI) for Chemical CommunicationsThis journal is © The Royal Society of Chemistry 2013

4
Lysosome staining in live cells: LysoSensorTM Green DND-189 (1 µM, Invitrogen) was used to
co-stain the cells.
Cytotoxicity experiments: Cell viability measurements were performed by reducing
3-(4,5-dimethylthiahiazol-2-y1)- 2,5-diphenytetrazolium bromide (MTT) to formazan crystals using
mitochondrial dehydrogenases (Mosmann, 1983). Briefly, MCF-7, Hela and Hepatic cells were seeded
in 96-well microplates (Nunc, Denmark) at a density of 1×10⁵ cells/mL in 100 µL of medium
containing 10% FBS. After 24 h of cell attachment, the plates were washed with 100 µL/well PBS.
The cells were then cultured in a medium with 0.5 μM, 1.0 μM and 2.0 μM NBM for 12 h. Cells in a
culture medium without fluorescent dyes were used as the control. Six replicate wells were used for
each control and test concentration. MTT (10 µL, 5 mg/mL) in PBS was subsequently added to each
well. The plates were then incubated at 37°C for 4 h in a 5% CO2 humidified incubator. The medium
was carefully removed, and the purple products were lysed in 200 µL DMSO. The plate was shaken
for 10 min, and the absorbance was measured at 405 and 488 nm using a microplate reader (Thermo
Fisher Scientific). Cell viability was expressed as a percentage of the control culture value.
Photodegradation Experiments
In vitro: The photodegradation experiments were performed by placing the sample solutions in square
quartz cells (l × 1 cm2) and then irradiating the samples with a 500 W I–W lamp at room temperature.
To eliminate heat and the absorbance of short-wavelength light, a cold trap [2 L solution of 50 g/L
NaNO2 in 22 cm (height) × 7 cm (width) × 22 cm (length)] was set up between the cells and the lamp.
The distance between the cells and the lamp was 30 cm. The irreversible bleaching of the dyes at the
emission peak was monitored as a function of time. All samples were tightly sealed and not
deoxygenated with nitrogen prior to the test to simulate the actual conditions during practical
applications (unless specified otherwise).
In vivo: Hela cells were incubated with NBM (2 µM) via the procedure described in the preceding
section. The cells were then washed three times with PBS, exposed to laser illumination
(λex = 635 nm), and then imaged for 1800 sec. Data were obtained from eight real-time image areas;
the values observed in each case were averaged.
Electronic Supplementary Material (ESI) for Chemical CommunicationsThis journal is © The Royal Society of Chemistry 2013

5
Temporal tracking of lysosome morphology of apoptotic Hela cells: Hela cells were prestained
with NBM using the procedure described for lysosome staining. The cells were treated with 10 ng
mL�1 of TNF-a to induce autophagy. The cells were then analyzed with confocal fluorescence
microscope for 60 min.
Live cell division: Hepatic cells was cultured for 3 days in phenol-red free Dulbecco’s Modified
Eagle’s Medium (DMEM, WelGene) supplemented with penicillin/streptomycin and 10% fetal bovine
serum (FBS; Gibco) in a CO2 incubator at 37 °C. One day before imaging, cells were seeded in glass
bottom dish (MatTek, 35mm dish with 20 mm bottom well). The next day the live cells were
incubated with 1.0 μM NBM and 5.0 μM Hoechest 33258 for 30 min at 37 °C under 5% CO2 and then
added 100 μM 6-benzylamino adenine for 150 min at 37 °C under 5% CO2. After, they were washed
with phosphate-buffered saline (PBS) three times.
Fig. S1 Normalized absorbance and emission spectra of NBM (5 μM) in different solutions.
Table S1 Photophysical properties of NBM in various solvents.
Test System λabs[a]
λem[b]
Stokes shift ΦF[d]
εmax(M-1.cm-1)[c
]
H2O 638 nm 678 nm 40 nm 0.10 2.7×10⁴
CH3OH 629 nm 669 nm 40 nm 0.08 5.5×10⁴
acetonitrile 626 nm 668 nm 42 nm 0.42 6.2×10⁴
1,4-dioxane 624 nm 666 nm 42 nm 0.35 2.9×10⁴
Electronic Supplementary Material (ESI) for Chemical CommunicationsThis journal is © The Royal Society of Chemistry 2013
6
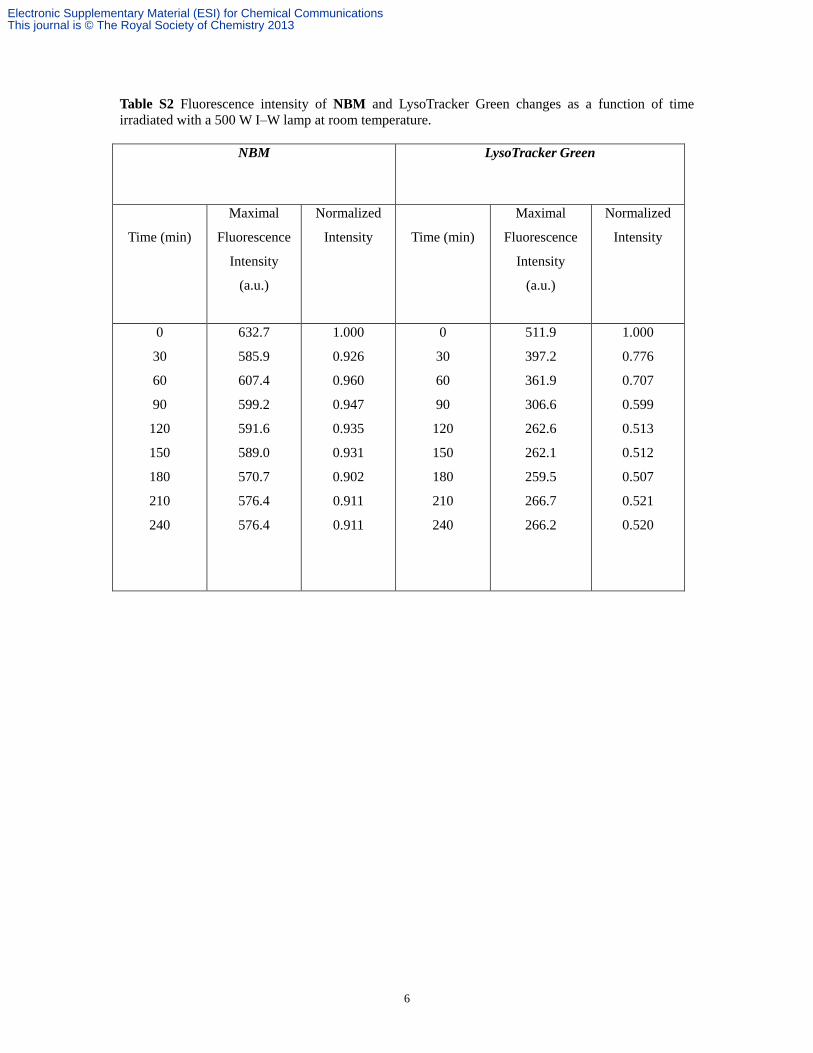
Table S2 Fluorescence intensity of NBM and LysoTracker Green changes as a function of time
irradiated with a 500 W I–W lamp at room temperature.
NBM
LysoTracker Green
Time (min)
Maximal
Fluorescence
Intensity
(a.u.)
Normalized
Intensity
Time (min)
Maximal
Fluorescence
Intensity
(a.u.)
Normalized
Intensity
0
30
60
90
120
150
180
210
240
632.7
585.9
607.4
599.2
591.6
589.0
570.7
576.4
576.4
1.000
0.926
0.960
0.947
0.935
0.931
0.902
0.911
0.911
0
30
60
90
120
150
180
210
240
511.9
397.2
361.9
306.6
262.6
262.1
259.5
266.7
266.2
1.000
0.776
0.707
0.599
0.513
0.512
0.507
0.521
0.520
Electronic Supplementary Material (ESI) for Chemical CommunicationsThis journal is © The Royal Society of Chemistry 2013

7
The ionic interference experiment
Fig. S2 Fluorescence intensity of NBM in the absence or prescence of miscellaneous ions in 40 mM
HEPES aqueous solution (pH 5.0). From left to right: NBM, Zn2+
, Ag+,Pd
2+, Hg
2+, Cr
3+, Cu
2+, Al
3+,
Fe2+
, Fe3+
, Cd2+
, Mg2+
, NH4+, Mn
2+, K
+, Na
+, Co
2+, Ni
2+, Ca
2+, ClO4
-, NO3
-, Cl
-, I
-, Br
-, S
2-. Condition:
excitation wavelength is 639 nm, emission wavelength is 678 nm. 5 µM for NBM; 50 µM for all the
ions.
The fluorescence image of NSCs cell staining with NBM
Fig. S3 Confocal fluorescence images of NBM (50 nM) in NSCs cells co-stained with nuclei staining Hoechst 33258 (5 μM). a: red emission from NBM. b: blue emission from Hoechst 33258. c: overlay of the blue and red channels. Scale bars represent 10 µm.
Photostability in solution and cell
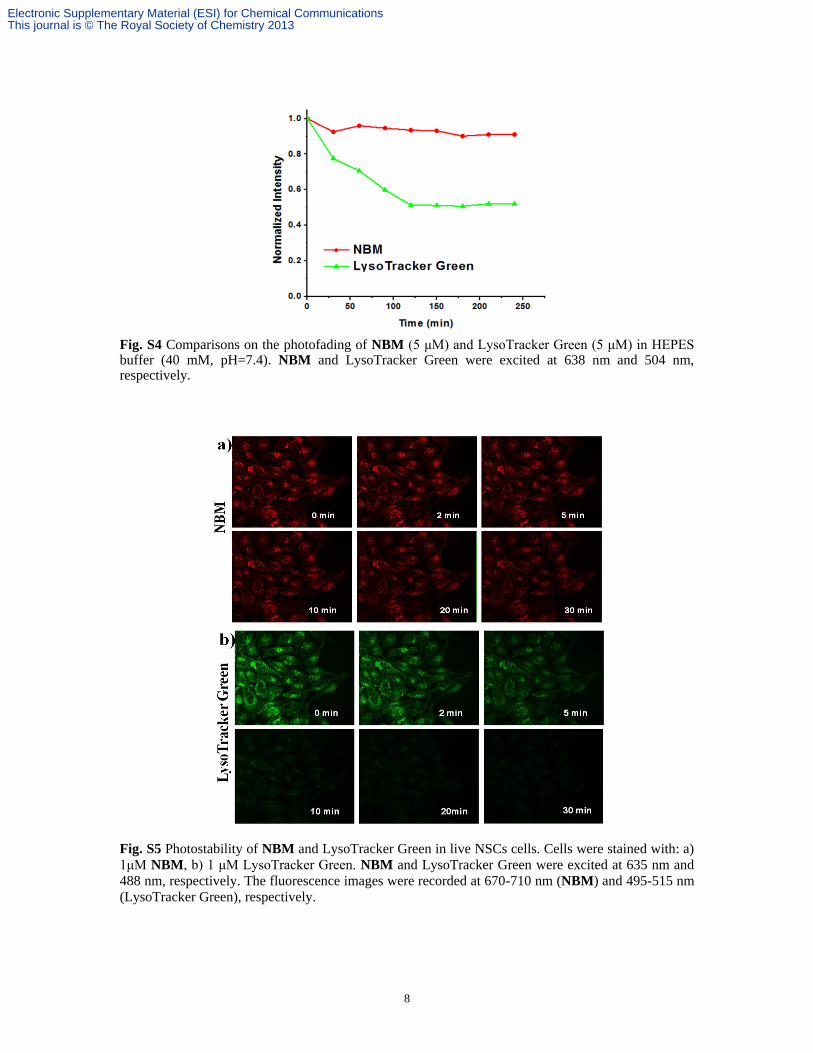
Photobleaching is a common problem for many organic dyes, with the reporting dyes often compromising the temporal monitoring of dynamic events inside cells.
s1 In this study, under
irradiation from a 500 W I-W lamp for 4 h, the maximal fluorescence intensity of NBM remained nearly constant (Fig. S4 and Table S2). In addition, when mice hippocampal neurons cells prestained with NBM and LysoTracker Green were exposed to constant laser illumination for 30 min, the fluorescence of LysoTracker Green quickly decayed in 5 min (Fig. S5b) while NBM exhibited constant fluorescence emission (Fig. S5a). These experimental results indicated the high photostability of NBM under environmental and biological conditions.
Electronic Supplementary Material (ESI) for Chemical CommunicationsThis journal is © The Royal Society of Chemistry 2013
8
Fig. S4 Comparisons on the photofading of NBM (5 μM) and LysoTracker Green (5 μM) in HEPES buffer (40 mM, pH=7.4). NBM and LysoTracker Green were excited at 638 nm and 504 nm, respectively.
Fig. S5 Photostability of NBM and LysoTracker Green in live NSCs cells. Cells were stained with: a)
1μM NBM, b) 1 μM LysoTracker Green. NBM and LysoTracker Green were excited at 635 nm and
488 nm, respectively. The fluorescence images were recorded at 670-710 nm (NBM) and 495-515 nm
(LysoTracker Green), respectively.
Electronic Supplementary Material (ESI) for Chemical CommunicationsThis journal is © The Royal Society of Chemistry 2013
9
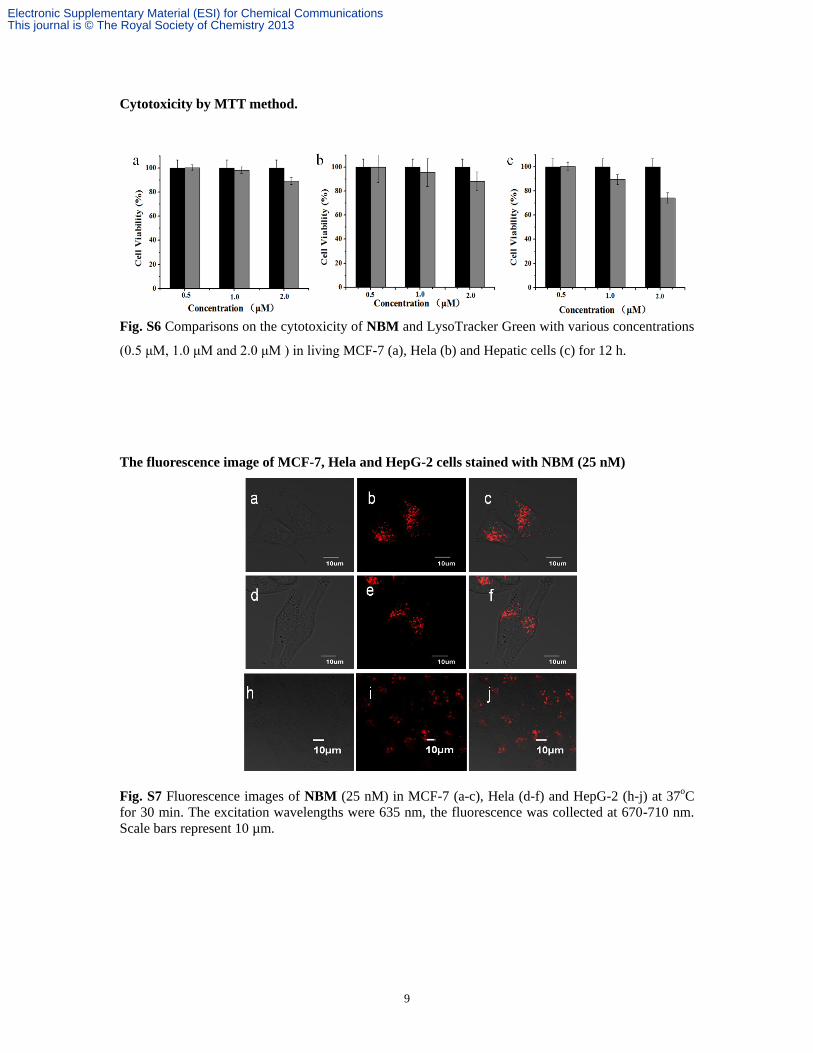
Cytotoxicity by MTT method.
Fig. S6 Comparisons on the cytotoxicity of NBM and LysoTracker Green with various concentrations
(0.5 μM, 1.0 μM and 2.0 μM ) in living MCF-7 (a), Hela (b) and Hepatic cells (c) for 12 h.
The fluorescence image of MCF-7, Hela and HepG-2 cells stained with NBM (25 nM)
Fig. S7 Fluorescence images of NBM (25 nM) in MCF-7 (a-c), Hela (d-f) and HepG-2 (h-j) at 37oC
for 30 min. The excitation wavelengths were 635 nm, the fluorescence was collected at 670-710 nm.
Scale bars represent 10 µm.
Electronic Supplementary Material (ESI) for Chemical CommunicationsThis journal is © The Royal Society of Chemistry 2013

10
Fig. S8 TOF mass of compound 1.
Fig. S9 1H-NMR spectrum of compound 1 recorded in CDCl3.
Electronic Supplementary Material (ESI) for Chemical CommunicationsThis journal is © The Royal Society of Chemistry 2013

11
Fig. S10 TOF mass of compound NBM.
Fig. S11 1H-NMR spectrum of NBM recorded in CD3OD.
Electronic Supplementary Material (ESI) for Chemical CommunicationsThis journal is © The Royal Society of Chemistry 2013

12
Fig. S12 13
C-NMR spectrum of NBM recorded in CD3OD.
References
S1. Z. Li, S. Wu, J. Han and S. Han. Analyst., 2011, 136, 3698-3706;
Electronic Supplementary Material (ESI) for Chemical CommunicationsThis journal is © The Royal Society of Chemistry 2013