Embed Size (px)
Citation preview

HSE Health & Safety
Executive
Flueless gas fires – concentration of carbon monoxide,carbon dioxide, and nitrogen dioxide, and
particulate level produced in use
Prepared by Advantica Technologies Limited for the Health and Safety Executive 2004
RESEARCH REPORT 23

HSE Health & Safety
Executive
Flueless gas fires – concentration of carbon monoxide,carbon dioxide, and nitrogen dioxide, and
particulate level produced in use
R.W. Hill & S. MarksAdvantica Technologies Limited
Ashby Road Loughborough Leicestershire
LE11 3GR
A series of experiments was performed to investigate the concentration of combustion products (carbon dioxide, carbon monoxide and nitrogen dioxide) and particulate levels produced by three models of flueless gas heater.
In all tests, the controls and thermostat were set so that the appliance operated continuously at full heat output.
Items which could be altered between tests were
• Fuel (natural gas or propane)
• Ventilator position (low – 100cm2, high – 100cm2, or no ventilator)
• Room size (20m3 or 40m3)
• Presence or absence of the catalyst
This report and the work it describes were funded by the Health and Safety Executive (HSE). Its contents, including any opinions and/or conclusions expressed, are those of the authors alone and do not necessarily reflect HSE policy.
HSE BOOKS

© Crown copyright 2003
First published 2003
ISBN 0 7176 2567 2
All rights reserved. No part of this publication may bereproduced, stored in a retrieval system, or transmitted inany form or by any means (electronic, mechanical,photocopying, recording or otherwise) without the priorwritten permission of the copyright owner.
Applications for reproduction should be made in writing to:Licensing Division, Her Majesty's Stationery Office, St Clements House, 2-16 Colegate, Norwich NR3 1BQ or by e-mail to [email protected]
ii

FOREWORD BY HSE/DTI
The use of fixed flueless gas fires, to supplement primary heating provided by central heating systems, has increased substantially over recent years. Such fires are not presently covered by specific product or installation standards, but are subject to certification by an independent Notified Body against compliance with the essential safety requirements of the Gas Appliances Directive (enacted by the Gas Appliances (Safety) Regulations 1995 (GASR)). The Certification process includes an assessment of the manufacturer’s installation instructions, and the fires are currently being installed to these instructions. Three manufacturers are currently offering a range of flueless fires, and their installation instructions are inconsistent with one another. They specify different requirements for fixed ventilation area and minimum room size, which are also below the minimum required by BS 5440: Part 2*1. In order to encourage the manufacturers to develop common product and installation standards, HSE (with support from the Department of Trade and Industry (DTI)) agreed to sponsor the work of Advantica, reported here.
The DTI have responsibility for ensuring only safe products may be placed on the market, in this instance under the GASR, while HSE has responsibility for appliance installation requirements under the Gas Safety (Installation and Use) Regulations 1998. Therefore the question of the suitability of the use of these fires is a matter of joint responsibility. To this end, DTI/HSE have also been assessing information provided by the fire manufacturers, which they claim supports their view that the fires can be used without subjecting the users to harmful concentrations of combustion products. The assessment has been against a background of proposed changes to HSE occupational exposure standards for certain combustion products and an increasing awareness of indoor air quality issues. Currently, there are no UK published standards for indoor air quality, but guidelines are being considered by the Department of Health (DoH) and its advisory committees.
In the absence of published information, advice was requested from the DoH Advisory Committee on Medical Effects of Air Pollutants (COMEAP), as to “acceptable” indoor air levels for pollutants emitted from these fires. The Advisory Committee have recommended comparing the level of pollutants with guidelines and standards published by the World Health Organisation (WHO)*2 and the Expert Panel on Air Quality Standards (EPAQS)*3, 4. DTI/HSE will also need to consider any implications for other types of flueless gas appliances, and to this end have commissioned further trials by the Building Research Establishment (BRE)*5.
It should be noted that the manufacturers of these gas fires dispute any suggestion that the correct use of their fires will lead to a possible health risk. They contend that the Advantica tests represent a “worst case scenario, which would seldom, if ever, be encountered in practice, and point to a limited survey (reproduced as Annex 1 of this report) carried out by Advantica in 10 homes where their fires are installed. However, the test regime (which included reduced ventilation and appliance “fault” mode conditions) was specifically designed to provide sufficient information to subsequently enable the likely concentrations of combustion products to be predicted for a wide range of ventilation provision, room size and potential use of the gas fires. Such predictions can
iii
only be based on work where all the parameters can be controlled, e.g. in a test house of the type used in the primary work of this report.
While acknowledging the test limitations, DTI/HSE are publishing this report in the public interest, as a contribution to the wider debate on product and installation standards for flueless gas appliances. As part of this debate DTI/HSE are working closely with relevant bodies, e.g. the British Standards Institution (BSI), to ensure that the implications of this work are explored in developing future standards and guidelines for flueless gas appliances.
*1 BS 5440-2: 2000, Installation and maintenance of flues and ventilation for gas appliances of rated input not exceeding 70kW net (1st, 2nd and 3rd family gases) – Part 2: Specification for installation and maintenance of ventilation for gas appliances, BSI, 2000
*2 World Health Organisation. Air Quality Guidelines for Europe. Second Edition. WHO Regional Publication, European Series, No 91. Copenhagen: WHO Regional Office for Europe, 2000.
*3 Department of the Environment. Expert Panel on Air Quality Standards. Carbon Monoxide. London: HMSO, 1994.
*4 Department of the Environment. Expert Panel on Air Quality Standards. Nitrogen Dioxide. London: HMSO, 1996.
*5 Upton S, Ross D and Pierce B, Measurement and modeling of combustion products from flueless gas appliances, HSE RR 127/2004
iv

CONTENTS1 INTRODUCTION AND BACKGROUND 1
1.1 General 11.2 Particulate Matter 1
2 EXPERIMENTAL EQUIPMENT AND PROCEDURE 32.1 Test Enclosure 32.2 Heating appliances 52.3 Experimental Measurement and Monitoring 9
3 EXPERIMENTAL PROGRAMME 114 RESULTS 13
4.1 Effect of vent position 144.2 Effect of room size 154.3 Effect of catalyst 154.4 Stratification 214.5 Cycling 214.6 Relative Humidity Measurements 234.7 Particulate Data 27
5 DISCUSSION 296 RECOMMENDATIONS 31
Appendix 1 Indoor air quality in ten homes with flueless heaters in the Leicestershire area 32
v

vi

SUMMARY
The last few years has seen the launch of a new generation of flueless gas fires and stoves incorporating new technology safety devices, such as oxygen depletion-sensing pilots, and catalysts to reduce the harmful flue products.
The main objective of this of work was to carry out an investigation into the safe operation of fixed gas-fired flueless space heaters with respect to the levels of combustion product emissions within the home. It provides information on the long-term safety issues relating to the exposure to emissions from this type of flueless heater and amongst other criteria, it examines the effects of installation practices where the sizes of rooms and ventilation openings are below those given as minimum requirements by the manufacturer, as well as looking at the implications of the failure of the appliance catalyst that converts the carbon monoxide produced during the combustion process into carbon dioxide.
The experimental programme consisted of 28 tests. In the main test programme, the operating conditions of three appliances manufactured in the United Kingdom were varied. The items which could be varied were
• Fuel (natural gas or propane) • Ventilator position (low – 100cm2, high – 100cm2, or no ventilator) • Room size (20m3 or 40m3) • Presence or absence of the catalyst
In all tests, the controls and thermostat were set so that the appliance operated continuously at full heat output.
In addition, the results from one test during which the appliance was allowed to cycle on and off, with the thermostat operating normally, are included. Four tests were also performed in the 20m3 room, with no ventilator, to measure the concentrations of carbon monoxide, carbon dioxide and oxygen in the firebox before the catalyst, and in the flue after the catalyst. The recommendations are: • The carbon dioxide concentrations, after two hours continuous operation, were in all cases,
greater than the 8 hour limits in EH401. It should be noted that these appliances are not intended to be the sole heat source in a room and in normal operation the appliance will be cycled on and off by the thermostat to maintain a constant room temperature. The concentration of carbon dioxide in real-life environments in an occupied house under normal conditions, containing these appliances, should be monitored to see if the concentration of carbon dioxide does present a potential problem.
• A badly performing burner (defined in terms of carbon monoxide output) may be hidden behind a functioning catalyst. Measurements of combustion performance should be made before the catalyst, and after the catalyst to check that the catalyst is functioning efficiently. An indication of acceptable values should be given in the manufacturers Installation and Servicing Instructions for both locations.
1 Guidance note EH40/00 ‘Occupational Exposure Limits’ ISBN 0 7176 1730 0, HSE Books, 2000
vii

viii

1 INTRODUCTION AND BACKGROUND
1.1 GENERAL
The last few years has seen the launch of a new generation of flueless gas fires and stoves incorporating new technology safety devices, such as oxygen depletion-sensing pilots, and catalysts to reduce the harmful flue products.
All of the fixed flueless gas fires and stoves on sale in this country are independently tested and certificated for safety in accordance with the Gas Appliance Directive and as such comply with legal requirements including CE Marking.
The gas industry has, however, been involved in an ongoing debate about the suitability of these appliances particularly from the standpoint of their installation and long-term safety reliability. Discussion has centred on the differences between the existing installation standards such as BS 5440, compared with the manufacturer’s instructional literature that are assessed during the type assessment of the appliance carried out as part of the legal obligations for placing these types of products on the community market.
The main objective of this work was to carry out an investigation into the margins of safety when operating fixed gas-fired flueless space heaters with respect to the levels of combustion product emissions within the home. It provides information on the long-term safety issues relating to personal exposure to emissions from this type of flueless heater and amongst other criteria, it examines the effects of incorrect installation practices where the sizes of rooms and ventilation openings are below those recommended in standards and the manufacturers instructions, as well as looking at the implications of the failure of the appliance catalyst that converts the carbon monoxide produced during the combustion process into carbon dioxide.
A further objective of the work is to make recommendations back to the relevant committees dealing with changes to codes and standards that are being considered to accommodate this new generation of domestic gas appliance.
It should be recognized that as this type of heater, which is intended to act as secondary heating within the home only, does not require a flue of any sort and all of the heat produced is distributed within the room. As a consequence, this type of appliance has a particularly high efficiency, resulting in significantly lower running costs and carbon dioxide emissions compared to a flued heater.
1.2 PARTICULATE MATTER
Exposure to particles has been associated with both acute and chronic health effects. Concerns about these effects have derived primarily from epidemiological studies showing an association between increases in airborne particle concentration and an increase in daily morbidity and mortality.
Particulate air pollution refers to an air-suspended mixture of solid and liquid particles that vary in size, composition, origin and effects. The different formation processes lead to characteristic differences in size and composition of particles. Particulate matter is found both in the outdoor and indoor environment and is giving rise to growing concern.
PM10 (all particles having diameters below 10 µm or 10,000 nm) is generally considered to be a contributory factor towards death among those with pre-existing lung and heart disease. However, evidence has emerged during the last few years indicating that it may not be the total
1

PM10 particle assay that is responsible for harmful effects on health but that toxicity lies in a finer fraction of particles, PM2.5 (all particles having diameters below 2.5 µm or 2,500 nm) and smaller.
The most commonly measured property for health and environmental effects of particles is the mass concentration, the mass of particulate matter in a unit volume of air sample.
2

2 EXPERIMENTAL EQUIPMENT AND PROCEDURE
2.1 TEST ENCLOSURE
The programme of experiments was carried out in the Ventilation Test House facility at the Advantica Loughborough Site. This test facility is a purpose-built two-storey detached house of timber frame construction, with a brick cladding for the outside walls and a pitched tiled roof (see Figure 1) built to current building regulations. The layout of the ground floor of the house is shown in Figure 2 and the room dimensions (as stated by the builders) are given in Table 1.
Table 1 Room dimensions Ground Floor First Floor
Kitchen 2425mm x 2490mm Bedroom 1 (max) 4573mm x 2313mm Lounge / Dining (max) 4573mm x 4027mm Bedroom 2 2313mm x 3872mm
WC 911mm x 1500mm Bedroom 2 (max) 4573mm x 2363mm
Bathroom 2620mm x I800mm Height of each room 2300mm
The test enclosure was in the lounge. All external doors and windows were closed during the tests, with ventilation being provided (if required) by a 100cm2 free area opening through the external wall. The test chamber (or room) has a volume of 38.9m3. The layout and position of the flueless heaters and other equipment in the room is shown in Figure 3 and the dimensions of the room are given in Figure 4. The heights of the sample stands, ventilators, etc. are given in Table 2. For some tests a smaller (20m3) room was used. This was made by using plasterboard sheets fastened to wooden battens at the positions shown in Figure 3 and Figure 4. The gaps around the sheets were sealed with aluminium tape, except for an area which was left un-taped to represent the openings typically found around a closed door.
3

Figure 1 Elevation of house
Table 2 Heights Height above floor
High level ventilator 1.83 metres Low level ventilator 0.47 metres Carbon monoxide, carbon dioxide and oxygen 2.24 metres sample probes 1.48 metres
0.06 metres Nitrogen dioxide sample probe 1.49 metres
Temperature probes 2.17 metres 1.48 metres 0.96 metres 0.13 metres
Relative humidity probe 1.48 metres
4

Lounge
Kitchen
Figure 2 Ground floor, showing the approximate location of the room partitions, doors, and windows
2.2 HEATING APPLIANCES
Appliances were supplied for the programme by three U.K. manufacturers – Focal Point Fires, Burley Appliances, and Yeoman Stoves. The details of the appliances are given below.
2.2.1 Appliance A
This is a free standing stove, intended for fitting into a fireplace opening or on a hearth. The dimensions and the manufacturers specification are given in Table 3. A free vent area of at least 50cm2 and a minimum room size of 40m3 are stated as required for this appliance in the manufacturers instructions.
5

Cupboard
Duct
V
V
l
Window
i
and
Position of high levevent
Position of appliances A and B Duct
Position of partition walls, used to make the smaller room
Patio doors
Stands for
temperature and humidity sensors
Gr mm dust monitor
gas sample probes
Position of Position of low level appliance C vent
Figure 3 Layout of room used for testing
2.2.2 Appliance B
This is a free standing stove, intended for fitting into a fireplace opening or on a hearth. The dimensions and the manufacturers specification are given in Table 3. A free vent area of at least 100cm2 and a minimum room size of 33m3 are stated as required for this appliance in the manufacturers instructions.
6

1.93m
2.13m
0.28m
0.30m
4.55m
0.35m
1.35m
2.25m
0.53m
0.65m 0.93m
2.36m
3.62m
4.06m
Figure 4 Dimensions of room used for testing
2.2.3 Appliance C
This is an inset fire, designed to fit into a purpose made opening. The dimensions and the manufacturers specification are given in Table 3. A free vent area of at least 100cm2 and a minimum room size of 40m3 are stated as required for this appliance in the manufacturers instructions.
7

Table 3 Manufacturers specification a) Appliance A
Natural Gas G20 LPG (Propane) G31 Category 12H 13P Supply Pressure 20mBar 37mBar Burner Pressure (High) 9.4mBar 35.5mBar (Low) 2.2mBar 8mBar Heat Input (High) 3.5kW 3.5kW (250 g/h) (Low) 1.7kW 1.7kW (l20g/h) Inlet Connection 8mm Compression 8mm Compression Size 0.50 m (w) x 0.62 m (h) x 0.29 m (d)
Note Heat input is net
b) Appliance B Gas Natural Propane
12H/G20 13P/G31 Heat input (net) kW 2.99 2.99 Supply Pressure (mbar) 20 37 Burner Pressure (mbar) 16.3 36.1 Gas rate (m3/hr) 0.348 0.115 Injector marking 54 30 Size 0.44 m (w) x 0.51 m (h) x 0.31 m (d)
c) Appliance C Gas Group G20 Natural Gas CAT I2H Inlet Pressure 20 mbar Max Energy Input Gross 3.0 kW
Net 2.7 kW
Max Gas Rate 0.29 m3/h
Min Energy Input Gross 2.1 kW
Net 1.89kW
Pilot Energy Input Gross 166W Net 150W
Burner Pressure High 10.0 mbar. Hot9.0 mbar. Cold
Low 4.8 mbar. Hot Main Injector Burner Stereo. Size 60 Gas Inlet Connection 8 mm compression Ignition Piezo spark Spark Gap 4.0 mm (± 1.0mm) Weight 23 Kg Size 0.48m (w) x 0.59 m (h)
8

2.3 EXPERIMENTAL MEASUREMENT AND MONITORING
The experiments were designed to assess the levels of airborne contamination produced by fixed flueless space heaters currently available on the UK market. In particular the work was intended to estimate the sensitivity of such levels to installation parameters including room volume and ventilation provision. During each experiment, measurements were made to monitor the following parameters:
a) Concentration of carbon monoxide, carbon dioxide and oxygen present within the room at three heights;
b) Additional measurements of the concentration of carbon monoxide, carbon dioxide and oxygen were made in some tests just before and just after the catalyst block;
c) Concentration of nitrogen dioxide present within the room at one height; d) Temperature within the room at four heights; e) Relative humidity within the room at one height.
Details of these measurements are outlined below.
2.3.1 Infra-red Analysers
The concentration of carbon monoxide, carbon dioxide, and oxygen within the rooms of the test enclosure was monitored by means of sample probes attached to a sample stand positioned as shown in Figure 3. The heights of the sample probes above the ground floor are given in Table 2. In addition, sample probes were located before and after the catalyst block in some tests.
The probes were sampled in sequence using a stream selection unit controlled by the data logging/analysis system connected to the analysers. Details of the sample probe sequence are shown in Table 4. The build-up of carbon monoxide within each room was monitored by means of graphical displays of the concentration-height profiles measured at the sample stand location via a video display unit which formed part of the data logging/analysis system.
All samples withdrawn during the course of an experiment for analysis were analysed by instruments located in the “kitchen” of the Test House and dried prior to analysis using dedicated Perma Pure drying columns. These columns exchanged water vapour through capillary tubes with walls made from semi-permeable material with a dry stream of air circulating around them. Such a technique ensured there was no adsorption of combustion products onto the surface of any solid drying agents which would have rendered the resulting gas concentration measurements inaccurate.
Each of the probes used to measure the concentration of carbon monoxide, carbon dioxide and oxygen was sampled for a 60 second period to ensure the line had been purged completely and the analyser, a Siemens Ultramat 23 + O2, provided an accurate measurement of concentration at the moment a data point was logged.
2.3.2 Chemi-luminescent Analyser
Measurements of the concentration of nitrogen dioxide were made at the position shown in Figure 3 and Table 2. The samples were withdrawn along PTFE tube to drying columns (see Section 2.3.1), and analysed by a Rotork Analysis Series 440 chemi-luminescent analyser.
9

Table 4 Sample probe sequence
Test 23 Sequence: After catalyst block High Middle Low
Time taken - 4 minutes
Tests F1 – F4 Sequence: After catalyst block Low
Time taken - 2 minutes
All other Tests Middle Low Sequence: High
Time taken - 3 minutes
2.3.3 Temperatures and humidity
Temperature was measured at four heights as listed in Table 2. The temperatures at three of the positions were measured using thermistors and at the fourth position, the temperature and humidity sensors were combined in one unit, RS part number 312-2951. The temperature sensor in this unit was a thermistor, and the humidity sensor was a bulk polymer type.
To produce a more representative indication of the effect of the fire, the temperature rise at each position was calculated and is shown in subsequent Tables and Figures unless stated otherwise. The temperature rise is calculated as
measured temperature – temperature at that position just before the appliance is lit
2.3.4 Particles
The real time and mass dust monitor, a Grimm dust monitor, was employed for the tests in this study. The monitor measures particles from 0.75 to 15 µm in size (750-15000nm), as 8 separate channels and is capable of displaying the concentrations in either mass mode (with results in micrograms/m3), or count mode, every six seconds. The Grimm monitor was operated in the mass mode during these tests.
The tests were carried out in the lounge of the test house at Loughborough. The monitor was placed on a table 0.85m above the ground level and 1.78m from the back wall, again as shown in Figure 3.
2.3.5 Recording of data
The Grimm dust analyser which used its own, self contained, data logger. The other instrumentation used InstruNet modules (manufactured by GW Instruments inc.) to record the data. This logging system was controlled by a computer in the kitchen, and the data was transferred straight into an Excel spreadsheet so that real time displays could be obtained of, for example, gas concentration profiles, temperatures, etc. during a test. In addition, the spreadsheet itself could be examined while the test was in progress. The InstruNet modules were also used to control the stream selection boxes for the gas sample probes with data points recorded every 60 seconds.
10

3 EXPERIMENTAL PROGRAMME
The experimental programme consisted of 28 tests, (for all three appliances) details of which are shown in Table 5. In the main test programme the appliance operating conditions were varied. The following could be varied:
• Fuel (natural gas or propane) • Ventilator position (low2 – 100cm2, high – 100cm2, or no ventilator) • Room size3 (20m3 or 40m3) • Presence or absence of the catalyst
In all tests the controls and thermostat were set so that the appliance operated continuously at full heat output.
In addition, the one test was included during which the appliance was allowed to cycle on and off, with the thermostat operating normally. Four tests were also performed in the 20m3 room, with no ventilator, to measure the concentrations of carbon monoxide, carbon dioxide and oxygen in the firebox before the catalyst, and in the flue after the catalyst. (Measurements of nitrogen dioxide concentration and particulates were not made during these tests.)
2 The tests using the low vent position were often repeated in the Test Programme. Where this occurs the first test is referred to as “Low vent (1)” and the second test as “Low vent (2)”. 3 The size of the Lounge in the Advantica Test House was similar in size to the minimum specified by two of the manufacturers. For comparison purposes it was decided to test all the appliances in this 40m3
room. The 20m3 room (made by dividing the larger room) was used to represent the situation where an appliance is installed in a room which is considerably smaller than the minimum recommended volume.
11

Table 5 Test Programme
Report Fuel Appliance Ventilator Catalyst Room size Test 1 2 34 5 6 78 9 10 1112 13 14 15 16 17 18 19 20 21 22 23 24 25 26 27 28
Natural gas Natural gas
Natural gas Natural gas Natural gas Natural gas
Natural gas Natural gas Natural gas Natural gas
Natural gas Natural gas Propane Propane Propane Propane Natural gas Natural gas Natural gas Natural gas Natural gas Natural gas Natural gas Natural gas Natural gas Natural gas Natural gas Propane
C C C C A A A A B B B B A A A A B B A A A C C C C C C A
L L H 0 L L H 0 L L H 0 L H 0 L L 0 L 0 0 L 0 L 0 L 0 0
Y Y Y Y Y Y Y Y Y Y Y Y Y Y Y Y Y Y Y Y N Y Y N N N N Y
40 40 40 40 40 40 40 40 40 40 40 40 40 40 40 20 20 20 20 20 20 20 20 20 20 40 40 20
20 Extra tests, appliance allowed to cycle C1 Natural gas C 0 N Extra tests, CO, CO2 and O2 measured before and after catalyst F1 NG C 0 Y 20 F2 NG A 0 Y 20 F3 NG B 0 Y 20 F4 A 0 Y 20 LPG
1. An uncoated catalyst was not supplied for Appliance B. 2. An uncoated catalyst was not supplied for Appliance A until the end of the test programme, and there was insufficient time to carry out tests in the small room, or using propane
12

4 RESULTS
A summary of some of the measurements obtained in Tests 1 ĺ 28 and C1 is given in Table 6. Table 6 Summary of results, conditions in middle of room after two hours
Report Gas Temperature Carbon Carbon Nitrogen Test consumption
m 3/hr rise Celsius
monoxide ppm
dioxide %
dioxide ppm
1 0.27 11.5 0 0.85 0.2 2 0.24 10.0 0 0.76 0.4 3 0.28 10.1 0 0.57 0.4 4 0.27 11.8 0 0.99 0.5 5 0.39 17.1 1 1.15 0.6 6 0.39 17.6 0 1.11 0.6 7 0.39 17.2 0 0.98 0.5 8 0.39 18.3 0 1.41 0.5 9 0.27 10.8 0 0.79 0.2 10 0.27 10.5 0 0.85 0.1 11 0.28 12.1 0 0.63 0.2 12 0.27 13.8 0 0.92 0.2 13 N/A 18.4 0 0.94 0.4 14 N/A 15.6 0 0.93 0.4 15 N/A 14.6 0 1.21 0.4 16 N/A 21.4 0 0.94 0.5 17 Not calculated 19.1 0 0.79 0.1 18 Not calculated 19.2 0 1.13 0.1 19 Not calculated 24.6 0 1.19 0.7 20 Not calculated 27.0 1 1.54 0.8 21 Not calculated 23.2 37 1.54 0.7 22 Not calculated 16.6 0 0.88 0.5 23 Not calculated 16.6 0 0.99 0.5 24 Not calculated 19.0 3 0.80 0.9 25 Not calculated 19.0 8 1.18 1.0 26 Not calculated 8.7 6 0.80 0.7 27 Not calculated 11.1 5 0.9 0.7 28 N/A 21.8 0 1.29 0.5 C1 Not calculated 11.7 9 0.69 0.7
N/A – Propane flow was not measuredNot calculated – the natural gas flow in these tests was not available
The gas consumption of Appliances B and C was in reasonable agreement with their specified ratings (see Table 3). The natural gas Appliance A had a greater specified rating, but the gas consumption indicated an even higher rating of about 4kW. The propane consumption was not measured, but the temperature rise in the room suggested that the appliance rating corresponded with a specification of 3.6kW. To enable a comparison to be made between the different tests and appliances involved, the values shown in Table 6 were adjusted to the gas consumption and power rating (3kW) of Appliances B and C, and are shown in Table 7.
13

3/hr = x
Adjusted reading
Original reading
The formula used was
Rating of 3.0kw or gas consumption of 0.27m
Actual rating of 3.0kw or gas consumption
Table 7 Conditions in middle of room after two hours, adjusted for the power output of the appliance
Report Temperature Carbon Carbon Nitrogen Test rise monoxide dioxide dioxide Celsius ppm % ppm
1 11.5 0 0.85 0.2 2 10.0 0 0.76 0.4 3 10.1 0 0.57 0.4 4 11.8 0 0.99 0.5 5 11.8 1 0.80 0.4 6 12.2 0 0.77 0.4 7 11.9 0 0.68 0.3 8 12.7 0 0.98 0.3 9 10.8 0 0.79 0.2 10 10.5 0 0.85 0.1 11 12.1 0 0.63 0.2 12 13.8 0 0.92 0.2 13 15.3 0 0.78 0.4 14 13.0 0 0.77 0.3 15 12.1 0 1.00 0.3 16 17.8 0 0.79 0.4 17 19.1 0 0.79 0.1 18 19.2 0 1.13 0.1 19 17.0 0 0.82 0.5 20 18.7 1 1.06 0.6 21 16.0 26 1.07 0.5 22 16.6 0 0.88 0.5 23 16.6 0 0.99 0.5 24 19.0 3 0.80 0.9 25 19.0 8 1.18 1.0 26 8.7 6 0.80 0.7 27 11.1 5 0.92 0.7 28 18.1 0 1.07 0.4 C1 11.7 9 0.69 0.7
4.1 EFFECT OF VENT POSITION
The test chamber was arranged so that ventilation could be provided at low level or high level (as detailed in Figure 3 and Table 2), or without purpose provided ventilation. (The normal background ventilation was not restricted.). Figure 5 shows the results from similar tests in the large (40m3) room during which the ventilator position was varied.
14

The concentration of pollutants (carbon dioxide and nitrogen dioxide) was higher when no vent was present. The high level vent appeared to be slightly more effective than the low level vent at reducing the concentration of the pollutants, but because of the limited number of tests, differences in external weather conditions, and the reactive nature of nitrogen dioxide, this is not certain.
The temperature rise appeared to be little affected by the position of the vent, indicating that most of the heat goes into the structure and contents of the room, and that little was removed via the ventilator.
4.2 EFFECT OF ROOM SIZE
Figure 6 shows the results from similar tests carried out in the large and small rooms.
The concentration of carbon dioxide was similar in both sizes of room when the vent was present. With no vent, the small room had a higher concentration than the large room, which in turn was higher than with a vent present.
The concentration of nitrogen dioxide appeared to be affected by both the size of the room and the presence or absence of the vent. The reactive nature of nitrogen dioxide and the small number of tests meant that no clear trend was observed.
The temperature rise appeared to be little affected by the presence or absence of the vent, but was affected by the size of the room. Again this suggest that most of the heat generated by the appliance passed into the structure and contents of the room, and little was removed via the ventilator.
The initial rate of temperature rise and the rate of increase in carbon dioxide concentration were, as expected, greater in the smaller room than the larger. This is shown in Figure 7.
4.3 EFFECT OF CATALYST
All the fires were fitted with a catalyst to oxidise any carbon monoxide produced to carbon dioxide. The combustion products passed through a ceramic block which was coated with the catalyst. Appliances A and C were provided with uncoated catalyst blocks, in addition to the coated ones normally fitted, so that the differences could be investigated.
Only a limited series of tests was conducted. Comparison of the concentrations of carbon monoxide after two hours operation is shown in Figure 8. The concentration of carbon monoxide in the room was close to zero in all the tests using a coated catalyst with the Appliance C, and therefore cannot be seen in Figure 8. The concentration was higher in the test using a coated catalyst block with Appliance A. The concentration was higher with both appliances when used with an uncoated catalyst block, as can be seen in Figure 8.
The variation of concentration with time in the tests using the appliance A is presented in Figure 9. With the normal, or coated catalyst block the carbon monoxide concentration reached a peak early in the test, and slowly decayed away to zero. When an uncoated catalyst block was used the carbon monoxide concentration continued to rise. (No adjustment has been made for the higher heat output of this appliance.)
The concentration of nitrogen dioxide appeared to be reduced in tests where a coated catalyst bock was used with Appliance C, compared with test in which an uncoated block was used. The same effect was not seen with Appliance A. Discussion with the manufacturers indicated that this may be due to the different catalyst materials used, and Appliance A should be fitted with the type of catalyst to reduce the concentration of nitrogen dioxide in the future,
15

4.3.1 Measurements close to the catalyst
The catalyst converts the poisonous carbon monoxide to carbon dioxide.
Measurements of carbon monoxide, carbon dioxide and oxygen concentration just before and just after the catalyst position were carried out in tests F1 - F4, and also in Test 21. The results are shown in Table 8. The coated catalyst blocks reduced the level of carbon monoxide almost to nothing, although some effect was also seen with the uncoated catalyst block on appliance A. The concentrations of carbon dioxide and oxygen were not significantly changed by their passage through the catalyst. (No adjustment has been made for the differing heat output of the appliances.)
Measurements of nitrogen dioxide were made only in the centre of the room. The equipment used was not suitable for taking measurements close to the catalyst block.
16

Nit
roge
n di
oxid
e co
ncen
trat
ion
- pp m
), 0.0
0.2
0.4
0.6
0.8
1.0
1.2
Car
bon
dio
xid
e co
nce
ntr
atio
n -
%
Appliance C
Appliance A
Appliance B
Appliance A Propane Average
Low vent (1), No vent , High vent, Low vent (2area = 100cm2 area = 100cm2 area = 100cm2 area = 0cm2
Vent position
0.6
0.5
0.4
0.3
0.2
0.1
0.0 Low vent (1), Low vent (2), High vent, No vent, area = 100cm2 area = 100cm2 area = 100cm2 area = 0cm2
Vent position
Appliance C
Appliance A
Appliance B
Appliance A Propane Average
20
15
10
5
0
area = 100cm2 area = 100cm2 area = 100cm2 area = 0cm2
e
(2),
Tem
pera
ture
ris
- C
elsi
us
Appliance C
Appliance A
Appliance B
Appliance A Propane Average
Low vent (1), No vent, High vent, Low vent
Vent position
Test number Low vent (1) Low vent (2) High vent No vent
Appliance C 1 2 3 4 Appliance A 5 6 7 8 Appliance B 9 10 11 12 Appliance A with 13 14 15 propane
Figure 5 Effect of vent position
17

0.0
0.2
0.4
0.6
0.8
1.0
1.2
Car
bon
dio
xid
e co
nce
ntr
atio
n -
%
Ap pliance C
Ap pliance A
Ap pliance B
Ap pliance A Prop ane Average
Large room, Small room, Large room, Small room, low vent, low vent, no vent, no vent,
area = 100cm2 area = 100cm2 area = 0cm2 area = 0cm2
0.0
0.1
0.2
0.3
0.4
0.5
0.6
Nit
roge
n d
ioxi
de
con
cen
trat
ion
-p
pm
Ap pliance C
Ap pliance A
Ap pliance B
Ap pliance A Prop ane Average
Large room, Small room, Large room, Small room, low vent, low vent, no vent, no vent,
area = 100cm 2 area = 100cm 2 area = 0cm 2 area = 0cm 2
0
5
10
15
20
25
Tem
per
atu
re r
ise
-C
elsi
us
Ap pliance C
Ap pliance A
Ap pliance B
Ap pliance A Prop ane
Average
Small room, Small room, Large room, Large room, low vent, low vent, no vent, no vent,
area = 100cm2 area = 100cm2 area = 0cm2 area = 0cm2
Test number Large room, Small room, Large room, Small room,
low vent, low vent, no vent, no vent, Appliance C 1 Appliance A 5 Appliance B 9 Appliance A with 13 propane
22 4 23 19 8 20 17 12 18 16 15 25
Figure 6 Effect of room size on final conditions
18

%
0.0
0.1
0.2
0.3
0.4
0.5
0.6
0.7
0.8
0.9
1.0 C
arbo
n di
oxid
e -
Large room, low vent, Test 9 Small room, low vent, Test 17
Tem
pera
ture
ris
e - C
elsi
us
0 20 40 60 80 100 120
elapsed time - minutes
25
20
15
10
5
0
Large room, low vent, Test 9
Small room, low vent, Test 17
0 20 40 60 80 100 120
elapsed time - minutes
Figure 7 Effect of room size during test
19

0
5
10
15
20
25
30
wi
l
wi
l2 222
Car
bon
mon
oxid
e co
nce
ntr
atio
n -
pp
m
Ap p liance C th cataly st
Ap p liance C without cata y st
Ap p liance A th cataly st
Ap p liance A without cata y st
Large room, low vent,
area = 100cm
Small room, no vent,
area = 0cm
Large room, no vent,
area = 0cm
Small room, low vent,
area = 100cm
Test number Large room, Small room, Large room, Small room,
low vent, low vent, no vent, no vent, Appliance C with catalyst 0 Appliance C without catalyst 6 Appliance A with catalyst -Appliance A without catalyst
0 0 0 4 6 8 - - 1 - - 26
Figure 8 Effect of catalyst on final concentrations of carbon monoxide
0
5
10
15
20
25
30
35
40
Car
bon
mon
oxid
e - p
pm
Coated cataly st, Test 20 Uncoated cataly st, Test 21
0 20 40 60 80 100 120 elaps ed time - minutes
Figure 9 Effect of catalyst on carbon monoxide build up
20

Table 8 Concentrations after 1 hour before and after catalyst block
Carbon monoxide
Carbon dioxide
Oxygen CO / CO2
ratio
ppm % % Test F1, before catalyst block Test F1, after catalyst block Test F2, before catalyst block Test F2, after catalyst block Test F3, before catalyst block Test F3, after catalyst block Test F4, before catalyst block Test F4, after catalyst block Test 21, before catalyst block Test 21, after catalyst block
46 0 95 0 166 0 108 9 152 80
7.3 7.3 5.9 6.6 4.3 4.9 5.5 3.5 5.4 5.0
9.0 9.1 11.2 10.6 13.7 13.2 13.3 15.9 12.2 13.2
0.00063 0.00000 0.00161 0.00000 0.00386 0.00000 0.00196 0.00026 0.00281 0.00160
4.4 STRATIFICATION
The concentrations of carbon monoxide, carbon dioxide, and oxygen were measured at three heights in the centre of the room, as listed in Table 2. The concentration of carbon monoxide was very low in most tests, and no obvious trend could be observed. However, the concentration profiles of carbon dioxide and oxygen were similar in most tests, and a typical example (from Test 9, Appliance B in the large room with a low level vent) is shown in Figure 10. The concentrations in the middle of the room and close to the ceiling can be seen to be very similar. The concentration measurements close to the floor showed lower levels of carbon dioxide and higher levels of oxygen, compared with the measurements made higher in the room.
The temperature profiles (not temperature rise), measured at four heights are shown in Figure 11. A temperature gradient extending for the full height of the room can be seen
4.5 CYCLING
Under normal conditions, an almost constant temperature in the room is maintained by the thermostat on the appliance controlling the burner, and turning the burner down or off when the temperature reaches the set point. For most of these experiments, the thermostat control was set to the maximum temperature and the sensor positioned in a cool location so that the appliances operated continuously throughout the test. In one test (C1) the thermostat was set to maintain a lower temperature, and the appliance did cycle on and off. Test C1 can be compared with Test 25 which used the same configuration of appliance, room size and absence of coated catalyst. The weather conditions were also similar for both tests. Comparisons of temperature rise and the concentrations of nitrogen dioxide, carbon monoxide, and carbon dioxide are shown in Figure 12 and Figure 13.
21

0.0
0.1
0.2
0.3
0.4
0.5
0.6
0.7
0.8
0.9 C
arbo
n di
oxid
e -%
Concentration 2.24 metres above floor
Concentration 1.48 metres above floor
Concentration 0.06 metres above floor
0 20 40 60 80 100 120
time after ignition - minutes
21.2
21.0
20.8
20.6
20.4
20.2
20.0
19.8
19.6
Oxy
gen
- %
Concentration 2.24 metres above floor
Concentration 1.48 metres above floor Concentration 0.06 metres above floor
0 20 40 60 80 100 120
time after ignition - minutes
Figure 10 Concentration profiles in Test 9
22

40
35
30
25
20
15
10 0 20 40 60 80 100 120
Tem
pera
ture
-C
elsi
us
T emperature 2.17 metres above floor T emperature 1.48 metres above floor T emperature 0.96 metres above floor T emperature 0.13 metres above floor
time after ignition - minutes
Figure 11 Temperature profiles in Test 9
4.6 RELATIVE HUMIDITY MEASUREMENTS
Measurements were made near the centre of the room, as shown in Figure 3 and Table 2. The profiles in most of the tests were similar, with an initial rise for about 10 to 15 minutes, followed by a more gradual fall. The rate of change after two hours was quite small. Some typical examples are shown in Figure 14.
At the end of a test the room was ventilated so that the subsequent test would start under “clean” conditions, and not be affected by contamination from previous tests. Consequently the relative humidity measurements cannot be used to determine what happened after the heater was turned off, and also there was no build up of moisture in the room during the test series. Where the thermostat is used to control the temperature of the room, as in test C1, the rise in relative humidity when the heater in turned off, and the room cools, can be seen. This is shown in Figure 15, where the temperature at the sensor is also plotted.
As the tests were conducted in the Advantica Test House the ambient weather conditions affected the results. The difference in the initial relative humidity inside the room can be seen in Figure 14 and Figure 15, and during the test series initial values ranged between 30% and 65%. Any potential differences due to different heaters, room sizes, ventilator configurations, etc. were not noticed above the variation due to ambient conditions.
23

0
2
4
6
8
10
12
14
16
18
20T
empe
ratu
re r
ise
- Cel
sius
Continuous, Test 25 Controlled by thermostat, Test C1
0 20 40 60 80 100 120
elapsed time - minutes
1.4
1.2
1.0
0.8
0.6
0.4
0.2
0.0
Nit
roge
n di
oxid
e co
ncen
trat
ion
-ppm
Continuous, Test 25 Controlled by thermostat, Test C1
0 20 40 60 80 100 120
elaps ed time - minutes
Figure 12 Profiles with cycling
24

0
2
4
6
8
10
12
14
16
18
20 m
Car
bon
mon
oxid
e co
ncen
trat
ion
-pp
Continuous, Test 25 Controlled by thermostat, Test C1
0 20 40 60 80 100 120
elapsed time - minutes
1.4
1.2
1.0
0.8
0.6
0.4
0.2
0.0
Car
bon
diox
ide
conc
entr
atio
n - %
Continuous, Test 25 Controlled by thermostat, Test C1
0 20 40 60 80 100 120
elapsed time - minutes
Figure 13 Profiles with cycling (2)
25

40
45
50
55
60
65
70
75 .
Rel
ativ
e hu
mid
ity
-%
Test 1 Test 9
0 20 40 60 80 100 120 elaps ed time - minutes
Figure 14 Relative humidity measured during two tests in the 40m3 room with a low level ventilator
0
5
10
15
20
25
30
.
40
45
50
55
60
65
70
.
Tem
pera
ture
- C
elsi
us
Rel
ativ
e hu
mid
ity
- % Temperature
Relative Humidity
0 20 40 60 80 100 120 elapsed time - minutes
Figure 15 Variation in temperature and relative humidity during Test C1
26

4.7 PARTICULATE DATA
The Grimm dust monitor was checked for performance before each test and zeroed. The data were recorded and later imported into ‘Excel’ spreadsheets. The files were initially examined for any abnormality and then checked for reproducibility with the corresponding duplicate test. All the processed data are shown in the appendices to this report.
In all instances the highest levels recorded by the Grimm monitor were for the smallest particles, 750 nanometres (with the levels decreasing markedly in going from 750 to 15000 nanometres). In the majority of cases, only a few particles were observed of the largest size, >15 micrometres. A similar trend was observed at all the different size fractions.
For simplicity purposes the data for each appliance are analysed individually and the concentration levels for PM10 (for which there is an outdoor air quality guideline limit4) are discussed. It is important to note that the initial high concentrations recorded during the majority of the tests were due to the disturbance caused in the test room when lighting or extinguishing the fires. Only the data for the latter part of the tests has been considered in the discussion of data from each appliance (see below), when equilibrium had been is reached (or almost reached). The guideline limit refers to 24-hour average levels and since the tests were around 2 hours duration, the maximum levels reached towards the end of each test are quoted in the analysis.
The base test conditions were as per the manufacturer recommendations, i.e. minimum room volume and with permanent vent area.
4.7.1 Appliance A
All the particulate levels recorded using this appliance were below the air quality strategy guideline limit of 50 µg/m3 for 24-hour mean average for the test conditions detailed in this report.
For all the tests, the particulate levels recorded when equilibrium is reached (or nearly reached) are discussed. It should also be noted that the effects discussed are only marginal changes compared to background levels in the room.
The height of the ventilator had a very slight reducing effect on the particulate levels, with a high level ventilator being slightly more effective. The absence of the ventilator had no significant effect on the particulate levels.
The effect of running the appliance with an uncoated catalyst block was studied only in the 20m3 volume and was found to have little effect on the particulate levels.
Reducing the size of the room did not have a significant effect on the particulate levels, only a slight reduction with a low ventilator position. The absence of the ventilator caused a very slight decrease the levels.
This was the only appliance for which a change in fuel could be studied. For 40 m3 size room, the particulate levels were very slightly higher for the propane version than for the natural gas version (with the ventilator at high level). In case of the low level ventilator and also without a ventilator, no significant effect was observed. For the 20 m3 size room, the particulate levels were very slightly lower for the propane version than for the natural gas version both when the ventilator was at low level and without a ventilator.
4 The Air Quality Strategy for England, Scotland, Wales and Northern Ireland. Working Together for Clean Air. January 2000.
27

4.7.2 Appliance B
All the particulate levels recorded for this appliance were below the air quality strategy guideline limit of 50 µg/m3 for 24-hour mean average for the test conditions detailed in this report.
For all the tests, the particulate levels recorded when equilibrium is reached (or nearly reached) are discussed. It should also be noted that the effects discussed are only marginal changes compared to background levels in the room.
The reproducibility of the base test was good.
The height and absence of the ventilator had little effect on the particulate levels for the 40 m3
size room.
The operation of the appliance with an uncoated catalyst block could not be studied for this heater as one was not provided.
Reducing the size of the room led to a fall in particulate levels when using a low level ventilator. The absence of a ventilator decreased these levels slightly.
4.7.3 Appliance C
Except for one test (discussed later on), all the particulate levels recorded using this appliance were below the air quality strategy guideline limit of 50 µg/m3 for a 24-hour mean average for the test conditions detailed in this report.
For all the tests, the particulate levels recorded when equilibrium is reached (or nearly reached) are discussed. It should also be noted that the effects discussed are only marginal changes compared to background levels in the room.
The reproducibility of the base test was good. Slightly lower levels of particulates were seen with a high level ventilator.
Reducing the size of the room and operating with a low ventilator, had a slight reducing effect on the particulate levels. The one test where the guideline limit was exceeded for the duration of the test was for the 20 m3 size room with no ventilator. The particulate levels showed a sharp continuous increase to over 80 µg/m3. This may have been due to different flame pattern and caused by a movement of the coals bed. The resultant trend is thought to be suspicious and without duplicate tests it cannot be substantiated. Hence it should not be taken out of context. Such data was not reproduced for any of the other tests.
Using an uncoated catalyst block, in the 20 m3 size room, with the ventilator in the low position, had a slight reducing effect on the particulate levels. The same trend was observed for the 40 m3
size room. Data obtained using an uncoated catalyst block showed that the absence of the ventilator made little difference to the particulate levels for 20 m3 size room. The same trend was observed for the 40 m3 size room.
28

5 DISCUSSION
In normal operation the appliance would only operate at maximum rate until the thermostat and sensor sensed that the room was warm enough. The test enclosure used was much better insulated than many properties, and the observed rate of temperature rise and final temperature will be greater than a less well insulated house. In a cold room with poor heat insulation the appliance may operate at maximum rate for some time. Again, if the thermostat failed, the appliance would operate continuously at full rate. Thus, although the results obtained in Tests 1 ĺ 28 represent “worst case” scenarios, these are not implausible.
The appliances are easier to install than a conventional gas fire because they do not require a flue. Conversely, all the combustion products pass into the room. The manufacturers instructions (see Table 3) and ventilation standards5 make recommendations regarding minimum room size and ventilation requirements. These tests were performed in two room sizes (20m3 and 38.9m3) and with three different ventilation configurations (high – 100cm2, low – 100cm2, and no additional ventilation).
The existing 2000 Air Quality Strategy4 sets an upper limit for PM10 (all particles having diameters below 10 µm or 10,000 nm), in the outdoor environment of 50 µg/m3 for a 24-hour mean average. The 24-hour average level must not be exceeded more than 35 times a year.
In a new consultation proposal6 published in September 2001, the government proposes to strengthen substantially the Air Quality Strategy objectives for particles by introducing new objectives stating that for all parts, except London and Scotland, the 24 hour mean of 50 µg/m3
must not be exceeded more than 7 times per year and an annual mean of 20 µg/m3, both to be achieved by the end of 2010. For London, the limits must not be exceeded more than 10-14 times per year and in Scotland, the annual mean is reduced further to 18 µg/m3.
The smaller room showed a higher concentration of carbon dioxide than the larger room. The presence of a ventilator reduced this concentration. The concentrations reached after two hours continuous operation were not high enough to cause vitiation at the burner, or cause the antivitiation device in the pilot to extinguish the fire. Because of the stratification observed in the room, the combustion air used by the appliance would contain more oxygen and less carbon dioxide than air higher in the room. The concentrations of carbon dioxide observed in the centre and upper part of the room, after two hours operation, were in the range of 0.6 ĺ 1.5% (0.6 ĺ 1.2% after adjusting to a 3kW output). These concentrations are greater than those specified in the Health and Safety Executive Guidance Note EH401 (0.5%) for an 8 hour exposure.
The concentration of nitrogen dioxide did not appear to follow a clear trend, based on room size or ventilation. Unlike carbon dioxide, nitrogen dioxide is chemically reactive, and the concentration observed reflects the balance between creation and loss. In these tests it would appear that loss through reaction, rather than through ventilation, was the predominant effect. The design of the burner, not just the throughput, affects the production of nitrogen dioxide. Thus the concentrations observed of nitrogen dioxide depended on the fire. Although the
5 BS5440-2:2000, Installation and maintenance of flues and ventilation for gas appliances of rated input not exceeding 70kW net (1st, 2nd and 3rd family gases) – Part 2: Specification for installation and maintenance of ventilation for gas appliances, BSI, 2000 6 The Air Quality Strategy for England, Scotland, Wales and Northern Ireland. A consultation document on proposals for air quality objectives for particles, benzene, carbon monoxide, and polycyclic aromatic hydrocarbons. Department for Environment, Food and Rural Affairs. September 2001.
29

catalyst is designed primarily to oxidise carbon monoxide, a small increase in the concentration of nitrogen dioxide can be seen in several tests with Appliance C where the normal catalyst was replaced by an uncoated version, although this effect was not seen with Appliance A. Discussion with the manufacturers indicated that this may be due to the different catalyst materials used, and Appliance A should be fitted with the type of catalyst to reduce the concentration of nitrogen dioxide in the future,
All the concentrations measured were well below the 8 hour exposure limit (3 ppm) given in EH40.
The catalyst was effective in removing most of the carbon monoxide. This is clearly shown by the almost complete absence of carbon monoxide in the measurements made in the room during tests in which a catalyst block was used. An uncoated catalyst block was used in several tests with the Appliance A. Carbon monoxide was measured in the room during these tests. The 8 hour exposure limit (30 ppm) given in EH40 was not exceeded in any tests, even when the uncoated catalyst was used. However, it should be noted that
• Such a catalyst was not supplied for Appliance B, • The comments in the next paragraph
In five tests the concentration of carbon monoxide, carbon dioxide and oxygen were measured just upstream and downstream of the catalyst block. As expected the new catalysts removed almost all the carbon monoxide. However conditions before the catalyst varied considerably between the appliances, and complete failure of the catalyst could have caused a significant quantity of carbon monoxide to enter the room. The differences may have been due to the design of the fire, or to the layout of ceramic coals or logs in the fire. In their Installation and Servicing Instructions all three manufacturers recommended checking the concentration of carbon monoxide at the outlet of the fire (i.e. after the catalyst has converted carbon monoxide to carbon dioxide). Thus the poor combustion of the appliance (perhaps due to misalignment of the ceramic coals and logs, or a burner fault) could be missed, but any subsequent degradation or failure of the catalyst would allow this carbon monoxide into the room surrounding the fire.
In test under thermostatic control, the temperature rise and the peak concentrations of carbon dioxide were reduced. However the peak concentrations of carbon monoxide and nitrogen dioxide were not significantly changed, although the time averaged concentration of nitrogen dioxide was reduced.
The size of the room (20 m3 or 40m3) with 100cm2 ventilator made little difference to the final concentration of combustion products for a particular appliance, but the rate of build up in the smaller room was quicker. Thus the occupants would be exposed to higher concentrations for longer periods. The position of the ventilator did make a difference, with a high level vent being slightly more effective at removing the combustion products than a low level vent. The absence of purpose provided ventilation proved least effective in removing combustion products.
30

6 RECOMMENDATIONS
a) The carbon dioxide concentrations, after two hours continuous operation, were in all cases, greater than the 8 hour limits in EH40. It should be noted that these appliances are not intended to be the sole heat source in a room and in normal operation the appliance will be cycled on and off by the thermostat to maintain a constant room temperature. The concentration of carbon dioxide in real-life environments in an occupied house under normal conditions, containing these appliances, should be monitored to see if the concentration of carbon dioxide does present a potential problem.
b) A badly performing burner (defined in terms of carbon monoxide output) may be hidden behind a functioning catalyst. Measurements of combustion performance should be made before the catalyst, and after the catalyst to check that the catalyst is functioning efficiently. An indication of acceptable values should be given in the manufacturers Installation and Servicing Instructions for both locations.
31

32

Appendix 1
INDOOR AIR QUALITY IN TEN HOMES WITH FLUELESS HEATERS
IN THE LEICESTERSHIRE AREA
33

34

Executive Summary
Personal exposure to a variety of airborne contaminants in the home is acknowledged to present a potential risk to an occupant's health. This risk is determined both by the amount of pollutant present and the time for which an individual is exposed.
The main objective of this work was to carry out an air quality survey of ten homes with flueless space heating appliances and provide continuous monitoring for at least 24 hours for pollutants such as carbon monoxide, carbon dioxide and nitrogen dioxide as well as other parameters including relative humidity and temperature levels attained within the test room.
The homes selected were identified in association with three heater manufacturers. The houses selected were located in the Leicestershire area within approximately 25 miles of the Advantica site.
Overall, the levels of contaminants recorded in the ten houses did not exceed the guideline limits both for outdoor exposure and that specified for occupational exposure.
��The standalone silent monitor employed for this survey was effective in being a suitable tool in obtaining reliable air quality measurements while normal activities took place thereby providing data representative of typical everyday activities
��The ten houses surveyed varied in their characteristics such as number of householders, appliance model, appliance being used as a primary/secondary heat source and the volume of the room, each considered to have an effect on the levels contaminants generated.
��In 50% of the houses the WHO outdoor 1-hour guideline limits were exceeded for nitrogen dioxide but none exceeded the corresponding limits for carbon monoxide. The greatest peak concentration measured for carbon monoxide was 22 ppm and for nitrogen dioxide was 0.18 ppm.
��For carbon dioxide, in all but one case the levels in the majority of the homes were less than 0.25%.
��The level of occupancy varied depending on the number of householders and their working routine i.e. working fulltime/part time or retired.
x� The levels of relative humidity and temperature varied considerably between houses, depending on the size of the room surveyed and the operation of the appliance i.e. whether it was used continuously or on an occasional basis. The lowest temperature recorded was around 9°C and the highest 32°C. Correspondingly the relative humidity ranged from 26% to 68%.
.
i

ii
Contents
1 INTRODUCTION ......................................................................................................12 SURVEY PROCEDURES.......................................................................................13 INSTRUMENTATION.............................................................................................14 RESULTS ......................................................................................................................2
4.1 NITROGEN DIOXIDE AND CARBON MONOXIDE ...........................................................2 4.2 CARBON DIOXIDE .......................................................................................................2 4.3 COMPARISON OF SURVEY DATA WITH GUIDELINES ....................................................3
5 CONCLUSIONS AND RECOMMENDATIONS...........................................3
iii

iv

1 INTRODUCTION Personal exposure to a variety of airborne contaminants in the home is acknowledged to present a potential risk to an occupant's health. This risk is determined both by the amount of pollutant present and the time for which an individual is exposed.
The main objective of this work was to carry out an air quality survey of ten homes with flueless space heating appliances and provide continuous monitoring for at least 24 hours for pollutants such as carbon monoxide, carbon dioxide and nitrogen dioxide as well as other parameters including relative humidity and temperature levels attained within the test room.
The homes selected were identified in association with three heater manufacturers. The houses selected were located in the Leicestershire area within approximately 25 miles of the Advantica site.
2 SURVEY PROCEDURES Data was collected in the heating season 2001/2002. The houses were selected from information made available by the heater manufacturers.
For the survey a simple questionnaire was designed detailing the personnel present in the premises, the type of appliances present, ventilation, size of room and a sketch showing where the monitor was placed. A copy of the questionnaire is included in Figure 1. The surveyed houses and the household varied considerably in their characteristics. The details are shown in Table 1.
The survey date was firstly agreed with the householders and the air quality monitor deployed for at least 24 hours in each property.
On arrival at each site the questionnaire was completed including the level of usage of the heater. The plan of the room was then studied and a suitable position for the monitor identified. The position of the monitor was chosen to be close to the flueless gas appliance whilst still providing data representative of personal exposure. The selected location for placing the monitor had to be agreed with the householder in order to ensure the safety of the monitor and to avoid disturbing the normal routine of the householders.
3 INSTRUMENTATION In this study, an air quality monitor was used to record nitrogen dioxide concentration, carbon monoxide concentration, oxygen concentration, humidity and temperature within the room. The indoor air quality (IAQ) monitor has been designed in-house at Advantica and has been used successfully in carrying out indoor air quality measurements in a pilot survey in Loughborough1 and two major surveys, in the Solihull2 and Bristol3 areas. The monitor is silent, battery powered, small and capable of measuring nitrogen dioxide (NO2) levels, carbon monoxide (CO) levels and oxygen levels as well as humidity/temperature on a continuous basis for a 5-day period.
The instrument recorded data every second and logged average values every minute throughout the survey period. The monitor was calibrated and all cells checked before each survey and then recalibrated and checked afterwards to account for any drift in the calibration
1

and abnormality in the operation of the monitor. The monitor was then recharged, recalibrated and set up for the next survey.
4 RESULTS Each survey was carried out for a duration of at least 24 hours. The raw data recorded for carbon monoxide, carbon dioxide (calculated from oxygen data recorded by the monitor), nitrogen dioxide, relative humidity, temperature and occupancy are shown in Figures 2 to 16. Any changes in the calibration were accounted for by incorporating the ‘before and after’ calibration data into the raw data.
Table 2 shows the maximum peak concentrations (1 minute data) for carbon monoxide, carbon dioxide and nitrogen dioxide together with the humidity and temperature measurements recorded for the duration of the survey period. The data quoted in the rest of the report refers to peak 1-minute average recordings.
In all but two houses, the IAQ monitor was placed in lounge/dining room. In the other properties the measurements were taken in the conservatory where the flueless heater was used as a primary heat source.
In all but one case (house number 1), the only other gas appliance, a gas cooker, was operated in an adjacent room separated by a door. In house number 1, the room was rectangular in shape with the flueless appliance operating at one end and an archway leading to a kitchen where the external window and an extractor system was used during cooking.
4.1 Nitrogen Dioxide and Carbon Monoxide For carbon monoxide, the highest one-minute peak level measured was 22 ppm (house number 1) and the lowest was 1.5 ppm (house number 10). In all but three houses the oneminute average carbon monoxide levels were below 5 ppm. In two of these houses (house numbers 1 and 9), the appliance was used, continuously, as a primary source of heat. In two of the homes (house numbers 1 and 6) the peak concentrations lasted for 1 minute and in the third house (house number 9) the peak concentration was sustained for three minutes. In house number 9 there were similar elevated levels recorded at regular intervals throughout the survey.
Of the one-minute peak levels recorded, the lowest nitrogen dioxide concentration measured was 0.12 ppm and the highest was 0.46 ppm. The highest level recorded was for house number 1, where the monitor was placed on the fire surround above the appliance and the appliance operated continuously as a primary source.
4.2 Carbon Dioxide The carbon dioxide concentrations were calculated from the oxygen concentrations measured in the room. The changes were typically small, and over the survey period they were affected, to some extent by sensor drift. Short duration (a few hours) changes could be distinguished, however, with more confidence.
The time-based data (see Figures 2-16) show the estimated concentration of carbon dioxide for the duration of each survey. For some surveys the data showed short-term variations
2

typical of those due to a fire operating, and these are shown where possible after baseline correction (i.e. the start has been shifted to 0%).
The calculated CO2 data, shown in Figure 12 to 16 is considered to be accurate within ± 2 % of the absolute value. In all but one property the average concentration for the whole surveyed period was less than 0.25%. In only two houses, the levels recorded were stable throughout the survey and so the carbon dioxide concentrations calculated in this study should be used as an indication of the carbon dioxide levels generated and not as accurate absolute values.
4.3 Comparison of Survey Data with Guidelines
World Health Organisation guideline limits4(outdoors) for maximum one-hour personal exposure to NO2 and CO are 0.105 ppm and 25 ppm respectively. For carbon dioxide there is no WHO guideline limit but there is an occupational exposure limit, specified in EH405, of 5000 ppm (0.5%) for 8-hour exposure.
Five out of ten houses recorded levels exceeding the WHO one-hour guideline limit for nitrogen dioxide, ranging from 0.11 to 0.18 ppm. Two of the houses that exceeded the nitrogen dioxide guideline limits, had higher carbon monoxide levels than the rest. In all the five cases, the appliance was operating in the lounge within a fire surround, and in three cases as a primary source of heat.
For carbon monoxide none of the houses exceeded the corresponding WHO one-hour guideline limit for carbon monoxide.
In all but one case, the average carbon dioxide concentration (calculated from oxygen data) for the whole surveyed period was less than 0.25%. In the house where carbon dioxide levels reached around 0.4%, the appliance was used in the conservatory as a primary heat source.
5 CONCLUSIONS AND RECOMMENDATIONS
Overall, the levels of contaminants recorded in the ten houses did not exceed the guideline limits both for outdoor exposure and that specified for occupational exposure.
��The standalone silent monitor employed for this survey was effective in being a suitable tool in obtaining reliable air quality measurements while normal activities took place thereby providing data representative of typical everyday activities
��The ten houses surveyed varied in their characteristics such as number of householders, appliance model, appliance being used as a primary/secondary heat source and the volume of the room, each considered to have an effect on the levels contaminants generated.
��In 50% of the houses the WHO outdoor 1-hour guideline limits were exceeded for nitrogen dioxide but none exceeded the corresponding limits for carbon monoxide. The greatest peak concentration measured for carbon monoxide was 22 ppm and for nitrogen dioxide was 0.18 ppm.
3

��For carbon dioxide, in all but one case the levels in the majority of the homes were less than 0.25%.
��The level of occupancy varied depending on the number of householders and their working routine i.e. working fulltime/part time or retired.
x� The levels of relative humidity and temperature varied considerably between houses, depending on the size of the room surveyed and the operation of the appliance i.e. whether it was used continuously or on an occasional basis. The lowest temperature recorded was around 9°C and the highest 32°C. Correspondingly the relative humidity ranged from 26% to 68%.
The findings of this work show that the pollutant concentrations in homes with flueless heaters vary depending on the size of the room, appliance usage and level of ventilation in the room. However, the sample size of ten houses was too small to be a representative sample population of such premises and therefore the findings of this study can only be used as an indication of the possible pollutant concentrations.
A larger sample population would provide a more accurate assessment of the contaminant levels in homes.
REFERENCES 1. Marks ST, ‘A survey of air quality in kitchen using gas appliances’. GRTC R
1822, May 1997.
2. Marks ST, Pool G, Dutton J. ’A survey on the exposure to air pollution in the home-indoor air quality in Solihull, West Midlands. GRTC R 2846, April 1999.
3. Marks ST, Pool G. ’Indoor air quality survey in the Avon area and a comparison with a previous survey carried out in Solihull’. R 4192, December 2000.
4. WHO, ’Air Quality Guidelines for Europe’. Geneva, 1999.
5. Guidance note EH40.’Occupational Exposure Limits’ ISBN 0 7176 20832, HSE books, 2002.
4

TABL
E 1
Det
ails
of s
urve
yed
hous
es
Hou
se
No.
N
o. o
f pe
ople
in
ea
ch
hous
e
Peak
Val
ues (
ppm
) M
odel
of
fluel
ess
appl
ianc
e
App
lianc
e he
at in
put
kW/h
r
Loc
atio
n of
ap
plia
nce
Roo
m
volu
me/
ne
t/m3
Hea
t in
put /
vo
lum
e
W/m
3
Com
men
ts
NO
2 con
c.
CO
con
c.
1-m
in
ave.
1-
hr
ave.
1-
min
av
e.
1-hr
av
e.
1 4
0.46
0.
11
22
5.54
B
urle
y 3.
5 Lo
unge
/ di
ning
room
56
.5
61.9
A
pplia
nce
used
as a
prim
ary
heat
sour
ce. U
sed
24 h
rs a
day
2 2
0.16
0.
05
0.5
0.32
B
urle
y 2.
5 Lo
unge
45
.16
55.4
Se
cond
ary
heat
sour
ce.
New
hou
se.
3 4
0.16
0.
09
2.5
1.78
B
urle
y 2.
5 Lo
unge
62
.80
39.8
Se
cond
ary
heat
sour
ce.
Smal
l win
dow
kep
t op
en d
urin
g us
e of
app
lianc
e.
4 2
0.17
0.
05
3.5
3.50
Y
eom
an
2.99
C
onse
rvat
ory
69.1
43
.3
Use
d as
prim
ary
heat
sour
ce in
con
serv
ator
y.
24 h
rs a
day
. Wal
l ven
t ope
n.
5 2
0.24
0.
05
3.0
1.98
Y
eom
an
2.99
C
onse
rvat
ory
85.3
35
C
onse
rvat
ory
used
as a
loun
ge/li
ving
are
a. N
o ot
her h
eat s
ourc
e in
con
serv
ator
y. O
n 24
hrs
da
y. W
all v
ent o
pen.
Doo
r to
loun
ge a
lway
s op
en.
6 2
0.12
0.
05
15.5
0 2.
08
Yeo
man
2.
99
Din
ing
room
34
.62
86.4
Se
cond
ary
heat
sour
ce. U
sed
in e
veni
ngs o
nly.
7 2
0.30
0.
15
3.00
1.
85
Foca
l poi
nt
2.99
Lo
unge
55
.63
53.7
Se
cond
ary
heat
sour
ce. U
sed
24 h
rs a
day
.
8 3
0.22
0.
16
3.5
1.75
Fo
cal p
oint
3
Loun
ge
44.1
1 68
Se
cond
ary
heat
sour
ce. U
sed
mai
nly
in
even
ings
.
9 2
0.36
0.
12
16.5
12
.48
Yeo
man
2.
99
Loun
ge
60.5
2 49
.4
Prim
ary
heat
sour
ce in
loun
ge. O
n 24
hrs
a
day.
10
2 0.
23
0.18
1.
50
1.33
Fo
cal p
oint
3
Loun
ge
70.9
42
.3
Seco
ndar
y he
at so
urce
.
5

........ TABLE 2 IAQ data for the Flueless Appliances
Site No. Max.CO
(1 min data)
Max.NO2
(1 min data)
Max.CO2
(1 min data)
Relative
Humidity (%)
Temperature
(°C)
1 22 0.46 0.53 29 - 56 26.1– 32.3
2 0.5 0.16 0.32 37 - 55 14.7 – 21.3
3 2.5 0.16 0.38 45 - 64 14.9 – 19.5
4 3.5 0.17 0.58 31 - 68 17– 27.9
5 3 0.24 0.42 23 - 50 19.6 – 28.9
6 15.5 0.12 0.28 31 - 54 14.9– 22.4
7 3 0.30 0.35 40 - 53 16.6 – 22.3
8 3.5 0.22 0.24 26 - 54 9.2 – 23.1
9 16.5 0.36 0.48 36 - 58 14.4 – 19.3
10 1.50 0.23 0.35 38 - 53 15.2 – 23.1
6

Figure 1. Air Quality Survey Questionnaire
Name:
Home Address:
Details of Occupants: Number of Occupancy: Day: Night:
Name Age Cook Smoker (how many a
day)
Asthmatic Receiving medical treatment for asthma Length of time
suffered
Details of Dwelling:
Type of Dwelling: House Bungalow Flat
Det Semi Terrace/Town Det Semi Terrace/Town Floor No of Floors
The Type of Fuel Present in the Property:
Gas Electric Other Is the Property Near a
major/busy road:
Yes No
Size of room (meters)
Width Length Height
Ventilation in test room (wall vent, window, size)
Natural ventilation in test room (doors, windows)
Gas Appliance Details:
Type Age if known
Location Comments
Space Heater
Other Gas Appliances:
Date of Trial: Start End
7

8
Figure 2 Survey 1 – Air Quality Data(Green data - occupancy: data > 50 means the test room is occupied)
0
3
6
9
12
15
18
21
24
9:30 16:30 23:30 6:30 13:30 20:30 3:30 10:30
Time
CO
con
cent
ratio
n / p
pm
0
0.1
0.2
0.3
0.4
0.5
0.6
0.7
0.8
NO
2 con
cent
ratio
n / p
pm
0
10
20
30
40
50
60
70
80
90
100
9:30 16:30 23:30 6:30 13:30 20:30 3:30 10:30
Time
Rel
ativ
e H
umid
ity ,
%
0
4
8
12
16
20
24
28
32
36
40
Tem
pera
ture
, °C

9
Figure 3 Survey 2 – Air Quality Data(Green data - occupancy: data > 50 means the test room is occupied)
0
1
2
3
4
5
6
7
8
9
10
13:30 19:30 1:30 7:30 13:30 19:30 1:30 7:30
Time
CO
con
cent
ratio
n / p
pm
0
0.1
0.2
0.3
0.4
0.5
0.6
0.7
0.8
0.9
1
NO
2 con
cent
ratio
n / p
pm
0
10
20
30
40
50
60
70
80
90
100
13:30 19:30 1:30 7:30 13:30 19:30 1:30 7:30
Time
Rel
ativ
e H
umid
ity ,
%
0
3
6
9
12
15
18
21
24
27
30Te
mpe
ratu
re ,
°C

10
Figure 4 Survey 3 – Air Quality Data(Green data - occupancy: data > 50 means the test room is occupied)
0
1
2
3
4
5
6
7
8
9
10
14:30 20:30 2:30 8:30 14:30 20:30 2:30 8:30
Time
CO
con
cent
ratio
n / p
pm
0
0.1
0.2
0.3
0.4
0.5
0.6
0.7
0.8
0.9
1
NO
2 con
cent
ratio
n / p
pm
0
10
20
30
40
50
60
70
80
90
100
14:30 20:30 2:30 8:30 14:30 20:30 2:30 8:30
Time
Rel
ativ
e Hum
idity
, %
0
4
8
12
16
20
24
28
32
36
40Te
mpe
ratu
re ,
°C

11
Figure 5 Survey 4 – Air Quality Data(Green data - occupancy: data > 50 means the test room is occupied)
0
1
2
3
4
5
6
7
8
9
10
8:00 14:00 20:00 2:00 8:00 14:00 20:00 2:00 8:00
Time
CO
con
cent
ratio
n / p
pm
0
0.1
0.2
0.3
0.4
0.5
0.6
0.7
0.8
0.9
1
NO
2 con
cent
ratio
n / p
pm
0
10
20
30
40
50
60
70
80
90
100
8:00 14:00 20:00 2:00 8:00 14:00 20:00 2:00 8:00
Time
Rel
ativ
e Hum
idity
, %
0
4
8
12
16
20
24
28
32
36
40Te
mpe
ratu
re ,
°C

12
Figure 6 Survey 5 – Air Quality Data(Green data - occupancy: data > 50 means the test room is occupied)
0
1
2
3
4
5
6
7
8
9
10
8:00 14:00 20:00 2:00 8:00 14:00 20:00 2:00 8:00
Time
CO
con
cent
ratio
n / p
pm
0
0.1
0.2
0.3
0.4
0.5
0.6
0.7
0.8
0.9
1
NO
2 con
cent
ratio
n / p
pm
0
10
20
30
40
50
60
70
80
90
100
8:00 14:00 20:00 2:00 8:00 14:00 20:00 2:00 8:00
Time
Rel
ativ
e Hum
idity
, %
0
4
8
12
16
20
24
28
32
36
40Te
mpe
ratu
re ,
°C

13
Figure 7 Survey 6 – Air Quality Data(Green data - occupancy: data > 50 means the test room is occupied)
0
2
4
6
8
10
12
14
16
18
20
19:00 3:00 11:00 19:00 3:00 11:00 19:00
Time
CO
con
cent
ratio
n / p
pm
0
0.1
0.2
0.3
0.4
0.5
0.6
0.7
0.8
0.9
1
NO
2 con
cent
ratio
n / p
pm
0
10
20
30
40
50
60
70
80
90
100
19:00 3:00 11:00 19:00 3:00 11:00 19:00
Time
Rel
ativ
e H
umid
ity ,
%
0
4
8
12
16
20
24
28
32
36
40Te
mpe
ratu
re ,
°C

14
Figure 8 Survey 7– Air Quality Data(Green data - occupancy: data > 50 means the test room is occupied)
0
2
4
6
8
10
12
14
16
18
20
9:00 17:00 1:00 9:00 17:00 1:00 9:00
Time
CO
con
cent
ratio
n / p
pm
0
0.1
0.2
0.3
0.4
0.5
0.6
0.7
0.8
0.9
1
NO
2 con
cent
ratio
n / p
pm
0
10
20
30
40
50
60
70
80
90
100
9:00 17:00 1:00 9:00 17:00 1:00 9:00
Time
Rel
ativ
e H
umid
ity ,
%
0
4
8
12
16
20
24
28
32
36
40Te
mpe
ratu
re ,
°C

15
Figure 9 Survey 8 – Air Quality Data(Green data - occupancy : data > 50 means the test room is occupied)
0
1
2
3
4
5
6
7
8
9
10
9:00 17:00 1:00 9:00 17:00 1:00 9:00 17:00 1:00 9:00
Time
CO
con
cent
ratio
n / p
pm
0
0.1
0.2
0.3
0.4
0.5
0.6
0.7
0.8
0.9
1
NO
2 con
cent
ratio
n / p
pm
0
10
20
30
40
50
60
70
80
90
100
9:00 17:00 1:00 9:00 17:00 1:00 9:00 17:00 1:00 9:00
Time
Rel
ativ
e H
umid
ity ,
%
0
5
10
15
20
25
30
35
40
45
50
Tem
pera
ture
, °C

16
Figure 10 Survey 9 – Air Quality Data(Green data - occupancy : data > 50 means the test room is occupied)
0
10
20
30
40
50
60
70
80
90
100
6:43 20:43 10:43 0:43 14:43 4:43 18:43 8:43
Time
Rel
ativ
e Hum
idity
, %
0
5
10
15
20
25
30
35
40
45
50
Tem
pera
ture
, °C
0
2
4
6
8
10
12
14
16
18
20
6:43 20:43 10:43 0:43 14:43 4:43 18:43 8:43
Time
CO
con
cent
ratio
n / p
pm
0
0.1
0.2
0.3
0.4
0.5
0.6
0.7
0.8
0.9
1
NO
2 con
cent
ratio
n / p
pm

17
Figure 11 Survey 10 – Air Quality Data(Green data - occupancy : data > 50 means the test room is occupied)
0
1
2
3
4
5
6
7
8
9
10
9:00 15:00 21:00 3:00 9:00 15:00 21:00 3:00 9:00
Time
CO
con
cent
ratio
n / p
pm
0
0.1
0.2
0.3
0.4
0.5
0.6
0.7
0.8
0.9
1
NO
2 con
cent
ratio
n / p
pm
0
10
20
30
40
50
60
70
80
90
100
9:00 15:00 21:00 3:00 9:00 15:00 21:00 3:00 9:00
Time
Rel
ativ
e H
umid
ity ,
%
0
5
10
15
20
25
30
35
40
45
50
Tem
pera
ture
, °C

Figure 12 Carbon Dioxide data
Survey 1 - Inferred CO2 levels using O2 data
Car
bon
Dio
xide
Con
cent
ratio
n / %
1.00
0.90
0.80
0.70
0.60
0.50
0.40
0.30
0.20
0.10
0.00 9:30 16:30 23:30 6:30 13:30 20:30 3:30 10:30
Time
Survey 2 - Inferred CO2 levels using O2 data
Car
bon
Dio
xide
Con
cent
ratio
n / %
1.00 0.90 0.80 0.70 0.60
0.50 0.40 0.30 0.20 0.10 0.00
13:30 19:30 1:30 7:30 13:30 19:30 1:30 7:30
Time
18

Figure 13 Carbon Dioxide data
Survey 3 - Inferred CO2 levels using O2 data
Car
bon
Dio
xide
Con
cent
ratio
n - %
1.00 0.90 0.80 0.70 0.60 0.50 0.40 0.30 0.20 0.10 0.00
14:30 20:30 2:30 8:30 14:30 20:30 2:30 8:30
Time
Survey 4 - Inferred CO2 levels using O2 data
Car
bon
Dio
xide
Con
cent
ratio
n - %
1.00
0.90
0.80
0.70
0.60
0.50
0.40
0.30
0.20
0.10
0.00 8:00 14:00 20:00 2:00 8:00 14:00 20:00 2:00 8:00
Time
19
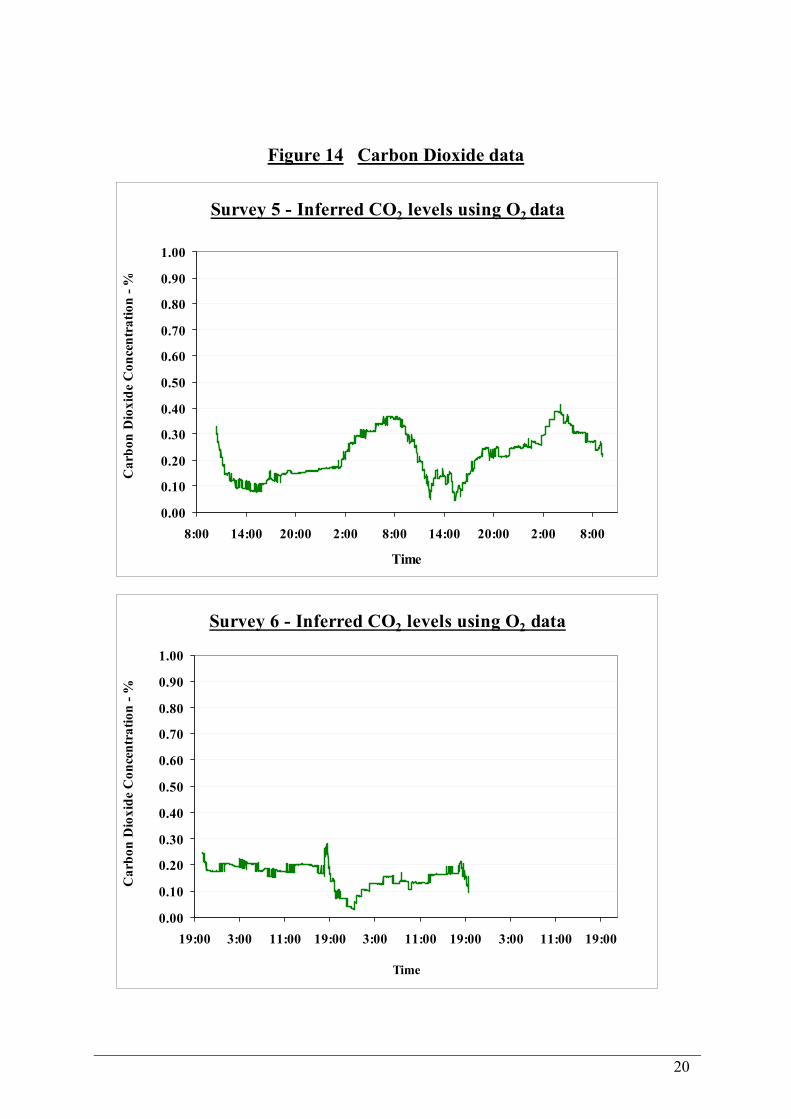
Figure 14 Carbon Dioxide data
Survey 5 - Inferred CO2 levels using O2 data
Car
bon
Dio
xide
Con
cent
ratio
n -%
1.00
0.90
0.80
0.70
0.60
0.50
0.40
0.30
0.20
0.10
0.00 8:00 14:00 20:00 2:00 8:00 14:00 20:00 2:00 8:00
Time
Survey 6 - Inferred CO2 levels using O2 data
Car
bon
Dio
xide
Con
cent
ratio
n -%
1.00
0.90
0.80
0.70
0.60
0.50
0.40
0.30
0.20
0.10
0.00 19:00 3:00 11:00 19:00 3:00 11:00 19:00 3:00 11:00 19:00
Time
20

Figure 15 Carbon Dioxide data
Survey 7 - Inferred CO2 levels using O2 data
Car
bon
Dio
xide
Con
cent
ratio
n -%
1.00
0.90
0.80
0.70
0.60
0.50
0.40
0.30
0.20
0.10
0.00 9:00 17:00 1:00 9:00 17:00 1:00 9:00
Time
2 2Survey 8 - Inferred CO levels using O data
0.00
0.10
0.20
0.30
0.40
0.50
0.60
0.70
0.80
0.90
1.00
9:00 17:00 1:00 9:00 17:00 1:00 9:00 17:00 1:00 9:00
Time
Car
bon
Dio
xide
Con
cent
ratio
n - %
21

Figure 16 Carbon Dioxide data
Survey 9 - Inferred CO2 levels using O2 data C
arbo
n D
ioxi
de C
once
ntra
tion
-%
1.00
0.90
0.80
0.70
0.60
0.50
0.40
0.30
0.20
0.10
0.00 6:43 20:43 10:43 0:43 14:43 4:43 18:43 8:43
Time
Survey 10 - Inferred CO2 levels using O2 data
0.00
0.10
0.20
0.30
0.40
0.50
0.60
0.70
0.80
0.90
1.00
Car
bon
Dio
xide
Con
cent
ratio
n - %
9:00 15:00 21:00 3:00 9:00 15:00 21:00 3:00 9:00
Time
22

Printed and published by the Health and Safety ExecutiveC30 1/98
Printed and published by the Health and Safety Executive C1.10 08/04

ISBN 0-7176-2567-2
RR 23
78071 7 625 673£25.00 9


![Detecting Carbon Monoxide Poisoning Detecting Carbon ...2].pdf · Detecting Carbon Monoxide Poisoning Detecting Carbon Monoxide Poisoning. ... the patient’s SpO2 when he noticed](https://img.pdfslide.us/doc/110x75/5a78e09b7f8b9a21538eab58/detecting-carbon-monoxide-poisoning-detecting-carbon-2pdfdetecting-carbon.jpg)


![Detecting Carbon Monoxide Poisoning Detecting Carbon ...2].pdf · Detecting Carbon Monoxide Poisoning Detecting Carbon Monoxide Poisoning. Detecting Carbon Monoxide Poisoning C arbon](https://img.pdfslide.us/doc/110x75/5f551747b859172cd56bb119/detecting-carbon-monoxide-poisoning-detecting-carbon-2pdf-detecting-carbon.jpg)