Embed Size (px)
Citation preview

Flowcharting
Paul KingV. U. School of Engineering
Paul KingV. U. School of Engineering

Overview
This Lecture will overview flowcharting of processes.
Elementary to detailed charting will be covered.

Why Flowchart???
Document the process. Allow study of roadblocks Allow display of timing & conditionals. Provide a communication tool.
Examples to follow:
Hinge Manufacture Hypertension Clinic #1 Hypertension Clinic #2 The ideal? ABET Diagram Breast Cancer Clinic.

8:50 PM
Friday, February 25, 1994
Page 1
C:\ABC\SAMPLES\PROCHART.AF3
Step 3B: Hinge Adaptation
Tacoma facility procedure
Reach for pin with left hand
Grasp pin at midpoint
Reach for spacer with right hand
Grasp spacer
Slide spacer onto pin until spacer is seated firmly
Hold subassembly
Carry to hinge assembly
Press footpedal of hinge opener
Wait for hinge to open
Slide pin into cavity of hinge assembly
Release footpedal
Operate Transport IdleStore

Hypertension Clinic - Flow Study #1 Patient enters, signs in, waits in waiting room until
called Patient goes to weigh-in room, weight & pulse rate
taken, medications reviewed (RN). Patient goes to new waiting room. Patient is sent to room, put on bed, lights out, 2
minute wait, BP taken (RN). Patient to waiting room Patient to clinic room ...

Hypertension Clinic - Flow Study #1, Continued Patient interviewed by MD or Resident/MD,
BP taken? Patient medications reviewed, lifestyle,
needs. Patient discharged & rescheduled and tests
ordered if necessary or admitted...

Sign-In weight & pulse & meds
wait in room
1
Wait room
2RN BP check
wait room
2
MD interaction
wait for MD
resched, etc
Simplistic Representation of Hypertension Clinic #1
1 2 3
4
Delay 1 2-10Delay 2 2-20Delay 3 5-20Delay 4 5-20
Overall waiting time: 14-70
Actual patient interaction 7
Flowchart: Hypertension Clinic # 1

Discussion
Using delay symbols for patient wait states stresses delays
Each delay is in fact a wait for event, simplified here.
Waiting times may be expressed as here, or as color bars for easy identification of outlier cases
Actual overall waiting times have ranged up to 100 minutes

Sign-In weight & pulse & meds
& BP
wait in room
1
wait room
2
MD interaction
resched, etc
Simplistic Representation of Hypertension Clinic #2
1 2 3
wait in room
Delay 1 2-10Delay 2 2-20Delay 3 5-20
Overall waiting time: 9-50
Actual patient interaction 7
Flowchart: Hypertension Clinic #2

Discussion
Using delay symbols for patient wait states stresses delays
Overall delay time has dropped. Delay 2 & 3 may be combined... Actual overall waiting times have decreased

Sign-Inweight &
pulse & meds & BP
MD interaction
resched, etc
Ideal Hypertension Clinic?
1
wait room
2
Data needed?
MD needed?
RN Needed?
Wait for RN
RN Interaction
Update Meds
2
Time in-out 7-20
Future Clinic Structure?

Discussion
While the chart is more complicated, the process is easier for most patients.
MD time is utilized for “needy” patients. RN time is used for less needy. Many patients will be status quo. This is approximately the dentist office
model..

The Two Loops of EC2000
Establish Indicatorsthat Objectives are
Being Achieved
Determine HowOutcomes will be
Assessed
Determine HowOutcomes will be
Achieved
Determine OutcomesRequired to Achieve
Objectives
Determine educational objectives
Evaluate/Assess
Input fromConstituencies
Formal InstructionStudent Activities

Discussion
Flowcharting in this fashion is far more powerful than the written text.
Flowcharts can be used to make a point of interactions between several factors.

Typical Undergraduate Flowcharting Project Breast center, 50 patients a day Categorize (normal v next step) Interview a subset Observe interactions and flow over three months Walk through the problem. Interview staff. Flowchart data, analyze data, recommend
changes.
PATIENT FLOW ANALYSIS OF VANDERBILTBREAST CENTER
Michelle E. Kandcer, B.S.Doris Quinn, PhD, Advisor

PROJECT DEFINITION
The goal of this project is to assess and to improve the patient flow process in Vanderbilt’s Breast Cancer Center. Patient responses will be of significant consideration.

OBJECTIVES
To create a flowchart in (Micrografx Flow-Charter 7.0) that will describe the current patient flow process.
To highlight weaknesses of the process.
To emphasize (on the flowchart) patients’ feelings regarding the process.
To make suggestions as to how to improve the current process.

SIGNIFICANCE
The American Cancer Society estimates that 178,700 women will be diagnosed with breast cancer this year alone and that 3,900 of these women will be from Tennessee. Furthermore, another 43,500 women will die because of this disease. *
Currently, more than 50 women per day utilize services provided by the Cancer Center.

WORK COMPLETEDFlow of Pre -Registration
Phone Call
PhysicianAppts
Dx Procedures
- Screening- Dx - Consult
Schedule ApptAuthorization
Needed?
Call Patient's PCP
Yes
No
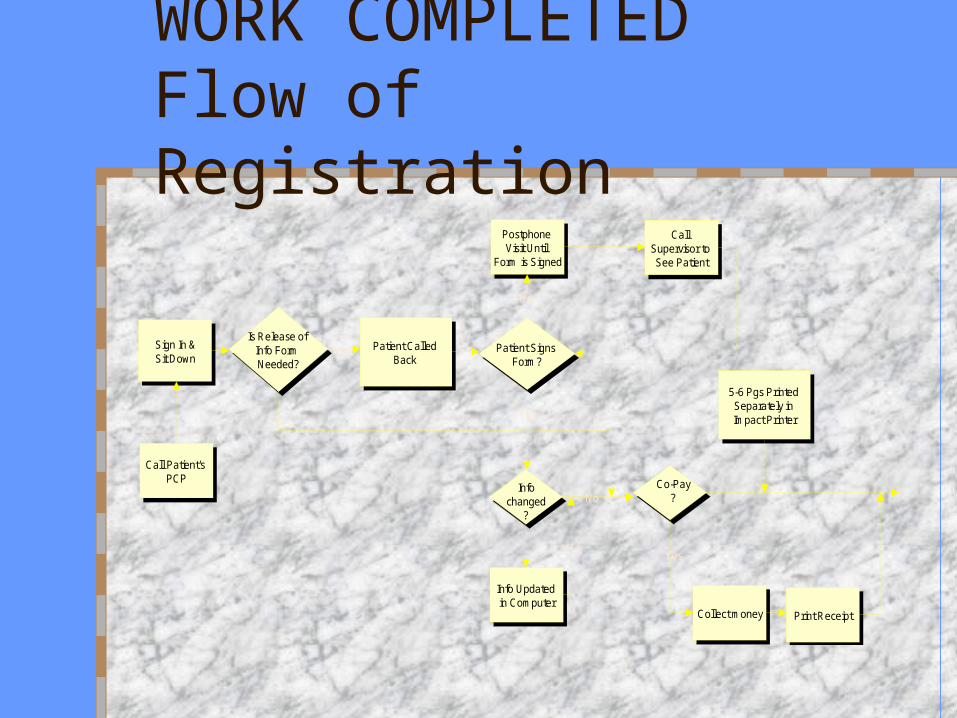
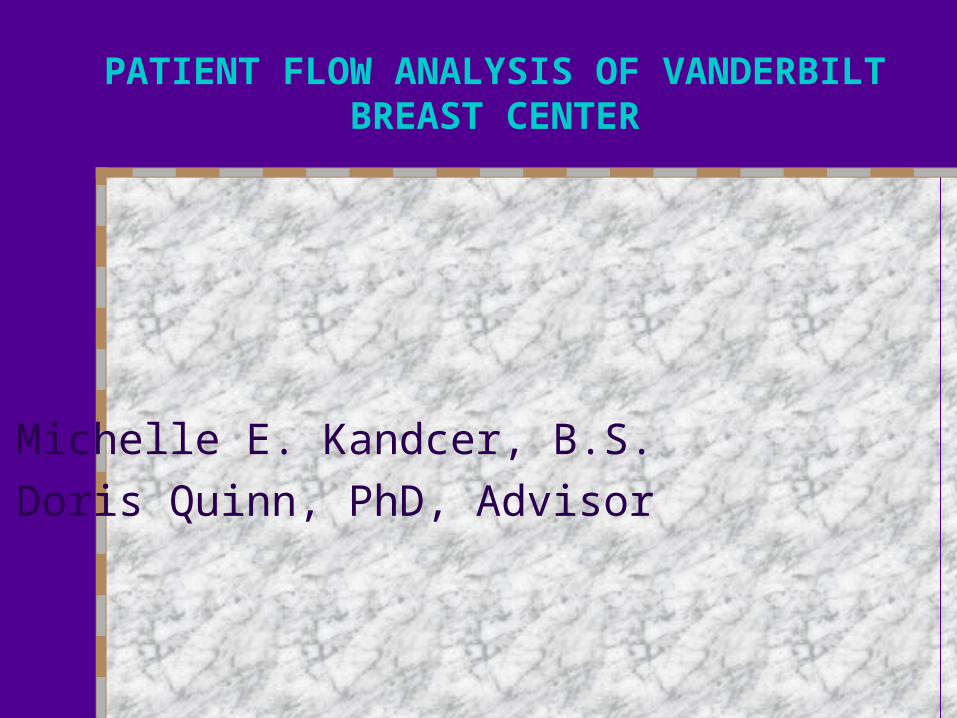
WORK COMPLETEDFlow of Registration
Sign In &Sit Down
Patient Called Back
Infochanged
?
Co-Pay?
Collect money
Info Updated in Computer
No
Print Receipt
Call Patient's PCP
Patient Signs Form?
Postphone Visit Until
Form is Signed
5-6 Pgs Printed Separately in Impact Printer
Call Supervisor to See Patient
Is Release of Info Form Needed?
Yes
YesYes
No
YesYes

WORK COMPLETEDProcess Flow for those Needing Mammograms
Machine available for
mammogram?
WAIT
Patient to Dressing
Room
Images Taken
Patient Waits in Dressing Room
While Film Develops
Radiologist Reviews Views
and Patient Waits
Results Given To Patient By
Radiologist
Results OK?
Technologist Checks Films
Additional Views
Needed?
Yes
Results OK?No
Tech Picks Up Paperwork after Ring
and Determines Screening vs.
Diagnostic
Front Desk Alerts Techs that
Paperwork is in Box by Ringing Phone
Yes
No
DISCHARGE
No
Yes
No
yes

WORK COMPLETEDProcess Flow for those Needing Mammograms (continued)
DISCHARGE
To Ultrasound Suite
Radiologist Performs U/S When He is
Available
Patient Given Results
Ultrasound Needed?
Yes
Patient Need to Be Seen? No
Does Patient Have Appt?
Yes
Patient Put in Room
Patient Seen by MD
Yes
Appt Available?
Reschedule ASAP
Yes
NoNo
No

WORK COMPLETED Process Flow for those NotNeeding Mammograms
H & P DoneBSE taught
Review Imaging
Present info to attending
Attending sees patient
Chaperone/ Tech Needed
?
Exam, questions, etc.
(Initial) Clinician Available?
Yes
Yes
WAIT
Room Available?
Put Patient in Room
WAIT
Chaperone Available?
No
No Yes
WAIT
No
No
Yes

WORK COMPLETED Process Flow for those NotNeeding Mammograms (continued)
Tests, procedures
needed?
Schedule to do - test procedures
Results available
?
Call back - follow up appt
(Nurse may not be available during
day)
*
Surgeryneeded
?
H &P
Results given & follow up (if
needed)
Yes No
Yes
DISCHARGE
Yes
No
Schedule VPEC
Possible Add'l Views or U/S or Core Bx or
U/S Guided Aspiration as
Needed by Clinician
Back to Clinic Exam Room
No


Summary
Flowcharting works!. Flowcharting is a useful tool.