Embed Size (px)
Citation preview

PRODUCEDWATEREVENTS.COM
Flowback and Produced Water Treatment for Recycle and Discharge to the Environment
Lisa Henthorne, P.E.

Outline
2
Project Background
Pilot Overview
Pilot Approach and Treatment Options
Pilot Results Summary
Focus on Field Sampling Methods
Conclusions

Project Background
3
Pilot required to permit fixed facility due to state
regulatory requirements and stringent discharge water
quality coupled with complex feed water quality:
• Treat produced and flowback water to discharge
standards for the nearby river
• Treated water to be re-used in their operations
• Validate Monarch Separators proposed technologies’
ability to consistently meet discharge requirements
• De-risk and confirm inlet water quality for full-scale
fixed facility
• De-risk cost of facility: CAPEX and OPEX
Project Goals and Challenges
4
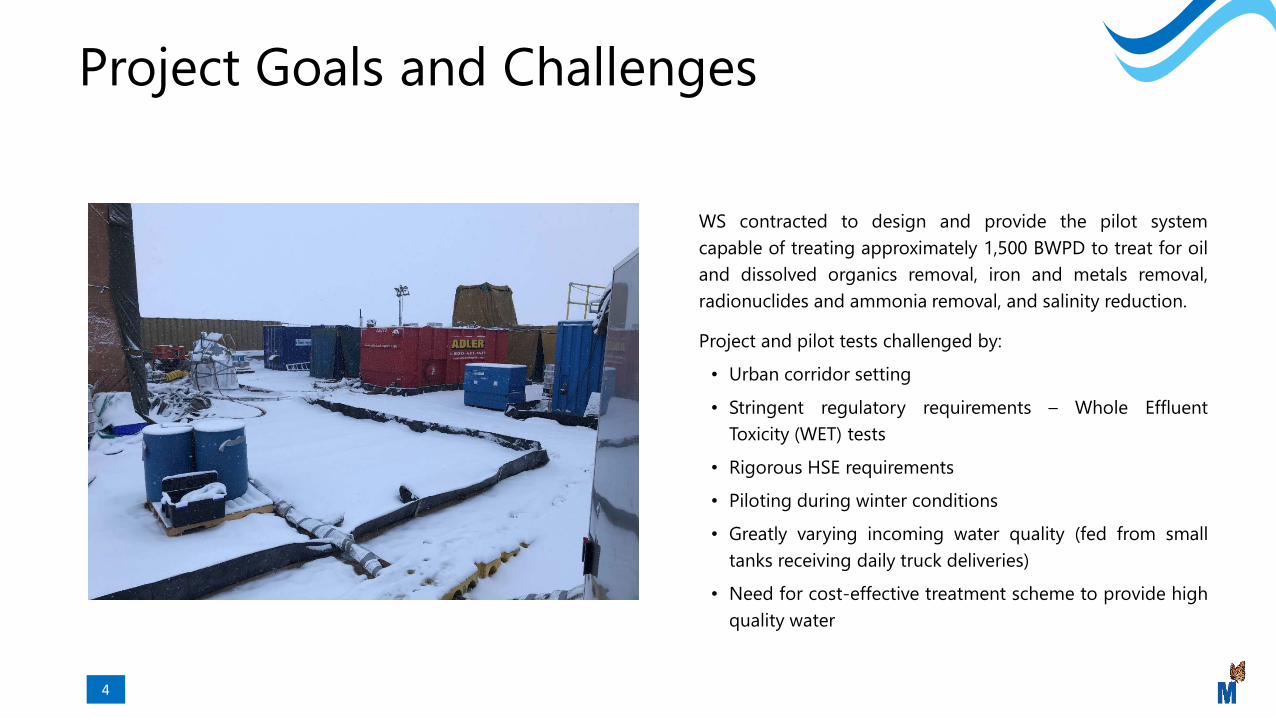
WS contracted to design and provide the pilot system
capable of treating approximately 1,500 BWPD to treat for oil
and dissolved organics removal, iron and metals removal,
radionuclides and ammonia removal, and salinity reduction.
Project and pilot tests challenged by:
• Urban corridor setting
• Stringent regulatory requirements – Whole Effluent
Toxicity (WET) tests
• Rigorous HSE requirements
• Piloting during winter conditions
• Greatly varying incoming water quality (fed from small
tanks receiving daily truck deliveries)
• Need for cost-effective treatment scheme to provide high
quality water

Pilot Approach
5
Conduct Bench-Scale Testing
Develop Treatment
Regime and Build-up Cost Structure to Ensure Cost Effectiveness
Multi-prong approach for Removal of Difficult
Constituents
Pilot to compare performance of different
technologies
Determine if stand-alone or multi-barrier/Series
Build Pilot Unit
Develop Pilot Protocol, KPI’s
and Experimental
Design
Conduct Pilot With Constant Vigilance Over Performance
How To Develop the Most Cost-effective, Reliable Treatment System
Be Willing to Adapt (Quickly)!

Targeted Treatment Scheme
6
Measuring Performance Versus Cost for Different Treatment Options
Constituent Technology Options Piloted
Free oil Flocculant, Dissolved Air Flotation (DAF), Nutshell Filter (NSF)
Iron and metals Oxidant, Flocculant, DAF, NSF
TSS Oxidant, Flocculant, DAF, NSF
BTEX NSF, Granulated Activated Carbon (GAC), Advanced Oxidation Process (AOP), MBR, RO
Bacteria Oxidant
Nitrogen Ammonia, Nitrate, Nitrite at MBR, RO, AOP
Radionuclides Flocculant, DAF, RO
Inorganic salts RO

Where we started…
7
Test Duration, weeks 11 Ra
w F
ee
d
DA
F E
fflu
en
t
Nu
t Sh
ell
Filt
rate
GA
C E
fflu
en
t
Tre
ate
d P
rod
uce
d
Wa
ter
MB
R E
fflu
en
t
EA
OP
Eff
lue
nt
Fro
th
Act
iva
ted
Slu
dg
e
EA
OP
So
lids
Parameter Instrument Test Range 1 2 3 4 5 6 7 8 9 10 MethodMethod
Duration, minTotal Samples
Total Operator
Time, hr
Ammonia Hach DR900 0.4 - 50.0 mg/L NH3-N d d d 10031 Test 'N Tube HR Salicylate 20 231 77
Nitrate Hach DR900 0.3 - 30.0 mg/L NO3--N d d d 8039 Powder Pillows or AccuVac® Cadmium Reduction 6 231 23
Nitrite Hach DR900 2 - 150 mg/L NO₂⁻ HR d d d 8153 Colorimeter Powder Pillows HR Ferrous Sulfate 10 231 39
Total Kjeldahl Nitrogen (Organic Nitrogen) Hach DR900 1 - 150 mg/L TKN d d d 8075 TKN, Nessler 3 231 12
Total Phosphorous Hach DR900 0.3 - 45.0 mg/L PO4 d d d 8114 Reagent or AccuVac Molybdovanadate 7 231 27
Total Alkalinity
Myron L Ultrameter III
(Mike to cost titration
method)
0-100 mg/L w w d d dTitration (Reagents)
A1, sulfuric acid10 253 42
Hach DR900/DRB200 20 - 700 mg/L C w 10128 HR, Colorimeter Test 'N Tube Direct 120 11 22
Hach DR900/DRB200 15 - 150 mg/L C w w w 10173 MR, Test 'N Tube Direct 120 33 66
Total Hardness Myron L Ultrameter III 0-200 mg/L w w w
Titration (Reagents)
C1, hydrochloric acid
H1, Caustic
H2, EDTA 5%
H3, EDTA 10%
20 33 11
Total Petroleum HydrocarbonsSpectro Scientific InfraCal2
ATR-SP0.3-1000 mg/L d d d d Solvent Extraction 15 308 77
BTEX 0 0
Aluminum Hach DR900 0.01 - 0.80 mg/L Al₃+ w w w 8012 Colorimeters, Powder Pillows 20 33 11
Hach DR900 0.1 - 300.0 mg/L Fe d d 10249 FerroVer® Powder Pillows 3 154 8
Hach DR900 0.02 - 3.00 mg/L Fe w w w 8008 FerroVer® Powder Pillows or AccuVac 3 33 2
Manganese Hach DR900 0.006 - 0.700 mg/L Mn d d d w w 8149 Powder Pillows PAN Method 2 253 8
Strontium 0 0
Calcium 0 0
Magnesium 0 0
Sodium 0 0
Potassium Hach DR900 0.1 - 700 mg/L K w w w w 8049 colorimetric Powder Pillow-LR-MR-HR For oil and gas field waters 3 44 2
Chloride 0 0
Fluoride Hach DR900 0.02 - 2.00 mg/L F- w w w w 10225 SPADNS 2, Reagent Solution or AccuVac 1 44 1
Sulfate Hach DR900 2 - 7000 mg/L SO₄ ²- w w w w 10248 Powder Pillows LR-MR-HR SulfaVer 4 5 44 4
Bromide Hach DR900 0.05 - 4.50 mg/L Br₂ w w w w 8016 DPD Method, PP or AccuVac 3 44 2
Total Dissolved Solids or EC Myron L Ultrameter III 0-200 g/L or 0-200 mS/cm d d d d Direct Measure 1 308 5
Total Sulfide Hach DR900 0.01 - 70 mg/L S²- d w w w 10254 Methylene Blue 5 110 9
Gross Alpha 0 0
Radium 226 0 0
pH Myron L Ultrameter III 0-14 s.u. d d d d d Direct Measure 1 385 6
Turbidity (surrogate for TSS) Hach 2100Q 0-1000 NTU d d d d d d d Direct Measure 1 0 0
Biological Oxygen Demand (5 Day) 0 0
Chemical Oxygen Demand Hach DR900/DRB200 20 - 1500 mg/L w w w w 8000 Reactor Digestion 120 44 88
Whole Effluent Toxicity 0 0
Treated Water Waste Streams
Sample Location (Weekly, Monthly or Daily)
Total Organic Carbon
Iron

Focus: Managing Operations & Costs
8

Turbidity, Conductivity and ORP
9
Primary field measurement
Influent samples
DAF effluent
Nutshell effluent
MBR filtrate
RO permeate
Average sample time ~ 2 minutes
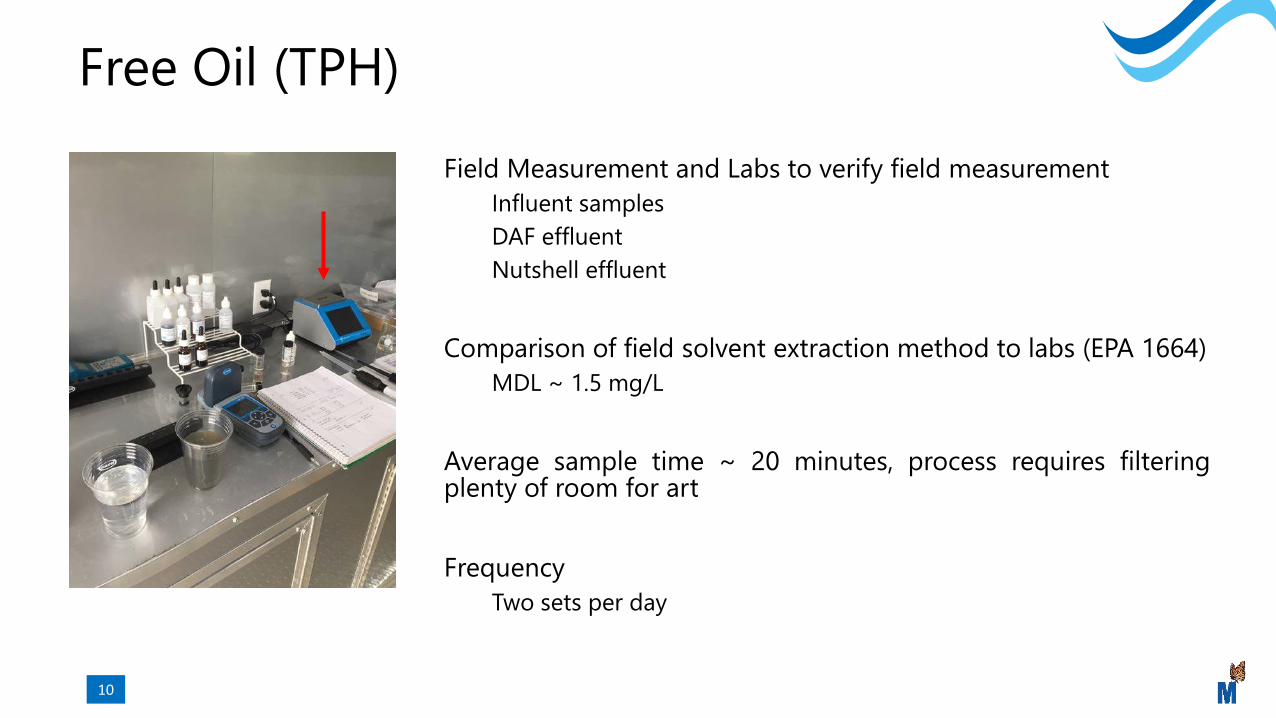
Free Oil (TPH)
10
Field Measurement and Labs to verify field measurementInfluent samples
DAF effluent
Nutshell effluent
Comparison of field solvent extraction method to labs (EPA 1664)MDL ~ 1.5 mg/L
Average sample time ~ 20 minutes, process requires filteringplenty of room for art
FrequencyTwo sets per day
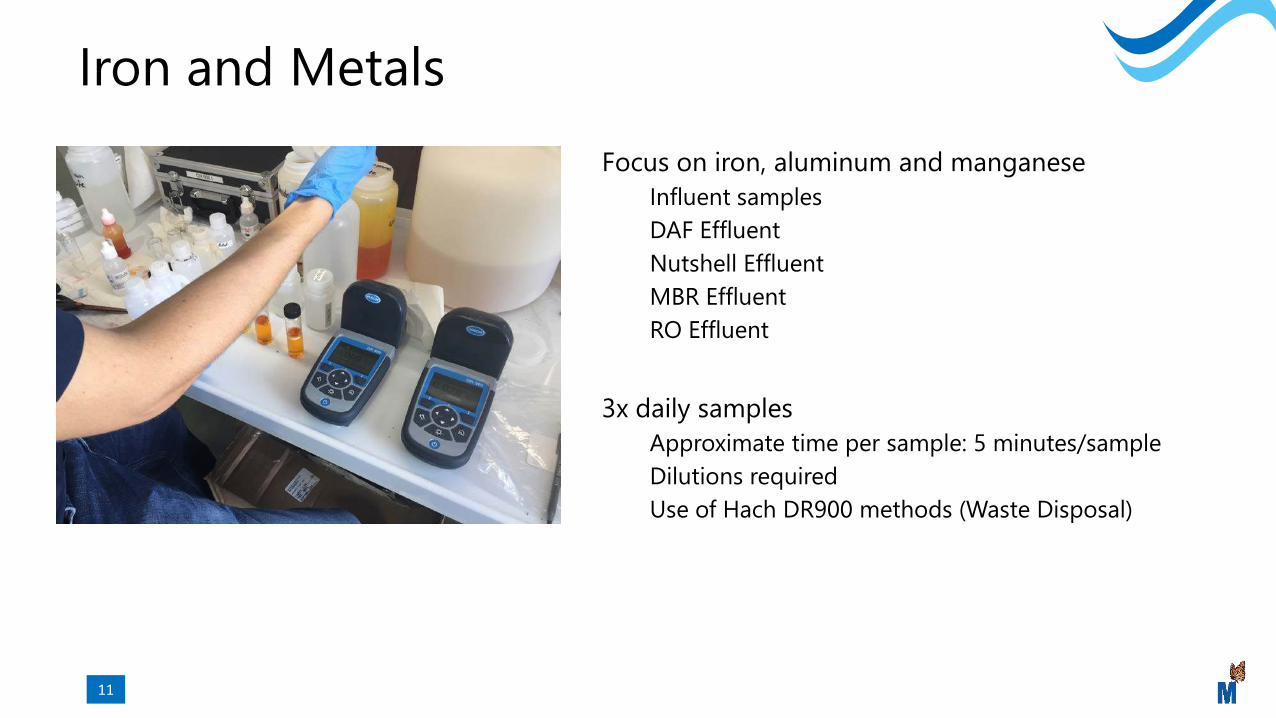
Iron and Metals
11
Focus on iron, aluminum and manganeseInfluent samples
DAF Effluent
Nutshell Effluent
MBR Effluent
RO Effluent
3x daily samplesApproximate time per sample: 5 minutes/sample
Dilutions required
Use of Hach DR900 methods (Waste Disposal)

TSS Testing
12
Sample prep is critical.
Filter pad preparation, volumetric consistency. Verification of drying.
Issues with consistency of results both labs and fields for very salty waters (Permian Basin)

Ammonia, Nitrate, Nitrite and Phosphate
13
Focus on biological process performanceNutshell Effluent
MBR Effluent
RO Permeate
Heavily utilized during biological conditioning
Approximate time per sample: 30 minutes for color development for ammonia
5 minutes nitrate, nitrite
Use of Hach DR900 methods (Waste Disposal)

COD and TOC Testing
14
Focus on biological process performanceNutshell Effluent
MBR Effluent
RO Effluent
Heavily utilized during biological conditioning
Approximate time per sample: 30 minutes prep/measurement plus heating requires 2 hours.
Different heating processes for COD and TOC
Sample interreferences.
Use of Hach DR900 methods (Waste Disposal)

Testing Lessons Learned
15
Cost effective analyzers are available to handle a lot analytes.
Very cost effective in comparison to lab data.
Very rapid results, better understanding of pilot performance.
Sample disposal costs need to be considered.
Need to evaluate sampling requirements of an upset.

Pilot Treatment Results
16
• Treating 300-650 NTU turbidity to less than 1 NTU
• Treating iron from 35 mg/L to less than 1 mg/L
• Alginate flocculent dosing of 5-7 mg/L for produced water
• Treating Oil in Water to less than 1 mg/L in DAF
• Flocculant/coagulant cost (dosing of 5 mg/L) less than $.05/bbl treated water
• Oxidant dosing of 10-25 mg/L, high dosing levels during upset conditions (cross-linked polymer slugs)
• 100% BTEX and TOC removal upstream of RO, 99+% salt removal in RO, 100% ammonia removal in RO
• Pass WET tests!!!
Before and After Treatment:
Blend of Produced and
Flowback Water
Flocculation in Action

Pilot Conclusions
17
Cutting Costs with Conventional Treatment Combined with Novel Technologies
• The growing volumes of produced water and flowback, combined with restricted SWD usage, are driving operators to
more creative disposal options
• Cost-effective treatment schemes are available which provide improved recycle water quality, and that can serve as the
backbone for more rigorous treatment, if needed. For cost-effective discharge, target flowback/produced water under
50,000 mg/L salinity
• Keep it simple for recycle treatment but ensure ability to address large swings in flowback/produced water quality
• Minimize operator intervention to keep costs low, i.e. automation where practical
• For discharge option, water quality is not just what you can easily measure/monitor. Think like a fathead minnow and a
daphnia.
• Last, but not least, a pilot of this level of optionality requires a multi-disciplined, experienced (and relentless) team!

PRODUCEDWATEREVENTS.COM
Lisa Henthorne, [email protected]
Valentina [email protected]
Corporate Office4265 San Felipe | Suite 620
Houston, TX 77027+1.713.400.4777