Embed Size (px)
Citation preview
Intl. J. River Basin Management Vol. 4, No. 3 (2006), pp. 179–189
© 2006 IAHR, INBO & IAHS
Flow regime requirements and the biological effectiveness of habitat-basedminimum flow assessments for six riversIAN G. JOWETT, National Institute of Water and Atmospheric Research, P.O. Box 11-115, Hamilton, New Zealand.E-mail: [email protected]
BARRY J.F. BIGGS, National Institute of Water and Atmospheric Research, P.O. Box 8602, Christchurch, New Zealand.E-mail: [email protected]
ABSTRACTSustaining instream values when there is demand for out-of-stream water use is challenging for water resource managers and often there is considerabledebate about the methods used to assess flow requirements. Recommendations for flow regime requirements for benthic invertebrates, trout andindigenous fish were made using instream habitat analyses in six New Zealand rivers. We review the results of studies that were carried out to examinethe response of aquatic communities to the flow changes. Although the biological data may not be scientifically rigorous in all cases, the weight ofevidence from the various sources indicates that in 5 out of the 6 cases, the biological response and the retention of desired instream values, wasachieved using the habitat-based methods for setting flows. Indeed, there were increases in trout and benthic invertebrate abundance and changesto the invertebrate community structure in the rivers with successful outcomes. In some cases, flows and flow variability were far from natural, yetexcellent trout and invertebrate communities were sustained by the modified flow regimes. High (i.e., flushing) flows were beneficial for cleansing finesediment deposits and filamentous algae in one river where this regime was recommended and in one case uncontrolled spring floods were necessaryto open the river mouth and allow recruitment of diadromous fish species.
Keywords: Minimum flow assessment; instream habitat; flow regime.
Introduction
Rivers have high instream ecological, cultural, landscape, scenic,and amenity values such as angling, boating and other recre-ational activities. There are, of course, overlaps and linkagesamong various instream values and they differ in the extent towhich they are influenced by variations in flow regime. How-ever, all ‘flow-related values’ change in a discernible way as flowchanges. For example, the value of a particular river as a fisherymay decline as flow declines, because the area of suitable habitatdeclines. At the other end of the scale, increasing flow also maymake the river increasingly unattractive for angling, and therecan be a range of flows that is preferred or optimal for the sport[1]. ‘Flow-independent values’ change to a minor or no extentas the flow changes. Factors like water quality, water temper-ature and the micro-distribution of turbulence and velocity alsochange with flow, but often the flow-related changes are small andsometimes the biological effects are difficult to predict becauseof the large natural variation in these factors and the tolerancesof aquatic organisms.
Sustaining instream values when there is demand for out-of-stream water use is challenging for water resource managers.‘Sustain’ means different things to different people. Moreover,it is difficult to sustain all values at original levels when flows
Received on December 23, 2004. Accepted on June 1, 2005.
179
change. It is naïve to expect that instream habitat conditions andthe stream ecosystem will remain exactly the same once a flowregime is altered. It also needs to be appreciated that often there isno clearly identifiable point at which instream conditions becomeuntenable as flows are reduced, except when rivers cease flowing.In the face of this knowledge, the challenge is to determine thedegree of change in flow and instream conditions before instreamvalues are eroded noticeably and reach levels that dissatisfycommunity interests. Science presently can provide only partialanswers for this problem and some decision-making is necessar-ily arbitrary and influenced by stakeholder politics as a result.
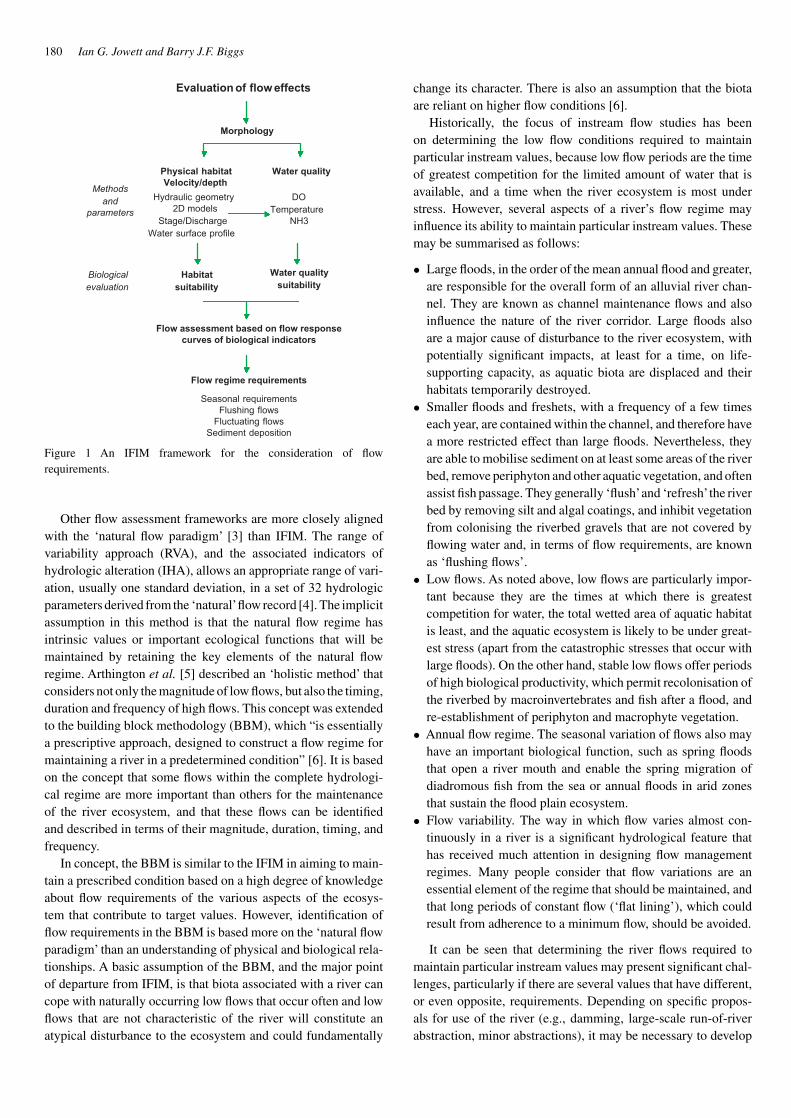
Long-term solutions to river flow management need to takea holistic view of the river system, including geology, fluvialmorphology, sediment transport, riparian conditions, biologicalhabitat and interactions, and water quality, both in temporal andspatial domains. The instream flow incremental methodology(IFIM [2]) is an example of an interdisciplinary framework thatcan be used in a holistic way to determine an appropriate flowregime by considering the effects of flow changes on instreamvalues, such as river morphology, physical habitat, water tem-perature, water quality, and sediment processes (Fig. 1). Its userequires a high degree of knowledge about seasonal and life-stagehabitat requirements of species and inter-relationships of thevarious instream values or uses.
180 Ian G. Jowett and Barry J.F. Biggs
Morphology
Evaluation of flow effects
Water quality
Methodsand
parameters
DOTemperature
NH3
Biologicalevaluation
Water qualitysuitability
Flow regime requirements
Seasonal requirementsFlushing flows
Fluctuating flowsSediment deposition
Habitatsuitability
Physical habitatVelocity/depth
Hydraulic geometry2D models
Stage/DischargeWater surface profile
Flow assessment based on flow responsecurves of biological indicators
Figure 1 An IFIM framework for the consideration of flowrequirements.
Other flow assessment frameworks are more closely alignedwith the ‘natural flow paradigm’ [3] than IFIM. The range ofvariability approach (RVA), and the associated indicators ofhydrologic alteration (IHA), allows an appropriate range of vari-ation, usually one standard deviation, in a set of 32 hydrologicparameters derived from the ‘natural’flow record [4]. The implicitassumption in this method is that the natural flow regime hasintrinsic values or important ecological functions that will bemaintained by retaining the key elements of the natural flowregime. Arthington et al. [5] described an ‘holistic method’ thatconsiders not only the magnitude of low flows, but also the timing,duration and frequency of high flows. This concept was extendedto the building block methodology (BBM), which “is essentiallya prescriptive approach, designed to construct a flow regime formaintaining a river in a predetermined condition” [6]. It is basedon the concept that some flows within the complete hydrologi-cal regime are more important than others for the maintenanceof the river ecosystem, and that these flows can be identifiedand described in terms of their magnitude, duration, timing, andfrequency.
In concept, the BBM is similar to the IFIM in aiming to main-tain a prescribed condition based on a high degree of knowledgeabout flow requirements of the various aspects of the ecosys-tem that contribute to target values. However, identification offlow requirements in the BBM is based more on the ‘natural flowparadigm’ than an understanding of physical and biological rela-tionships. A basic assumption of the BBM, and the major pointof departure from IFIM, is that biota associated with a river cancope with naturally occurring low flows that occur often and lowflows that are not characteristic of the river will constitute anatypical disturbance to the ecosystem and could fundamentally
change its character. There is also an assumption that the biotaare reliant on higher flow conditions [6].
Historically, the focus of instream flow studies has beenon determining the low flow conditions required to maintainparticular instream values, because low flow periods are the timeof greatest competition for the limited amount of water that isavailable, and a time when the river ecosystem is most understress. However, several aspects of a river’s flow regime mayinfluence its ability to maintain particular instream values. Thesemay be summarised as follows:
• Large floods, in the order of the mean annual flood and greater,are responsible for the overall form of an alluvial river chan-nel. They are known as channel maintenance flows and alsoinfluence the nature of the river corridor. Large floods alsoare a major cause of disturbance to the river ecosystem, withpotentially significant impacts, at least for a time, on life-supporting capacity, as aquatic biota are displaced and theirhabitats temporarily destroyed.
• Smaller floods and freshets, with a frequency of a few timeseach year, are contained within the channel, and therefore havea more restricted effect than large floods. Nevertheless, theyare able to mobilise sediment on at least some areas of the riverbed, remove periphyton and other aquatic vegetation, and oftenassist fish passage. They generally ‘flush’and ‘refresh’the riverbed by removing silt and algal coatings, and inhibit vegetationfrom colonising the riverbed gravels that are not covered byflowing water and, in terms of flow requirements, are knownas ‘flushing flows’.
• Low flows. As noted above, low flows are particularly impor-tant because they are the times at which there is greatestcompetition for water, the total wetted area of aquatic habitatis least, and the aquatic ecosystem is likely to be under great-est stress (apart from the catastrophic stresses that occur withlarge floods). On the other hand, stable low flows offer periodsof high biological productivity, which permit recolonisation ofthe riverbed by macroinvertebrates and fish after a flood, andre-establishment of periphyton and macrophyte vegetation.
• Annual flow regime. The seasonal variation of flows also mayhave an important biological function, such as spring floodsthat open a river mouth and enable the spring migration ofdiadromous fish from the sea or annual floods in arid zonesthat sustain the flood plain ecosystem.
• Flow variability. The way in which flow varies almost con-tinuously in a river is a significant hydrological feature thathas received much attention in designing flow managementregimes. Many people consider that flow variations are anessential element of the regime that should be maintained, andthat long periods of constant flow (‘flat lining’), which couldresult from adherence to a minimum flow, should be avoided.
It can be seen that determining the river flows required tomaintain particular instream values may present significant chal-lenges, particularly if there are several values that have different,or even opposite, requirements. Depending on specific propos-als for use of the river (e.g., damming, large-scale run-of-riverabstraction, minor abstractions), it may be necessary to develop
Flow regime requirements and the biological effectiveness of habitat-based minimum flow assessments for six rivers 181
what might be called a ‘designer flow regime’, that considersthe need to maintain floods, freshets, low flows, and aspects offlow variability. This, of course, means that the manager musthave a clear idea of the outcomes that are desired, with regard toinstream values.
Although methods of assessing flow requirements continue tobe developed and debated, very few studies examine how wellmodified flow regimes have achieved their desired outcomes andthere are few studies that describe the response of aquatic popu-lations to flow changes. Armour & Taylor [7] surveyed 35 U.S.Fish and Wildlife field offices that had been involved in 616IFIM applications of which only 6 had follow-up monitoring, theresults of which were not reported. The survey found that opin-ions on IFIM were divided, with 40% considering the methodtechnically too simplistic, 41% considering it too complex toapply, and 9% considering it not acceptable or biased. Howeverwith any flow assessment method, the critical test of whether themethod worked or not is whether it was successful in achievingthe desired maintenance of instream values. In the U.S. survey,half rated success as higher than neutral, while one-third rated itlower.
In this study, we review six New Zealand cases involving trout,benthic invertebrate and indigenous fish communities where min-imum flow and flow regime recommendations have been madeand implemented based on an IFIM approach, and examine theavailable biological data to determine whether these recommen-dations have been successful in achieving their desired goals.The assessment is based on information and data collated froma range of unpublished and published studies that were usuallycarried out on each river for other purposes, but allow evaluationof the success of the flow regime recommendations. All data andstudy methodologies were scrutinised and found to be adequatefor the purposes of the present assessment.
Summary of methods
Instream habitat surveys and flow recommendations
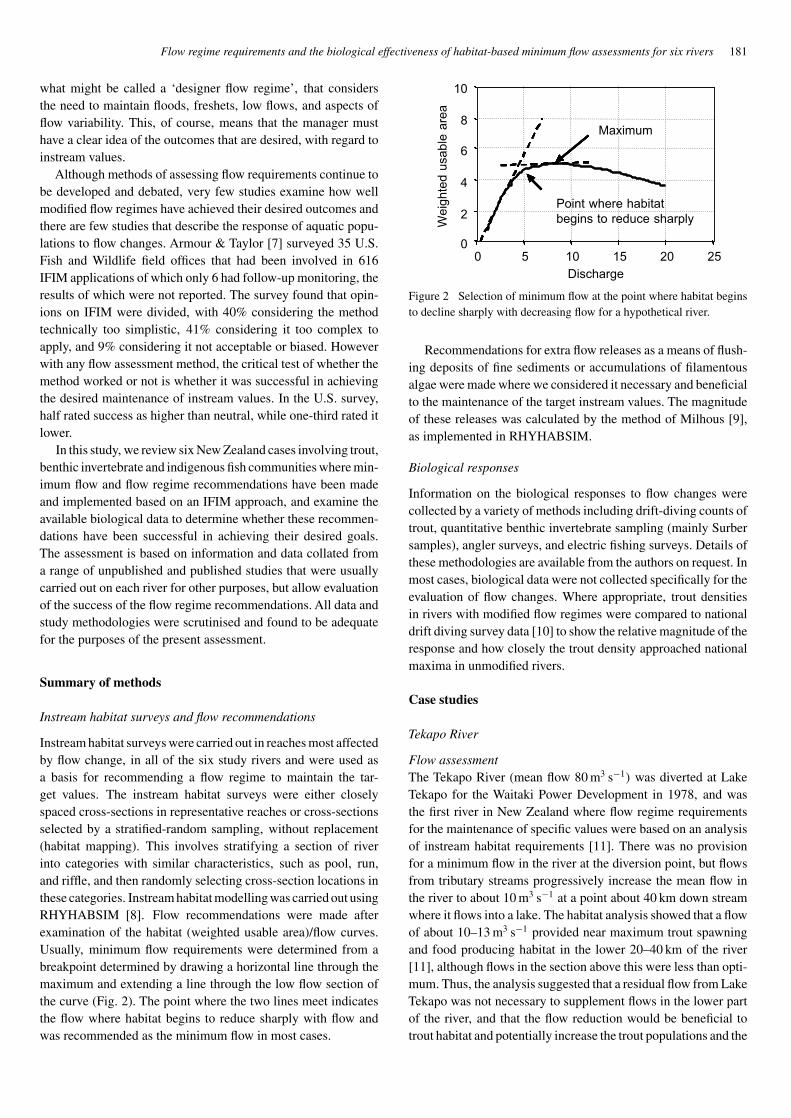
Instream habitat surveys were carried out in reaches most affectedby flow change, in all of the six study rivers and were used asa basis for recommending a flow regime to maintain the tar-get values. The instream habitat surveys were either closelyspaced cross-sections in representative reaches or cross-sectionsselected by a stratified-random sampling, without replacement(habitat mapping). This involves stratifying a section of riverinto categories with similar characteristics, such as pool, run,and riffle, and then randomly selecting cross-section locations inthese categories. Instream habitat modelling was carried out usingRHYHABSIM [8]. Flow recommendations were made afterexamination of the habitat (weighted usable area)/flow curves.Usually, minimum flow requirements were determined from abreakpoint determined by drawing a horizontal line through themaximum and extending a line through the low flow section ofthe curve (Fig. 2). The point where the two lines meet indicatesthe flow where habitat begins to reduce sharply with flow andwas recommended as the minimum flow in most cases.
We
igh
ted
usa
ble
are
a
Discharge
10 200
2
4
6
8
10
Maximum
Point where habitatbegins to reduce sharply
0 5 15 25
Figure 2 Selection of minimum flow at the point where habitat beginsto decline sharply with decreasing flow for a hypothetical river.
Recommendations for extra flow releases as a means of flush-ing deposits of fine sediments or accumulations of filamentousalgae were made where we considered it necessary and beneficialto the maintenance of the target instream values. The magnitudeof these releases was calculated by the method of Milhous [9],as implemented in RHYHABSIM.
Biological responses
Information on the biological responses to flow changes werecollected by a variety of methods including drift-diving counts oftrout, quantitative benthic invertebrate sampling (mainly Surbersamples), angler surveys, and electric fishing surveys. Details ofthese methodologies are available from the authors on request. Inmost cases, biological data were not collected specifically for theevaluation of flow changes. Where appropriate, trout densitiesin rivers with modified flow regimes were compared to nationaldrift diving survey data [10] to show the relative magnitude of theresponse and how closely the trout density approached nationalmaxima in unmodified rivers.
Case studies
Tekapo River
Flow assessmentThe Tekapo River (mean flow 80 m3 s−1) was diverted at LakeTekapo for the Waitaki Power Development in 1978, and wasthe first river in New Zealand where flow regime requirementsfor the maintenance of specific values were based on an analysisof instream habitat requirements [11]. There was no provisionfor a minimum flow in the river at the diversion point, but flowsfrom tributary streams progressively increase the mean flow inthe river to about 10 m3 s−1 at a point about 40 km down streamwhere it flows into a lake. The habitat analysis showed that a flowof about 10–13 m3 s−1 provided near maximum trout spawningand food producing habitat in the lower 20–40 km of the river[11], although flows in the section above this were less than opti-mum. Thus, the analysis suggested that a residual flow from LakeTekapo was not necessary to supplement flows in the lower partof the river, and that the flow reduction would be beneficial totrout habitat and potentially increase the trout populations and the
182 Ian G. Jowett and Barry J.F. Biggs
fishery in the lower part of the river. Apart from a slight intensi-fication of landuse in the catchment (small increase in irrigatedland and higher density holiday home development at the Tekapovillage on the shores of Lake Tekapo), no changes have occurredto the river and channel environment over the last 50 years otherthan vegetation and morphological changes in the original 1978river channel and flood plain.
Response of values to flow regimesNo monitoring was specifically carried out to test the predictionsof the instream habitat modelling. However, other informationcan be used to make a confident judgement as to the relativesuccess of the modified flow regime. Brown and rainbow troutwere introduced into the downstream river system c. 1900 andextended their range into the Tekapo River without any stocking.However, there were no records of trout density prior to diversionas the Tekapo River was not considered an angling river and wasnot even mentioned in angling surveys of that time [12]. Fromthis, we conclude that angling in the river was poor, probablybecause trout numbers were low and river conditions unsuited toangling.
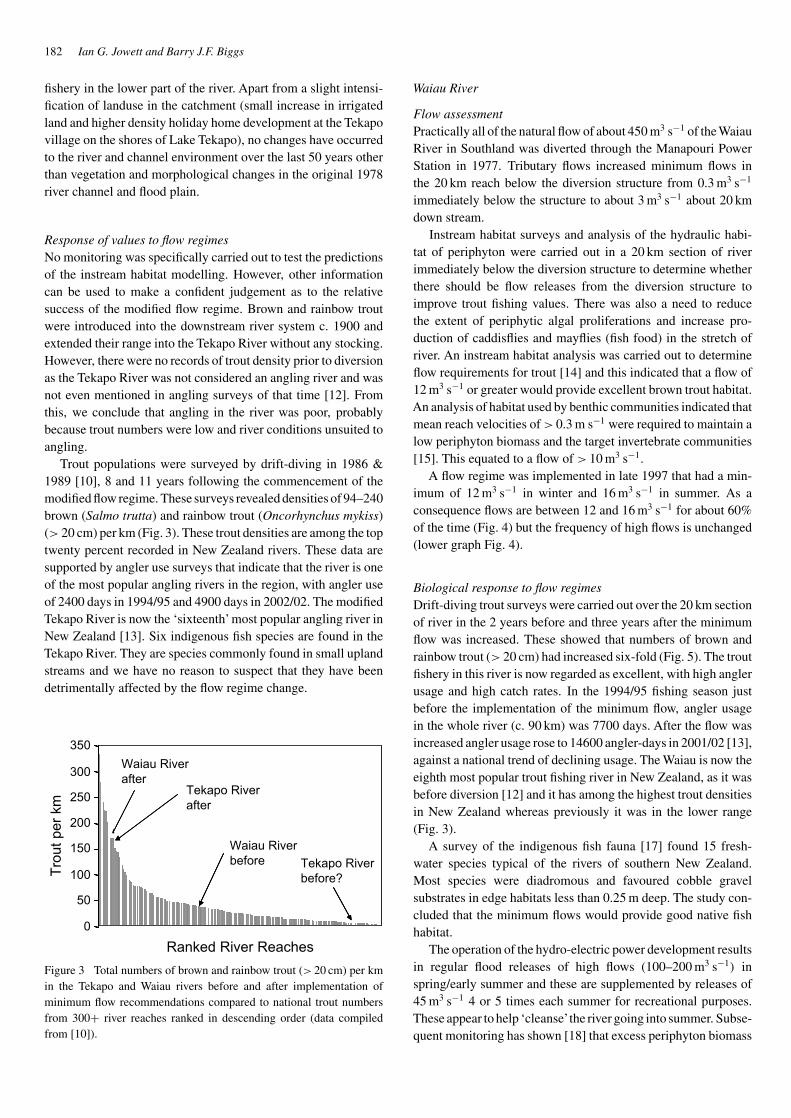
Trout populations were surveyed by drift-diving in 1986 &1989 [10], 8 and 11 years following the commencement of themodified flow regime. These surveys revealed densities of 94–240brown (Salmo trutta) and rainbow trout (Oncorhynchus mykiss)(> 20 cm) per km (Fig. 3). These trout densities are among the toptwenty percent recorded in New Zealand rivers. These data aresupported by angler use surveys that indicate that the river is oneof the most popular angling rivers in the region, with angler useof 2400 days in 1994/95 and 4900 days in 2002/02. The modifiedTekapo River is now the ‘sixteenth’ most popular angling river inNew Zealand [13]. Six indigenous fish species are found in theTekapo River. They are species commonly found in small uplandstreams and we have no reason to suspect that they have beendetrimentally affected by the flow regime change.
Tro
ut
pe
r km
50
100
150
250
300
350
Waiau Riverbefore
Waiau Riverafter
Tekapo Riverbefore?
Tekapo Riverafter
Ranked River Reaches
0
200
Figure 3 Total numbers of brown and rainbow trout (> 20 cm) per kmin the Tekapo and Waiau rivers before and after implementation ofminimum flow recommendations compared to national trout numbersfrom 300+ river reaches ranked in descending order (data compiledfrom [10]).
Waiau River
Flow assessmentPractically all of the natural flow of about 450 m3 s−1 of the WaiauRiver in Southland was diverted through the Manapouri PowerStation in 1977. Tributary flows increased minimum flows inthe 20 km reach below the diversion structure from 0.3 m3 s−1
immediately below the structure to about 3 m3 s−1 about 20 kmdown stream.
Instream habitat surveys and analysis of the hydraulic habi-tat of periphyton were carried out in a 20 km section of riverimmediately below the diversion structure to determine whetherthere should be flow releases from the diversion structure toimprove trout fishing values. There was also a need to reducethe extent of periphytic algal proliferations and increase pro-duction of caddisflies and mayflies (fish food) in the stretch ofriver. An instream habitat analysis was carried out to determineflow requirements for trout [14] and this indicated that a flow of12 m3 s−1 or greater would provide excellent brown trout habitat.An analysis of habitat used by benthic communities indicated thatmean reach velocities of > 0.3 m s−1 were required to maintain alow periphyton biomass and the target invertebrate communities[15]. This equated to a flow of > 10 m3 s−1.
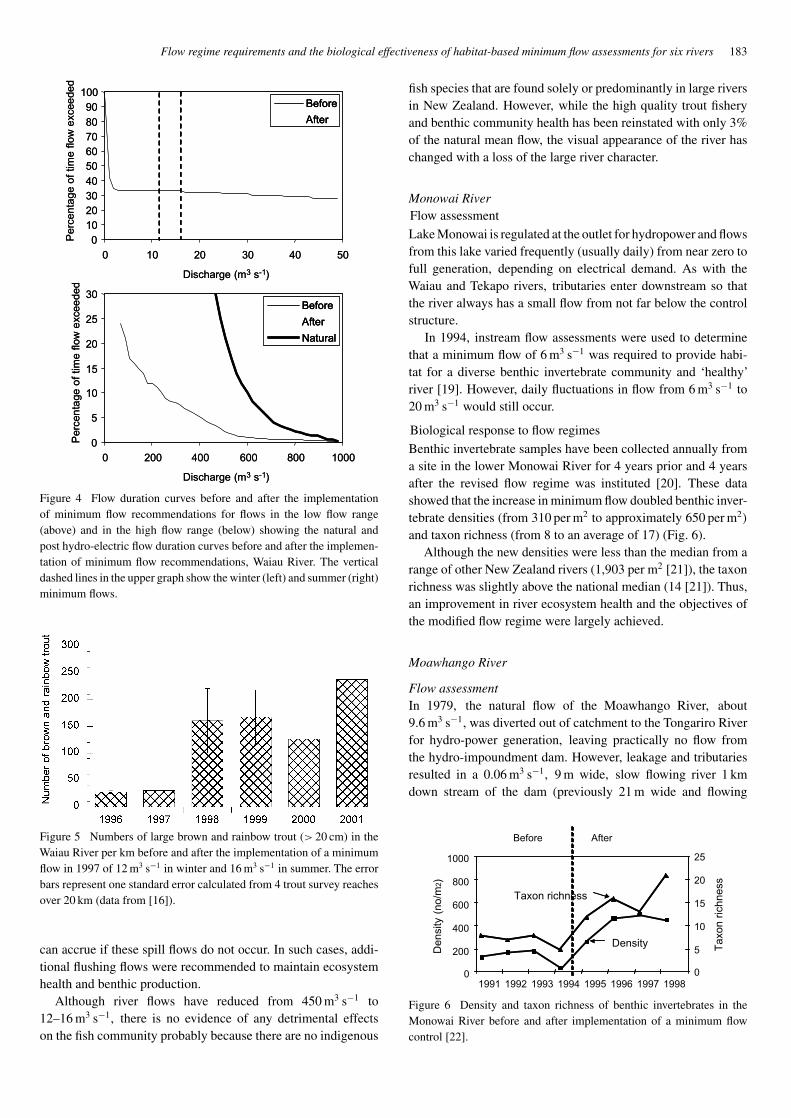
A flow regime was implemented in late 1997 that had a min-imum of 12 m3 s−1 in winter and 16 m3 s−1 in summer. As aconsequence flows are between 12 and 16 m3 s−1 for about 60%of the time (Fig. 4) but the frequency of high flows is unchanged(lower graph Fig. 4).
Biological response to flow regimesDrift-diving trout surveys were carried out over the 20 km sectionof river in the 2 years before and three years after the minimumflow was increased. These showed that numbers of brown andrainbow trout (> 20 cm) had increased six-fold (Fig. 5). The troutfishery in this river is now regarded as excellent, with high anglerusage and high catch rates. In the 1994/95 fishing season justbefore the implementation of the minimum flow, angler usagein the whole river (c. 90 km) was 7700 days. After the flow wasincreased angler usage rose to 14600 angler-days in 2001/02 [13],against a national trend of declining usage. The Waiau is now theeighth most popular trout fishing river in New Zealand, as it wasbefore diversion [12] and it has among the highest trout densitiesin New Zealand whereas previously it was in the lower range(Fig. 3).
A survey of the indigenous fish fauna [17] found 15 fresh-water species typical of the rivers of southern New Zealand.Most species were diadromous and favoured cobble gravelsubstrates in edge habitats less than 0.25 m deep. The study con-cluded that the minimum flows would provide good native fishhabitat.
The operation of the hydro-electric power development resultsin regular flood releases of high flows (100–200 m3 s−1) inspring/early summer and these are supplemented by releases of45 m3 s−1 4 or 5 times each summer for recreational purposes.These appear to help ‘cleanse’the river going into summer. Subse-quent monitoring has shown [18] that excess periphyton biomass
Flow regime requirements and the biological effectiveness of habitat-based minimum flow assessments for six rivers 183
0
10203040
50607080
90100
0 10 20 30 40 50
Discharge (m3 s-1)
Perc
en
tage
of
time
flow
exc
eede
d
Before
After
0
5
10
15
20
25
30
0 200 400 600 800 1000
Discharge (m3 s-1)
Per
cen
tage
of
time
flow
exc
ee
ded
Before
After
Natural
0
10203040
50607080
90100
0 10 20 30 40 50
Discharge (m3 s-1)
Perc
en
tage
of
time
flow
exc
eede
d
Before
After
Before
After
0
5
10
15
20
25
30
0 200 400 600 800 1000
Discharge (m3 s-1)
Per
cen
tage
of
time
flow
exc
ee
ded
Before
After
Natural
Before
After
Natural
Figure 4 Flow duration curves before and after the implementationof minimum flow recommendations for flows in the low flow range(above) and in the high flow range (below) showing the natural andpost hydro-electric flow duration curves before and after the implemen-tation of minimum flow recommendations, Waiau River. The verticaldashed lines in the upper graph show the winter (left) and summer (right)minimum flows.
Figure 5 Numbers of large brown and rainbow trout (> 20 cm) in theWaiau River per km before and after the implementation of a minimumflow in 1997 of 12 m3 s−1 in winter and 16 m3 s−1 in summer. The errorbars represent one standard error calculated from 4 trout survey reachesover 20 km (data from [16]).
can accrue if these spill flows do not occur. In such cases, addi-tional flushing flows were recommended to maintain ecosystemhealth and benthic production.
Although river flows have reduced from 450 m3 s−1 to12–16 m3 s−1, there is no evidence of any detrimental effectson the fish community probably because there are no indigenous
fish species that are found solely or predominantly in large riversin New Zealand. However, while the high quality trout fisheryand benthic community health has been reinstated with only 3%of the natural mean flow, the visual appearance of the river haschanged with a loss of the large river character.
Monowai RiverFlow assessment
Lake Monowai is regulated at the outlet for hydropower and flowsfrom this lake varied frequently (usually daily) from near zero tofull generation, depending on electrical demand. As with theWaiau and Tekapo rivers, tributaries enter downstream so thatthe river always has a small flow from not far below the controlstructure.
In 1994, instream flow assessments were used to determinethat a minimum flow of 6 m3 s−1 was required to provide habi-tat for a diverse benthic invertebrate community and ‘healthy’river [19]. However, daily fluctuations in flow from 6 m3 s−1 to20 m3 s−1 would still occur.
Biological response to flow regimes
Benthic invertebrate samples have been collected annually froma site in the lower Monowai River for 4 years prior and 4 yearsafter the revised flow regime was instituted [20]. These datashowed that the increase in minimum flow doubled benthic inver-tebrate densities (from 310 per m2 to approximately 650 per m2)
and taxon richness (from 8 to an average of 17) (Fig. 6).Although the new densities were less than the median from a
range of other New Zealand rivers (1,903 per m2 [21]), the taxonrichness was slightly above the national median (14 [21]). Thus,an improvement in river ecosystem health and the objectives ofthe modified flow regime were largely achieved.
Moawhango River
Flow assessmentIn 1979, the natural flow of the Moawhango River, about9.6 m3 s−1, was diverted out of catchment to the Tongariro Riverfor hydro-power generation, leaving practically no flow fromthe hydro-impoundment dam. However, leakage and tributariesresulted in a 0.06 m3 s−1, 9 m wide, slow flowing river 1 kmdown stream of the dam (previously 21 m wide and flowing
0
200
400
600
800
1000
1991 1992 1993 1994 1995 1996 1997 1998
De
nsi
ty (
no
/m2)
0
5
10
15
20
25
Ta
xon
ric
hn
ess
After
Density
Taxon richness
Before
Figure 6 Density and taxon richness of benthic invertebrates in theMonowai River before and after implementation of a minimum flowcontrol [22].
184 Ian G. Jowett and Barry J.F. Biggs
swiftly), and this increased to 4.7 m3 s−1 39 km down stream atthe Moawhango village. As part of the re-licensing process for thepower scheme, benthic invertebrate surveys showed that the habi-tat below the dam was degraded with periphyton proliferationsand an invertebrate community comprised of taxa commonlyfound in low water velocity environments [23]. An instream habi-tat assessment, together with trial flushing flows 4 times over thesummer, were used to recommend flows required to establish ben-thic invertebrate communities below the dam that were typical ofrivers in the region [24]. The residual flow that was accepted andinstituted through the re-licensing process was 0.6 m3 s−1, whichwas 6% of the natural flow.
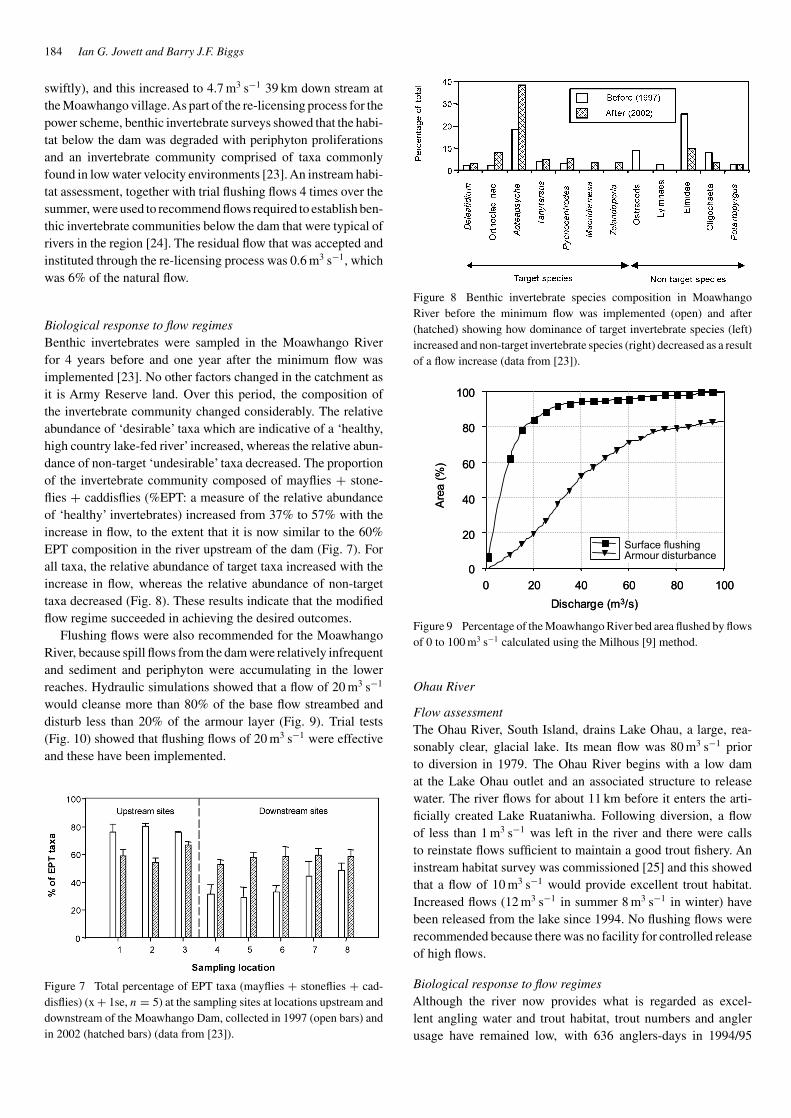
Biological response to flow regimesBenthic invertebrates were sampled in the Moawhango Riverfor 4 years before and one year after the minimum flow wasimplemented [23]. No other factors changed in the catchment asit is Army Reserve land. Over this period, the composition ofthe invertebrate community changed considerably. The relativeabundance of ‘desirable’ taxa which are indicative of a ‘healthy,high country lake-fed river’ increased, whereas the relative abun-dance of non-target ‘undesirable’ taxa decreased. The proportionof the invertebrate community composed of mayflies + stone-flies + caddisflies (%EPT: a measure of the relative abundanceof ‘healthy’ invertebrates) increased from 37% to 57% with theincrease in flow, to the extent that it is now similar to the 60%EPT composition in the river upstream of the dam (Fig. 7). Forall taxa, the relative abundance of target taxa increased with theincrease in flow, whereas the relative abundance of non-targettaxa decreased (Fig. 8). These results indicate that the modifiedflow regime succeeded in achieving the desired outcomes.
Flushing flows were also recommended for the MoawhangoRiver, because spill flows from the dam were relatively infrequentand sediment and periphyton were accumulating in the lowerreaches. Hydraulic simulations showed that a flow of 20 m3 s−1
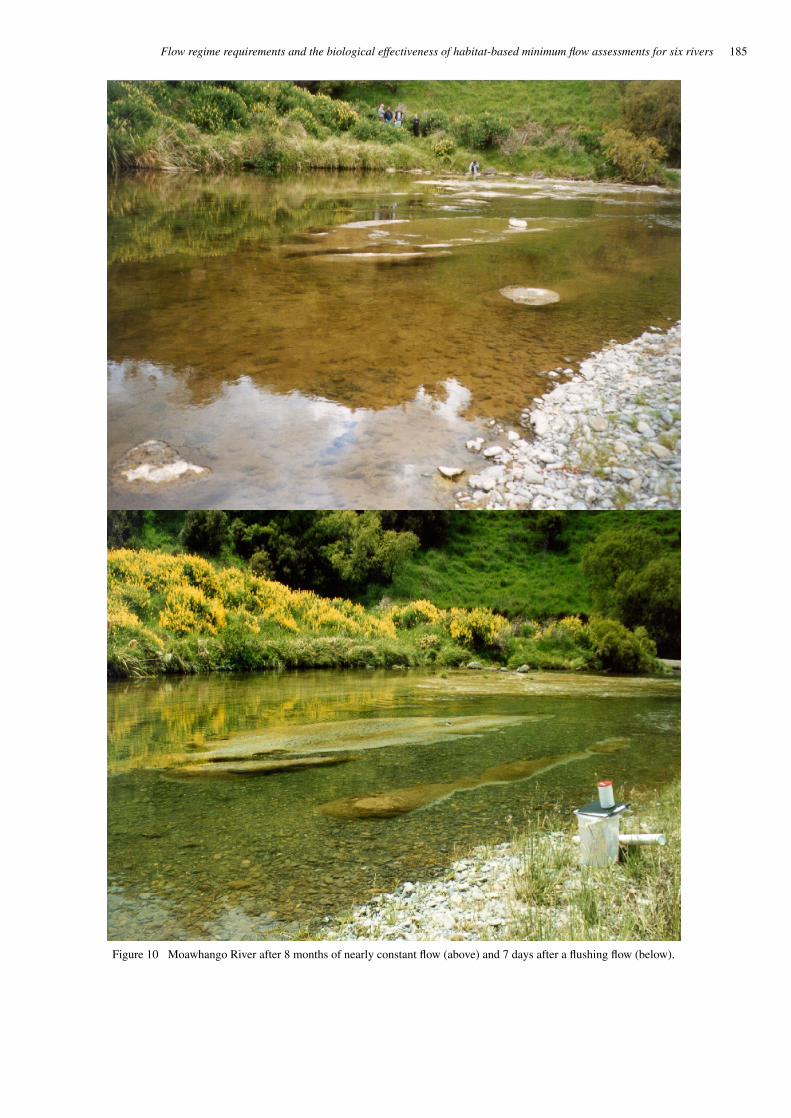
would cleanse more than 80% of the base flow streambed anddisturb less than 20% of the armour layer (Fig. 9). Trial tests(Fig. 10) showed that flushing flows of 20 m3 s−1 were effectiveand these have been implemented.
Figure 7 Total percentage of EPT taxa (mayflies + stoneflies + cad-disflies) (x + 1se, n = 5) at the sampling sites at locations upstream anddownstream of the Moawhango Dam, collected in 1997 (open bars) andin 2002 (hatched bars) (data from [23]).
Figure 8 Benthic invertebrate species composition in MoawhangoRiver before the minimum flow was implemented (open) and after(hatched) showing how dominance of target invertebrate species (left)increased and non-target invertebrate species (right) decreased as a resultof a flow increase (data from [23]).
Are
a (%
)
Discharge (m3/s)
0 20 40 60 80 100
0
20
40
60
80
100
Are
a (%
)
Discharge (m3/s)
0 20 40 60 80 100
0
20
40
60
80
100
Surface flushingArmour disturbance
Figure 9 Percentage of the Moawhango River bed area flushed by flowsof 0 to 100 m3 s−1 calculated using the Milhous [9] method.
Ohau River
Flow assessmentThe Ohau River, South Island, drains Lake Ohau, a large, rea-sonably clear, glacial lake. Its mean flow was 80 m3 s−1 priorto diversion in 1979. The Ohau River begins with a low damat the Lake Ohau outlet and an associated structure to releasewater. The river flows for about 11 km before it enters the arti-ficially created Lake Ruataniwha. Following diversion, a flowof less than 1 m3 s−1 was left in the river and there were callsto reinstate flows sufficient to maintain a good trout fishery. Aninstream habitat survey was commissioned [25] and this showedthat a flow of 10 m3 s−1 would provide excellent trout habitat.Increased flows (12 m3 s−1 in summer 8 m3 s−1 in winter) havebeen released from the lake since 1994. No flushing flows wererecommended because there was no facility for controlled releaseof high flows.
Biological response to flow regimesAlthough the river now provides what is regarded as excel-lent angling water and trout habitat, trout numbers and anglerusage have remained low, with 636 anglers-days in 1994/95
Flow regime requirements and the biological effectiveness of habitat-based minimum flow assessments for six rivers 185
Figure 10 Moawhango River after 8 months of nearly constant flow (above) and 7 days after a flushing flow (below).
186 Ian G. Jowett and Barry J.F. Biggs
0
200
400
600
800
1000
Flo
w
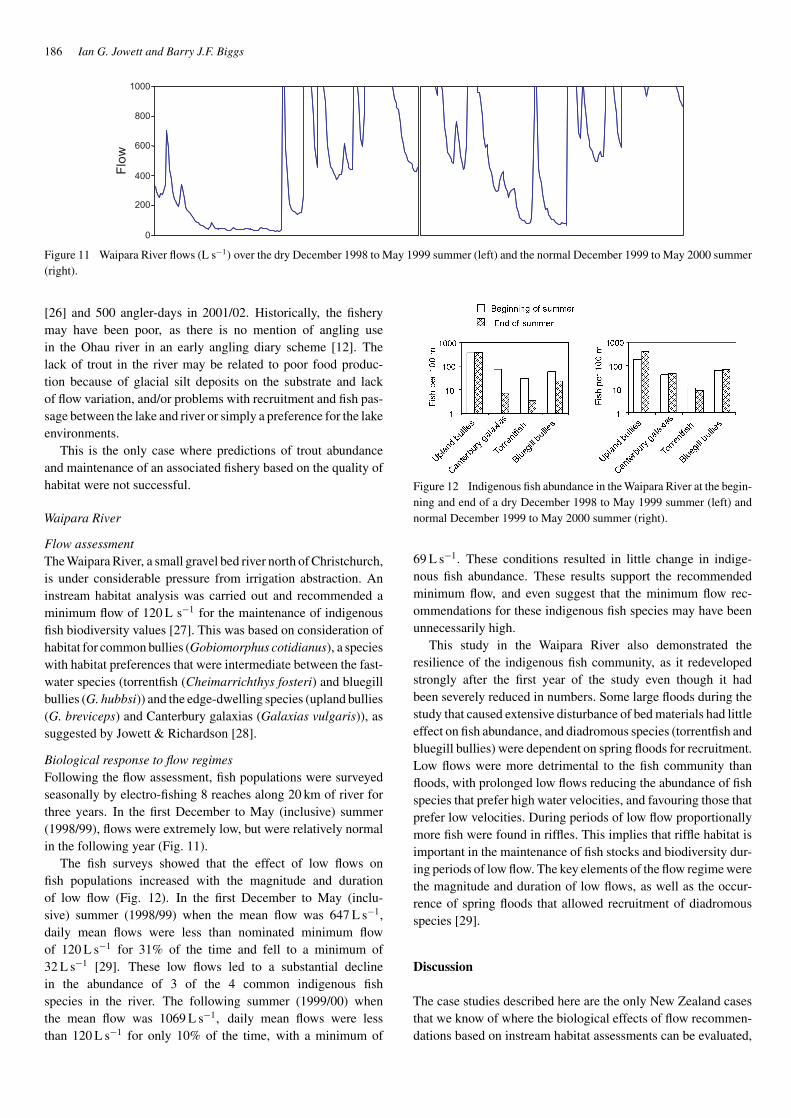
Figure 11 Waipara River flows (L s−1) over the dry December 1998 to May 1999 summer (left) and the normal December 1999 to May 2000 summer(right).
[26] and 500 angler-days in 2001/02. Historically, the fisherymay have been poor, as there is no mention of angling usein the Ohau river in an early angling diary scheme [12]. Thelack of trout in the river may be related to poor food produc-tion because of glacial silt deposits on the substrate and lackof flow variation, and/or problems with recruitment and fish pas-sage between the lake and river or simply a preference for the lakeenvironments.
This is the only case where predictions of trout abundanceand maintenance of an associated fishery based on the quality ofhabitat were not successful.
Waipara River
Flow assessmentThe Waipara River, a small gravel bed river north of Christchurch,is under considerable pressure from irrigation abstraction. Aninstream habitat analysis was carried out and recommended aminimum flow of 120 L s−1 for the maintenance of indigenousfish biodiversity values [27]. This was based on consideration ofhabitat for common bullies (Gobiomorphus cotidianus), a specieswith habitat preferences that were intermediate between the fast-water species (torrentfish (Cheimarrichthys fosteri) and bluegillbullies (G. hubbsi)) and the edge-dwelling species (upland bullies(G. breviceps) and Canterbury galaxias (Galaxias vulgaris)), assuggested by Jowett & Richardson [28].
Biological response to flow regimesFollowing the flow assessment, fish populations were surveyedseasonally by electro-fishing 8 reaches along 20 km of river forthree years. In the first December to May (inclusive) summer(1998/99), flows were extremely low, but were relatively normalin the following year (Fig. 11).
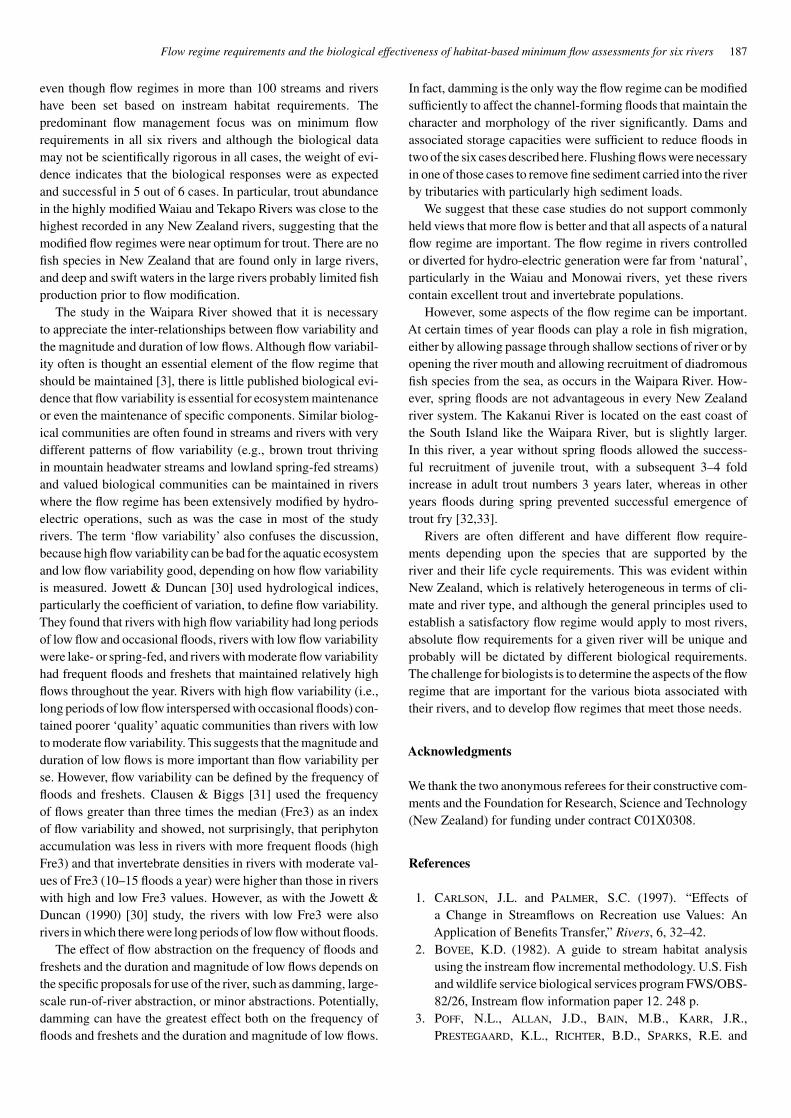
The fish surveys showed that the effect of low flows onfish populations increased with the magnitude and durationof low flow (Fig. 12). In the first December to May (inclu-sive) summer (1998/99) when the mean flow was 647 L s−1,daily mean flows were less than nominated minimum flowof 120 L s−1 for 31% of the time and fell to a minimum of32 L s−1 [29]. These low flows led to a substantial declinein the abundance of 3 of the 4 common indigenous fishspecies in the river. The following summer (1999/00) whenthe mean flow was 1069 L s−1, daily mean flows were lessthan 120 L s−1 for only 10% of the time, with a minimum of
Figure 12 Indigenous fish abundance in the Waipara River at the begin-ning and end of a dry December 1998 to May 1999 summer (left) andnormal December 1999 to May 2000 summer (right).
69 L s−1. These conditions resulted in little change in indige-nous fish abundance. These results support the recommendedminimum flow, and even suggest that the minimum flow rec-ommendations for these indigenous fish species may have beenunnecessarily high.
This study in the Waipara River also demonstrated theresilience of the indigenous fish community, as it redevelopedstrongly after the first year of the study even though it hadbeen severely reduced in numbers. Some large floods during thestudy that caused extensive disturbance of bed materials had littleeffect on fish abundance, and diadromous species (torrentfish andbluegill bullies) were dependent on spring floods for recruitment.Low flows were more detrimental to the fish community thanfloods, with prolonged low flows reducing the abundance of fishspecies that prefer high water velocities, and favouring those thatprefer low velocities. During periods of low flow proportionallymore fish were found in riffles. This implies that riffle habitat isimportant in the maintenance of fish stocks and biodiversity dur-ing periods of low flow. The key elements of the flow regime werethe magnitude and duration of low flows, as well as the occur-rence of spring floods that allowed recruitment of diadromousspecies [29].
Discussion
The case studies described here are the only New Zealand casesthat we know of where the biological effects of flow recommen-dations based on instream habitat assessments can be evaluated,
Flow regime requirements and the biological effectiveness of habitat-based minimum flow assessments for six rivers 187
even though flow regimes in more than 100 streams and rivershave been set based on instream habitat requirements. Thepredominant flow management focus was on minimum flowrequirements in all six rivers and although the biological datamay not be scientifically rigorous in all cases, the weight of evi-dence indicates that the biological responses were as expectedand successful in 5 out of 6 cases. In particular, trout abundancein the highly modified Waiau and Tekapo Rivers was close to thehighest recorded in any New Zealand rivers, suggesting that themodified flow regimes were near optimum for trout. There are nofish species in New Zealand that are found only in large rivers,and deep and swift waters in the large rivers probably limited fishproduction prior to flow modification.
The study in the Waipara River showed that it is necessaryto appreciate the inter-relationships between flow variability andthe magnitude and duration of low flows. Although flow variabil-ity often is thought an essential element of the flow regime thatshould be maintained [3], there is little published biological evi-dence that flow variability is essential for ecosystem maintenanceor even the maintenance of specific components. Similar biolog-ical communities are often found in streams and rivers with verydifferent patterns of flow variability (e.g., brown trout thrivingin mountain headwater streams and lowland spring-fed streams)and valued biological communities can be maintained in riverswhere the flow regime has been extensively modified by hydro-electric operations, such as was the case in most of the studyrivers. The term ‘flow variability’ also confuses the discussion,because high flow variability can be bad for the aquatic ecosystemand low flow variability good, depending on how flow variabilityis measured. Jowett & Duncan [30] used hydrological indices,particularly the coefficient of variation, to define flow variability.They found that rivers with high flow variability had long periodsof low flow and occasional floods, rivers with low flow variabilitywere lake- or spring-fed, and rivers with moderate flow variabilityhad frequent floods and freshets that maintained relatively highflows throughout the year. Rivers with high flow variability (i.e.,long periods of low flow interspersed with occasional floods) con-tained poorer ‘quality’ aquatic communities than rivers with lowto moderate flow variability. This suggests that the magnitude andduration of low flows is more important than flow variability perse. However, flow variability can be defined by the frequency offloods and freshets. Clausen & Biggs [31] used the frequencyof flows greater than three times the median (Fre3) as an indexof flow variability and showed, not surprisingly, that periphytonaccumulation was less in rivers with more frequent floods (highFre3) and that invertebrate densities in rivers with moderate val-ues of Fre3 (10–15 floods a year) were higher than those in riverswith high and low Fre3 values. However, as with the Jowett &Duncan (1990) [30] study, the rivers with low Fre3 were alsorivers in which there were long periods of low flow without floods.
The effect of flow abstraction on the frequency of floods andfreshets and the duration and magnitude of low flows depends onthe specific proposals for use of the river, such as damming, large-scale run-of-river abstraction, or minor abstractions. Potentially,damming can have the greatest effect both on the frequency offloods and freshets and the duration and magnitude of low flows.
In fact, damming is the only way the flow regime can be modifiedsufficiently to affect the channel-forming floods that maintain thecharacter and morphology of the river significantly. Dams andassociated storage capacities were sufficient to reduce floods intwo of the six cases described here. Flushing flows were necessaryin one of those cases to remove fine sediment carried into the riverby tributaries with particularly high sediment loads.
We suggest that these case studies do not support commonlyheld views that more flow is better and that all aspects of a naturalflow regime are important. The flow regime in rivers controlledor diverted for hydro-electric generation were far from ‘natural’,particularly in the Waiau and Monowai rivers, yet these riverscontain excellent trout and invertebrate populations.
However, some aspects of the flow regime can be important.At certain times of year floods can play a role in fish migration,either by allowing passage through shallow sections of river or byopening the river mouth and allowing recruitment of diadromousfish species from the sea, as occurs in the Waipara River. How-ever, spring floods are not advantageous in every New Zealandriver system. The Kakanui River is located on the east coast ofthe South Island like the Waipara River, but is slightly larger.In this river, a year without spring floods allowed the success-ful recruitment of juvenile trout, with a subsequent 3–4 foldincrease in adult trout numbers 3 years later, whereas in otheryears floods during spring prevented successful emergence oftrout fry [32,33].
Rivers are often different and have different flow require-ments depending upon the species that are supported by theriver and their life cycle requirements. This was evident withinNew Zealand, which is relatively heterogeneous in terms of cli-mate and river type, and although the general principles used toestablish a satisfactory flow regime would apply to most rivers,absolute flow requirements for a given river will be unique andprobably will be dictated by different biological requirements.The challenge for biologists is to determine the aspects of the flowregime that are important for the various biota associated withtheir rivers, and to develop flow regimes that meet those needs.
Acknowledgments
We thank the two anonymous referees for their constructive com-ments and the Foundation for Research, Science and Technology(New Zealand) for funding under contract C01X0308.
References
1. Carlson, J.L. and Palmer, S.C. (1997). “Effects ofa Change in Streamflows on Recreation use Values: AnApplication of Benefits Transfer,” Rivers, 6, 32–42.
2. Bovee, K.D. (1982). A guide to stream habitat analysisusing the instream flow incremental methodology. U.S. Fishand wildlife service biological services program FWS/OBS-82/26, Instream flow information paper 12. 248 p.
3. Poff, N.L., Allan, J.D., Bain, M.B., Karr, J.R.,Prestegaard, K.L., Richter, B.D., Sparks, R.E. and
188 Ian G. Jowett and Barry J.F. Biggs
Stromberg, J.C. (1997). “The Natural Flow Regime,”BioScience, 47, 769–784.
4. Richter, B.D., Baumgartner, J.V., Wigington, R. andBraun, D.P. (1997). “How MuchWater does a River Need?”Freshwater Biology, 37, 231–249.
5. Arthington, A.H., King, J.M., O’keeffe, J.H., Bunn,S.E., Day, J.A., Pusey, B.J., Bluhdorn, B.R. andTharme, R. (1992). Development of an holistic approachfor assessing environmental flow requirements of river-ine ecosystems, in J.J. Pilgram and B.P. Hooper (eds.),Water Allocation for the Environment, The Centre for WaterPolicy Research, University of New England, Armidale,pp. 69–76.
6. King, J.M., Tharme, R.E. and de Villiers, M.S. (2000).Environmental Flow Assessments for Rivers: Manual forthe building block methodology. WRC Report TT 131/00.Freshwater research unit, University of Cape Town, SouthAfrica.
7. Armour, C.L. and Taylor, J.G. (1991). “Evaluation of theInstream Flow Incremental Methodology by U.S. Fish andWildlife Service Field Users,” Fisheries, 16(5), 36–43.
8. Clausen, B., Jowett, I.G., Biggs, B.J.F. and Moeslund,B. (2004). Stream ecology and flow management, in L.M.Tallaksen and H.A.J. Van Lanen (eds.), Developments inWater Science 48, Elsevier.
9. Milhous, R.T. (1998). “Modelling Instream FlowNeeds: The Link between Sediment and Aquatic Habi-tat,” Regulated Rivers: Research and Management, 14,79–94.
10. Teirney, L.D. and Jowett, I.G. (1990). Trout abundancein New Zealand rivers: An assessment by drift diving.Freshwater Fisheries Report 118. Freshwater Fisheries Cen-tre, Ministry of Agriculture and Fisheries, Christchurch.47 p.
11. Jowett, I.G. (1982). The incremental approach to study-ing stream flows: New Zealand case studies, in R.H.S.McColl (ed.), Water and Soil Miscellaneous Publica-tion 47, Wellington, Ministry of Works and Development,pp. 9–15.
12. Allen, K.R. and Cunningham, B.T. (1957). NewZealand angling 1947–1952: Results of the diaryscheme. New Zealand Marine Department FisheriesBulletin 12.
13. Deans, N.C., Unwin, M. and Rodway, M. (2004). Sportfishery management, in M.P. Mosley, J. Harding, C.P.Pearson and B. Sorrel (eds.), Freshwaters of New Zealand,Christchurch, Caxton Press, pp 41.1–41.16.
14. Jowett, I.G. (1993). Minimum flow requirements forinstream habitat in the Waiau River, Southland, from theMararoa Weir to the Borland Burn. NZ Freshwater Miscel-laneous Report 46, Ministry of Agriculture and Fisheries,Christchurch. 25 p.
15. Biggs, B.J.F. (1993). Periphyton and invertebrate commu-nities in the Waiau River between the Mararoa weir andthe Borland Burn, February 1993. New Zealand FreshwaterMiscellaneous Report 50. NIWA, Christchurch.
16. Moss, Z. (2001). Monitoring trout populations in the Waiauriver (Southland) downstream of the Mararoa weir. Reportto Meridian Energy. Fish & Game Southland.
17. Mcdowall, R.M. (1994). Native fish populations of theWaiau River (Southland) and impacts of the Lake ManapouriControl Structure (the Mararoa Weir). NIWA ConsultancyReport SCR005.
18. Kilroy, C. and Suren, A.M. (2002). Manapouri PowerScheme monitoring programme: Results for 2002 and areview of five years of post-minimum flow monitoring.NIWA Client Report CHC02/58.
19. MITCHELL & ASSOCIATES (1994). Minimum flowassessment for the Monowai River. Report to the PowerCompany Ltd., Invercargill. Charles Mitchell and Asso-ciates, Raglan.
20. Scarsbrook, M.R. (2004). “Persistence and Stability ofLotic Invertebrate Communities in New Zealand,” Fresh-water Biology, 47, 417–431.
21. Quinn, J.M. and Hickey, C.W. (1990). “Characterisa-tion and Classification of Benthic Invertebrates in 88 NewZealand Rivers in Relation to Environmental Factors,” NewZealand Journal of Marine and Freshwater Research, 24,387–406.
22. Jowett, I.G. (2000). Flow management, in K.J. Collier andM. Winterbourn (eds.), New Zealand Stream Invertebrates:Ecology and Implications for Management, Hamilton, NewZealand Limnological Society, pp 289–312.
23. Suren, A.M., Biggs, B.J.F. and Weatherhead, M. (2002).Moawhango River: Suggested biological metric to meetconsent requirements, and quantification of the effect ofincreased residual flows. NIWA Client Report CHC02/50.
24. Jowett, I.G. and Biggs, B.J.F. (2000). Instream habitat andflow requirements for benthic communities: MoawhangoDam – Aorangi Stream. NIWA Client Report GPL00502.
25. James, G.D., Jowett, I.G., Bloomberg, S., Davis, S.F.and Sagar, P.M. (1992). Fisheries and residual flows inthe upper Ohau River. New Zealand Freshwater FisheriesReport No. 134. 37 p.
26. Unwin, M. and Brown, S. (1998). The Geography of Fresh-water Angling in New Zealand, a summary of results fromthe 1994/96 National Angling Survey. NIWA Client ReportCHC98/33.
27. Jowett, I.G. (1994). Minimum flows for indigenous fishin the Waipara River. NIWA Christchurch MiscellaneousReport 180. 21 p.
28. Jowett, I.G. and Richardson, J. (1995). “Habitat Pref-erences of Common, Riverine New Zealand IndigenousFishes and Implications for Flow Management,” NewZealand Journal of Marine and Freshwater Research, 29,13–23.
29. Jowett, I.G., Richardson, J. and Bonnett, M.L. (2005).“Relationship between Flow Regime and FishAbundance ina Gravel-bed River, New Zealand,” Journal of Fish Biology,66, 1–18.
30. Jowett, I.G. and Duncan, M.J. (1990). “Flow Variabilityin New Zealand Rivers and its Relationship to In-Stream

Flow regime requirements and the biological effectiveness of habitat-based minimum flow assessments for six rivers 189
Habitat and Biota,” New Zealand Journal of Marine andFreshwater Research, 24, 305–317.
31. Clausen, B. and Biggs, B.J.F. (1997). “Relationshipsbetween Benthic Biota and Hydrological Indices in NewZealand Streams,” Freshwater Biology, 38, 327–342.
32. Hayes, J.W. (1995). “Spatial and Temporal Variation inthe Relative density and Size of Juvenile Brown Trout
in the Kakanui River, North Otago, New Zealand,” NewZealand Journal of Marine and Freshwater Research, 29,393–408.
33. Jowett, I.G. (1995). “Spatial and Temporal Variability inBrown Trout Abundance: A Test of Regression Models,”Rivers, 5, 1–12.