Embed Size (px)
Citation preview

International Journal of Hydraulic Engineering 2012, 1(6): 83-94 DOI: 10.5923/j.ijhe.20120106.04
Flow Investigations in a Wide Meandering Compound Channel
Prabir K Mohanty, Saine S. Dash, Kishanjit K. Khatua*
Civil Engineering Dept. , N.I.T. Rourkela, Rourkela, 769008, India
Abstract Extreme complexit ies present in flow behavior of meandering compound channels necessitate the study and analysis of such channels under different geometric and hydraulic condition to further our knowledge in understanding the dependency of flow characteristics e.g. velocity, boundary shear etc. on d ifferent sectional parameters like width rat io, aspect ratio and hydraulic parameter such as relative depth. The present paper draws on our investigations on a meandering compound channel,where physical experiments were conducted on a smooth sine generated trapezoidal main channel flanked on both sides by wide flood plainsunder different relative depths. A 2dimensional hydrodynamic model CCHE2D and another quasi1D model Conveyance estimation System (CES) were then applied in turn to the same test cases to numerically investigate the flow in the compound meandering channel. The results of such investigations were then compared for validation purpose with observed experimental values of important flow parameters like depth averaged velocity and boundary shear distribution across the channel cross section. It is seen that CCHE2D is quite capable of producing results in agreement with their physical values and also it partly agrees with results of CES.It is expected that the results shown in this paper would enrich the research data base in the field of compound channels and help the scientists in using the numerical model CCHE2D, as a viable research tool in the field of river engineering.
Keywords Compound Channel, Depth averaged velocity, Boundary shear,CCHE2D,CES
1. Introduction Most of the rivers have their cross sectional geometry in
the form of a compound section where a deep main channel is o ften flanked by one o r t wo s hallow ad jacen t floodplains. The main channel flow is usually faster and the floodplain flow is slower comparatively. When flow goes overbank, such a combinat ion generates cons iderab le momentum and mass transfer between floodplain flow and main channel flow rendering the flow analysis an extremely complex task. Additionally if the planform or the path of the channel is sinuous or meandering instead of straight one which is the case more often than not, further complex mechanis ms occur in the channel flow such as large sets of coherent vertical structures due to presence of secondary flow of Prandtl’s 1st kind as well as due to anisotropic turbulence arising out of complex geometry o f the channel and uneven bottom topography . The determinat ion of suitable stage discharge relationship and the associated flow variables such as depth averaged velocity and boundary shear are often hard to achieve due to strong 3dimensional nature of the flow where no complete theoretical analysis is
* Corresponding author: [email protected] (Kishanjit K. Khatua) Published online at http://journal.sapub.org/ijhe Copyright © 2012 Scientific & Academic Publishing. All Rights Reserved
possible. So researchers in past have resorted to a three pronged
approach where experimental and/or field investigation, simplified theoretical analysis and numerical investigation are often applied to the issue of analyzing meandering compound channel.[1] were probably the first to investigate under laboratory conditions the hydraulics of meandering rivers with floodplains.[2] showed that for a given channel configuration, energy expenditure due to transverse circulat ion is d irectly proportional to the Froude number.[3] Developed a mathematical model fo r meander path based on the mechanics of flow governing spatial variation of transverse circulation.[4] proposed a method which is based on finding the energy loss coefficients of different sub-sections of a meandering compound channel.[5] presented a method to design compound meandering channels based on the Manning–Strickler equation.[6] studied the influence of channel geometry, floodplain widths and roughness on the stage-discharge relationship.[7] developed a procedure to calculate conveyance in meandering channels with over bank flow based on the horizontal d ivision of the cross section.[8] developed the exchange discharge model.[9] presented a practical method to predict depth-averaged velocity and shear stress for meandering over bank flows.[10] investigated the velocity field in meandering compound channels with over bank flow through numerical methods.[11] carried out discharge

84 Prabir K Mohanty et al.: Flow Investigations in a Wide Meandering Compound Channel
measurements for over bank flow in a two-stage meandering channel with various bed slopes, sinuosity, and water depths.
Conveyance Estimation System (CES Project Record[12] developed by joint Agency/DEFRA research programme on flood defense, reduces uncertainties in the estimation of river flood levels, d ischarge capacities, velocities and extent of inundation and is now recommended in UK and other European nations as a major tool for estimating discharge,depth averaged velocities and boundary shear for natural channels of straight and meandering p lanform as well as for artificial and laboratory flumes.[13]studied the horizontal vortices in two stage compound channels by conducting flow v isualization measurements using multi-layer scanning PIV system.[14] analyzed the compound meandering channel flow by simulat ing the flow through numerical experiments.[15] based on the experimental results of meandering compound channels developed equations for discharge distribution in a meandering compound channels.
From above literature it is ascertained that different researchers have studied the meandering channel by performing experiments in large scale and small scale laboratory flumes wherein meandering channels of different geometrical parameters like cross sectional shapes, aspect ratio (δ,where δ is the rat io of bottom width to depth), width ratios(α,where α=rat io of floodplain width to main channel width) and under different relative depth for overbank flow (where relative depth β=rat io of depth of flow over floodplain to overall depth of flow in cross section)conditions. With different combinations of above flow and geometric parameters the behavior of flow could be studied in detail under these laboratory simulated condition and empirical relationships were established among many dependent and independent flow variables. Similarly purely on basis of theoretical analysis some mathematical relationships among various flow variables such as stage-discharge, boundary shear,velocity,discharge distribution etc. could also be established. Thirdly numerical studies often involving 1dimensional, 2dimensional or complete 3d aspects were taken up and flow field parameters both for simple and complex domain under a variety of test conditions could be appropriately captured and complete flow field could be adequately defined.
However a systematic explorat ion of the experimental data base from previous published literature revealed that experimentation on compound meandering channel having width rat io (α) equal to 10 or more and with aspect ratio(δ)≥5(as for natural channels) is almost scarce with the exception of EPSRC-FCF seriesB channel at HR-Wallingford,UK constructed exclusively to carry out research on trapezoidal and natural compound meandering channels which had an α value ≈11.To experimentally verify the dependence of boundary shear and velocity and various other flow characteristics on the sinuosity of meandering compound channels(where sinuosity Sr is
defined as ratio of length along thalweg to valley length of the channel) a series of experiments are being performed in Flu id mechanics & hydraulics laboratory of NIT,Rourkela keeping the geometry of channels constant but with varying sinuosity (ranging from 0-4). The present work is concerned with experimental results from one low sinuous channel (Sr=1.11) i.e . asine –generated meandering channel with cross over angle 400. The velocity and boundary shear data is shown under varying overbank depth of flow (different β values) conditions. Next a numerical depth averaged 2D model CCHE2D developed by National Center for Computational Hydroscience and Engineering, University of Missisipi,USA is applied to verify whether the said hydrodynamic software tool is able to model effectively the flow for meandering compound channel for the laboratory tested cases or not? Additionally Conveyance Estimation System(CES), a quasi 1d imensional tool developed at DEFRA,Govt. of UK and other agencies has also been used to estimate the desired flow parameters fo r the laboratory test cases. Finally results from numerical experiments and physical experiments are systematically compared and contrasted and conclusions are drawn in the end section based on such findings.
2. CCHE2D Model The shallow water equations are usually derived from
depth-integrating the Navier–Stokes equations, in the case where the horizontal length scale is much greater than the vertical length scale. Under this condition, conservation of mass implies that the vertical velocity of the fluid is small. It can be shown[16] from the momentum equation that vertical pressure gradients are nearly hydrostatic, and that horizontal pressure gradients are due to the displacement of the pressure surface, imply ing that the horizontal velocity field is constant throughout the depth of the flu id. Vert ically integrating allows the vertical velocity to be removed from the equations. The momentum equations for depth-integrated two-dimensional turbulent flows in a Cartesian coordinate system are:
(1)
(2)
where u and v are depth-integrated velocity components in x and y directions, respectively; t is the time ; g is the gravitational acceleration; η is the water surface elevation; ρ is the density of water; h is the local water depth; fCor is the Coriolis parameter and τxx, τxy ,τyy,andτyx are depth integrated Reynolds stresses and τbxand τby are shear stresses on the bed and flow interface. However the shear stress terms at the water surface are dropped since wind shear driven effect is not considered in the present version of CCHE2D model. Free surface elevation for the flow is calculated by the
vfhy
hx
hhx
gyuv
xuu
tu
Corbxxyxx +−
∂
∂+
∂∂
+∂∂
−=∂∂
+∂∂
+∂∂
ρτττη 1
ufhy
hx
hhy
gyvv
xvu
tv
Corbyyyyx −−
∂
∂+
∂
∂+
∂∂
−=∂∂
+∂∂
+∂∂
ρτττη 1

International Journal of Hydraulic Engineering 2012, 1(6): 83-94 85
depth-integrated continuity equation:
(3)
Assuming the bed elevation, ζ would not change in the flow simulat ion process andSo
(4a)
Also (4b)
Hence one gets simplified continuity equation as
(5)
Where η is the free surface elevation, h is the water depth. For hydrodynamic process in absence of bed morphological changes (as in rigid smooth channels applicable in present case)equation (5) is usually applicab le .However in case of fast erosion and deposition as in case of loose or mobile bed equation(3) instead of equation(5) is to be solved in conjunction with equations (1&2) for flow simulat ion. The turbulent Reynolds stresses in equations(1 &2) are approximated according to Boussinesq’s assumption that they are related to the main rate of the strains of depth averaged flow field with coefficients of eddy viscosity and can be chosen from two models availab le in the CCHE2D viz.depth integrated parabolic eddy viscosity model and depth integrated mixing length model. In addition to these two further models are availab le; one is a k-ε model and another Smagorinski model as the accuracy of turbulence closure is[17].The finite element method used in CCHE2D is Efficient Element Method which was in itiated by[18]. Collocation approach of the finite element method is adopted to discretize the mathematical equation system. Further details regarding the Interpolation functions, finite element transformations, mesh and solution methods are available in technical manual of CCHE2D[16].The structured mesh generator (CCHE2D Mesh Generator) is used to prepare the mesh for the flow domain to be simulated and can then be imported to the main engine of CCHE2D for hydrodynamic simulation. In general the procedure for setting up the model domain and running the simulation through the GUI available under CCHE2D can be listed as the following steps.
• Mesh generation • Specification of boundary condition • Parameters setting • Simulation • Results visualization and interpretation The numerical modelling based on solving the
Navier-Stokes equations is an initial-boundary value problem. The user has to provide the initial conditions and the boundary conditions for simulat ion to run s moothly. The in itial water surface is generally provided from the calculated water level at upstream and downstream of the
domain to be modelled under in itial conditions and discharge at upstream and water surface level at downstream are given as boundary conditions for the simulation. While generating the mesh for physical domain care needs to be taken to ensure that the interested region in the physical domain is sufficiently away from in let and outlet section as well as should have sufficient resolution to capture the quick variat ions in flow properties such as depth averaged velocity and boundary shear etc near the wall. There are different schemes available in the CCHE-MESH where it is advised to initially generate an algebraic mesh using some stretching functions and then subsequently improve upon it by adopting some variant out of nine kinds of numerical mesh generation system. One has to only apply successive schemes to generate the mesh and evaluate its quality by checking d ifferent parameters. Only after the mesh is satisfactory then only should it be adopted finally for simulation purpose.
3. Conveyance Estimation System (CES)
Recently, the Conveyance Estimation System (CES) developed by joint Agency/DEFRA research programme on flood defense, with contributions from the Scottish Executive and the Northern Ireland Rivers Agency,HR Wallingford and the Environment Agency, UK, has been recommended for use in natural and artificial straight and meandering channels for estimating conveyance, computing stage discharge relationship and also a number of flow parameters like depth averaged velocity, boundary shear, energy coefficients etc for ordinary users and researchers alike in UK and in large parts of Europe as CES reduces uncertainties in the estimat ion of river floodlevels, discharge capacities, velocities and extent of inundation [19]. CES is the culmination of a sustained effort of task force comprising academic researchers, experts and users specifically set up by Brit ish environmental agency[20] to include recent research advances in the field o f river engineering. The calculat ion methodology that has been adopted is applicable to all river and floodplain morphologies.CES considers all the physical flow processes that are present in a flow situation and where necessary, includes empirical or calibration coefficients based on previous research and expert advice. It has, due to its scientific approach nearly replaced its popular rival tools viz. HEC-RAS or MIKE11 which are based on historical handcalculation methods such as ‘divide channel methods(DCM)’ forconveyanceorflow estimation in straight or meandering channel.
4. Detailsof Materials Usedand Procedure
For carrying out research in compound channels,
0=∂
∂+
∂
∂+
∂
∂
y
vh
x
uh
t
h
0=∂∂
tζ
ζη −=h
0=∂∂
+∂∂
+∂∂
yvh
xuh
tη
86 Prabir K Mohanty et al.: Flow Investigations in a Wide Meandering Compound Channel
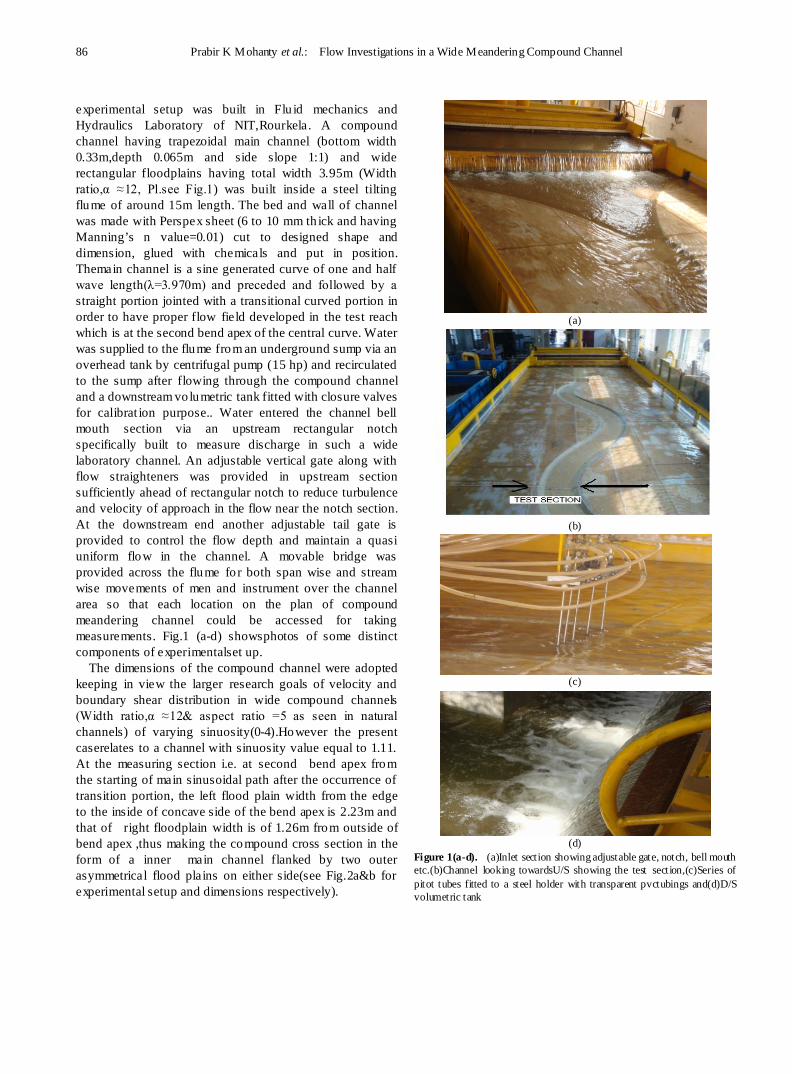
experimental setup was built in Flu id mechanics and Hydraulics Laboratory of NIT,Rourkela. A compound channel having trapezoidal main channel (bottom width 0.33m,depth 0.065m and side slope 1:1) and wide rectangular floodplains having total width 3.95m (Width ratio,α ≈12, Pl.see Fig.1) was built inside a steel tilting flume of around 15m length. The bed and wall of channel was made with Perspex sheet (6 to 10 mm th ick and having Manning’s n value=0.01) cut to designed shape and dimension, glued with chemicals and put in position. Themain channel is a sine generated curve of one and half wave length(λ=3.970m) and preceded and followed by a straight portion jointed with a transitional curved portion in order to have proper flow field developed in the test reach which is at the second bend apex of the central curve. Water was supplied to the flume from an underground sump via an overhead tank by centrifugal pump (15 hp) and recirculated to the sump after flowing through the compound channel and a downstream vo lumetric tank fitted with closure valves for calibrat ion purpose.. Water entered the channel bell mouth section via an upstream rectangular notch specifically built to measure discharge in such a wide laboratory channel. An adjustable vertical gate along with flow straighteners was provided in upstream section sufficiently ahead of rectangular notch to reduce turbulence and velocity of approach in the flow near the notch section. At the downstream end another adjustable tail gate is provided to control the flow depth and maintain a quasi uniform flow in the channel. A movable bridge was provided across the flume fo r both span wise and stream wise movements of men and instrument over the channel area so that each location on the plan of compound meandering channel could be accessed for taking measurements. Fig.1 (a-d) showsphotos of some distinct components of experimentalset up.
The dimensions of the compound channel were adopted keeping in view the larger research goals of velocity and boundary shear distribution in wide compound channels (Width ratio,α ≈12& aspect ratio =5 as seen in natural channels) of varying sinuosity(0-4).However the present caserelates to a channel with sinuosity value equal to 1.11. At the measuring section i.e. at second bend apex from the starting of main sinusoidal path after the occurrence of transition portion, the left flood plain width from the edge to the inside of concave side of the bend apex is 2.23m and that of right floodplain width is of 1.26m from outside of bend apex ,thus making the compound cross section in the form of a inner main channel flanked by two outer asymmetrical flood plains on either side(see Fig.2a&b for experimental setup and dimensions respectively).
(a)
(b)
(c)
(d)
Figure 1(a-d). (a)Inlet section showing adjustable gate, notch, bell mouth etc.(b)Channel looking towardsU/S showing the test section,(c)Series of pitot tubes fitted to a steel holder with transparent pvctubings and(d)D/S volumetric tank

International Journal of Hydraulic Engineering 2012, 1(6): 83-94 87
Figure 2(a). Schematic diagram of Experimental Setup
Figure 2(b). Longitudinal & Cross sectional dimension of the compound channel; section XX’@channel bend apex(Test section)
Table 1. Hydraulic parameters for the experimental runs
Sl. no. of Runs
*Discharge Q in lit /s Overbank depth H in cm
Relative depth β(H-h/H) Froude no.(Fr) Reynolds no.(R)
1 17.074 8.06 0.19354839 0.2199681 19681.77
2 27.617 8.55 0.23976608 0.28274994 27641
3 47.245 9.5 0.31578947 0.33944679 38865.04
4 70.338 10.2 0.3627451 0.40923323 52128.25
5 93.667 11 0.40909091 0.4432553 63233.17
*---Discharges as per measured from contour diagram
Point velocities were measured along verticals spread across the main channel and flood plain so as to cover the width of entire cross section. Also at a no. of horizontal layers in each vert ical, point velocit ies were taken. Particularly the point velocities at a depth of 0.4H(where H is the depth of flow at that lateral section across the channel)from channel bed in main channel regionand 0.4(H-h) on floodplains (h is depth of main channel) were measured throughout the lateral section of the compound cross section to experimentally determine the depth averaged velocitydistribution under each discharge condition.Measurements were thus taken from left edge point of flood plain to the right edge of floodplain including the main channel bed and side slope. The lateral spacing of grid points over which measurements were taken was kept
4cm inside the main channel and 8cm on the flood plain (Figure.3 shows the grid diagram used for experiments). Velocity measurements were taken by pitot static tube (outside diameter 4.77mm) and two p iezometers fitted inside a transparent fiber b lock fixed to a wooden board and hung vertically at the edge of flume the ends of which were open to atmosphere at one end and connected to total pressure hole and static hole of pitot tube by long transparent PVC tubes at other ends. Before taking the readings the pitot tube along with the long tubes measuring about 5m were to be properly immersed in water and caution was exercised for complete expu lsion of any air bubble present inside the pitot tube or the PVC tube. Even the presence of a small air bubble inside the static limb or total pressure limb could give erroneous readings in

88 Prabir K Mohanty et al.: Flow Investigations in a Wide Meandering Compound Channel
piezometers used for recording the pressure. This set up has to be used both for velocity and boundary shear measurements on bed and wall as the shear stress was to be measured indirectly by Preston tube method using Patel’s[21] calibrat ion curve. Th is is considered the best practice of measurement of boundary shear stress and so it was also adopted for measurement of skin friction in all EPSRC-FCF,UK channel experiments,[22,23].Steady uniform discharge was maintained in each run of the experiment and altogether five runs were conducted for overbank flow with relative depth β varying between 0.1935-0.4090. The discharge varied between 17.074lit/s to 93.667lit/s and Froude’s no. was kept between 0.2199-0.4433 i.e. a subcritical flow condition all throughout the test runs and Reynold’s no. was observed to be within 19681.77-63233.17 for the test conditions. Please see Table.1 for the hydraulic parameters considered in the experimental runs.
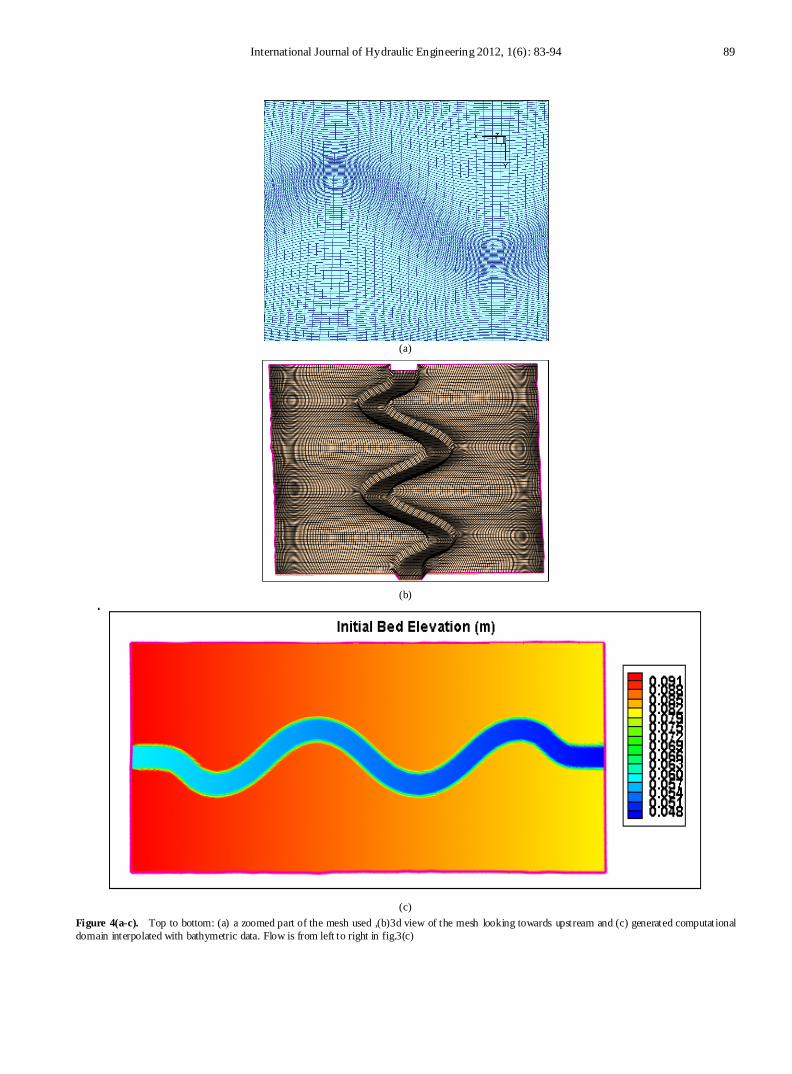
5. Numerical Analysis Mesh,Initial & Boundary Conditions,time step The mesh is created for the physical flow domain of the
meandering compound channelwith the help of mesh generator module CCHE-MESH prov ided separately with the CCHE2D package.Considering the nature of physical domain for the channel,a multib lock boundary approach is adopted as the method is considered more suited to present case than a single block approach.For thecompound channel a 3 b lock domain is selected. The total width of crosssection is divided into 3 blocks selecting the width of each b lock so that a smooth transition in mesh resolution is obtained from centre of main channel to the floodplain ends resulting in gradual reduction in mesh density in outward direction (Fig.4a &b) from the main channel and floodplain walls.The mesh is sufficiently dense near the walls as quick
variations in flow parameters occur in these regions. The main channel and floodplains on either side constitute 3blocks respectively.The main channel block has 50×80 nodes and the left and right flood plain zones have 78×80nodes each so that the entire domain consists of 208×80 nodes i.e.208 grid lines in spanwise and 80 grid lines in streamwise direct ion.
The mesh quality is tested by evaluating the several parameters available in the mesh GUI. Some useful indicators are Average deviation from orthogonality (ADO)=7.91Average aspect ratio(AAR)= 7.52,Minimum cell length in I(spanwise)direct ion= 0.0054mand Min cell length in J(streamwise)direct ion= 0.068m. Once mesh was prepared,it was then subjected to bed interpolation by using the computed bathymetric data for the physical domain. Here again out of several options only by using judgement one had to adopt a particular interpolat ion method. In present case interpolation was done by triangulation to generate the requisite computational domain. The figure4(a-c) shows the details regarding the mesh used and mesh with bed interpolated appropriate and in readiness for simulation.Since CCHE2D is an initial and boundary value model,where the user has to provide initial conditions for water level at upstream and downstream ends of the model domain the same was duly provided by computing the water levels at u/s and d/s ends from bathymetry data and depth of flow. Similarly the discharge conditions for each run at u/s section and water level at d/s section were provided as boundary conditions for the simulation to start. The time step was taken as 0.01s and total time for simulation was kept at 100s for all runs inorder to get stable solutions. All the simulation were run as steady state. The flow charts for both mesh generation and running the simulat ion are presented in Figure A1 and A2 respectively in appendix section.
Figure 3. Meander compound cross section with the grid of measurement points for velocity, shear etc
International Journal of Hydraulic Engineering 2012, 1(6): 83-94 89
(a)
(b)
(c)
Figure 4(a-c). Top to bottom: (a) a zoomed part of the mesh used ,(b)3d view of the mesh looking towards upstream and (c) generated computational domain interpolated with bathymetric data. Flow is from left to right in fig.3(c)
90 Prabir K Mohanty et al.: Flow Investigations in a Wide Meandering Compound Channel
6. Results and Discussion Since CES is capable of estimating conveyance or flow
in both straight and meandering compound channel,so first the stage discharge curve is computed with same and is shown in comparison with actual values from experimental observation in fig.5. It is seen that the outputs from CES is quite satisfactory although a small variat ion is found at some depths .This is due to the calculation being perfo rmed in a meandering channel where there is considerable variation in flow depths at inner bank and outer banks owing to curvilinearity in flow path.
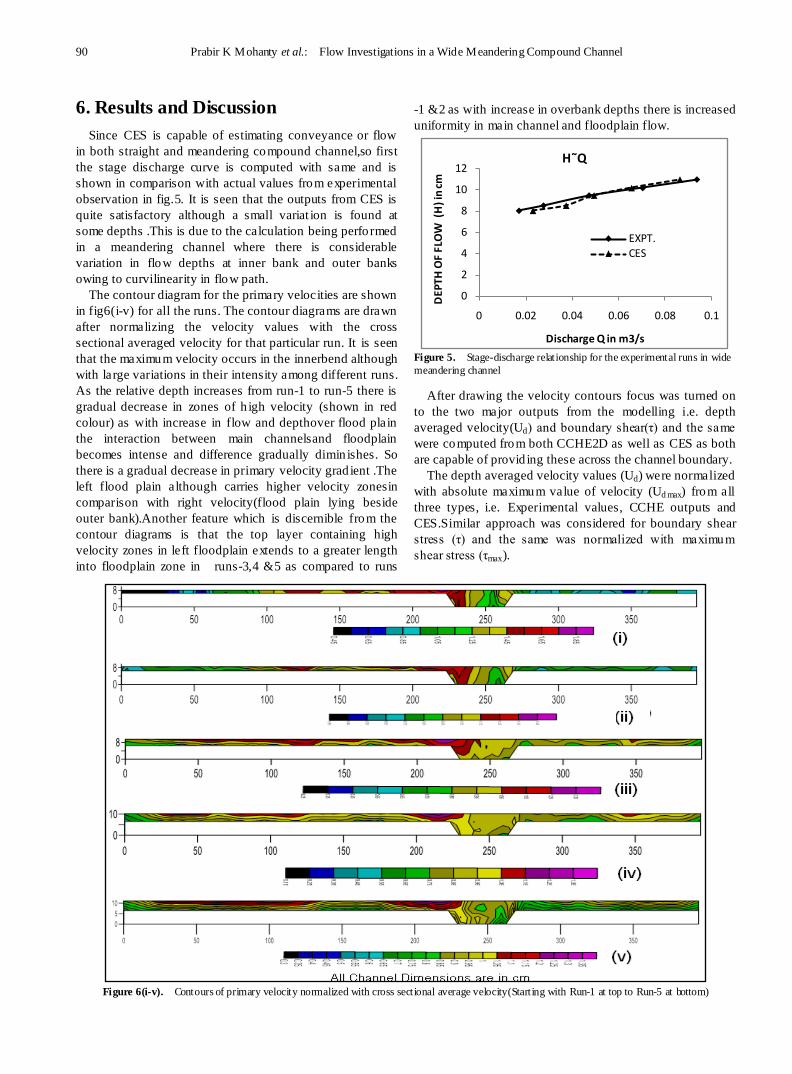
The contour diagram for the primary velocities are shown in fig6(i-v) for all the runs. The contour diagrams are drawn after normalizing the velocity values with the cross sectional averaged velocity for that particular run. It is seen that the maximum velocity occurs in the innerbend although with large variations in their intensity among different runs. As the relative depth increases from run-1 to run-5 there is gradual decrease in zones of h igh velocity (shown in red colour) as with increase in flow and depthover flood plain the interaction between main channelsand floodplain becomes intense and difference gradually dimin ishes. So there is a gradual decrease in primary velocity grad ient .The left flood plain although carries higher velocity zonesin comparison with right velocity(flood plain lying beside outer bank).Another feature which is discernible from the contour diagrams is that the top layer containing high velocity zones in left floodplain extends to a greater length into floodplain zone in runs-3,4 &5 as compared to runs
-1 &2 as with increase in overbank depths there is increased uniformity in main channel and floodplain flow.
Figure 5. Stage-discharge relationship for the experimental runs in wide meandering channel
After drawing the velocity contours focus was turned on to the two major outputs from the modelling i.e. depth averaged velocity(Ud) and boundary shear(τ) and the same were computed from both CCHE2D as well as CES as both are capable of provid ing these across the channel boundary.
The depth averaged velocity values (Ud) were normalized with absolute maximum value of velocity (Ud max) from all three types, i.e. Experimental values, CCHE outputs and CES.Similar approach was considered for boundary shear stress (τ) and the same was normalized with maximum shear stress (τmax).
Figure 6(i-v). Contours of primary velocity normalized with cross sectional average velocity(Starting with Run-1 at top to Run-5 at bottom)
0
2
4
6
8
10
12
0 0.02 0.04 0.06 0.08 0.1
DEP
TH O
F FL
OW
(H
) in
cm
Discharge Q in m3/s
H˜Q
EXPT.CES

International Journal of Hydraulic Engineering 2012, 1(6): 83-94 91
(i)
(ii)
(iii)
(iv)
(v)
Figure 7(i-v). (Continue from figure in the previous column) Depth averaged velocity diagrams for different runs(velocity Ud normalized with maximum velocity,Udmax)
Thus figures.7 (i-v ) & 8(i-v) show velocity and shear diagrams for d ifferent runs or varying relat ive depth (β) values for the channel. As the basic aim of this paper was to show ,how good the CCHE2D model’s capability in case of a wide compound meandering channel under varying hydraulic conditions ,so figures.7 &8 are used to reveal these features of numerical models vis a vis experimental observations.
(i)
(ii)
0
0.2
0.4
0.6
0.8
1
1.2
0 2
Ud/
Udm
ax
Lateral distance(y) in m
Depth averaged velocity-Run1CES
EXPT.
CCHE
Channel boundary
0
0.2
0.4
0.6
0.8
1
1.2
0 2
Ud/
Udm
ax
Lateral distance (y) in m
Depth averaged velocity-Run2
CES
CCHE
EXPT.
Channel boundary
0
0.2
0.4
0.6
0.8
1
1.2
0 2
Ud/
Udm
ax
Lateral distance (y) in m
Depth averaged velocity-Run3CES
CCHE
EXPT.
Channel boundary
00.20.40.60.8
11.2
0 2
Ud/
Udm
ax
Lateral distance (y) in m
Depth averaged velocity-Run4CES
CCHE
EXPT.
Channel boundary
00.20.40.60.8
11.2
0 2
Ud/
Udm
ax
Lateral distance(y) in m
Depth averaged velocity-Run5CES
CCHE
EXPT.
Channel boundary
00.20.40.60.8
11.2
0 2
τ/τ m
ax
Lateral distance (y) in m
Shear stress-Run1CES
CCHE
EXPT.
Channel boundary
0.0
0.2
0.4
0.6
0.8
1.0
1.2
0 2
τ/τ m
ax
Lateral distance (y) in m
Shear stress-Run2CCHE
CES
EXPT.
Channel boundary

92 Prabir K Mohanty et al.: Flow Investigations in a Wide Meandering Compound Channel
(iii)
(iv)
(v)
Figure 8(i-v). (Continue from previous column) Shear stress diagrams for different runs(shear stress τ normalized with maximum shear stress τmax)
To compare it further with a standardized results, the CES predict ions are also shown in each case. Looking at figure7, it is seen that except in runs 1&2 i.e . the tests with low relative depths in all other cases the depth averaged velocity values are quite in agreement among theexperimental result,CCHE2D result and CES result. But in the first two cases under low overbank flow conditions the CES predictions are qu ite at variance with CCHE andexperimental values. Of course the CCHE2D results for these cases have still some differences fromrespective experimental values. However the overallpredict ions of depth averaged velocity values from CCHE2D can be acceptable.
In figure.8 also the shear stress values for all cases can be compared among the CCHE, CES and experimental results. Although general pattern of shear stress variations are same, but unlike velocity case here one can see large difference between CCHE2D and CES results in all five runs. However the CCHE2D results match the experimental values to a satisfactory degree. The shear stress values always are the highest in CCHE2D predict ions compared to experimental or CES values. To get good matching alternate turbulence models available in the package were tried but no better results could be obtained. Fig9(a&b)shows the effect of water depth in the depth averaged velocity and boundary shear predictions by CCHE2D simulated runs. Both seem to be monotonically rising with increased β values which is normally expected.
(a)
(b)
Figure 9. CCHE2D predictions (a) Left: Velocity predictions (b) Right: Shear stress
7. Conclusions Experiments were conducted in a smooth meandering
compound channel having width ratio(α≈12) under different values of relative depth(β) and velocity contours were shown. It is seen that with increased relative depth the primary velocity grad ient decreases in both sides of bend apex in a meandering compound channel. However the velocity magnitude remains higher in inside of bend and adjacent floodplain than in outside zone of the bend.
0
0.2
0.4
0.6
0.8
1
1.2
0 2
τ/τ m
ax
Lateral distance (y) in m
Shear stress-Run3CES
CCHE
EXPT.
Channel boundary
0
0.2
0.4
0.6
0.8
1
1.2
0 2
τ/τ m
ax
Lateral distance (y) in m
Shear stress-Run4CES
CCHE
EXPT.
Channel boundary
00.20.40.60.8
11.2
0 2
τ/τ m
ax
Lateral distance (y) in m
Shear stress-Run5CES
CCHE
EXPT.
Channel boundary
0.000.100.200.300.400.500.60
0 2
Ud
in m
/s
Lateral distance (y) in m
Variation of depth averaged velocity(Ud) with βvalues Run1
Run2Run3Run4Run5
0.0
0.2
0.4
0.6
0.8
1.0
0 2
τ in
N/m
2
Lateral distance(y) in m
Shear stress (τ)variation with β valuesRun1Run2Run3Run4Run5Channel boundary
International Journal of Hydraulic Engineering 2012, 1(6): 83-94 93
A two dimensional hydrodynamic model CCHE2D and another quasi 1D model CES were then used to extract the flow features such as depth averaged velocity and boundary shear for all the experimental runs. It is shown that CCHE2D is quite capable of replicating the flow in such a complex physical domain on basis of close similarity between simulated values of velocity and boundary shear and experimentally observed values.
CES although could satisfactorily reproduce the velocity values across the compound channel but under predicted boundary shear in most cases. However it could satisfactorily produce the stage-discharge curve in agreement with observed curve from the experiment.
It can be fairly concluded that CES can be used to estimate stage-discharge relationship whereas CCHE2D can be used to predict the spanwise velocity and boundary shear in wide s mooth compound meandering channel.
ACKNOWLEDGEMENTS The availability of and permission to use the CCHE2D
software as an open source package by the National Centre for Computational Hydroscience and Engineering (NCCHE),University of Missisipi,US is thankfully acknowledged. The authors also wish to put on record their deep gratitude to the Director and scientists of NCCHE, especially to Dr.Yaoxin Zhang and Dr.YafeiJia for lending their valuable advice and technical support on numerous occasions while conducting the simulation through CCHE2D. The authors wish to acknowledge thankfully the support received by the third author from DST India, under grant no. SR/S3/MERC/066/2008 fo r conductingexperimental research work on compound channels at NIT,Rourkela. Last but not the least, the authors wish to thank authorities at HR, Wallingford for making Conveyance Estimation System(CES) software freely available.
Notations The following symbols have been used in this paper. α =Width ratio β = Relative depth τ=boundary shear stress at a point τmax=absolute maximum shear stress τxx, τxy, τyy and τyx=Reynolds stresses η= water surface elevation δ= aspect ratio ρ=density of water ζ=bed elevation g= accelerat ion due to gravity h= depth of main channel H=Overbank or overall depth fCor= Coriolis parameter Q =Discharge Ud=depth averaged velocity in stream wise direction
Umax =maximum depth averaged velocity
Appendix
Figure A1. FLOW CHART FOR MESH GENERATION THROUGH CCHE2D_MESH
Figure A2. FLOW CHART FOR RUNNING A SIMULATION IN CCHE2D GUI

94 Prabir K Mohanty et al.: Flow Investigations in a Wide Meandering Compound Channel
REFERENCES [1] Toebes, G.H., and Sooky, A.A., (1967),"Hydraulics of
Meandering Rivers with Flood plains", Journal of the waterways and Harbor Div., Proc. of ASCE, Vol.93, No.WW2, May, pp. 213-236.
[2] Chang, H.H.,(1983), "Energy Expenditure in Curved Open Channels", Journal of Hydr. Engg., ASCE, Vol.109, No.7, pp.1012-1022.
[3] Chang, H.H.,(1984),"Regular Meander Path Model", Journal of Hydr. Engg., ASCE, Vol.110, No.10, pp.1398-1411.
[4] Ervine, D.A., and Ellis, J. (1987). “Experimental and Computational Aspects of Overbank Flood-Plain Flow.” Trans. Royl. Society Edinburgh, Series A, Vol.78, pp. 315-325.
[5] Greenhill, R.K. andSellin, R.H.J., (1993), "Development of a Simple Method to Predict Discharge in Compound Meandering Channels", Proc. of Instn. Civil EngrsWat., Merit and Energy, 101, paper 10012, March, pp. 37-44.
[6] Sellin, R.H.J., Ervine, D.A., and Willetts B.B., (1993), "Behavior of Meandering Two stage Channels", Proc. of Instn. Civil Engrs. Wat. Marit.and Energy, June, Vol.101, pp.99-111, paper No.10106.
[7] Wark, J.B., and James, C.S., (1994), "An Application of New Procedure for Estimating Discharge in Meandering Overbank Flows to Field Data", 2nd Intl. Conf. on River Flood Hydraulics 22-25 March, Published by John Wiley & Sons Ltd, pp.405-414.
[8] Bousamar, D. Zech, Y. (1999). “Momentum Transfer for Practical Flow Computation in Compound Channels.” Journal of Hydraulics Division, ASCE, Vol25, No.7, Paper No. 18224.
[9] Ervine D. A., Koopaei K.B., and Sellin R. H.. J. (2000).“ Two-Dimensional Solution for Straight and Meandering Over-bank Flows.” Journal of Hydraulic Engineering, ASCE, Vol. 126, No. 9, September, paper No.22144, 653-669.
[10] Morvan ,H., Pender G. ,Wright N. G. , and Ervine D. A.(2003). “Three-DimensionalHydrodynamics of
Meandering Compound Channels.” Journal of Hydraulic Engineering. 128(7), 674-682.
[11] Shiono, K., Al-Romaih, J.S., and Knight, D.W., (1999),"Stage-Discharge Assessment in Compound Meandering Channels", Jr. of Hydr.Engg.,ASCE vol.125, No.1. pp.66-77
[12] Project Record W5A-057(2001-04). “Reducing Uncertainty In River Flood ConveyancE, Conveyance Manual, Defra / Environment AgencyFlood and Coastal Defence R&D Programme. HR Wallingford Ltd, Howbery Park, Wallingford, Oxon OX10 8BA.
[13] Sanjo,M.,Nezu,I and Doi,T.Q.H.(2007),”Experimental Study on Horizontal Vortex in Meandering Compound Open- channel flow with Multi-layer Scanning PIV”, Doboku GakkaiRonbunshu B(2007),Science East(Japan).
[14] Jing,H.,Guo,Y.,Li,C.andZhang,J.,(2008),”Three-dimensional numerical simulation of compound meandering open channel flow by the Reynolds stress model”. International Journal For Numerical Methods In Fluids Int. J. Numer. Meth. Fluids 2009; 59:927–943
[15] Khatua,K.K.andPatra,K.C.(2007). “Boundary shear stress distribution in meandering compound channel flow.” Wilson, A.L., Dehaan, R.L., Watts, R.J., Page, K.J., Bowmer, K.H., & Curtis, A. (Ed). Proceedings of the 5th Australian Stream Management Conference. Australian rivers: making a difference. Charles Sturt University, Thurgoona, New South Wales.
[16] Jia,Y.andWang,S.S.Y.(2001b). “CCHE2D CCHE2D : Two-dimensional Hydrodynamic and Sediment Transport Model for Unsteady Open Channel Flows over Loose Bed”, Technical Manual,CCHE-TR-01-02.
[17] Rodi, W., 1979, Turbulence Models and Their Application in Hydraulics, IAHR, State of Art Paper, IAHR section on Fundamental of Division II: experimental and mathematical fluid dynamics.
[18] Wang Sam S.Y., and Hu, K.K.,1992 “Improved methodology for formulating finite-element hydrodynamic models”, In T,J, Chung, (ed) Finite Element in Fluids, Volume8, Hemisphere Publication Cooperation, pp 457-478.
[19] Knight, D.W., McGahey, C., Lamb, R. and Samuels, P.G.(2010). Practical Channel Hydraulics, Taylor and Francis Group, London, UK.
[20] Mcgahey& Samuels (2003). “ Methodology for conveyance estimation in two-stage straight, skewed and meandering channels,” XXX IAHR Congress, Thessaloniki, Volume C1 of Proceedings published by IAHR.
[21] Patel,V.C.(1965). “Calibration of the Preston tube and limitations on its use in pressure gradients.” Journal of Fluid Mechanics, Cambridge University Press. Vol. 23, p.185-208
[22] Knight, D.W., andSellin, R.H.J., 1987, ‘‘The SERC Flood Channel Facility’’,Journal of the Institution of Water &Envi-ronmentalManagement,Vol. 1, No. 2, October, pp 198-204
[23] Knight, D.W.[Ed], 1992, ‘‘SERC Flood Channel Facility ex-perimental data - Phase A’’, Vols 1-15, SR Report No. 314,HR Wallingford, (available from HR Wallingford, Oxon,OX10 8BA, UK).