Embed Size (px)
Citation preview

0

SECURITY CLASSiFiCATiON OF TýS PAA,ýE '" on Dest Entered)
REPORT DOCUAENTATION PAGE READ INSTRUCTIONSBEFORE CGMPLETING _ORM
I REPORT NUMBER 1ý. ,0VT ACCESj" N• 3 RFCIPiENT S CATAL.OG NUMSEr
NRL Memorandum Report .1940 if ~ ~ _______
4. TITLE (end SubtItl) 5 TYPE OF REPOR' 6 PERIOO CC't• fxO
VORTEX SHEDDING FROM A VIBRATING CABLE WITH Final report on the problem.ATTACHED SPHERICAL BODIES IN A LINEAR SHEARFLOW 6. PERFORMING ORG. REPORT NUMBER
7. AUTHOR(&) S. COf4TRACT OR GRANT NUMeER(e)
R. D. Peltzer
9. PERFORMING ORGANIZATION NAME AND ADODRESS 10. PROGRAM ELEMENT. PROJECT, TASK
AREA A WORK UNIT NUMSERS
Naval Research Laboratory 62760N; NCEL YF60.534;Washington, DC 20375 58-0274-00
II. CONTROLLING OFFICE NAME ANO ADORES; 12. REPORT OATE
Naval Civil Engineering Laboratory 131
Port Hueneme, CA 93043 13- NUMBER OF PAGESOctober 27, 1982
14. MONITORING AGENCY NAME & AODRESS(II different from Controlling Office) IS. SECUPITY CLASS. tof thle report)
UNCLASSIFIEDIS7. DIECLASSIFICATION/DOWNGRADING
SCHEDULE
14. DISTRISUTION STATEMENT (of this Report)
Approved for public release; distribution unlimited.
17. DISTRIBUTION STATEMENT (of the abstract etared In Block 20, If different from Report)
tO. SUPPLEMENTARY NOTES
19. KEY WORDS (Continua on reverse elde If necesaary and Identify by block number) T-' , "
Cable strumming .Vortex shedding -. ;Vortex-excited vibrationsMarine cables A
20. ASSTRACT (Continue on rever*e aide If necesarya and Identify by block number)
- Marine cables often comprise an integral part of a larger structural system, such as an offshoredrilling platform. They are also used to support marker buoys, as well as anchored or towed instrumentarrays. Consequently, the resonant flow-induced oscillations of these cables, caused by vortex shedding,are extremely undesirable because of the associated damaging phenomena.
The present study, which employ. hot wire anemometry as the principal investigative tool, wasundertaken to examine the behavior in the near wake of a flexible, helically wound, high aspect ratio(L/d - 107) marine cable in a linear shear flow (steepness parameter / = 0.0053) aL centerline Reynoldsnumbers between 2.0 X 1O3 < Re. < 4.2 X 10 4 . (Continues)
DOI I JA 1473 EDITION OF ' NOV 05 IS OSOLIETES/N 0102-014-6601
SECURITY CLASSIFICATION OF THIS PAGE (When Date Entaerd)

S E C jM F¶T Y C L A S S IrIC A T IO N O f T H I, S P A C.E li"0 . D o. @ £ rr. . ed )
20 ABSTRACT (Contlinud)
Particular attention was paid to lock-on or "synchronization" related changes associated withuniform and sheared flow past the cable when it was forced to vibrate in the first mode. The study wasextended to include an analysis of the effects on vortex shedding synchronization phenomena generatedby placing spherical bluff bodies along the cable span.
The frequency and reduced velocity boundaries of the lock-on regions, for both the cable andsphere-cable combination. as a function of vibration amplitude up to a/d = 0.322, were measured,plottd and analyzed. The critical reduced velocity of the vibrating cable was U*- 5.50, and for thesphere-cable combination U. - 3.39. A sudden increase in the vortex formation length in the near wakeof the vibrating cable occurred during perfect synchronization (U," - 5.50). Shortly thereafter, the for-mation length returned to stationary cable values.
At Rec 21 2.96 X 10 3 , the spanwise vortex shedding frequencies behind the stationary and vibratingcable in a linear shear flow (with and without the presence of spherical bluff bodies) were measured,plotted and the results compared. A stable cellular vortex shedding frequency structure, strengthened bythe synchronous vibration, existed along the span of the cable, The presence of and spacing between thespherical bodies along the cable span significantly affected the spanwise character of the near wakecellular structure. The length of the locked-on region was substantially increased (almost doubled) whenthe spherical bodies were present along the span of the cable.
C)P
SECURITY CLASSIFICATION OF THIS PAGE [lflpn De0 h Entered)
Li

CONTENTS
Nomenclature ........o.............. ............... ....... o. v
Acknowledgments ............ . . . .... 0.6... 9. 96 vii
i. INTRODUCTION ......... ...... ............ ..... .......... 1
II. BACKGROUND AND LITERATURE ............................. 4
A. Development of the Karman Vortex Street Wake....... 4
B Vortex Formation Length and Wake Width behindStatIonary Cylinders in Uniform Flow............... 7
C. Lock-on or Synchronization Phenomena: Anoverview of studies dealing with changesinduced in the near wake of a rigid cylinderby self-excited or forced motion of the body....... 10
D. Lock-on or Synchronization Phenomena: Anoverview of studies dealing with changesinduced in the near wake of a flexiblecylinder or cable by self-excited orforced motion of the body.# ..... .... 14
E. Stationary and Vibrating Bluff Bodies inLinear Shear Flowso........ .... *................ 17
F.VortexShedding Froma Sphere...... 21
G. Procedure Used to Design a Workable Experimental•Test Setup....s.. 23
H. A Brief Discussion of the Fast Fourier Transformand Related Topics (Power Spectra)................. 25
III. EXPERIMENTAL APPARATUS AND INSTRUMENTATION ............. 26
A. Wind Tunnel Test Facility ........ 26
B. Test Model ................................. o..... 28
C. Experimental Test Setup .......................... 29
ii
'i.ii
D. Cable Mode Shape Vibration Amplitude andFrequency Measurement ..... ......... . *. ... ...... 30
E. Vortex Shedding Frequency Measurement .............. 31
F. Cable Wake Width and Vortex Formation LengthInstrumentation ................................. 31
IV. EXPERIMENTAL METHODS .................................. 32
A. Cable Mode Shape and Vibration Frequency
B. Cable Lock-on Region Tests......................... 33
C. Vortex Formation Length (Lf) and WakeWidth (Lw) ....................................... 35
D. Sphere Lock-on Regions ............................ 36
E. Sphere Region of Influence......................... 37
F. Spanwise Sheared Flow Tests......................... 38
V. RESULTS AND DISCUSSION...................*............. 41
A. Cable Mode Shapes .................................. 41
Bo Lock-on Phenomena ...... .... *. .. ... ..... ............ 42
C. Formation Lengths and Wake Widths.................. 51
D. Sheared Flow Results.... ........... .. ......... .... 55
Vl. SUMM*ARY ........... b .................................... 64
A. Findings and Conclusions........................... 64
B. Recommendations for FurtherStudy.................. 66
REFERENCES .... . . . . .. . . . ....................o.....o* v * o ~ oe 9 * ~ o e o 68
APPENDIX A. FIGURES.. ......................................... 72
APPENDIX B PREVIOUSLY ESTA3LISHED METHODS.............o...... 123
iv
Nome nclature
a/aeax nondimensional mode shape amplitude
a/d local nondimensional vibration amplitude
amax/d nondimensional vibration amplitude at an antinode
CD drag coefficient
Cpb base pressure coefficient
d general bluff body diameter (cable, cylinder, etc.)
ds sphere diameter
fc Nyquist folding frequen ycso vortex shedding frequency from a cable
fcsv vortex shedding frequency from a vibrating cable
fcv forced cable vibration frequencys vortex shedding frequency from sphere
fssv vortex shedding frequency from a vibrating sphere
L/d nondimensional length
Lf/d nondi:ensional vortex formation length
Lw/d nondimensional bluff body wake width
LO spanwise lock-on regionn integers (1,2,3,....)
N number of consecutive nonzero s.-uplesRe (Ud/v) general Reynolds numberRe* ((Ucds/v) sphere Reynolds number
Rec (Ucd/v) centerspan Reynolds number
SG specific gravity
St (fd/U) Strouhal number
Stc (fcsvd/Uc) centerspan Strouhal number
St (fssods/Uc) sphere Strouhal number
Sosv Strouhal number from a vibrating cable
Scv Strouhal number of the cable vibration
t time
T cable tension (Ibf)
Tr data record
Tu turbulence intensity
V
U velocity (local)
Uc velocity at wind tunnel centerspan
U ; (Uc/fcvd) reduced velocity
U critical reduced velocity
x(t) analog signal
-x/d nondimensional vertical location
y/d nondimensional sparwise (horizontal) location
z/d nondiminens.onal streaiwise (downstream) location
8 (d/UW dU/dy) shear parameter
Af spectral resolution bandkidth
A :"ampling frequency (.,T)
V kineas tic viscosity
"p mass density (Ibfsec 2 /ft 4 )
Wn natural frequency of vibration
IIr
[vi
r'-

ACKNOWLEDGMENTS
The present work was funded as part of the marine cable dynamics
research program of the Naval Civil Engineering Laboratory in Port Hueneme,
California (NRL Contract N00173-80-CO211). The experiments were conducted
at the Virginia Polytechnic Institute and State University. Dr. Owen M.
Griffin of the Naval Research Laboratory in Washington, D.C. was the
Technical Monitor.
This report was submitted by the author to the faculty of the VirginiaPolytechnic Institute and State University in partial fulfillment of the
requitements fur the degree of Doctor of Philosophy in Aerospace and Ocean
Engineering.
The author wishes to thank Dr. Owen M. Griffin for his comments andsuggestions regarding the dissertation as it was being written. The ever
present assistance and guidance of Dr. David M. Rooney, committee chairman,
is greatly appreciated. The author wishes to thank the four other committee
members; Dr. W.L. Hallauer, Dr. W.S. Saric, Dr. J.A. Schetz and Dr. A.G.
Szeless, for their generosity in providing some of tha instrumentation andideas used toward the successful completion of this study.
The author would also like to express his gratitude to the basementcrew; Jake, Harry, Kent, Wendell, and Frank for all the help and advice they
provided to him during his four years with them in the basement of Randolph
Hall at VPI&SU.
vii
- - - -. . - -. .. . . . . • . . . . . . . . . - . .. . -.... -... • .. . . . . . . . . . . . .. 1 -
VORTEX SHEDDING FROM A VIBRATITG CABLEWITH ATTACHED SPHERICAL BODIES IN A LINELAR SHEAR FLOW
I. Introduction
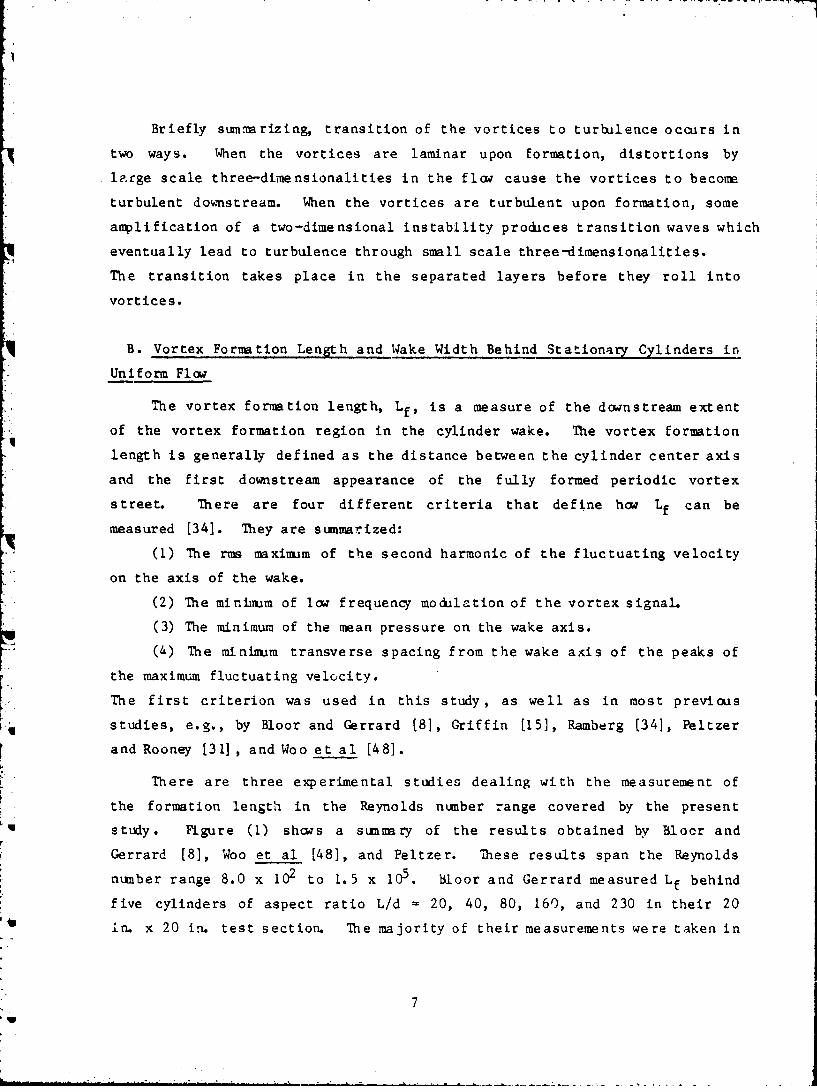
Flexible cylindrically shaped bodies are often an integral part of a
much larger, highly complex structural system such as an off-shore drilling
platform, which has mo.oring systems and drilling risers that are flexible
and cylindrical. Th-y are also part of cable netuxirks used to support
marker buoys, delicate instrument arrays, and towed catle arrays. Vortices
are shed as the surrounding fluid separates alternately from opposite sides
of the high aspect ratio, bluff cylindrical body when it is towed, or when
waves and currents flow past it. This periodic vortex shedding is
responsible for producing steady and unsteady drag forces in the direction
of the flow and unsteady lift forces in the cross flow direction. When
these vortices are shed at a frequency close to onE' of the natural
frequencies (or a nultiple thereof) of the structural system, the shedding
can lock-on to (synchronize with) the natural frequency. If the damping is
sufficiently small, intensified large amplitude cross flow oscillations,
increased st:resses, amplified acoustic flow noise, early fati~ie or shorter
failure life, increased hydrodynamic forces, and the chance of global
structural or instrument damage will occur.
This particular problem, encountered when to designing; the structural
system, is called cable-strummung and is not well under3tood. Further
complicating the design procedure is the vertically sheared current profile
that is typically found in the oceans. The vortex shedding frequency along
Manuscript submitted September 15, 1982.
K
I.

the bluff body span can vary with depth as in this case. Synchronization
and its related phenomena may occur over part of the total bluff body span.
To have a reasonable amount of confidence in the design and safety of
the structural system, the designer must have some understanding of the
dynam!c behavior of the system. Numerous references to vortex shedding-
related structural problems in the literature attest to the fact that
substantial research into vortex related synchronization phenomena !must be
performed and analyzed. The following are a few examples of the problems
associated with full scale systems that were not designed properly to
suppress or eliminate vortex shedding, and some of the attempted solutions
to these problems.
Severe oscillations of piles and pile-supported structures, caused by
vortex shedding, occurred in a tidal flow during the construction of a deep
water oil terminal at Immingham on the Hur.;ber estuary in England. Extensive
on-site investigations into the phenomenon permitted the terminal to be
redesigned and cospletect safely. As a result of this near disaster, a three
year, full-scale investigation into the oscillations of piles in marine
structures was undertaken at Imminghan, and the results were published by
Wootton, Warner, Sainsbury, and Cooper [491.
Over a two and one half year period, each of eight single pile aids-to-
navigation structures in the San Pablo Bay of California vibrated to failure
at least once. Vortex shedding from the piles in the six knot current
caused them to vibrate violently and to fail. A helical Rtrake kit was
employed by the U.S. Coast Guard in an attempt to alleviate this problem.In a report describing the effectiveness of the helical strake kit, Walker
[47] concluded that the kit eliminated the vortex shedding and stabilized
the structure over a wide range of flow speeds. The ninth single pile aid-
to-navigation has had no vortex shedding related problems to this date.
The deep water piling installations and pile driving operations for the
COGNAC platform were thought to be susceptible t3 vort A shedding related
problems. Every, King and Griffin (11] and Fischer, Jones and King [12]have studied the flcw-incIced vibration of a cable-suspended pile and vortex
2
ri

induced motions of a cantilever pile, reapectively, in an effort to predict
and develop methods to reduce or eliminate the vibrations and vibration
related phenormna. Both groups of authors used full scale and scaled model
tests in their experimental analyses.
The present study was undertaken to examine the behavior of a flexible,
high aspect ratio (L/d - 107) marine cable in a linear shear flow.
Particular attention was paid to lock-on or "synchronization!' phenomena
associated with uniform and sheared flow past the cable when it is forced to
vibrate in the first mode. The study was extended to include an analysis of
the effects on the vortex shedding and synchronization phenomena that are
generated by placing distributions of spherical bluff body shapes along the
span of the cable in uniform and sheared flow. The results discussed in
this paper will then be used in conjunction with recent experimental and
analytical studies to develop the capability to predict the strumming
response of marine cables in a variety of different flow situations.
The most recent of these field experiments was conducted in the mouth
of Holbrock Cove near Castine, Maine during the sunmer of 1981 to study the
strumming vibrations of marine cables. One of the objectives of those
experiments was to validate and, if necessary, to provide a data base for
modifying the computer code NATFREQ which was developed by the Naval Civil
Engineering Laboratory for calculating the natural frequencies and mode
shapes of taut cables with large numbers of attached discrete masses. In arecent paper, Vandiver .'nd Griffin [46] describe the field test program and
present some initial results from it. They compare calculations using the
NATFREQ code with selected test data that have been analyzed in sufficient
detail. Time histocies of the measured hydrodynamic drag coefficients,
current speeds, and cable strumming responses are presented and discussed
there.
3

II. Background and Literature
A. Development of the Karman Vortex Street Wake
Before discussing any previous theoretical and experimental studies
dealing with fluid dynamic properties in the wakes of stationary and
vibeating cylinders and cables in a uniform stream, a detailed summary of
the development of the Karman vortex street, from Reynolds numbers of unity
(Stokes flow) through the end of subcritical flow, is presented. Throughout
this discussion, it is assumed that the turbulence level is small i.e, less
than I percent.
(1) Stokes flow, 0 < Re < 5: For Reynolds numbers of order unity, the
flow around the body behaves as if it were inviscid. The laminar boundary
layer separates at the rear stagnation point. The flew along the cylinder
span is strongly two-dimensional. As the Reynolds number approaches five,
the laminar boundary layer begins to separate before the rear stagnation
point. There are no vortices present in this Stokes flow region.
(2) Symmetrical Range, 5 < Re < 40. This range is sometimes referred to
as "Foppl Flow". A captive vortex pair (Foppl Vortices) appears in the wake
of the cylinder. The separation point has moved further away from the rear
stagnation point, towards *90 degrees. The boundary layer remains laminar
after separation and -he flow is still strongly two-dimensional. The shear
layer (i.e., the interaction between the separated main flow and stagnated
flow region) supplies vorticity to this captured vortex pair, causing themV:, to acquire more strength and grow as the Reynolds number approaches 40.
They remain attached to the cylinder.
(3) Laminar "Regular" Vortex Shedding Region, 40 < Re < 125 to 150:
For Re - 40 to 80, the vortices seem to form from a wake instability over
several diameters downstream. After Re - 80 or 90, when the vortex grows
strong enough on one side, it begins to roll up and draw the opposite shear
layer across the wake. The vorticity of opposite sign permits no more
vorticity input into the growing vortex. The vortex is then shed and
travels downstream. Due to some flow or wake instability or asymmetry, or
surface irregularity, the shedding process is asymmetric, i.e. the first
vortex is shed from one side of the cylinder, and the second is shed a short
time latei, while a new vortex is forming on the opposite side to replace
4

the one already shed. These alternating vortices which are shed into the
wake are called vortex streets. They were first theorized by von Karman.
These entirely laminar vortices slowly decay through viscous dissipation and
can be measured clearly as far as 100 diameters downstream. The flow is
again two-dimensional. Schaefer and Eskinazi [43] and Griffin [15] divide
the laminar wake into three regions. First is the formation region, where
the vortex street develops from the interaction of the shear layers. The
formation region ends where the first periodic vortices are shed. Next is
the stable region, where the vortices in the fully developed laminar vortex
street exhibit a regular periodicity. The transverse vortex spacing
increases and the vortex cores spread by viscous action. The amplitude of
the vortex velocity fluctuations diminishes. The last is the unstable
region, where the vortex street exhibits an irregilar behavior and eventual
turbulent breakdown. There is a decrease in the transverse spacing Qf the
vortices. At greater downstream distances there is a reappearance of the
vortex street with different geometric properties. The Strouhal number is
related to the Reynolds number in this region by Roshko's empirical formula,
St - 0.212 - 4.49/Re.
(4) Lamina Turbulent Transition, 125 to 150 < Re < 300 to 35(0 In this
region the flow becomes threa-limensional. The wake is characterized by an
intermi-.tent type of flow downstream of Lhe formation region, where the
laminar vortices deteriorate, through low frequency modulation and
irreg-larities, tc turbulent vortices. Aý, the Reynolds number increases,
more and more vortices become turbulent, until the entire downstream
shedding process is turbulent. The distribution of spectral energr under
the vortex shedding peak decreases as more energy is transferred to
turbulence. The vortex lines are no longer straight and parallel to the
cylinder axis, but become inclined to it.
(5) Turbulent Vortex Range, 300 to 400 < Re < 2.0 to 4.0 x 10⁵:
The Strouhal number (St fcso d/Uc) is a constant throughout this range at a
value around 0.20. The boundary layer is still laminar and separates from
the cylinder approximately 82 degrees from the forward stagnation point.
The transition to turbulence occurs in the separated layers before the
5

vortices are formed (i.e. in the formation region). The turbuilent vortices
rapidly diffuse in the downstream direction, becoming part of the turbulent
wake. This large region can be further divided into three subregions [7].
(5.1) Lower Turbulent Vortex Region, 400 < Re < 1.3 x 10 : The position
signifying the beginning of the transition to turbuilence is close to the end
of the vortex formation region. The region of transition is aibout three
diameters long and includes the end of the formation region. The develop-
ment of turbulence begins with the observation of small turbulent bursts
before the end of the formation region. These bursts become more frequent
further downstream of the formation region in the wake. At the point where
the fully developed periodic wake begins, every vortex consists of turbulent
f luid. In the immediate downstream vicinity of the formation region, the
vortex sheet becomes fully turbulent.
q (5.2) In~termediate Turbulen: Vortex Range, 1.3 x 10 < Re < 8.0 x 10³
complete transition of the shear layers to turbulence takes place in the
vortex formation region. The onset of turbulence occurs in the following
manne r. Directly downstream of the cylinder, the separated shear layers are
laminar and exhibit a dominant fundamental frequency. Still further
downstream in the formation region, the first turbulent bursts, which are
waves at a single higher frequency, are imposed on the fundamental
frequency. Further downstream in the formation region the fundamental
f requency is masked by the higher frequency, and the flow' degenerates to
turbulence. The periodic wake with turbulent vortices is only present in
this region and beyond. As the Reynolds number increases, the transition
point moves from 1.2 to 0.7 diameters behind the center axis of the
cyl inde r.
(5.3) Upper Turbuilent Vortex Region, 8.0 x 13< Re < 2.0 to
4.0 x 10⁵: Laminar periodic flow is observed inside the separated boundary
layer at the shoulder of the cylinder. This flow conpletely degenerates to
turbulence in less than one-half a diameter downstream of the cylinder
axis. There is then a period of conplete turbulent motion until the
periodic wake is formed (at the end of the formation region).
6
1b
Briefly summarizing, transition of the vortices to turbulence occurs in
two ways. When the vortices are laminar upon formation, distortions by
large scale three-dimensionalities in the flow cause the vortices to become
turbulent downstream. When the vortices are turbulent upon formation, some
amplification of a two-dimensional instability produces transition waves which
eventually lead to turbulence through small scale three-dimensionalities.
The transition takes place in the separated layers before they roll into
vortices.
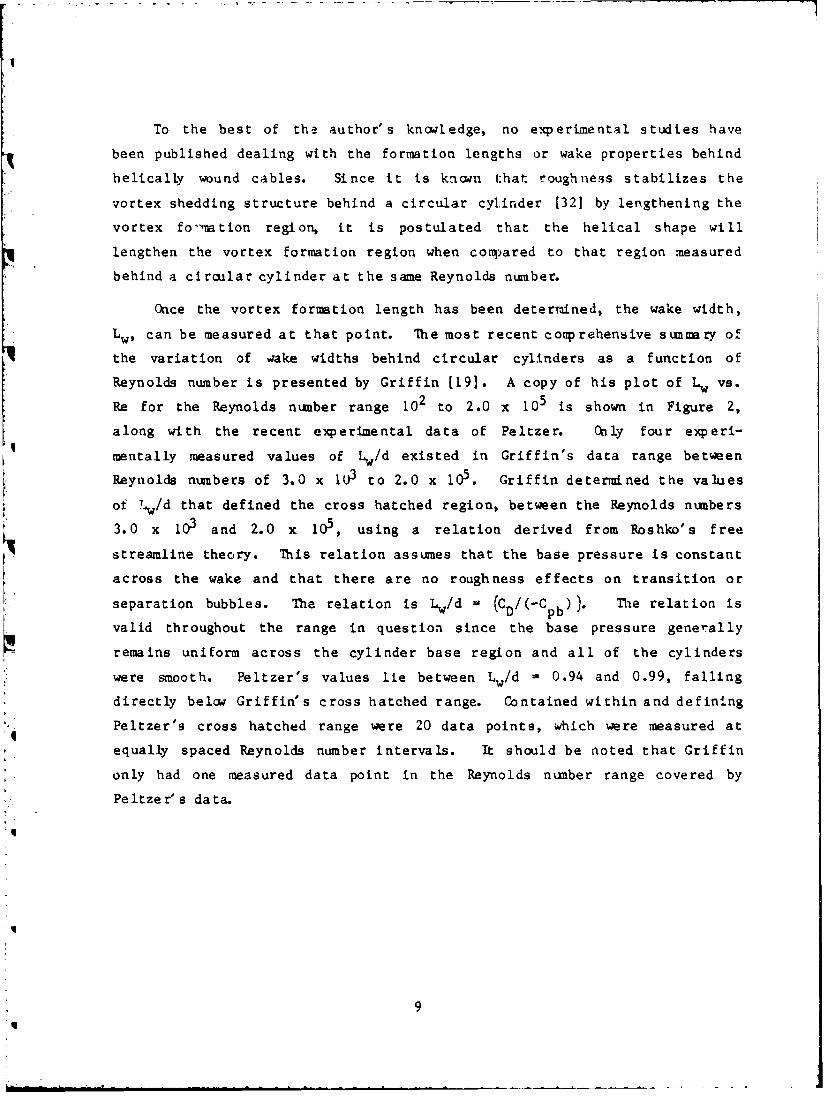
B. Vortex Formation Length and Wake Width Behind Stationary Cylinders in
Uniform Flow
The vortex formation length, Lf, is a measure of the downstream extent
of the vortex formation region in the cylinder wake. The vortex formation
length is generally defined as the distance between the cylinder center axis
and the first downstream appearance of the fully formed periodic vortex
street. There are four different criteria that define how Lf can be
measured [34]. They are summarized:
(1) The rms maximum of the second harmonic of the fluctuating velocity
on the axis of the wake.
(2) The minimum of low frequency modulation of the vortex signal.
(3) The minimum of the mean pressure on the wake axis.
(4) The minimum transverse spacing from the wake axis of the peaks of
the maximum fluctuating velocity.
The first criterion was used in this study, as well as in most previous
studies, e.g., by Bloor and Gerrard [8], Griffin [15], Ramberg [34], Peltzer
and Rooney [31] , and Woo et al [48].
There are three experimental studies dealing with the measurement of
the formation length in the Reynolds number range covered by the present
study. Figure (1) shos a summary of the results obtained by Blocr and
Gerrard [8], Woo et al [48], and Peltzer. These results span the Reynolds
number range 8.0 x 10² to 1.5 x 10⁵. Bloor and Gerrard measured Lf behind
five cylinders of aspect ratio L/d - 20, 40, 80, 160, and 230 in their 20
in. x 20 in. test section. The majority of their measurements were taken in
7

the wakes of smooth brass cylinders of aspect ratio 20 and 160. Their
results show a dependence of Lf on cylinder diameter. The curves shift over
to the right with increasing cylinder diameter (decreasing aspect ratio), a
phenomenon that the present author believes can be related to the inter-
action between end effects generated by the tunnel walls and decreasing
aspect ratio. Bloor and Gerrard's cylinders spanned the tunnel vertically
and had no end plates. During the present set of tests, the author observed
that end effects lengthen the vortex formation region and ctabilize the
shedding pattern along the cylinder spar. It is suggested here that as the
aspect ratio decreases, end effects have a predominant influence on the
vortex formation length and sparwise ,.. rtex strength and stability. This
observation partially explains why Bloor and Gerrard's results are dependent
on cylinder diameter, or decreasing aspect ratic, and end effect inter-
actions. Piother factor contributing to the scatter in their data was their
observation in a later paper that the flow was not uniform across the wind
tunnel span (13]. Only the central 7.5 inches experienced a uniform flow.
This nonuniformity was probably due to the combination of test section
design and tunnel wall effects.
The formation length data of Woo et al and Peltzer fall onto the solid
curve. There is not -uch scatter in the data presented by both authors as
they both were careful to eliminate (or minimize) end effects. Woo et al
measured Lf at the centers of five very hard, very smooth, brass tubes of
aspect ratios L/d - 16, 24, 36, 48, and 96 in various low and moderate
linearly sheared flows. Both Peltzer and Rooney (311 and Woo et al have
VI shown that the formation length values are not significantly affected by low
and moderate linearly sheared flows. Peltzer measured Lf behind two
machined smooth aluminum cylinders of aspect ratios L/d - 17.3 and 27. -At a
Reynolds number 1.0 x 10 the formation length, Lf/d is 2.8. As the
Reynolds number increases, Lf/d decreases until it becomes constant at a
value Lf/d - 1.32 when the Reynolds number reaches 1.0 x 10 The formation
length then remains constant until Re - 1.6 x 10⁵.
8
L
To the best of the author's knowledge, no experimental studies have
been published dealing with the formation lengths or wake properties behind
helically wound cables. Since it is known that roughness stabilizes the
vortex shedding structure behind a circular cylinder [321 by lengthening the
vortex fo-wation region, it is postulated that the helical shape will
lengthen the vortex formation region when coiqared to that region measured
behind a circular cylinder at the same Reynolds number.
Once the vortex formation length has been deterrmined, the wake width,
Lw, can be measured at that point. The most recent couprehensive summary of
the variation of wake widths behind circular cylinders as a function of
Reynolds number is presented by Griffin [191. A copy of his plot of LW vs.
Re for the Reynolds number range 102 to 2.0 x 10⁵ is shown in Figure 2,
along with the recent experimental data of Peltzer. Only four experi-
mentally measured values of Lw/d existed in Griffin's data range between
Reynolds numbers of 3.0 x 10³ to 2.0 x 10⁵ . Griffin determined the values
of Lw/d that defined the cross hatched region, between the Reynolds numbers
3.0 x 10³ and 2.0 x 10⁵, using a relation derived from Roshko's free
streamline theory. This relation assumes that the base pressure is constant
across the wake and that there are no roughness effects on transition or
separation bubbles. The relation is Lw/d (CD/(-Cpb)). The relation is
valid throughout the range in question since the base pressure generally
remains uniform across the cylinder base region and all of the cylinders
were smooth. Peltzer's values lie between Lw/d - 0.94 and 0.99, falling
directly below Griffin's cross hatched range. Contained within and defining
Peltzer's cross hatched range were 20 data points, which were measured at
equally spaced Reynolds number intervals. It should be noted that Griffin
only had one measured data point in the Reynolds number range covered by
Peltzer's data.
9

C. Lock-on or Synchronization Phenomena: An overvie' of studies dealing
with changes induced in the near wake of a rigid cylinder by self-excited or
forced motion of the body.
When a bluff body (rigid or flexible cylinder or flexible cable) is
immersed in a uniform stream or spanwise sheared flow, a Karman vortex
street is generated in the wake of the body for Reynolds numbers betreen 50
(pure laminar vortices) and 2.0 to 4.0 x 10⁵ (turbulent vortices). When the
vortex shedding frequency approaches a natural frequency (or submIltiple
thereof) of the structure, resonant flow-induced oscillations of the cable,
bluff body, or flexible cylinder may occur if the damping of the system is
small enough. When the shedding frequency gets close enouigh to the ratural
frequency, the body captures the shedding frequency in an apparent violation
of the Strouhal relationship. The shedding frequency and body oscillations
then synchronize at a frequency close to the natural frequency of that
oody. These self-excited oscillations are usually normal to the incident
flow direction and in water may be as large as two to fou.r diameters in peak
to peak amplitude. In line oscillations sometimes occur in water where the
hydrodynamic forces are considerably larger than in air. The vortex
shedding frequency is captured by the natural frequency over a range of flow
speeds, the start of which occurs at a flow speed which corresponds to the
natural vibration frequency. During this lock-on, there are changes induced
in the near wake of the body by the self-excited resonant motion. There are
many different terms used to characterize these phenomena of which sychroni-
zation, cable strumming, lock-on, wake capture, self-induced or self-excited
oscillations, are the most common.
It was determined that the cable system to be studied in the present
tests was too highly damped to be self-excited in an air flow. Some type of
forced excitation would then be necessary to simulate the self-excited
resonant conditions in order to study the lock-on induced changes in the
cable wake. The question that must be addressed now is whether self-excited
resonant flow-induced changes in the near wake can be reproduced with an
externally excited arrangement. Griffin [16] has addressed and answered
this question. His study was directed towards analyzing the similarity in
10
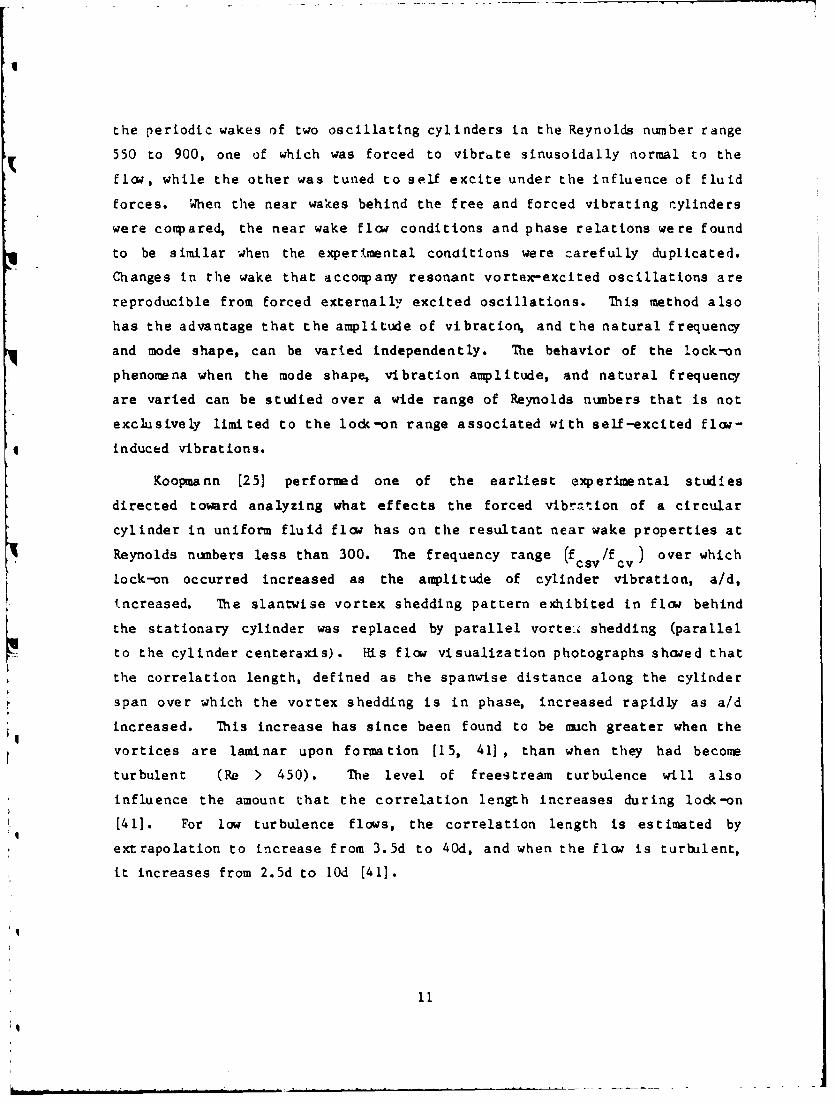
the periodic wakes of two oscillating cylinders in the Reynolds number range
550 to 900, one of which was forced to vibrhte sinusoidally normal to the
flow, while the other was tuned to self excite under the influence of fluid
forces. When the near wakes behind the free and forced vibrating cylinders
were coupared, the near wake fla. conditions and phase relations were found
to be similar when the experimental conditions were carefully duplicated.
Changes in the wake that accoapany resonant vortex-excited oscillations are
reproducible from forced externally excited oscillations. This method also
has the advantage that the amplitude of vibration, and the natural frequency
and mode shape, can be varied independently. The behavior of the lock-on
phenomena when the mode shape, vibration amplitude, and natural frequency
are varied can be studied over a wide range of Reynolds numbers that is not
exclusively limited to the lock-on range associated with self-excited flow-
induced vibrations.
Koopmann [25] performed one of the earliest experimental studies
directed toward analyzing what effects the forced vibration of a circular
cylinder in uniform fluid flow has on the resultant near wake properties at
Reynolds nuambers less than 300. The frequency range (fcs /f cv) over which
lock-on occurred increased as the amplitude of cylinder vibration, a/d,
increased. The slantwise vortex shedding pattern exhibited in flow behind
the stationary cylinder was replaced by parallel vorte• shedding (parallel
to the cylinder centeraxis). His flow visualization photographs showed that
the correlation length, defined as the spanwise distance along the cylinder
span over which the vortex shedding is in phase, increased rapidly as a/d
increased. This increase has since been found to be much greater when the
vortices are laminar upon formation [15, 41] , than when they had become
turbulent (Re > 450). The level of freestream turbulence will also
influence the amount that the correlation length increases during lock-on
[411. For oiw turbulence flows, the correlation length is estimated by
extrapolation to increase from 3.5d to 40d, and when the flcw is turbulent,
it increases from 2.5d to 10d [41].
qI
11i

Griffin [15, 16], and Griffin ,nd Votew [23] studied changes in tl•e near
wake of a forced vibrating cylinder for Reynolds numbers between 120 and
900. They found that significant changes in the near wake develop'aent were
caused by the synchronized cylinder oscillations. The purely laminar vortex
shedding range (which usually ends at Re - 125 to 150) was extended to a
Reynolds number of 350. The transverse synchronized vibrations suppressed
the initiation of turtalence downstream of the vortex formation region.
They investigated the dependence of the general near wake structure (vortex
formation length, vortex strength, and wake width) on vibration amplitude
a/d and cylinder vibration frequency (fcv/f csv ). The length of the vortex
formatitn regiot, was influenced by changes in both a/d and f cv/f csv, when
the cylinder and vortex shedding frequencies were locked-on. The formmtion
length decreased uniformly as a/d was increased. Lf decreased by as much as
59 percent when compared to the non-vibrating case. Lf also decreased as
the ratio fc /f s was increased from less-than to greater-than one. The
wake width was found to increase with the amplitude of synchronized
oscillations.
In two later studies, C-1ffin and Ramberg (21,22] measured the changesin vortex strength and spacing that were produced b~v varying the amplitude
and cylinder vibration frequency in the synchronization range at a Reynolds
number of 144. When a/d was increased, the vortex itrength and vorticity
generation uvre increased, and the lateral vortex spacing in the stable
region of the wake decreased. The formatf.on length again varied inversely
with vibra~lon frequency (fcv /fs) . The unstable region in the wake moved
upstream as the ratio I/f was increased, however the lateral spacing ofcv csv
the vortices in the -table region was relatively unaffected by the changesin f /f
cv csv
Davies 110] examined the tv.rbulent near wakes of a stationary and
forced oscillating D-shaped cylincter in the Reynolds number range 7.0 x 10
to 4.( x 104. The cylinder vibration was synchronized with the vortex
shedding frequency. He found that there was a 35 percent increase in the
strength of the vortices shed from the oscillating cylit.der, and that the
shedding was much more regular. He attributed this increase in regularity
12
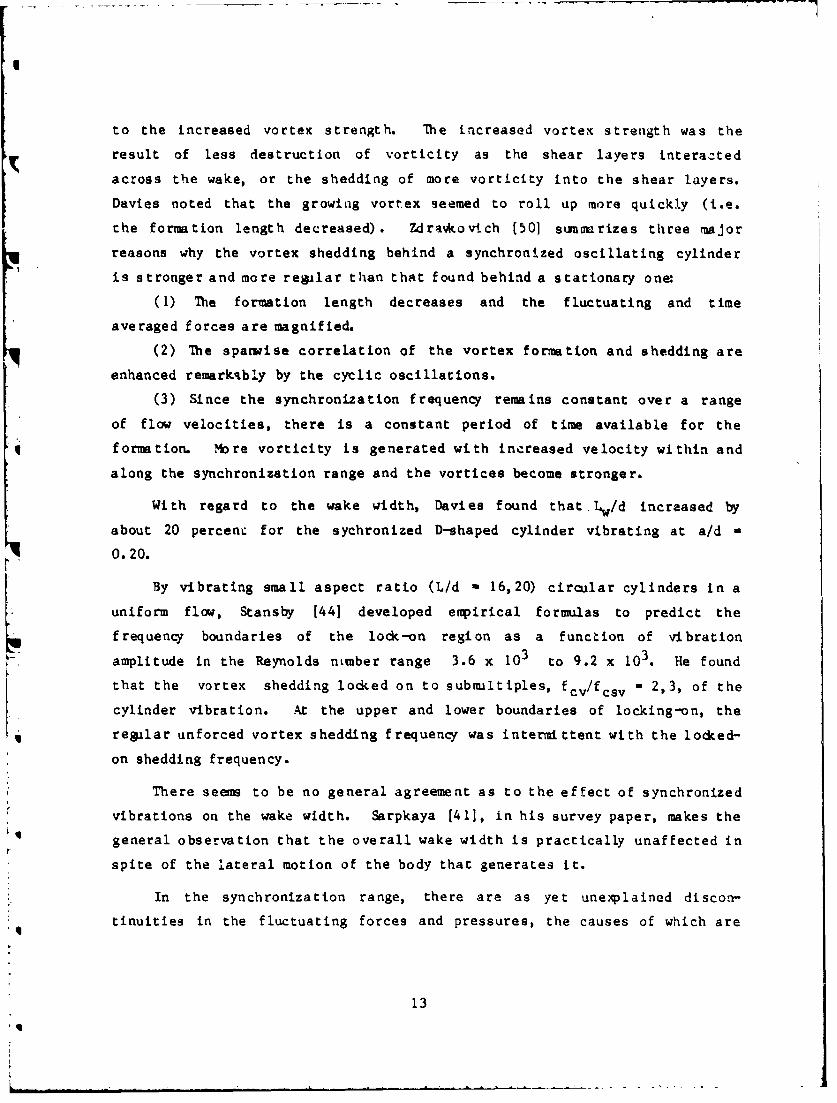
to the increased vortex strength. 1he increased vortex strength was the
result of less destruction of vorticity as the shear layers interacted
across the wake, or the shedding of more vorticity into the shear layers.
Davies noted that the growing vortex seemed to roll up more quickly (i.e.
the formation length decreased). Zdravkovich (501 sumwarizes three major
reasons why the vortex shedding behind a synchronized oscillating cylinder
is stronger and more re~ilar than that found behind a stationary one
(1) The formation length decreases and the fluctuating and time
averaged forces are magnified.
(2) The sparwise correlation of the vortex formation and shedding are
enhanced remarkably by the cyclic oscillations.
(3) Since the synchronization frequency remains constant over a range
of flow velocities, there is a constant period of time available for the
formation. ?More vorticity is generated with increased velocity within and
along the synchronization range and the vortices become stronger.
With regard to the wake width, Davies found that.Lw/d increased by
about 20 percent for the sychronized D-shaped cylinder vibrating at a/d -
0.20.
By vibrating small aspect ratio (L/d - 16,20) circular cylinders in a
uniform flow, Stansby [44] developed empirical formulas to predict the
frequency boundaries of the lock-on region as a function of vibration
amplitude in the Reynolds ntmber range 3.6 x 10³ to 9.2 x 10³. He found
that the vortex shedding locked on to submiltiples, fcv/fcsv a 2,3, of the
cylinder vibration. At the upper and lower boundaries of locking-on, the
regelar unforced vortex shedding frequency was intermittent with the locked-
on shedding frequency.
There seems to be no general agreement as to the effect of synchronized
vibrations on the wake width. Sarpkaya [41], in his survey paper, makes the
general observation that the overall wake width is practically unaffected in
spite of the lateral motion of the body that generates it.
In the synchronization range, there are as yet unexplained disco.n-
tinuities in the fluctuating forces and pressures, the causes of which are
13
I ----- -
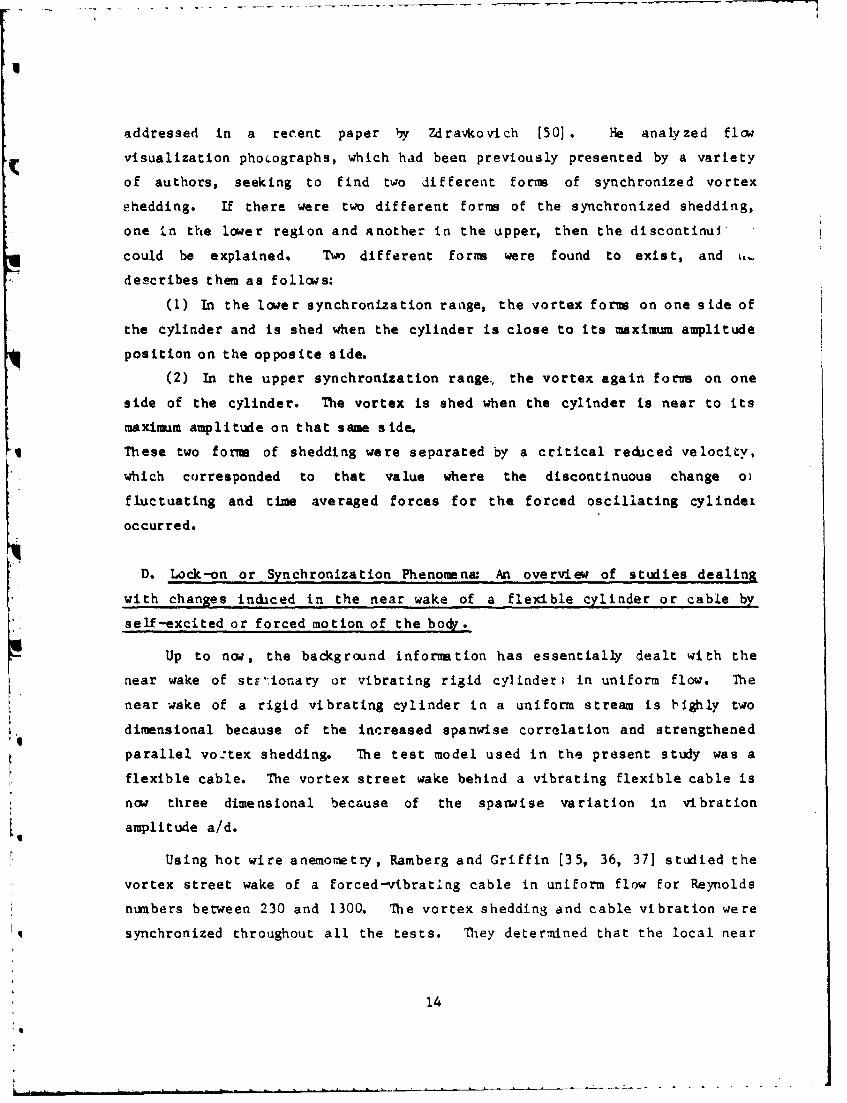
addressed in a recent paper by Zdravkovich (50]. He analyzed flow
visualization phoLographs, which had been previously presented by a variety
of authors, seeking to find two different forms of synchronized vortex
shedding. If there were two different forms of the synchronized shedding,
one in the lower region and another in the upper, then the discontinui'
could be explained. Two different forms were found to exist, and L,-
describes them as follows:
(1) In the lower synchronization range, the vortex forms on one side of
the cylinder and is shed when the cylinder is close to its maximum amplitude
position on the opposite side.
(2) In the upper synchronization range, the vortex again forum on one
side of the cylinder. The vortex is shed when the cylinder is near to its
maximum amplitude on that same side.
These two forms of shedding were separated by a critical reduced velocity,
which corresponded to that value where the discontinuous change ol
fluctuating and time averaged forces for the forced oscillating cylinder
occurred.
D. Lock-on or Synchronization Phenomena:, An overview of studies dealing
with changes induced in the near wake of a flexible cylinder or cable by
self-excited or forced motion of the body.
Up to now, the background information has essentially dealt with the
near wake of stc,.ionary or vibrating rigid cylinder; in uniform flow. The
near wake of a rigid vibrating cylinder in a uniform stream is highly two
dimensional because of the increased spanwise correlation and strengthened
parallel vo:tex shedding. The test model used in the present study was a
flexible cable. The vortex street wake behind a vibrating flexible cable is
now three dimensional because of the sparwise variation in vibration
amplitude a/d.
Using hot wire anemometry, Ramberg and Griffin (35, 36, 37] studied the
vortex street wake of a forced-vibrating cable in uniform flow for Reynolds
numbers between 230 and 1300. The vortex shedding and cable vibration were
synchronized throughout all the tests. They determined that the local near
14

I:
wake properties at any sparwise location along the vibrating cable behaved
similarly to the near wake behind a forced-vibrating cylinder when the
frequency, amplitude and Reynolds number were equivalent. Just as Griffin
(16] had concluded when he compared the wake flow near self-excited and
forced vibrating circular cylinders, they found that the flow in the wake of
the forced-vibrating cable could successfully be used to simulate the flow
in the wake of a self-excited cable. They examined the local formation
length along the span of the vibrating cable, holding the vibration
frequency constant. The sparwise variation of the formation length was
determined by the local amplitude variation. As a/d increased, Lf/d
decreased, an observation which was consistent with their earlier vibrating
cylinder results [16]. An inverse relation was found between the local
formation length and vortex strength. This result is consistent with
Davies' J]0] and Zdravkovich's r50] observations. This dependence of Lf/d on
a/d also implies that the vorticity generation and lift and drag should
depend on the local conditions in the wake. They compared the relative
magnitudes of the vortex wake changes behind the cable and rigid cylinder
that were induced by synchronization. They noted that the three-dimensional
nature of the cable wake had a muting effect (i.e. the magnitude of the
changes were smaller). Varying the cable vibration frequency, while holding
the si~adding frequency (flcw velocity) constant, influenced the formation
length in the lock-on region. For vibration frequencies less than theStrouhal frequency, (fv/f < 1 ) the formation length is increased, whilethe formation length decreases when the vibration frequency is greater than
the Strouhal frequency.
They defined a wake-capture or frequency-locking Strouhal number Stw,
which served as a useful means of relating the influence of Reynolds number,
vibration amplitude and frequency, on the formation length in the vibrating
cylinder or cable near wake
St - (l+a/d) (fcv /f cso)St
where
St - f (3/U ).cso cWhen Lf/d is plotted against Stw, the decrease in Lf/d with Stw is
15

indicative of the increase in the fluid forces that occur for different
conditions of vibration, because a close relation exists between changes in
the lift, drag and base pressure on bluff bodies and changes in the
formation length caused by vibration.
Ramberg and Griffin [36] then proceeded to examine the vibrating cable
wake in order to determine the magnitude and spanwise extent of correlated
vortex shedding along the span of the caale. These observations, as well as
measurements of wake velocity profiles, spectra in the flow, and flow
visualization studies led them to define three distinct flow regimes a' nig
the vibrating cable span in the Reynolds number range 470 to 1300.
(1) Flow in the imumdiate vicinity of a cable node closely resembles
that past a stationary body. The vortex shedding fluctuations in the near
wake occur principally at the Strouhal frequency. Spaowise coherence in the
vortex shedding is small or nonexistent. The time-dependent fluid forces
resulting from the shedding process near a node are not likely to contribute
to the vortex-induced motions of the cable.
(2) The transition region is adjacent to the cable node region and
extends to the cable antinode region where the vortex shedding frequency
locs-on to the cable vibration. Both the Strouhal and cable vibration
frequencies are present in the power spectra of the fluctuating velocity
signal from the hot wire anemometer. The sparwise correlation cf the
shedding increases. An irregular vortex pattern, different tha. the
characteristic patterns associated with either the stationary or vibrating
locked-on vortex street wakes was observed during flow visu~alization
studies. Only the component of the vibration Zrequency contributes
significantly to the motion.
(3) The third region is centered about the cable antinode where the
vortex shedding is locked-on to the cable vibration frequency. The spanwise
shedding is highly c.orrelated and the power spectra contain a sharp peak at
the synchronization, or lock-on, frequency. The degree of correlation was
found to be independent of the frequency and amplitude of vibration. The
near wake and vortex shedding properties at any point in this region can be
represented by those occurring in the wake of a rigid cylinder vibrating at
16

the same Reynolds number. amplitude and frequency. The sparwise extent of
this region can be closely approximated by the lock-on regions previously
found for rigid cylinders (25,44].
The idea of defining a universal wake Strouhal number for the locking-
on of vortex shedding to the vibration of a rigid or flexible cylinder has
been explored by Griffin [17]. He presents a model for a universal wake
Strouhal number which is valid throughout the entire subcritical Reynolds
number range. The model is .alid for both forced and vortex-excited
oscillations in the lock-on region. The universal Strouhal number can be
defined in various ways, depending on what measured wake parameters are
available.
f Stm L Lw L ItL - StLSt " Ub- "M St ( "! Kd --. (1 1/
where b b (C pb d
Ub - the velocity just outside the shear layers
K - base pressure parameter K2 _ (,_Cpb)
St - usual Strouhal number of the cylinder.
A constant value, St* - 0.18, was found for the range of subcritical wake
Reynolds numbers, Re* M UbLw/ v, from 700 to 5.0 x 10⁴. He also noted that
the strength of the shed vorticity increased during lock-on.
Griffin [19] has published a more recent pe-er dealing with universal
fluid dynamic similarity in the wakes of stationary and vibrating bluff
bodies. The wake Strouhal number St collapses the characteristic wake
scales into a curve for wake Reynolds numbers between 100 and 107.
E. Stationary and Vibrating Bluff Bodies in Linear Shear Flows.
Linear shear flows are characterized by the non-dimensional shear
parameter 0- d/Uc dU/dy. The wake flow behind a stationary bluff body in a
linear shear flow is strongly three dimensional. Cross-stream vorticity,
the vector of which is normal to the plane of flow, is present in the
flow . When these cross-stream vortex lines approach the body', they are
17

turned around the body into the flow direction. The interaction of these
rolled-up vortex lines with the Karman vortex street is believed to be at
least partially responsible for the formation of discrete sparwise cells of
constant shedding frequency in the wake. Maull and Young [27] showed that
* the boundaries between these spatwise cells could be marked by the presence
of the rolled-up streamwise vorticity. Ihey placed a small delta wing,
designed to generate a strong longitudinal vortex which would simulate the
rolled-up (turned) vortex lines, on each side of a D-shaped cylinder. The
spanwise Strouhal number in uniform flow was constant acrops the cylinder
without the delta wings present on the body. When the wings •*rq placed on
the cylinder, they caused the sparwise shedding to separate into two cells
of different Strouhal numbers, with the boundary between the cells i -aced
et- the sparwise point where the deita ... prodiced t'ýe Lon61tudinal
vortex.
Stansby (44] offers an explanation as to why these discrete cells of
constant shedding frequency must exist in a shear flow. The frequency of
vortex shedding cannot be constant over the entire bluff body spa&t because
that would require a variation in the Strouhal number inversely proportional
to the velocity. Vortex shedding must occur in discrete sparwise cells to
preserve the Karman vortex street, the Strouhal number in these cells
varying ir poport t on with the velocity. Mair and Stansby [26] present two
ideas as to what may be 'tappening within each of these discrete spanwisecells. They base their ideas on the interaction between the strength of
each individual vort-,' in the Karman vortex street with the cross-stream
turned vorticity. In small cells, the strength of an:, individual vortex is
constant. When larger cells occur, there is an interaction between the
strength of the shed vortex and the cross-stream vorticiry which results in
a variation of the strength of the shed vortex along the length of the cell.
The present author puts forth the idea that the lengths of tha
individual cells in sheared flow are dependent on the formation length
value, shear parameter (sparwise velocity gradient), cylinder aspect ratio,
and Reynolds number, as well as the vortex strength. End or end plate
influence will have a significant effect on the formation region. The
18

author observed this phenomenon during the present set oE tests. In the
general vicinity of the cable end plates, the formation length increased
measurably. It has been noted by Woo et al [48] and Peltzer and Rooney [31]
that there were always stable cells in sheared flow adjacent to the end plates
of high aspect ratio cylinders, even though the central span exhibited a slight
tendency or no tendency towards forming a cellular structure.
Returning to Figure 1 and considering the data of Woo eL al and Peltzer
only, one observes that as the Reynolds nunber increases from 103 to 104
the formation length decreases, and as the Reynolds number increases
further, the formation length remains constant at a minimum value. When all
the experimental studies [31, 32, 47] dealing with the vortex wake behind
high aspect ratio cylinders (L/d > 27) in a shear flow are analyzed, they
reveal an interesting correlation between the length of the formation region
and the existence of stable cells. The results of Woo et al show that some
type of cellular vortex structure existed in the wake of their cylinders up
to Reynolds numbers around 104. Peltzer and Rooney's results show that no
measurable sparwise cellular pattern existed from Reynolds numbers of
2 x 10⁴ tc 1.1 x 10⁵. It seems that there is a minimum formation length,
below which the cell boundaries fluctuate wildly or no cells exist at all.
As the formation length decreases, the length and stability of the cells
decreases. To strengthen this observation, the author observed that when
the centerline Reynolds number was increased from 3.0 x 10 to 9.0 x 10
(first pnase cable studics in sheared flow) the cells at 9 x 10³ were
measurably smaller than Lhose at 3.0 x 10³. The shear parameter
= 0.0053 was held constant And only the Reynolds number was varied.
With regard to small aspect ratio (L/d < 20) affects, the tendency for
discrete stable cells to form is much greater on a small aspect ratio
cylinder than it is for a high aspect ratio cylinder under the same flow
conditions. Both Maull and Young [27] and iair and Stansby [261 have
examined the effect of a sheared flow on the spariise Strouhal number
distribution of small aspect ratio bluff bodies (L/d < 20). Both found that
a number -F coherent cells were present along the span of their models for
Reynolds numbers less than 2 x 10 4 . Mir and Stansby determined an optimal
19

end plate design to stabilize the vortex shedding cells in the wake of their
low aspect ratio models. They noted that without this design, the results
showed a continuous change in peak frequency which was attributed to
unstable cell boundaries (i.e. short Lf). The increased formation length
due to the presence of the end plates was the stabilizing factor, such that
coherent stable cells were allowed to form.
For flows with a large value of the shear parameter 8, the tendency
towards forming a stable spanwise cellular structure in the wake is much
greater than that for a weakly sheared flow. Both Woo et al and Peltzer
(321 have noted this. The higher shear level flows contain a larger amount
of streamwise vorticity which helps to establish and stabilize cells and
cell boundaries. Both authors have shown that the length of the discrete
cells in a sheared flow varies in inverse proportion to the shear para-
meter 0 Peltzer has shown that the change in Strouhal number betwen
consecutive cells varies in proportion to the shear parameter 0.
The work by Stansby (441 represents the only experimental study dealing
with the wake properties behild a vibrating circular cylinder in a sheared
flow. The vortex shedding requency locked-on to the cylinder vibration
frequency, as well as to submnltiples of it, over a portion of the cylinder
span. The rest of the cells that were unforced (not locked-on) became very
stable in frequency (i.e. the spanwise shedding structure became very well
defined). He showed that the uniform flow results were similar to the shear
flow results and that they could be applied to the lock-on problem in shear
flows.
Woo et al studied the vortex wakes of oscillating cables in a linear
shear flow. They discuss the mechanism of complete locking-on based on the
concept of the modulation of the vortex shedding process due to the forced
oscillation of the cable. They found that the body oscillations induced
vortices which were in perfect synchronization with the body motion, and
that the strength of these vortices was amplified. The unforced cells
adjacent to the lock-on region were stabilized. The frequencies of the shed
vortices in those regions adjacent to the lock-on region were forced away
20
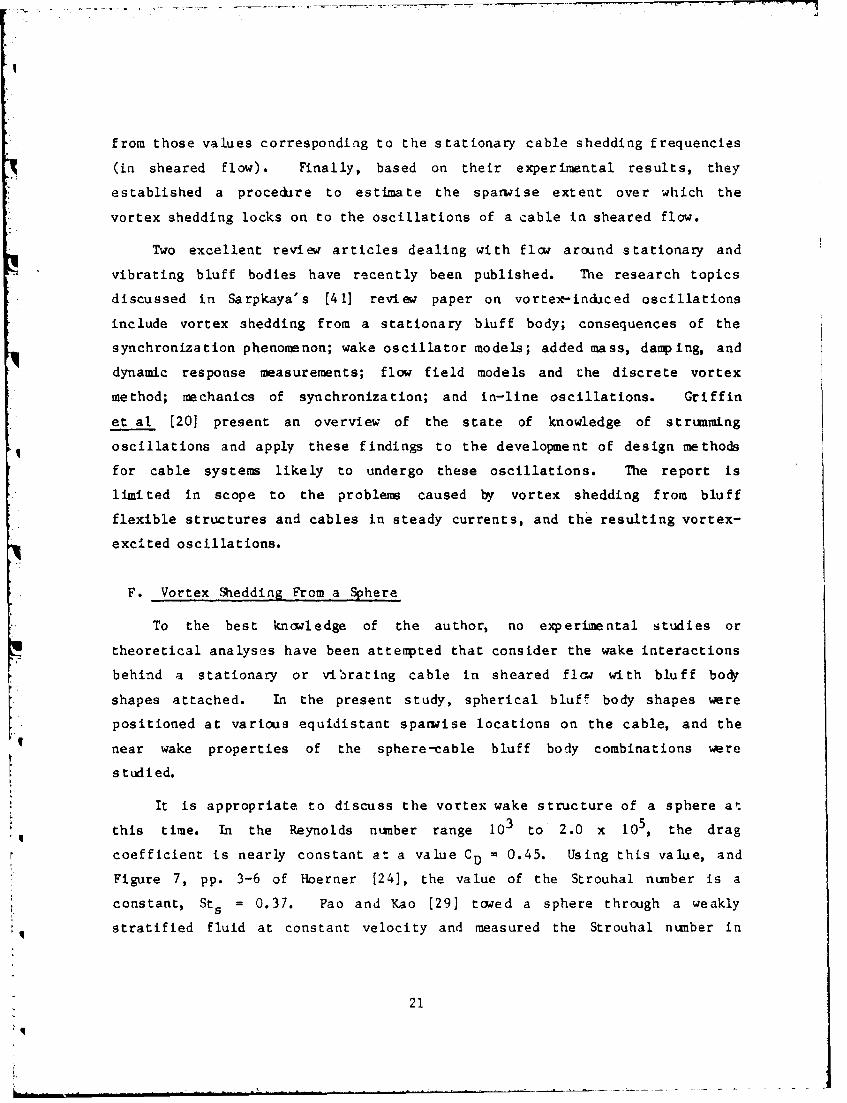
* from those values corresponding to the stationary cable shedding frequencies
*(in sheared flow). Finally, based on their experimental results, they
established a proceduire to estimate the spandise extent over which the
vortex shedding locks on to the oscillations of a cable in sheared flow.
Two excellent review articles dealing with flow around stationary and
vibrating bluff bodies have recently been published. The research topics
* discussed in Sarpkaya's [411 review paper on vortex-induiced oscillations
include vortex shedding from a stationary bluff body; consequences of the
synchronization phenomenon; wake oscillator models; added mass, damp~ing, and
dynamic response measurements; flow field models and the discrete vortex
method; mechanics of synchronization; and in-line oscillations. Griffin
et al [20] present an overview of the state of knowledge of strumnming
q oscillations and apply these findings to the development of design methods
for cable systems likely to undergo these oscillations. The report is
limited in scope to the problems caused by vortex shedding from bluff
flexible structures and cables in steady currents, and the resulting vortex-
excited oscillations.
F. -Vortex Shedding From a Sphere
To the best knowledge of the author, no experimental studies or
theoretical analyses have been attempted that consider the wake interactions
behind a stationary or vibrating cable in sheared flow with bluff body
shapes attached. In the present study, spherical bluff body shapes were
positioned at various equidistant sparwise locations on the cable, and the
near wake properties of the sphere-cable bluff body combinations were
studied.
It is appropriate to discuss the vortex wake structure of a sphere at
this time. In the Reynolds number range 10 to 2.0 x 10⁵, the drag
coefficient is nearly constant at a value CD = 0.45. Using this value, and
Figure 7, pp. 3-6 of Hoerner [24]1, the value of the Strouhal number is a
constant, Sts = 0.37. Pao and Kao [29] towed a sphere through a weakly
q stratified fluid at constant velocity and measured the Strouhal number in
21
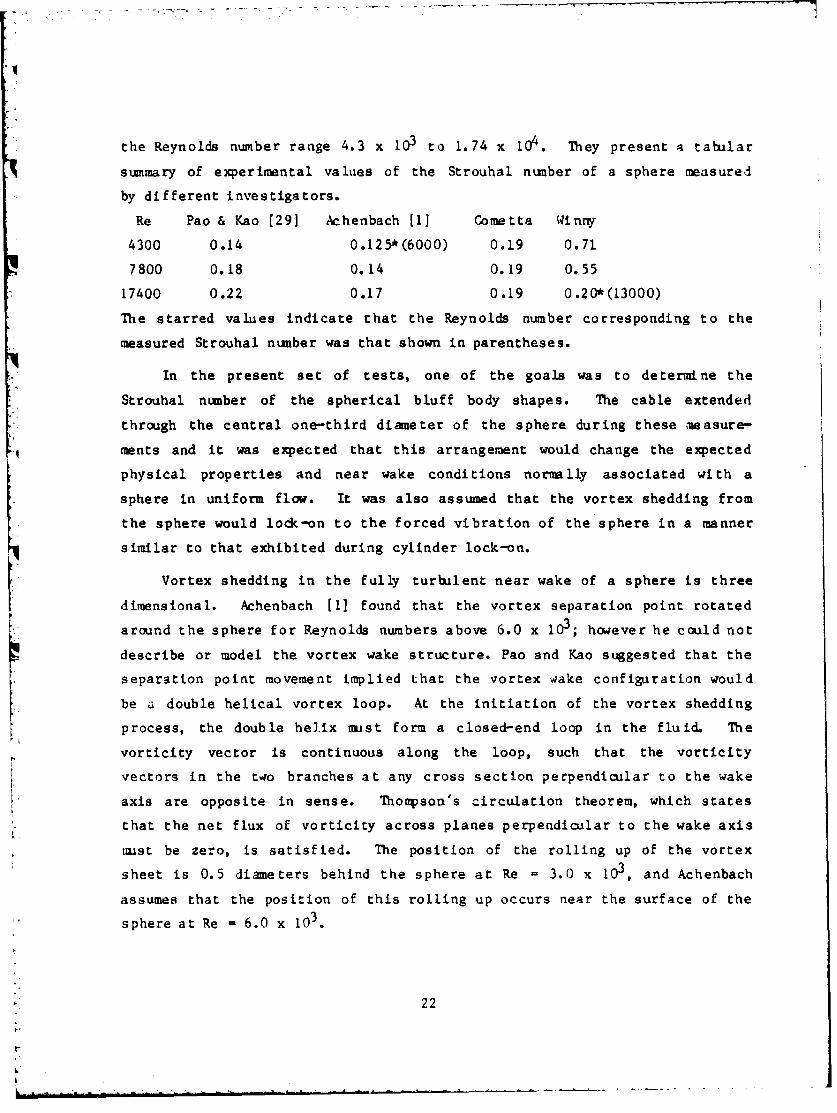
the Reynolds number range 4.3 x 10³ to 1.74 x 10⁴. They present a tabular
summary of experimental values of the Strouhal number of a sphere measured
by different investigators.
Re Pao & Kao [29] Achenbach [(] Cometta Winny
4300 0.14 0.125*(6000) 0.19 0.71.
7800 0.18 0.14 0.19 0.55
17400 0.22 0.17 0.19 0.20*(13000)
The starred values indicate that the Reynolds number corresponding to the
measured Strouhal number was that shown in parentheses.
In the present set of tests, one of the goals was to determine the
SStrouhal number of the spherical bluff body shapes. The cable extended
through the central one-third diameter of the sphere during these measure-
ments and it was expected that this arrangement would change the expected
physical properties and near wake conditions normally associated with a
sphere in uniform flow. It was also assumed that the vortex shedding from
the sphere would lock-on to the forced vibration of the sphere in a manner
similar to that exhibited during cylinder lock-on.
Vortex shedding in the fully turbulent near wake of a sphere is three
dimensional. Achenbach [1] found that the vortex separation point rotated
around the sphere for Reynolds numbers above 6.0 x 10³; however he could not
describe or model the vortex wake structure. Pao and Kao suggested that the
separation point movement implied that the vortex wake configuration would
be a double helical vortex loop. At the initiation of the vortex shedding
process, the double helix must form a closed-end loop in the fluid. The
vorticity vector is continuous along the loop, such that the vorticity
vectors in the two branches at any cross section perpendicular to the wake
axis are opposite in sense. Thompson's circulation theorem, which states
that the net flux of vorticity across planes perpendicular to the wake axis
must be zero, is satisfied. The position of the rolling up of the vortex
sheet is 0.5 diameters behind the sphere at Re = 3.0 x 10³, and Achenbach
assumes that the position of this rolling up occurs near the surface of the
sphere at Re 6.0 x 10³.
22
r
h.
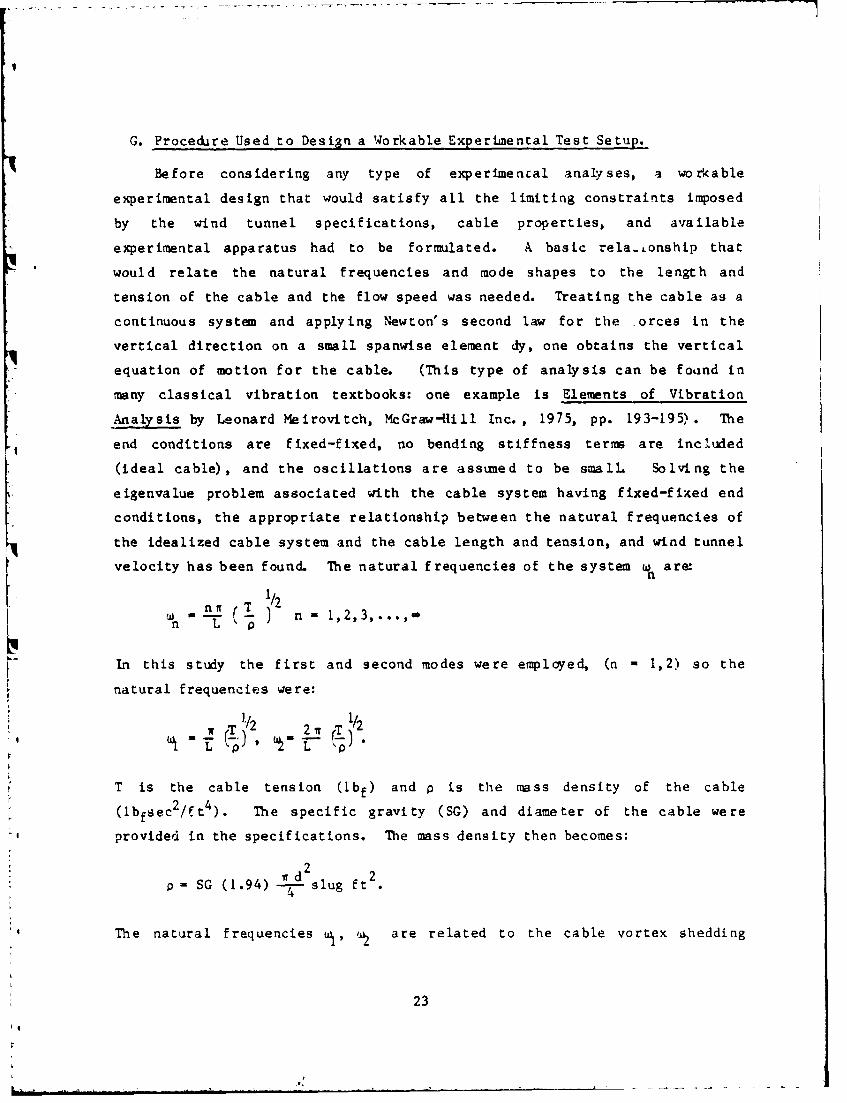
G. Procedure Used to Design a Workable Experimental Test Setup.
Before considering any type of experimencal analyses, a workable
experimental design that would satisfy all the limiting constraints imposed
by the wind tunnel specifications, cable properties, and available
experimental apparatus had to be formulated. A basic rela..onship that
would relate the natural frequencies and mode shapes to the length and
tension of the cable and the flow speed was needed. Treating the cable as a
continuous system and applying Newton's second law for the orces in the
vertical direction on a small spanwise element dy, one obtains the vertical
equation of motion for the cable. (This type of analysis can be found in
many classical vibration textbooks: one example is Elements of Vibration
Analysis by Leonard Meirovitch, McGraw-4ill Inc., 1975, pp. 193-195). The
end conditions are fixed-fixed, no bending stiffness terms are included
(ideal cable), and the oscillations are assumed to be small, Solving the
eigenvalue problem associated with the cable system having fixed-fixed end
conditions, the appropriate relationship between the natural frequencies of
the idealized cable system and the cable length and tension, and wind tunnel
velocity has been found. The natural frequencies of the system 'I are:n
"w - n I n ,•n L "'
In this study the first and second modes were employed, (n -1,2) so the
natural frequencies were:
it T2
T is the cable tension (lbf) and p is the mass density of the cable
(lbfsec 2 /ft 4 ). The specific gravity (SG) and diameter of the cable were
provided in the specifications. The mass density then becomes:
2 2P- SG (1.94) 4dslug ft
The natural frequencies uý, • are related to the cable vortex shedding
23
IIt

frequency f as follows:
w- 2w f cSo
The vortex shedding frequency is related to the Strcnhal number (which was
assumed constant in the Reynolds number range covered by these tests) by:
StUcf W _
cso dSubstituting all these values into the equation for the natural frequencies
of the system, one obtains the desired relationship:
T t 2
( . SG r 1. 94 St(LU )2
C
The flow velocity, Uc, is fixed between 8 and 80 fps because Reynolds
numbers of order 103 are desired. The specific gravity of the cable is 1.2,
and the Strouhal number is 0.19. The tension was limited to values between
100 and 1000 lbf by the load cell's measuring capacity. The working length
of the cable could be varied between three feet and five feet while still
retaining complete traverse coverage and a high aspect ratio. The inability
to reproduce the proper redUced cable damping in air necessitated the
artificial (motor-driven) oscillation of the cable. The maximum motor speed
was around 100 Hz when the eccentric mass was attached to the shaft. After
the various combinations of cable length and tension, and vibration
frequency (vortex shedding frequency or flow velocity) were analyzed, it was
decided to design the experiment using the following values for the various
parameters
Cable Length: L - 4 ft.
Tension: First mode T - 500 lbf, Second Mode T - 250 lbf
Flow Velocity: Could be varied from 8 to 80 fps
Motor Speed: First mode 55 Hz, Second Mode 78 Hz.
24

H. A Brief Discussion of the Fast Fourier Transform
and Related Topics (Power Spectra)
The Fourier Transform serves as a bridge between the time domain and
frequency domain. When the fluctuating sinusoidal or random time based
signal is to be analyzed on a digital comp- .er, the Discrete Fourier
Transform (OFT) is used. The Fast Fourier Transform (FFT) is an efficient,
high speed method used to compute the DFT. The frequency spectrum is
calculated from the sampled time function, rather than measured using a
single fixed-band-pass filter. The first major step involved with using the
FFT procedure is digitization of the recorded analog signal x(t). There are
two processes associated with the digitization of an analog signal x(t):
(1) sampling defines the instantaneous points at which the data are to be
observed; (2) quantization converts the data values at the sampling points
into numerical form.
Sampling of an essentially stationary continuous x(t) vs. t record for
digital analysis is performed at equally spaced intervals, •. The
appropriate sampling interval A t must be chosen such that no aliasing,
confusion between low and high frequency (multiples) components in the
original data, is allowed to occur. The sampling rate is then I/At
samples/sec. The highest frequency that can be defined is 1/2 A t, because
at least two samples/cycle are required to define a frequency component in
the original data. This frequency, 1/2A t, is called the Nyquist or folding
frequency fc" To help avoid aliasing, fc should be chosen to be one and one
half to two times greater than the maximum anticipated frequency. Low pass
(antialiasing) filtering must be used to eliminate aliasing.
Only a finite number of samples of x(t) vs. t at the intervals A t can
be taken and stored. This finite number, N - 1024 consecutive nonzero
samples, defines the time length of the required data record, Tr = NAt
The values of At most frequently chosen in the present study were A t - 2
and 5 milliseconds, such that the data record time lengths were 2.05 and
5.12 seconds, respectively. The spectral resolutions (resolution band-
widths) A f - l/Tr defined by these two A t interval values are 0.5 Hz and
0.2 Hz respectively.
25

In the present study, the Zonic FFT with a DMS 5003 computer was used
to calculate the power spectral density funLtion, which decribes the general
frequency composition of the random stationary data. The power spectrum is
computed by taking the sum of the squares of the real and imaginary compon-
ents of the Fourier coefficients of the DFT. For random stationary data, a
true spectrum exists and can be obtained by averaging -.ay individual
spectra. The Zonic FFT possesses the capability to average individual
spectra. It is noted in the literature, that reasonable statistical quality
requires averaging of 64 to 100 individual spectra. This would require that
131 to 205 sec., or 328 to 512 sec. of data be taken when A t - 2 or 5
millisec. respectively. A very large number of these spectra (approximately
700) were taken during the two major weeks of wind tunnel tests. In order
for each of the spectra to be statistically valid, 60 to 82 hours of running
time would have been required. The limitations on available wind tunnel
time, funding for the research, and human endurance, required that the
number of averages be reduced to 30 (A t - 2 millisec.) or 20 (A t - 5
millisec.). Power spectra, using 30 and 100 or 20 and 100 averages, were
then compared to observe whether any significant differences existed between
them. It was found that the fairly narrow-band, high energy peaks defining
the vortex shedding and vibration frequencies were identical on both
spectra. The only significant difference between the two spectra, was that
the small fluctuations in the spectral plots in the areas away from the
peaks were slightly less when 100 averages were used. Twenty and thirty
averages were then sufficient to give an acourate statistical measure of the
shedding and vibration frequencies.
1IL Experimental Apparatus and Instrumentation
A. Wind Tunnel Test Facility
All experiments were condacted in the 28 ft. (8.5m) long, 6 ft. (1.8 m)
square, test section (Figure 3 and 4) which is part of the VPI&SU contin-
uous, closed jet, single return, subsonic stability wind tunnel. The test
section was designed such that any combination of six different wire screens
can be positioned in its upstream portion. These various combinations of
q screens generate numerically unique linear velocity shears (dU/dy) across
26

the span of the test section. The numerical values of these velocity shears
were characterized by the nondimensional shear parameter, 6 - d/UC dU/dy.
Spanwise velocity and turbulence profiles, corresponding to the two shear
levels (8 = 0.0 and 0.0053) used in the present study are shown in Figures 5
and 6. The turbulence intensity (Tu%) is defined as the ratio between the
measured rms value of the fluctuating velocity signal from the hot wire
anemometer and the steady dc value of the velocity. The velocity profiles
are plotted as a dimensionless ratio U/Uc, where U is the local velocity and
Uc is the centerline velocity, vs. y/d. Both the velocity and turbulence
profiles are uniform in unsheared flow. The flow of 0.25% turbulence was
generated by placing a wire screen of uniform cross-tunnel distribution at
the upstream end of the test section. The velocity decreased in a very
linear fashion across the span when the shear level was increased to 0 =
0.0053 by placing five screens of nonuniform cross-tunnel wire distribution
at the upstream end of the test section. The turbulence increased near the
low velocity end because the density of wire screens increased in order to
generate the low velocity.
To monitor the tunnel velocity, a pitot-static tube, connected to both
the VPI&SU Digital Dynamic-Pressure Indicator and Barocel Electronic
Manometer, was used. The pitot-static tube was mounted to the test section
flcor at the spanwise center of the tunnel, extending vertically into the
freestream. The static freestrean pressure was measured by a Validyne
Digital Barometer ebdel DB99. The freestream temperature was monitored by a
temp-erature probe which was mounted to the test section wall. The
temperature value was continuously displaye d by a VPI&SU Digital
Th e rmome ter.
An HP 3052A Data Acquisition System was located in the control room,
adjacent to the test section. The five major components of the system
included an HP 9835B Desktop Computer, an HP 3456k Digital Voltmeter, an HP
3437A System Voltmeter, an HP 3497A Data Acquisition/Control Unit, and a 30
channel system scanner. The pitct static tube values, the freestream
temperature values, and the static freestream pressure values were all hard
27
wired to the system scanner. Programs to constantly monitor the tunnel
velocity and Reynolds nunber were available through the computer.
A three-dimensional traverse (see Figures 3 and 4) was available to
transport the measuring instruments (Physitech Optical Head and hot wire
probe) in the vertical (x/d), sparti se (y/d) or s t reamwi se (z/d)
directions. The center of this axis system is located vertically at the
cable center axis, positive x/d up, sparmyise at the wind tunnel and cable
centerline, positive y/d to the right (looking upstream); and streamrise at
the center axis of the cable, positive z/d downstream. The sparwise (y/d)
motion was controlled by a 15 volt to 30 volt dc gearhead motor, which was
powered by an HP 6255k 0-40 V Dual DC Power Supply. The sparwise motion was
displayed by a digital counter, accurate to * 1/100 inch (* 1/40 cm). Two
precision step motors were used to drive the vertical (x/d) traverse. The
control box was specially designed for that purpose at VPI&SU. The vertical
position was also displayed digitally and was acoirate to * I Lam. The
streamwise (z/d) traverse was driven by a 12 V to 24 V DC gearhead motor,
powered by the other side of the HP 6255A Dual DC Power Supply. The
spanwise position was monitored by a Clarostat Mbdel 73JA ten turn linear
potentiometer, powered by a Lambda Model 14203 5 V DC Power Supply. The
digital output from the potentiometer, which corresponded to the spanwise
position, was displayed on an HP 34768 Multimeter. The sparvise positions
were accurate to * 1/80 inch (* 0.32irmm).
B. Test Model
The cable that was used in the tests was manufactured by Philadelphia
4 Resin Corporation, and was labeled "Phillystran" ps 29-C-39J. It was
constructed of seven strands of "Kevlar" ps 29-BI05 rope, wound around
each other helically, and wrapped with a polyurethane jacket. The cross
section was not circulir. The cable had a 3/8 inch (9.53 mm) nominal
diameter, and a 0.45 inch (11.43 mm) measured diameter over the jacket. The
specific gravity of the cable was approximately 1.2, and the breaking
strength was 17,000 lbf.
28
C. Experimental Test Setup
Figures 3 and 4 show a top and upstream view of the testing equipment
arrangement. The cable was connected to the turnbuckles, which were
attached to the I-beam support frame, and stretched across the span of the
tunnel. The center axis of the cable was at a vertical height, x/d - 0,
midway between the test section floor anti ceiling. It was decided that a
working distance of L = 4 feet (1.22 m) between the end plates would be
optimal. The resulting aspect ratio was L/d - 107. The cable was securely
fastened (pinned) at the end plates which were supported by braces extending
between the test section ceiling and flcor. This arrangement ensured that
no vibration would be transmitted beyond the end plates. The cable tension
was adjusted using two 3/8 Inch (9.53mm) turnbuckles which were located
outside each of the test section walls. The cable ends were secured to the
turnbuckles by four 3/8 inch (9.53mm) cable clamps. The turnbuckle at the
left wall was attached directly to the welded I-beam support structure. The
6 inch I-beam support structure was laid across the top of the test
section. The right turnbuckle was attached to a Strainsert, Model FLIU,
1000 lb, Single Bridge, Universal Flat Load Cell, which was bolted onto the
I-beam support. The load cell was used to constantly monitor the cable
tension (Figure 7). The calibration factor was 3mv/(V excitation) output.
The 15 V DC excitation voltage was supplied to the load celi by a Weston
Model 301 0-15 V DC Power Supply. The output (now calibrated such that 45
my was equal to 1000 lbf voltage was digitally displayed on an HP 3476B
Multimeter. The value of the cable tension could be measured accurately to
within * 1 percent.
It was initially determined that the cable was too highly damped to be
naturally excited into the lowest vibrational modes by adjusting the wind
speed. A small Radio Shaa& 0-6 V DC Mabuchi Motor, with an eccentrically
located mass was attached to the cable at y/d - 43.1, near the right end
plate. Both the first and second modes of vibration could be excited by
varying the motor speed. Figure 8 shows the forced cable vibraticn setup.
An HP 6255A Dual DC 0-5 V Power Supply provided the variable motor
29
'1

excitation voltage. The DC excitation voltage was constantly monitored on
the HP 3476B Multimeter
D. Cable Mode Shape Vibration Amplitude and Frequency Measurement
A Physitech M'bdel 010398 Remote Optical Head was mounted to the traverse
(downstream of the cabie) and focused on the top edge of the vibrating
cable. An incandescent light source was placed in front of the cable
(upstr,.am). The optical head was connected to a Physitech Model 440 Electro
Optical Auto Collimator Control Unit (Figure 9). A general non-technical
description of the measuring system principle associated with the optical
head, auto collimator, incandescent light source system follows (33]. The
optical head with a suitable lens system focused an optical discontinuity
(cable-background light interface) on the light sensitive area of the
photomultiplier tube within the optical head. The focused image (cable)
represented a target whose movement was to be measured. The optical image
was converted to an identical electron image by the photoniltiplier tube.
he control unit sent a repetitive electrical signal to the deflection yoke
in the image analyzer. This signal caused the photcmiltiplier tube to scan
the electron image in a predictable manner, moving across the interface in a
perpendicular axis. As the scan moved across the interface, the output of
the photomultiplier tube sharply changed. The deflection signal current was
proportional to the position of the scan at any given time. The change in
the photomultiplier tube output instantly caused the control unit to sample
this current level, and thereby determined the position of the interface
with respect to the deflection current. Since the movement of the interface
was equivalent to the physical movement to be measured, the sampled level
which occurred when the interface was "crossed" was the position of the
target being measured.
To measure the amplitude of vibration, the output voltage from the auto
collimator unit (calibrated such that I mm - 2V * O.1V DC using the gain
setting) was sent to a Disa Type 55D35 True RMS Voltmeter. The rms reading
w,- then a direct nsasure of the amplitude. In order to determine the
vibration frequency, the output signal from the auto collimator unit was
30
ha -- *
band-pass filtered in a Krohn Hite Model 335R Variable Band-pass Filter and
sent to a ZTL Inc. Multichannel FFT Processor with DMS 5003 Computer. The
Krohn-Hite was used as an antialiasing filter. The FFT was used to
calculate a power spectrum of the fluctuating signal. The vibration
frequency and pcwer spectrum were then displayed on the Tektronix 4010
Graphics Display Terminal. The time based signal was continuously displayed
on a Tektronix 510-N oscilloscope, thereby providing a visual monitoring of
the cable vibration characteristics.
E. Vortex Shedding Frequency Measurement
A TSI Model 1210 straight hot wire probe was attached to the traverse
and positioned in the cable wake at the point where the strongest vortex
shedding occurred. The 0.0015 inch (3.8 um) platintm plated tung ten wire
sensor was operated at an overheat ratio of 1.8 using a TSI Model 1050
Constant Temperature Anemometer module with a TSI model 1151-6 Power Supply
and Monitor (Figure 10). The output signal from the anemometer was band-
pass filtered in a Krohn-Hite Model 33% Filter, and sent to the ZTL Inc,
Multichannel FFT Processor with DMS 5003 Computer. The FFT was used to
calculate a power spectrum of the hot wire signal. The power spectrum was
then displayed on the Tektronix 4010 Graphics Display Terminal, as well as
the numerical value of the vortex shedding frequency which was obtained
using the peak search command within the FFT. The display terminal screen
was photographed by a Graflex camera loaded with Polaroid Type 57 High Speed
Film. The hot-wire signal was displayed at all times on the Tektronix 5103N
Oscilloscope.
F. Cable Wake Width and Vortex Formation Length Instrumentation
The TSI Model, 1210 hot wire probe was mounted to the traverse. It was
then positioned either directly behind the base of the cable for formation
length (Lf) measurements, or one diameter above the top of the cable for
wake width (Lw) measurements. Using this arrangement it was then possible
to traverse downstream in the streamwise direction to measure Lf, or across
the cable wake to measure Lw. The probe was operated at an overheat ratio
of 1.8 using the TSI Model 1050 constant temperature anemometer module with
31

a TSI Model 1051-6 Power Supply and Monitor (Figure 11). The output signal
from the anemometer was band-pass filtered in a Multimetrics Inc. obdel
AF-420L Active Filter. For formation length traces, the low and high pass
frequencies were 2f csv* f csv/10. The high and low pass frequencies for wake
csvv csvwidth measurements were 13 Hz and (2cvfs/) The ring valuie of the
filtered hot wire signal was displayed on the Disa Type 55D35 True RMS
Voltmeter. Graphical displays of both the rms Lf and Lw traces were
provided by an HP Lbdel 7100B Strip Qiart Recorder. Three second averaging
was used to smooth out the fluctuations in the rmt curves.
IV, EXPER IMENTAL METHODS
A. Cable Mode Shape and Vibration Frequency Measc:e'eit
It was decided that a cable tension of 500 lbf (0.0225 V output from
the load cell) would be optimal to use for all first mode forced vibration
tescs. The natural frequency of vibration was estimated to be around 60
Hz. The cable tension was set to a value slightly higher than 500 lbf and
as the cable stretched the tension slowly decreased, finally settling in at
a value close to 500 lbf. The Physitech Remote Optical Head was mounted to
the spanwise traverse at a downstream distance, z/d. - 44.5. The lens
system was then focused on the interface between the upper edge of the cable
and the incandescent light source which was placed upstream of the cable.
This location was established as the zero deflection position by adjusting
the zero set on the auto collimator control uniu. The control unit was
calibrated such that I mm of static deflection was equal to 2V Ic outpur.
This calibration was accompiished by deflecting the vertical traverse 1 mm
and increasing the gain setting on the control unit until the voltage
reading on the multimeter was equal to 2V dc.
The signal output from the control unit was simultaneously sent to a
Disa rms meter, oscilloscope and Zonic FFT. The voltage supplied to the
small motor with the eccentric mass was adjusted such that the cable was
forced to vibrate at iCs maximum amplitude in the first mode, The Physitech
output signal was band-pass filtered in the Krohn-Hite filter to prevent any
signal aliasing. The FFT was used to calculate a power spectrum of the
32

filtered signal. The peak search command was then used to obtain the
numerical value of the cable vibration frequency.
After the natural frequency of vibration of the cable was determined,
the optical head was moved to the spanwise location, y/d - -52.0. The
optical head was traversed across the span of the cable, from y/d - -52.0 to
y/d - 40.0, in increments of y/d - 4.0. At each increment, the rms value of
the vibration amplitude was measured. When each of these rms values is
nondimensionalized by the maximum rms value at y/d = 0, an accurate
representation of the mode shape can be plotted.
The same type of procedure was used to obtain the mode shape and
natural vibration frequency associated with the cable when it was forced to
vibrate in the second mode. The cable tension was decreased to 225 lbf
(0.0101 Vdc output from the load cell) and the second mode natural frequency
was estimated to be around 67 Hz. The span of the cable was again traversed
in increments of y/d = 4.0, and the rms value of the signal at each location
was obtained. The FFT was used to calculate the second mode natural
vibration frequency.
B. Cable Lock-on Region Tests
Preliminary observations of power spectra, taken of the hot wire signal
at various combinations of vertical and streamwise positions above and
behind the base of the cable, indicated that the position of the strongest
vortex shedding was at a height, x/d = 0.92 and downstream location, z/d
3.5. Before any lock-on tests were performed, the Strouhal number of the
non-vi brating cable as a function of increasing Reynolds number was
determined. The hot wire probe tip was placed at the optimal position (x/d
- 0.92, y/d = 0, z/d = 3.5) and the filtered signal irom the anemometer was
input into the FFT. A power spectrum of the signal was calculated and the
vortex shedding frequency was found using the peak search command, and
displayed on the terminal screen. The corresponding Reynolds number was
calculated by the data acquisition system program and printed out along with
the centerline velocity. The Strouhal number was then calculated using the
33

relationship, St - fcsd/Uc. The Reynolds number range covered oy these testswas 1.8 x 10³< Rec < 41.0 x 10³.
Again, preliminary observations of power spectra of the hoc wire signal
were used to help establish the criteria that would determine when the
vortex shedding frequency from the cable (fcsv) lodced-on to the forced
vibration frequency of the cable (fcy). When the amplitude ratio of the
vibration and vortex shedding peaks was equal to 20 (acv/acsv = 20), the
vortex shedding was considered locked on to the forced cable vibration. The
frequency range over which the cable vortex shedding locked on to the cable
vibration, as a function of vibration amplitude (a/d), was determined using
the follawing procedure. The cable was forced to vibrate in the first mode
and the Physitech optical head was used to measure the vibration amplitude
(a/d) at y/d - 0. The hot wire was placed at the optimum position (x/d =
0.92, y/d - 0, z/d - 3.5). The Reynolds number was gradually increased
until the lower lock-on frequency was determined (vortex shedding locked on
to the cable vibration), and increased until the upper lock-on frequency was
established (vortex shedding brcke away from the cable vibration). This
procedure was repeated at spanwise intervals of y/d - 4.0, starting at the
center of the cable, y/d - 0, and ending at the left end of the cable, y/d
-48.0. The same procedure was followea using the second mode shape. In
this manner, the variation of the lock-on region as a function of increasing
amplitude of vibration (a/d) was studied.
When the lork-on range vs. a/d tests were completed, the probe was
positioned at y/d - 0. With the cable still vibrating in the first mode,
the variation of the Strouhal number (cable vortex shedding frequency) as a
F function of increasing Reynolds number was determined, so that these values
could be compared to the stationary cable St vs. Re data. Another basic
test was also conducted. The spanwise variation of the vortex shedding
frequency from a vibrating cable, at Reynolds numbers preceding and
following the locked-on region was examined. It was desired to determine if
the cable mode shape, (i.e. , sparwise variation in a/d due to the vibration)
had any effect on the spanwise shedding frequencies. To accomplish this,
the cable was vibrated in the first mode and the entire span of the cable,
34

Once the wake widths were determined as a function of Lncreasing
Reynolds number for the non-vibrating cable, the cable was vibrated in the
first mode at each of those a/d values corresponding to the formation length
traces. Following the same procedure used to determine the variation of Lw
with increasing Reynolds number for the non-vibrating cable, the variation
of Lw with increasing Reynolds number at each individual value of a/d for
the vibrating cable ,as investigated. The wake width traces were displayed
on the strip chart recorder.
D. Sphere Zock-oln Regions
One of the goals of this study was to analyze the effect that placing
various bluff body shapes on the cable would have on the spanwise variationof vortex shedding from both a stationary (f 5so) and vibrating (fssv) cable
in sheared and unsheared flow. The shape chosen was a 1.5 inch (3.81 cm)
diameter spherical ping pong ball. The balls had 0.45 inch (1.14 cm)
diameter holes drilled through them so they could be mounted on the cable at
various y/d locations. Ping pong balls were chosen because their mass
insignificantly affected the cable mode shape characteristics, i.e.,
amplitude and vibration frequency.
Before investigating the lock-on regions for the sphere, the behavior
of the vortex shedding (St) from the sphere as a function of increasing
Reynolds number was investigated in the range 6.57 x 10³ < Re < 24.17 x
103. The hot wire probe was positioned at x/d = 0.92 and z/d - 3.5,
directly behind the base of the sphere. The Reynolds number was increased
in small increments, and at each increment a power spectrum of the filteredhot wire signal was calculated. The shedding frequency (fsao) of the sphere
was found using the FFT's peak search command and displayed on the terminal
screen.
The criterion that was used to determine when the vortex shedding from
the sphere (fssv) locked-on to the vibration frequency of the sphere (fsv)
was slightly different than that used to deter-mine the cable lock-on
frequencies. When the amplitude ratio of the vibration and vortex shedding
peaks was equal to 10 (asv/assv 10), the shedding frequency of the sphere
36
Once the wake widths were determined as a function of increasing
Reynolds number for the non-vibrating cable, the cable was vibrated in the
first mode at each of those a/d values corresponding to the formation length
traces. Following the same procedure used to determine the variation of Lw
with increasing Reynolds number for the non-vibrating cable, the variation
of Lw with increasing Reynolds number at each individual value of a/d for
the vibrating cable 4as investigated. The wake width traces were displayed
on the strip chart recorder.
D. Sphere .ýock-on Regions
One of the goals of this study was to analyze the effect that placing
various bluff body shapes on the cable would have on the spanwise variation
of vortex shedding from both a stationary (f 9 so) and vibrating (fs) cable
* in sheared and unsheared flow. The shape chosen was a 1.5 inch (3.81 cm)
diameter spherical ping pong ball. The balls had 0.45 inch (1.14 cm)
diameter holes drilled through them so they could be mounted on the cable at
various y/d locations. Ping pong balls were chosen because their mass
insignificantly affected the cable mode shape characteristics, i.e.,
amplitude and vibration frequency.
Before investigating the lock-on regions for the sphere, the behavior
of the vortex shedding (St) from the sphere as a function of increasing
Reynolds number was investigated in the range 6.57 x 10³ < Re < 24.17 x
103. The hot wire probe was positioned at x/d = 0.92 and z/d - 3.5,
directly behind the base of the sphere. The Reynolds number was increased
in small increments, and at each increment a power spectrum of the filteredhot wire signal was calculated. The shedding frequency (fsao) of the sphere
was found using the FFT's peak search command and displayed on the terminal
screen.
The criterion that was used to determine when the vortex shedding from
the sphere (fssv) locked-on to the vibration frequency of the sphere (fsv)
was slightly differe.t than that used to deter-mine the cable lock-on
frequencies. When the amplitude ratio of the vibration and vortex shedding
peaks was equal to 10 (asv/assv 10), the shedding frequency of the sphere
36

was considered to be locked on to the vibration frequency of the sphere.
The two criteria were different because the amplitude of the cable vortex
shedding peaks on the power spectra were slightly scronger than the
amplitudes associated with the power spectra of the vortex shedding from the
spheres.
The procedure used to examine the lock-on regions for the sphere was
similar to that used when the cable lock-on regions were determined. The
spheres were first placed at four sparwise locations along the cable; y/d -
0, -24, -32, and -42. The cable was vibrated in the first mode and the
vibration amplitude, a/d, was measured by the Physitech optical head and rme
meter at the position y/d - 4.0. The hot wire probe was placed directly
behind the first sphere (y/d - 0) at the position, x/d - 0.92 and z/d -
3.5. The Reynolds number was slowly increased and the lower and upper lock-
on frequencies for the sphere were determined. The same procedire was
followed for the spheres located at y/d - -24, -32, and -42. Four more
lock-on regions at different a/d values were measured when the cable was
vibrated in the second mode. The possibility that the vortex shedding from
the sphere could lock-on to one half the vibration frequency, as well as to
the vibration frequency itself was also examined.
E. Sphere Region of Influence
The interactions between the sphere and cable wakes in both a
stationary and vibrating situation were studied. Of particular interest was
the sparwise range of influence that the vortex shedding from the sphere had
on the vortex shedding from the cable. From preliminary observations of
power spectra it was decided, when the amplitudes of the peaks associated
with the sphere and cable shedding frequencies displayed on the power
spectra were equal, that this position would be considered the end of the
spanwise region of influence of the sphere.
To measure the region of influence, the hot wire probe was placed at a
spanwise location four cable diameters (y/d - 4.0) away from the center of
the sphere, which was located at y/d - 0. The probe tip was then placed at
a height x/d = 0.92 and downstream position z/d 3.5. The probe was
37
traversed in small 1/20 inch (y/d - 0.11) increments toward the center of
the sphere. The spanwise location where the magnitudes of the sphere and
cable shedding peaks were equal on the power spectrum of the filtered hot
wire signal was recorded. The probe was then traversed away from the center
of the sphere and the entire region of influence was established. The
variation of this region of influence with increasing Reynolds number for
the cases of a non-vibrating and vibrating cable-sphere combination was
studied, and the variation of this spanwise region of influence with
changing a/d was also studied. Four spheres were placed on the cable at the
locations, y/d - 0, -24, -32, -42. The cable was vibrated in the first mode
and the vibration amplitude at y/d - 4.0 was measured using the Physitech
optical head and rms meter. The probe was again placed four diameters away
from the center of the vibrating sphere (y/d - 0), and traversed in the
spanwise direction across the sphere to determine the entire region of
influence. The same procedure was followed at each of the span- wise
positions of the three remaining spheres, y/d - -24, -32 and -42, which were
all vibrating at different amplitudes (a/d values).
Five spheres were placed on the cable at the locations y/d - -32, -16,
0, 16, 32, and their influence on the sparwise vortex shedding
characteristics of the vibrating cable in unsheared flow was investigated.
It was desired to determine whether or not the same phenomena would be
observed when these results were compared to those obtained without the
spheres. (See the end of Section IV B. "Spanwise variation of the vortex
shedding frequency from a vibrating cable at Reynolds numbers preceding and
following the lock-on region. ... ").
F. Spanwise Sheared Flow Tests
The maxirwm value of the shear parameter, 8 - d/Uc(dU/-7. that could
be achieved in the wind tunnel was B - 0.0053. Four different tests were
performed to examine the sparwise vortex shedding characteristics of the
cable wake when the cable was subjected to this sheared flow. The first of
these tests examined the spanwise shedding structure at three d.L'ferent
Reynolds numabers. The cable was then vibrated in the first and second
38
modes, and the sparwise shedding characteristics were again observed at
three Reynolds numbers. Spheres, spaced at y/d - 20 for one test and y/d -
28 for the other, were added to the non-vibrating cable. The effect of
adding the spheres, and varying their spacing, on the shedding pattern was
examined. Lastly, the cable with the spheres attached was vibrated in the
first mode. The effects that these two spacing combinations had on the
vortex shedding patterns in the cable wake were studied.
The three Reynolds number values that were used when the vortex
shedding structure in the non-vibrating cable wake was stud.ed were Rec M
2.6 x 10³, Rec M 2.96 x 10³ and Rec a 3.72 x 10³. The two tests at Rec a
2.6 x 10³ and Rec M 3.72 x 10³ were performed during the initial first phase
of the investigations, three months before the main second phase of the
tests. The hot wire probe during the first phase was set at a much less
than optimal position, x/d - 1.25 and z/d - 5.5, than was later found to be
required to obtain a clear picture of the actual shedding structure. For
the test at Rec a 2.96 x 10³, the hot wire probe was positioned at the
optimal height, x/d - 0.92, and downstream location, z/d - 3.5. The
procedure used to measure the values of vortex shedding along the span of
the cable, for both the first and second phases of the investigation was the
same. The probe was placed at the spanwise loction, y/d - -42.7 (first
phase) or y/d - -48. The entire span of the cable, y/d - -42.7 to y/d - 40
(first phase) or y/d - -48 to y/d - 48, was traversed in increments of y/d =
2.7 (first phase) or y/d - 2.0. At each increment, a power spectrum of the
filtered hot wire signal was calculated by the FFT and displayed on the
terminal screen. Using the peak search comuand, the dominant vortexshedding frequencies at each location were identified and also printed on
the terminal screen. A photograph (hard copy) of the terminal screen was
taken to record the power spectrum and vortex shedding frequency values at
each position.
For the second series of tests, the cable was vibrated in the first
mode at the two lower Reynolds numbers, Rec = 2.6 x 10³ and Rec M 2.96 x
103, and in the second mode at Rec M 3.72 x 10³. These Reynolds number
values had been previously chosen such that the cable vortex shedding would
39

lock on to the cable vibration frequency over the central portion of the
cable span. The amplitudes of vibration for each of these tests were
measured using the Physitech optical head and rms meter, and recorded. The
span of the cable, from y/d - -42.7 to y/d - 40 (first phase) or from y/d
-48 to y/d - 40, was traversed in increments of y/d - 2.7 (first phase) or
y/d - 2.0. At each increment, the power spectrum and shedding frequency
values were calculated and photographed as in the previous set of non-
vibrating cable tests.
When the spheres were added to the non-vibrating cable, two different
spacing configurationq were tested. In the first configuration, five
spheres were placed at the sparwise locations, y/d - -40, -20, 0, 20, 40.
Three spheres were placed at locations, y/d - -28, 0, 28, in the second
configuration. Each of these configurations were tested at the Reynolds
q number, Rec a 2.96 x 10³. The probe was placed at the optimal position, x/d
- 0.92 and z/d - 3.5. The span of the cable, from y/d - -48 to y./d - 48, was
traversed in increments of y/d - 2.0. At each increment, the power spectrum
and vortex shedding frequency values were calculated and photographed.
The final two tests in this sequence of four were to vibrate the cable
in the first mode with each of the two sphere configurations on the cable.
Th' Amplitude of the first mode vibration was measured using the Physitech
and rms meter. The Reynolds number for the first test (five spheres placed
y/d - 20 apart) was, Rec M 2.96 x 10³. When the second configuration was
tested (three spheres placed y/d - 28 apart) the Reynolds number was
slightly different, Rec M 2.93 x 10o. The cable span, from y/d - -48 to y/d
- 40, was traversed in increments of y/d - 2.0. Again, the power spectra
and freque-- value were displayed on the terminal screen and photographed.
Thrcghout the second phase of investigations, those tests performed at
Rec M 2.96 x 10³ and Rec M 2.93 x 10³ , it was desired to keep the Reynolds
number, vibration amplitudes, and cable vibratiton frequencies as close to a
constant val As possible. This would allow direct comparisons of the data
obtained in all six of the tests. From these coaparisons, it was hoped that
some light would be shed on the effects associated with placing spheres on a
vibrating cable in a sheared flow.
40
61
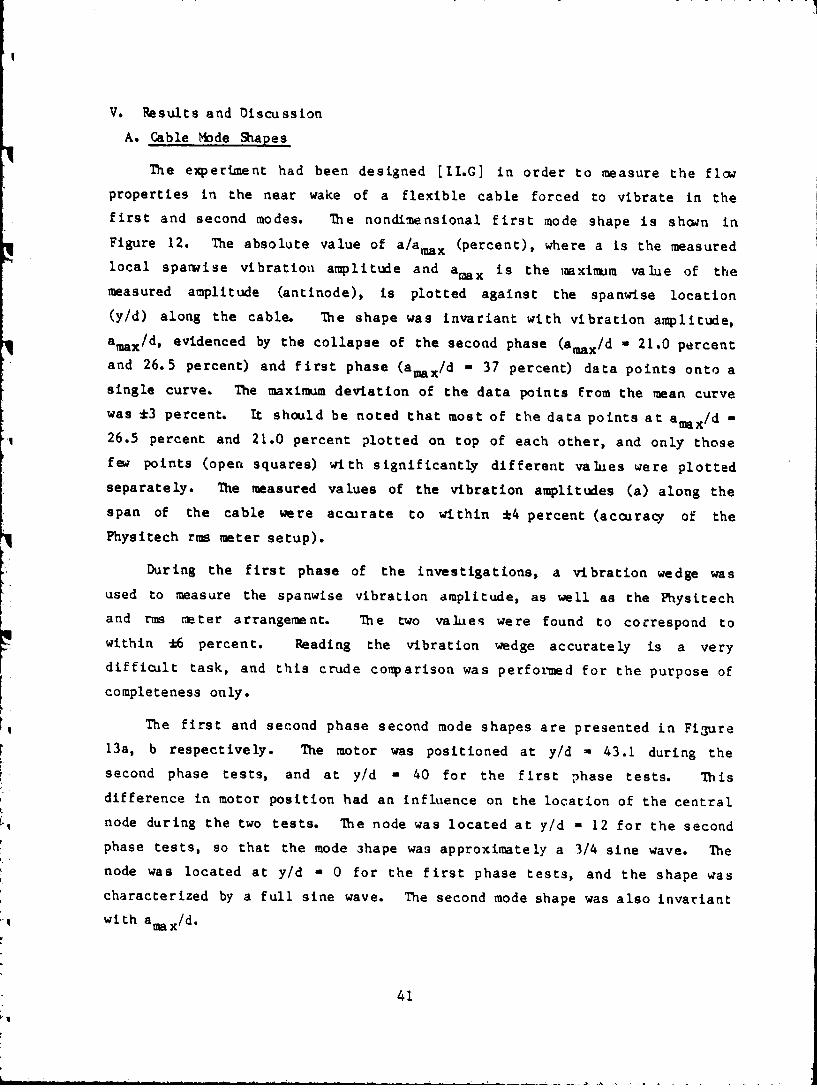
V. Results and Discussion
A. Cable Mode Shapes
The experiment had been designed [II.G] in order to measure the flowproperties in the near wake of a flexible cable forced to vibrate in the
first and second modes. The nondimensional first mode shape is shown in
Figure 12. The absolute value of a/aeax (percent), where a is the measured
local sparwise vibration amplitude and aeax is the maximum value of themeasured amplitude (antinode), is plotted against the spanwise location
(y/d) along the cable. The shape was invariant with vibration amplitude,
amax/d, evidenced by the collapse of the second phase (amax/d - 21.0 percent
and 26.5 percent) and first phase (amax/d - 37 percent) data points onto a
single curve. The maximum deviation of the data points from the mean curvewas *3 percent. It should be noted that most of the data points at amax/d a
26.5 percent and 21.0 percent plotted on top of each other, and only those
few points (open squares) with significantly different values were plotted
separately. The measured values of the vibration amplitudes (a) along the
span of the cable were accurate to within *4 percent (accuracy of the
Physitech rms meter setup).
During the first phase of the investigations, a vibration wedge wasused to measure the spanwise vibration amplitude, as well as the Physitech
and rms meter arrangement. The two values were found to correspond to
within -6 percent. Reading the vibration wedge accurately is a very
difficult task, and this crude comparison was performed for the purpose of
completeness only.
The first and second phase second mode shapes are presented in Fi3ure13a, b respectively. The motor was positioned at y/d - 43.1 during the
second phase tests, and at y/d - 40 for the first phase tests. This
difference in motor position had an influence on the location of the central
node during the two tests. The node was located at y/d - 12 for the secondphase tests, so that the mode 3hape was approximately a 3/4 sine wave. The
node was located at y/d - 0 for the first phase tests, and the shape was
characterized by a full sine wave. The second mode shape was also invariant
with a max/d.
41

B. Lock-on Phenomena
In this section, the near wzke vortex shedding from a stationary and
forced-vibrating cable and sphv, re cable combination was discussed.
Particular emphasis was placed on synchronization (lock-on) related
phenotaena.
The frequency boundaries of the cable lock-on regions (acv/acsv Ž. 20.0)
are plotted in Figure 14 as a function of increasing vibration amplitude
a/d, for the amplitude range 0.02 to 0.32. It was desired to obt4in a
mathematical expression, similar to those obtained by Stansby [44] for the
lock-oa range of a vibrating cylinder, for the bounds of cable lock-on.
Linear regression by the method of least squares was used to fit a line
through the data points describing the lower and upper boundaries of the
lock-on region. The linear fit through the lower boundary (Scsv/SCV -
fcsv/fcv < 1.0) data is
fcsv/fcv / 0.97 (1.0 - 0.69 a/d),
with r 2 . 0.94, and the equation defining the upper boundary is
fcsv/fcv - 1.03 ( 1.0 + 1.14 a/d),
with r 0.98. The accuracy of this linear fit is described by the valueof r2, where r2 . 1.0 defines a perfect linear fit. Both the second phase
(clo,,ed squares) and first phase (open circles) results exhibited no
signiftcart amount of scatter around the least squares fit, which
demonstrated the reprodicibility of the results over a long time period.
The numerical vaiues of the frequencies defining the upper and lower
boundaries of the lock-on regions could be measured accurately to within
*1.5 perLent. The largest error was introduced by the uncertainty in the
vibration amplitude a/d measurements: *4 percent for the second phase tests
and * 10 percent ror the first phase tests.
The fr.equency range over which the vortex shidding locked-on to the
cable vibration increased proportionally with the amplitude, a finding that
42

was consistent with Koopmann's [25] and Stansby's [44] results. Koopmann' s
data fell within the region enclosed by the current data whereas Stansby's
data showed a larger lock-on region. The differences in the length of the
lock-on regions could be attributed to the differences in the near wake of
the vibrating cylinder and helically wound cable, and differences in the
measurement procedures and criteria used to define the lock-on region. The
shedding remained locked-on to the cable vibration significantly longer at
the upper boundary. In the unforced situation, as the flow speed past the
cable was increased, the vortex shedding self excited the cable into
resonance only when the natural frequency was equal to or less than the
shedding frequency (fcso/fcv > 1). This synchronization then persisted as
the flow speed was increased until the vortex shedding was no longer able to
naturally excite one of the natural modes. In unforced synchronized
vibrations, there was no substantial lower lock-on region. The behavior of
the vortex shedding behind a forced-vibrating cable was therefore very
similar to that exhibited during natural synchronization. In the present
results, the frequency boundaries of the lock-on region were insensitive to
whether tht, wind speed was ascending or descending through the region.
Lock.-on phenomenon can be further examined by plotting the reduced
velocity, Ur, at the boundaries of the lock-on region vs. the vibration
any'l1tude. The reduced velocity was a nondimensional quantity that was
frequently used when discussing self-excited vibrations at a natural
structural frequency. It was defined as
Ur -Uc/fcvd- (fcso/fcv) UC/fcsod- (fcso/fcv) St-1.
Ur* was the reduced velocity at perfect synchronization (fcsv - fm,). For
self-excited oscillations of a structure, the unsteady displacement
amplitude first built up as Ur approaches Ur* toward a maximum amplitude
which usually occurred at fcso/'cv - 1.2, and then decreased as the upper
limit of the synchronization range was reached (Ur > Ur*). The excitation
range cf these sif induced oscillations in air was 4.5 < Ur < 7.5 [20] and
the maximum displacement amplitudes occurred in the range 5.0 < Ur < 6.7
(20].
43
*1

T1,e reduced velocities at the upper and lower boundaries of the cable
lc~ck-on region, as a function of forced vibration amplitude a/d, were
plotted in Figure 15 for values of a/d up to 0.322. Perfect synchronization
occurred at the critical reduced velocity value Ur* - 5.50 * 2.5 percent.
The corresponding Reynolds number and velocity values were Rec a 2.93 x 10
and Uc - 12.98 ft/sec *2.0 percent. At this critical reduced velocity, a
discontinuous change in the time averaged and fluctuating forces on an
oscillating cylinder occurred [50]. In Figure 15, the cable vortex shedding
locked-on to the forced vibration frequency at a constant reduced velocity
over the lower boundary, Ur < Ur*. This mean value, Ur a 5.10 -.3 percent,
was 7.3 percent less than the critical reduced velocity. The upper boundary
of the lock-on region increased linearly with a/d, a phenomenon that was
expected to occur during both forced and unforced synchronization. In
natural synchronization, when Ur < Ur* the cable could be self-excited
because the periodic force did not have a cooponent in phase with the
oscillatory velocity of the cable. When Ur M Ur*, the vortex shedding and
natural vibration frequencies perfectly synchronized (are in phase) and the
cable exhibited the maximum self-excited resonance vibrations if the system
damping was sufficiently small. This frequency capture (resonant in-phase
vibrations) then continued until the upper boundary of the lock-on regionwas reached. At this value of Ur, the resonant amplitudes died out
completely and the two frequencies no longer acted in unison. Linear
regression by the method of least squares was used to obtain an equation,
Ur = 5.76 (1.0 + 0.86 a/d)
with r 2 . 0.988, to describe the upper boundary of the lock-on region.
A combined analysis of Figures 14 and 15 revealed that the frequency at
which the vortex shedding initially locked-on to the forced cable vibration
frequency was the variable that was changing with amplitude. It would be
instructive to plot the Strouhal number (Stc = fcsvd/Uc) values at the upper
and lower boundaries of the lock-on region as a function of iacreasing
vibration amplitude a/d, to examine how the frequency changed. Such a plot
is presented in Figure 16. For vibration amplitudes below 11 percent, the
44
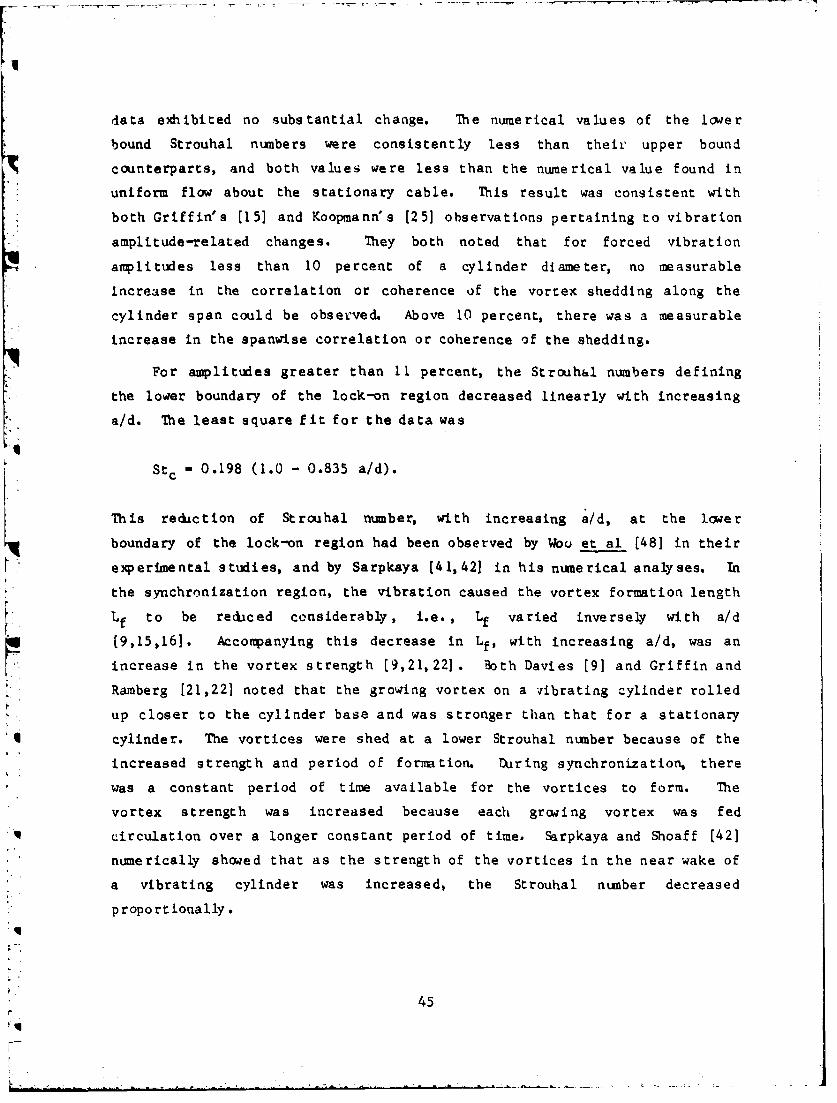
data exhibited no substantial change. The numerical values of the lower
bound Strouhal numbers were consistently less than their upper bound
counterparts, and both values were less than the numerical value found in
uniform flow about the stationary cable. This result was consistent with
both Griffin's [15] and Koopmann's [25] observations pertaining to vibration
amplitude-related changes. They both noted that for forced vibration
amplitudes less than 10 percent of a cylinder diameter, no measurable
increase in the correlation or coherence of the vortex shedding along the
cylinder span could be observed. Above 10 percent, there was a measurable
increase in the spanwise correlation or coherence of the shedding.
For amplitudes greater than 11 percent, the Strouhhl numbers defining
the lower boundary of the lock-on region decreased linearly with increasing
a/d. The least square fit for the data was
Stc - 0.198 (1.0 - 0.835 a/d).
This recbction of Strouhal number, with increasing a/d, at the lower
boundary of the lock-on region had been observed by Wou et al [48] in their
experimental studies, and by Sarpkaya (41,42] in his numerical analyses. In
the synchronization region, the vibration caused the vortex formation length
Lf to be reduced considerably, i.e. , Lf varied inversely with a/d
(9,15,16]. Accompanying this decrease in Lf, with increasing a/d, was an
increase in the vortex strength [9,21, 22]. Both Davies [9] and Griffin and
Ramberg [21,22] noted that the growing vortex on a iibrating cylinder rolled
up closer to the cylinder base and was stronger than that for a stationary
cylinder. The vortices were shed at a lower Strouhal number because of the
increased strength and period of formation. During synchronization, there
was a constant period of time available for the vortices to form. The
vortex strength was increased because each grvwing vortex was fed
circulation over a longer constant period of time. Sarpkaya and Shoaff [42]
numerically showed that as the strength of the vortices in the near wake of
a vibrating cylinder was increased, the Strouhal number decreased
proportionally.
45
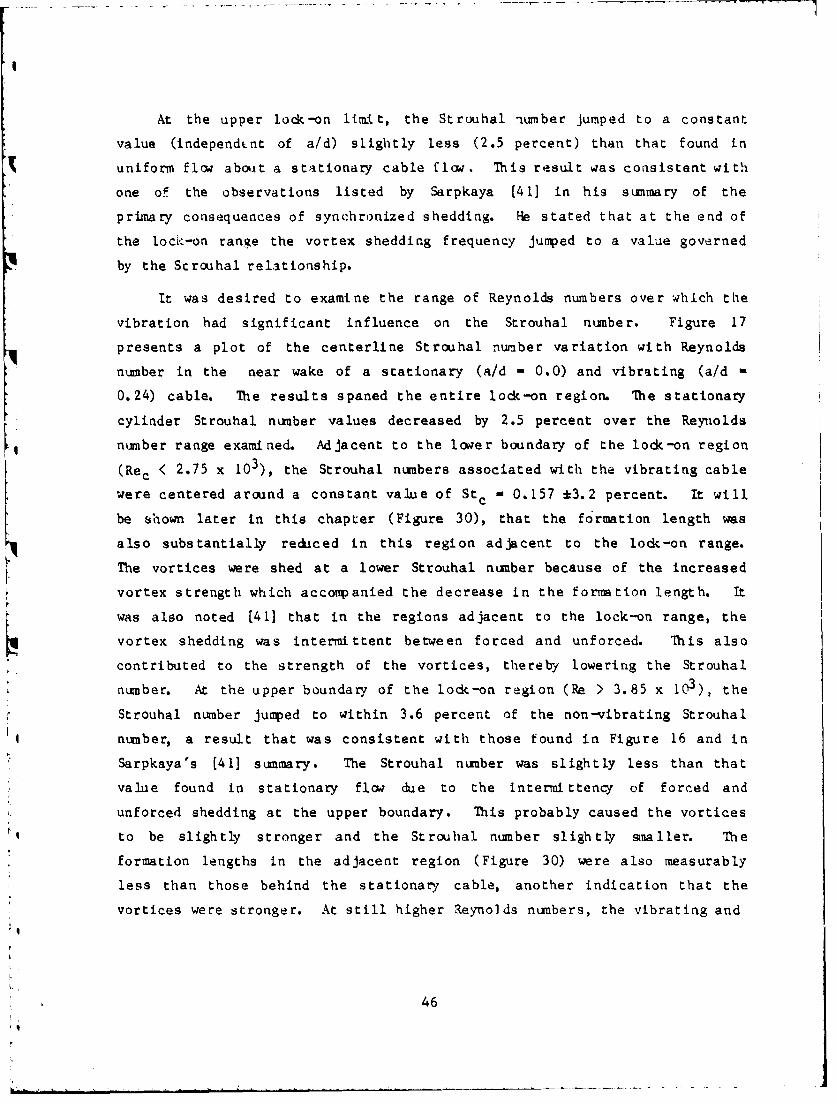
At the upper lock-on limit, the Strouhal number jumped to a constant
value (independLnt of a/d) slightly less (2.5 percent) than that found in
uniform flo abokt a stationary cable flow This result was consistent with
one of the observations listed by Sarpkaya [41] in his summary of the
primary consequences of synchronized shedding. He stated that at the end of
the loc'k-on range the vortex shedding frequency jumped to a value governed
by the Scrouhal relationship.
It was desired to examine the range of Reynolds numbers over which the
vibration had significant influence on the Strouhal number. Figure 17
presents a plot of the centerline Strouhal number variation with Reynolds
number in the near wake of a stationary (a/d - 0.0) and vibrating (a/d
0.24) cable. The results spaned the entire lock-on region. The stationary
cylinder Strouhal number values decreased by 2.5 percent over the Reynolds
number range examined. Adjacent to the lower boundary of the lock-on region
(Rec < 2.75 x 10³), the Strouhal numbers associated with the vibrating cable
were centered around a constant value of Stc - 0.157 *3.2 percent. It will
be shown later in this chapter (Figure 30), that the formation length was
also substantially rediced in this region adjacent to the lock-on range.
The vortices were shed at a lower Strouhal number because of the increased
vortex strength which acconpanied the decrease in the formation length. It
was also noted [41] that in the regions adjacent to the lock-on range, the
vortex shedding was intermittent between forced and unforced. This also
contributed to the strength of the vortices, thereby lowering the Strouhal
number. At the upper boundary of the lock-on region (Re > 3.85 x 13), the
Strouhal number jumped to within 3.6 percent of the non-vibrating Strouhal
number, a result that was consistent with those found in Figure 16 and in
Sarpkaya's (41] summary. The Strouhal number was slightly less than that
value found in stationary flow due to the intermittency of forced and
unforced shedding at the upper boundary. This probably caused the vorticesto be slightly stronger and the Strouhal number slightly smaller. The
formation lengths in the adjacent region (Figure 30) were also measurably
less than those behind the stationary cable, another indication that the
vortices were stronger. At still higher Reynolds numbers, the vibrating and
46
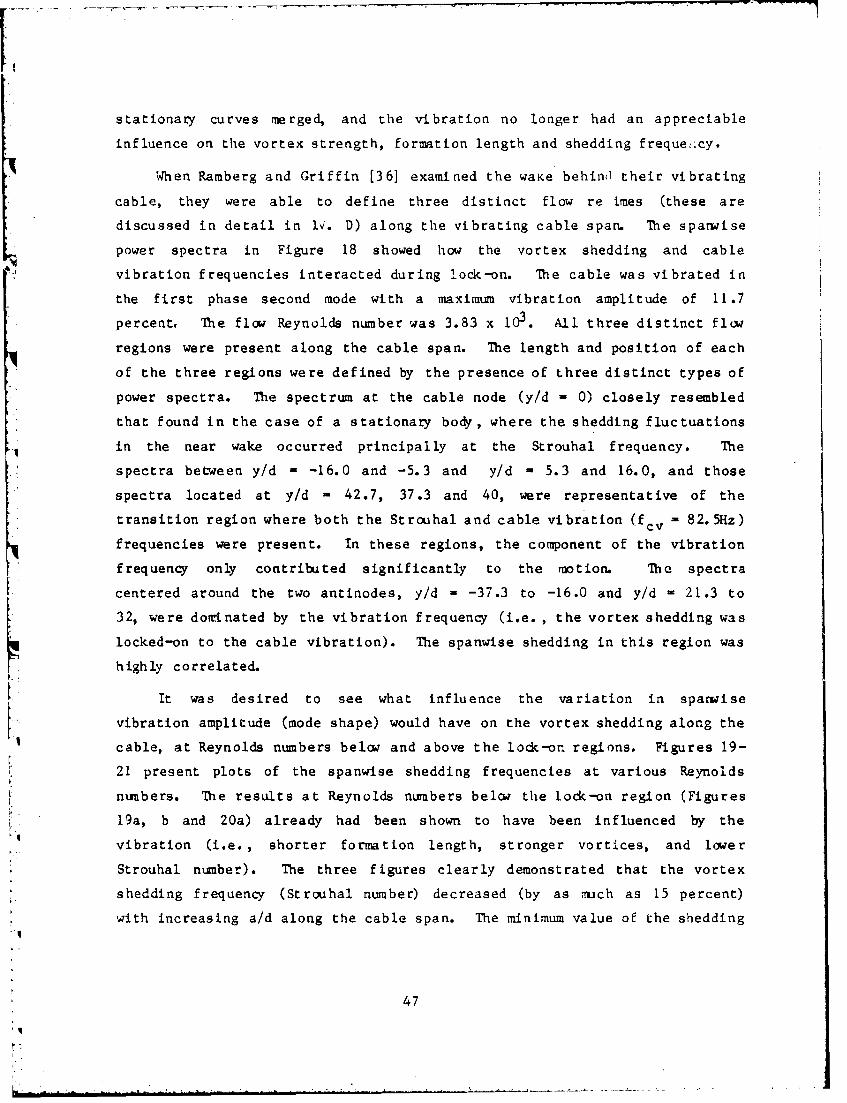
stationary curves merged, and the vibration no longer had an appreciable
influence on the vortex strength, formation length and shedding freque!:cy.
When Ramberg and Griffin [36] examined the waKe behind their vibrating
cable, they were able to define three distinct flow re imes (these are
discussed in detail in lv. D) along the vibrating cable span. The spanwise
power spectra in Figure 18 showed how the vortex shedding and cable
vibration frequencies interacted during lock-on. The cable was vibrated in
the first phase second mode with a maximum vibration amplitude of 11.7
percente The flow Reynolds number was 3.83 x 10³. All three distinct flow
regions were present along the cable span. The length and position of each
of the three regions were defined by the presence of three distinct types of
power spectra. The spectrum at the cable node (y/d - 0) closely resembled
that found in the case of a stationary body, where the shedding fluctuations
in the near wake occurred principally at the Strouhal frequency. The
spectra between y/d - -16.0 and -5.3 and y/d - 5.3 and 16.0, and those
spectra located at y/d - 42.7, 37.3 and 40, were representative of the
transition region where both the Strouhal and cable vibration (fcv - 82.5Hz)
frequencies were present. In these regions, the component of the vibration
frequency only contributed significantly to the motion. The spectra
centered around the two antinodes, y/d - -37.3 to -16.0 and y/d - 21.3 to
32, were dominated by the vibration frequency (i.e. , the vortex shedding was
locked-on to the cable vibration). The spanwise shedding in this region was
highly correlated.
It was desired to see what influence the variation in sparuise
vibration amplitude (mode shape) would have on the vortex shedding along the
cable, at Reynolds numbers below and above the lock-on regions. Figures 19-
21 present plots of the spanwise shedding frequencies at various Reynolds
numbers. The results at Reynolds numbers below the lock-on region (Figures
19a, b and 20a) already had been shown to have been influenced by the
vibration (i.e., shorter formation length, stronger vortices, and lower
Strouhal number). The three figures clearly demonstrated that the vortex
shedding frequency (Strouhal number) decreased (by as .much as 15 percent)
with increasing a/d along the cable span. The minimum value of the shedding
47
L•

1!
frequency in each of the figures could be found at the cable antinode, wherethe vibration (amax/d) was the largest. Both Griffin r15,16] and Davies
[101 had shown that the vortex formation length decreased with increasing
a/d, and that the resulting vortex strength increased. In the present
results, the increase in a/d along the span suggested a corresponding
decrease in Lf and an increase in vortex strength. The increase in vortex
strength decreased the Strouhal number along the span.
Figures 20b and 21a,b,c show the results obtained for Reynolds numbers
above the lock-on region. The four figures clearly illustrated the general
amplitude dependent phenomena at these Reynolds numbers. The siiuading
frequency (Strouhal number) increased proportionally with vibration
amplitude, a/d. This was directly opposite the pattern found for Reynolds
numbers belcw the lock-on region. These increases were all small, less than
5 percent. The maximum value of frequency occurred at the antinode, where
the vibration amplitude was the largest (amax/d). The fornmation lengths
were found to be insignificantly affected (Figures 27 to 30) by the
vibration at these Reynolds numbers. The vortex shedding frequencies were
greater than, and not locked-on to, the vibration frequenQ . The vortices
were no longer shed at the position of maximum amplitude, as they were
during synchronization. They were now shed at random positions. The wake
oscillated sinusoidally because of the vibration, and the magnitude of these
oscillations depended on the spanwise location (i.e., vibration amplitude
a/d) along the cable. This combination of increased wake oscillations and
variation of the position at which the vortices were shed with increasing
a/d, probably resulted in the inL..=ased destruction and cancellation of
vorticity in the shed vortices. The accompanying decrease in vortex
strength with increasing a/d then caused the Strouhal number to increase.
Another major objective of the present study was to observe the changes
in the near wake sparwise vortex shedding patterns that were generated by
placing spherical bluff body shapes on the stationary and vibrating cable in
a linear shear flow. Preliminary to any shear flow tests, the Strouhal
number and lock-on regions associated with an individual sphere-cable
combination had to be determined. The mean Strouhal number value of the
48

sphere-cable combination was found to be constant throughout the Reynolds
number range (based on sphere diameter) 6.57 x 10³ < Re < 24.17 x 10³, at a
value St. M 0.296 -_ 0.004. The increased bluntness of the sphere-cable
combination caused the Strouhal number to be less than that associated with
an isolated sphere, for which Sts M 0.37 (Hoerner [241). This value was
significantly higher than those measured by Achenbach [1] and by Pao and Kao
[29], bu t fell well within the data scatter of all the tabulated
measurements.
The frequency boundaries, fssv/fcv, defining the lock-on regions of the
sphere-cable combination are shown in Figure 22. The mwximunm vibration
amplitude, based on sphere diameter, was a/ds - 8.0 percent. The least-
squares linear fit through the data points defining the lower end of the
lock-on region (fssv/fcv < 1.0) was
fssv/fcv M 0.95 (1.0 - 5.22 a/ds)
with r 2 . 0.94. TI-e linear fit through the data points defining the upper
boundary (f /f > 1.0) was
fs sv/fc M 0.96 (1.0 + 4.68 a/ds)
with r2 _ 0.96. Unlike the cable lock-on region (Figure 14), where the
lower lock-on region was substantially smaller than the upper region, the
lower sphere-cable lod:-on region was measurably wider than the upper
region. Also, the total widths of the sphere-cable lock-on regions were
substantially larger than their bare cable counterparts. The data points in
Figure 22 were representative of the lock-on regions centered around
fssv/fcv M 1.0. During the tests, it was observed that the sphere-cable
combination also locked-on to a submultiple (fssV/fcv - 1/2) of thevibration frequency over a wide range. There was a very small frequency
range separating the upper boundary of the lock-on region centered around
fssv/fcv 1 1/2 and that centered around fssv/fcv = 1.0. For large
amplitudes of vibration, one would expect the two regions to merge, thereby
creating a single very wide lock-on region. Because of this interaction
49
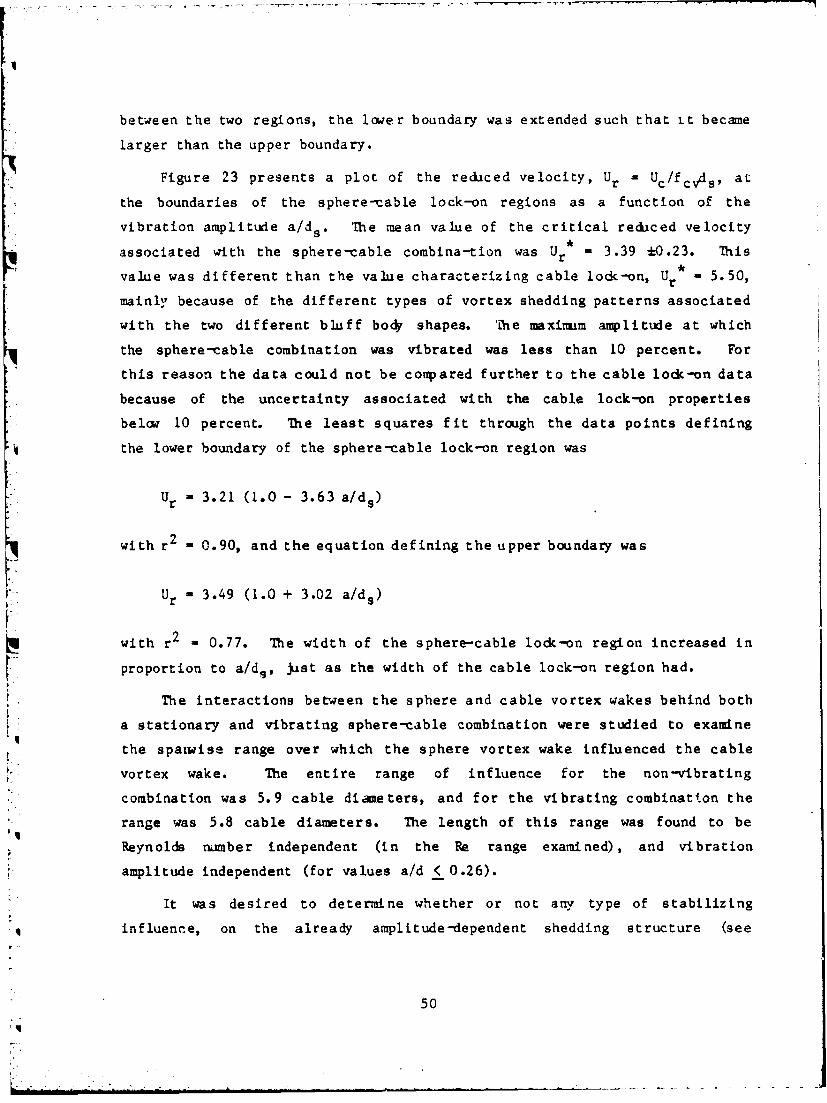
between the two regions, the lower boundary was extended such that it becane
larger than the upper boundary.
Figure 23 presents a plot of the reduced velocity, Ur = U /fcvds, at
the boundaries of the sphere-cable lock-on regions as a function of the
vibration amplitude a/ds. The mean value of the critical reduced velocity
associated with the sphere-cable combina-tion was Ur - 3.39 -0.23. This
value was different than the value characterizing cable lodc-on, Ur M 5.50,
mainly because of the different types of vortex shedding patterns associated
with the two different bluff body shapes. TL'he maximum amplitude at which
the sphere-cable combination was vibrated was less than 10 percent. For
this reason the data could not be coupared further to the cable lock-on data
because of the uncertainty associated with the cable lock-on properties
below 10 percent. The least squares fit through the data points defining
the lower boundary of the sphere-cable lock-on region was
Ur - 3.21 (1.0 - 3.63 a/ds)
with r 2 . 0.90, and the equation defining the upper boundary was
Ur U 3.49 (1.0 + 3.02 a/d 5 )
with r 2 = 0.77. The width of the sphere-cable lock-on region increased in
proportion to a/d9, just as the width of the cable lock-on region had.
The interactions between the sphere and cable vortex wakes behind both
a stationary and vibrating sphere-cable combination were studied to examine
the spatwise range over which the sphere vortex wake influenced the cable
vortex wake. The entire range of influence for the non-vibrating
combination was 5.9 cable diameters, and for the vibrating combinatton the
range was 5.8 cable diameters. The length of this range was found to be
Reynolds number independent (in the Re range examined), and vibration
amplitude independent (for values a/d < 0.26).
It was desired to determine whether or not any type of stabilizing
influence, on the already amplitude-dependent shedding structure (see
50

Figures 19a and 20a), would be generated by placing five spheres at
equidistant locations on the cable span. The five spheres were placed at
y/d - -32.0, -16.0, 0.0, 16.0, 32.0 and the cable was vibrated in the first
mode with an amplitude a/d - 0.242. The cable shedding was not locked-on to
the vibration at Rec U 2.23 x 10³; however the spheres were near to being
locke .n to a submultiple (ss/cv 1 1/3) of the vibration. The spanwise
variation of the Strouhal number along the vibrating cable, with the five
spheres attached, is shown in Figure 24. Compared to Figures 19a and 20a,
where the vortex shedding decreased gradually as a/d increased, the vortex
shedding was generally forced into cells of constant frequency between the
spheres. Except for the end cell which was dominated by the motor wake (y/d
36.0 to 40.0), all the cells had less than a J-.5 Hz variation away from
the mean value. The general pattern of decreasing Strouhal number with
increasing a/d was still preserved within this forced cellular structure.
The presence of the spheres on the cable was able to alter (stabilize the
shedding .nto cells) the spanwise shedding frequerty structure significantly
when compared to the bare cable case.
C. Formation Lengths and Wake Widths
Typical formation length (Lf) and wake width (Lw) traces, obtained in
the near wakes of both the stationary and vibrating cables, are shown inFigure 25. The formation lengths were measured by noting the maximum value
of the filtered rms anemometer signal as the probe was traversed in the
downstream (along wind) direction at the base of the cable. The wake width
values were obtained by measuring the vertical distance between peak values
of the filtered rms signal trace as the hot wire was traversed perpendicular
to the base line, at the corresponding formation length. bMost of the
experimentally measuted values of the formation length, shcn in the next
five figures, were reproducible to within *4.0 percent of an average mean
value, with a few extreme values differing by 8.0 percent. The
reproducibility of the wake width values was slightly better than the
formation lengths at *3.0 percent from the mean value. In each of the next
five figures (26-30), the formation length and wake width values are shown
as functions of Reynolds number, corresponding to the five individual values
51
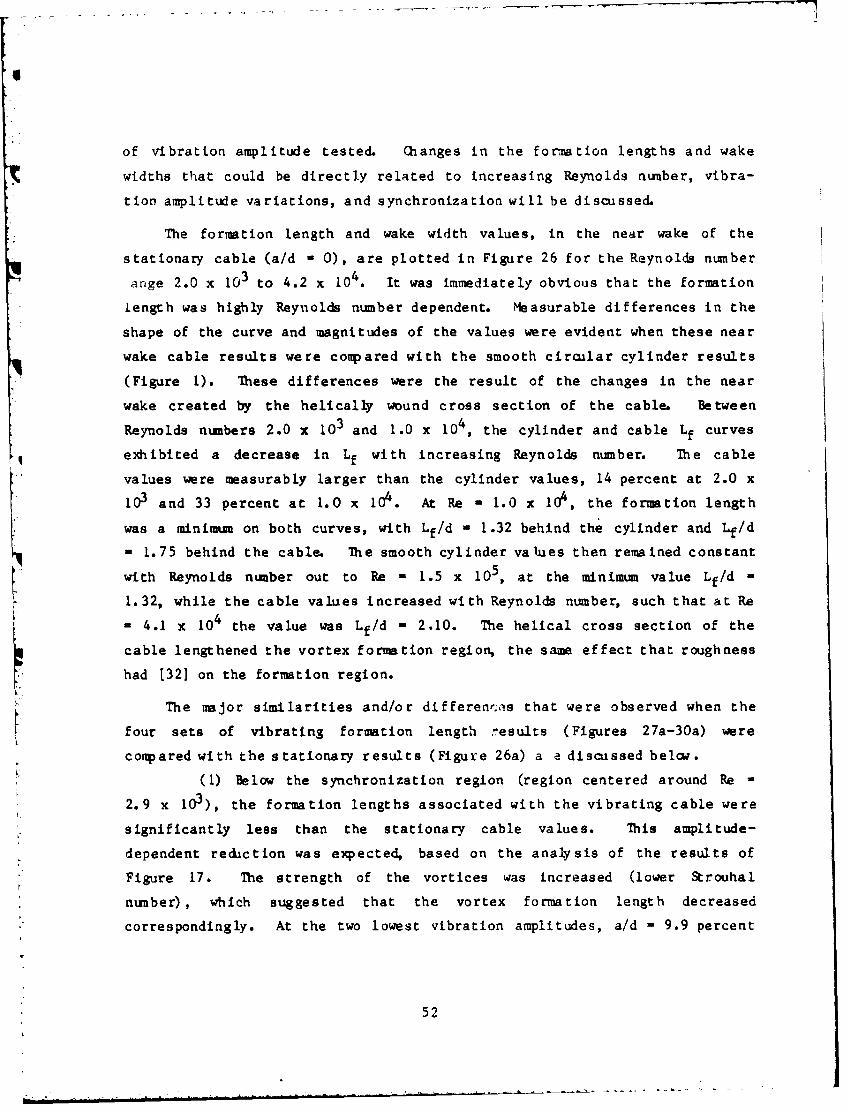
of vibration amplitude tested. Changes in the formation lengths and wake
widths that could be directly related to increasing Reynolds number, vibra-
tion amplitude variations, and synchronization will be discussed.
The formation length and wake width values, in the near wake of the
stationary cable (a/d -0), are plotted in Figure 26 for the Reynolds number
ange 2.0 x 10~ to 4.2 x: 10 It was immediately obvious that the formation
length was highly Reynolds number dependent. Measurable differences in the
shape of the curve and magnitudes of the values were evident when these near
wake cable results were compared with the smooth circular cylinder results
(Figure 1). These differences were the result of the changes in the near
wake created by the helically wound cross section of the cable. Be twe en
Reynolds numbers 2.0 x 10 and 1 .0 x: 104, the cylinder and cable Lf curves
exhiibited a decrease in Lf with increasing Reynolds number. The cable
values were measurably larger than the cylinder values, 14 percent at 2.0 x
103 and 33 percent at 1. 0 x: 104. At Re *1.0 x: 10 the formation length
was a minimum on both curves, with Lf/d -1.32 behind the cylinder and Lf/d
-1.75 behind the cable. The smooth cylinder values then remained constant
with Reynolds number out to Re - 1.5 x 10⁵, at the minimum value Lf/d -
1.32, while the cable values increased with Reynolds number, such that at Re
-4.1 x 10 the value was Lf/d - 2.10. The helical cross section of the
cable lengthened the vortex formation region, the same effect that roughness
had t32] on the formation region.
The major similarities and/or differen,ý,s that were observed when the
four sets of vibrating formation length r~esults (Figures 27a-30a) were
compared with the stationary results (Figure 26a) a a discussed belaw.
(1) Below the synchronization region (region centered around Re
2.9 x 10³), the formation lengths associated with the vibrating cable were
significantly less than the stationary cable values. This amplitude-
dependent reduction was expected, based on the analysis of the results of
Figure 17. The strength of the vortices was increased (lower Strouhal
numnber) , which suggested that the vortex formation length decreased
correspondingly. At the two lowest vibration amplitudes, a/d -9.9 percent
52

and 13.0 percent, the Reynolds number dependent decrea3e of Lf was
preserved, although the vibrating cable values were significantly smaller
than the stationary ones. At the two highest vibration amplitudes, a/d -
17.6 percent and a/d - 25.5 percent, the Reynolds number decrease was
obscured by the larger vibration-induiced changes, which made Lf relatively
constant before the lock-on region. This was also expected, since the
vibration-in.hced Strouhal number was also constant with Reynolds number
(Figure 17, a/d - 24.0 percent) at the higher vibration amplitude.
(2) The Reynolds number around whicb rhe minimum formation length
was found (Re - 1.0 x 10⁴) did not change as a result of the vibration. The
numerical value, Lf/d - 1.70, was also not significantly influenced by the
addition of vibration. The five curves all overlayed upon each other, with
minimal data scatter, for Reynolds numbers greatEr than 1.0 x 10 The
vibration had a minimal influence on the formation lengths in this Reynolds
number region far removed from the lock-on range.
(3) In the Reynolds number range directly above the lock-on region
and extending to the minimum Lf point, the four vibrating cable curves
merged into the stationary curve at Reynolds numbers ranging between 4.0 x
103 (a/d - 9.9 percent) and 6.0 x 10³ (a/d - 25.5 percent). These Reynolds
number values marked the points at which the vibration no longer had any
significant influence or. the vortex formation process above the lock-on
region.
When the four vibrating cable formation length Figures (27a-30a) were
compared a significant synchronization related phenomenon could be
observed. A sudden increase in Lf/d occurred during perfect
synchronization, i.e. in the region centered around fcsv/fcv M 1.0. This
perfect synchronization point occurred at a reduced velocity, Ur 5.50
(Figure 15), and Reynolds number 2.93 x 10³. On the plots, this Reynolds
number marked the center of the sudden increase in Lf/d. Shortly after the
value of Lf/d reached a maximum, the four vibrating curves merged into each
other, as well as merging into the stationary curve. The maximum value
reached by Lf/d was inversely proportional to the amplitude a/d, a result
53

consistent with previous observations where Lf/d decreased with increasing
a/d (15,16,21,221.
Griffin (191 presented a plo, ol baE.e pressure Cpb and wake width Lw/d
variations, as a function of fcv/fcs,ý J:L the synchronization region. These
two properties behaved similarly to -he present Lf/d data in the perfect
synchronization region; i.e., the values were strongly affected during
synchronization and returned to stationary values shortly thereafter. Other
authors have no':ý : ;.ien increase in spanwise correlation of the phase of
the shedding [21j, filuctuating lift and steady drag forces [50] , wake width
[44], and ph3e angle between the cylinder displacement and maximum rms
pressure on that side (50]. In the background section (II.C) the two modes
of synchronized vortex shedding observed by Zdravkovich [50] were
described. The vortices in the upper synchronization range (fcsv/fcv > 1.0)
were shed when the cylinder was near its maximum amplitude on that same sideA of the wake, whereas in the lower synchronization region, the vortices
formed on one side of the cylinder and were shed when the cylinder was close
to its maxinmm amplitude position on the opposite side. The longer
formation length in the upper synchronization region was a direct result of
the increased stability of the shedding in this regior.
The wake widths in the near wake of the stationary cable (Figure 26b)
varied between Lw/d - 0.92 and 1.04, with the mean value Lw/d - 0.98. There
was no observable variation in this mean value with Reynolds number.
Comparing the present helical cable results with Peltzer's smooth circular
cylinder results (Figure 2) revealed no significant difference in the mean
value of Lw/d. Peltzer's values were centered around the mean value Lw/d -
0.97 and also were Reynolds number independent. The helical structure had
no measurable influence on the wake widths. When the vibrating cable wake
width plots (Figures 27b to 30b) were compared to the stationary plot, a
general increase in Lw/d due to the vibration could be observed. However,
due to the considerable amount of scatter in the vibrating cable wake width
data, no other significant conclusions regarding vibration related phenomena
could be drawn.
54
po1

D. Sheared Flow Results
Figures 31 thru 50 present twenty pairs of results dealing with the
spanwise vortex street wake behind the stationary and vibrating cable In a
linear shear flow ( 8 0.0053), with and without attached bluff bodies. The
first figure in each pair contains the poer spectra of the fluctuating hot
wire signal at various equidistant spanwise locations (y/d values) in the
cable wake. The vortex shedding and/or vibration frequencies appear as high
energy peaks in the spectra. The second figure in the pair shows the power
spectra data plotted as a Strouhal number based on the centerline velocity
(StcM f d/Ua ) versus the spanwise position y/d. These Stc vs. y/d plots
are presented to elucidate the sparwise cellular structure in shedding
frequency, if and where it existed. A single closed circle on these plots
represents a aarrow band shedding frequency peak on the power spectra. A
circle connected to a bar represents a high energy narrow band shedding peak
with a lower energy wide band to either side of the peak, and a bar
represents a wide broadbanded peak with no dominant high energy shedding
peak present.
Figures 31 to 38 are first phase results and Figures 39 to 50 contain
the second phase results. The main difference between the two sets of
results was the location of the hot wire probe in the wake. During the
first phase tests, the probe was located farther downstream of, and
vertically higher than, the optimal position that was found (during the
second phase tests) to provide the strongest and clearest measure of the
shedding frequency in the power spectra. Because of this, any fluctuating
cell boundaries were allowed a longer time to inteiact, and the resulting
cellular structure (if it existed) was poorly defined. Normally, the markerbetween two cells of different frequencies would be a large discontinuous
jump in frequency. The apparent gradual decrease in frequency between cells
was a direct result of the fluctuating cell boundaries. Matir and SRansby
(26] pointed out in their results that discontinuous jumps of frequency
between cells disappeared in the time-averaged results because of the
fluctuating cell boundaries. The second phase results were not as
significantly affected by the presence of these fluctuating cell
55

boundaries. k discrete cell of constant shedding frequency in these plots
was indicated by a spanwise y/d range over which the Strouhal number remains
constant.
The power spectra showing the sparwise variation of the vortex shedding
frequency in the near wake of the stationary cable, at a Reynolds number 2.6
x 103, are shown in Figure 31. The corresponding sparwise Strouhal numberplot follows in Figure 32. There was a definite tendency for the vortex
shedding to form into cells along the entire cable span, even though the
discontinuous jump in Strouhal number that should mark the division between
the cells was obscured by the fluctuating cell boundaries. Including the
two end cells, a total of approximately ten cells were present along the
cable span (from y/d - -42.7 to y/dc - 40.0), with each cell separated by a
change in Strouhal number ASt - 0.007. The high velocity cell was centeredt caround Stc a 0.190 and the low velocity cell centered around Stc - 0.1265,
such that the total change across the span was tStc - 0.0635. The average
length of each cell was approximately 9.0 diameters.
The power spectra aloug the span of the vibrating cable, at Rec - 2.6 x
103, are shown in Figure 33. At this Reynolds number, it was expected that
the vortex shedding would lodv-on to the cable vibration over the central
portion of the cable span. The maximum first mode vibration amplitude (at
the node) was a/d - 0.233. A clearly defined sparwise cellular structure in
the shedding frequency was seen in the spectra, even with the compressed
frequency scale. The sparwise power spectra dramatically illustrated the
three distinct flow regimes, associated with cable locking-on, that Ramberg
and Griffin (36] defined. The power spectra in the ranges adjacent to the
ends of the cable (nodes), -42.7 < y/d < -34.7 and 37.3 < y/d < 40.0, were
representative of the flow past a stationary body. In these nodal regions,
as well as in flow about a stationary cable, only the vortex shedding
frequency was present in the power spectra. The power spectra in the areas
between the nodal and locked-on regions, -32.0 < y/d < 5.3 and 29.3 < y/d
< 34.7, illustrated the behavior of the magnitude (strength) of the vortex
shedding and cable vibration frequency peaks in the transition region
between unlocked and synchronized vortex shedding. The growth (or decline)
56

of the vibration peak as the shedding frequency approached (broke away) from
the synchronization range vas clearly demonstrated. In the synchronized
region, centered near the cable antinode -5.0 < y/d < 29.0, the sparwise
power spectra contained a sharp, high energy peak at the synchronization
frequency. The sparwise shedding was highly correlated in this region.
When the spanwise Strouhal number plot of the power spectra in the wake
of the vibrating cable at Rec - 2.6 x 10³ (Figure 34), was cotpared with the
stationary cable Strouhal plot (Figure 32), the stabilizing effect that thesynchronized vibration had on the cellular structure in general was
noticed. Stansby [44] and Woo et al [48] also noted this stabilization.
The lodced-on region was 34 diameters long, and tne average cell length of
the unforced cells was 13.5 diameters, significantly greater than the
average length of 9.0 diameters found along the non-vibrating cable span.
The high velocity cell was centered around the Strouhal number Stc - 0.188
and the low velocity cell centered around Stc - 0.129. The total change in
Strouhal number across the span was &Stc - 0.059, 7.1 percent less than the
total change across the stationary cable (Figure 32).
The Renolds number was increased to 3.72 x 10³, and the correspondingpower spectra associated with the stationary cable span were shown in Figure
35. It was expected that the cell lengths at this higher Reynolds numberwould be slightly shorter than those found at the lower Reynolds number (2.6
x 103), because of the shorter formation length. Although some tendency
towards a cellular structure was seen in the spanwise Strouhal number plot(Figure 36), no conclusive observations regarding average cell lengths,
number of cells, or average change in Strouhal number between cells, could
be drawn. The less than optimal probe position and fluctuating cell
boundaries combined to obscure the true near wake shedding pattern. There
could be at least 12 cells present along the span, with the average
separation between the cells &Stc I0.006. The high velocity cell wascentered around Stc M 0.213 while the low velocity cell occurred at the
Stc - 0.146, so that the total change in Strouhal number across the span
57
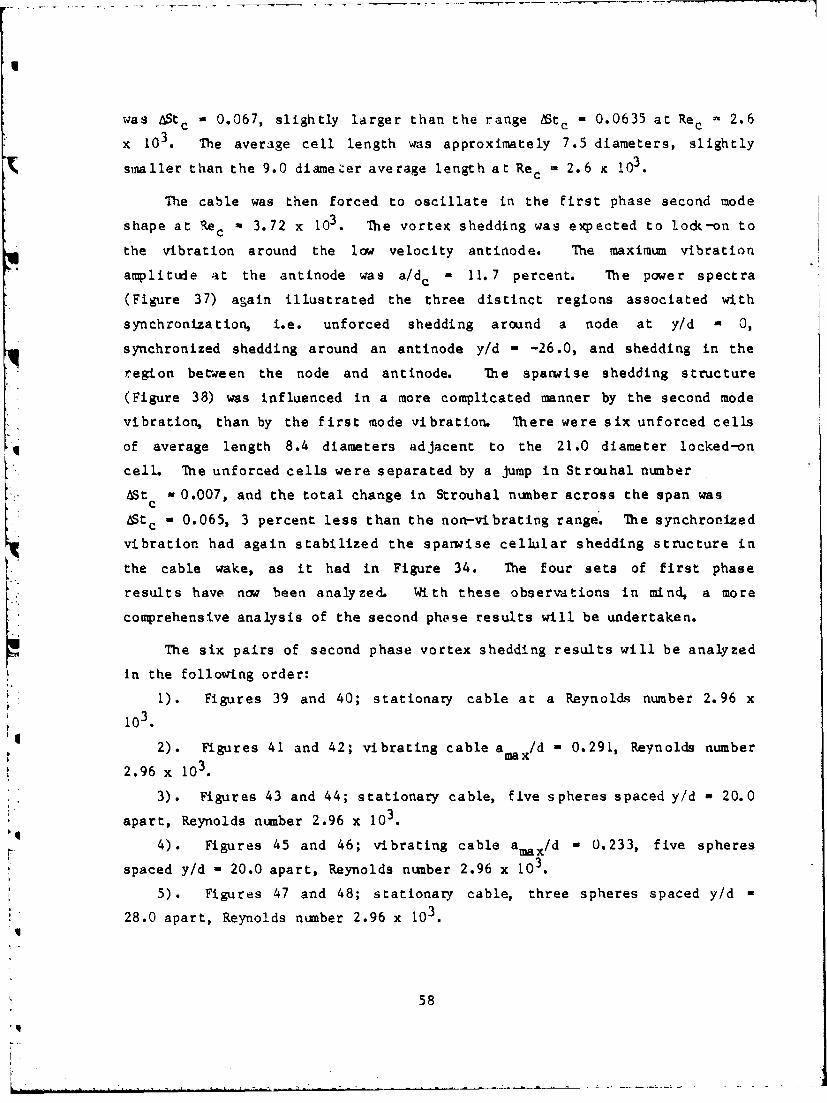
was AStc 0.067, slightly larger than the range AStc W 0.0635 at Rec n 2.6
x 103. The average cell length was approximately 7.5 diameters, slightly
smaller than the 9.0 diameter average length at Re. - 2.6 x 10³.
The cable was then forced to oscillate in the first phase second mode
shape at Rec a 3.72 x 10³. The vortex shedding was expected to lodk-on to
the vibration around the low velocity antinode. The maximum vibration
amplitude at the antinode was a/dc M 11.7 percent. The power spectra
(Figure 37) again illustrated the three distinct regions associated with
synchronization, i.e. unforced shedding around a node at y/d - 0,
synchronized shedding around an antinode y/d - -26.0, and shedding in the
region between the node and antinode. The sparwise shedding structure
(Figure 38) was influenced in a more complicated manner by the second mode
Svibration, than by the first mode vibration. There were six unforced cells
of average length 8.4 diameters adjacent to the 21.0 diameter locked-on
cell. The unforced cells were separated by a jump in Strouhal number
&St - 0.007, and the total change in Strouhal number across the span wasc
AsStc - 0.065, 3 percent less than the non-vibrating range. The synchronized
vibration had again stabilized the sparwise cellular shedding structure in
the cable wake, as it had in Figure 34. The four sets of first phase
results have now been analyzed. With these observations in mind, a more
comprehensive analysis of the second phase results will be undertaken.
The six pairs of second phase vortex shedding results will be analyzed
in the following order:
1). Figures 39 and 40; stationary cable at a Reynolds number 2.96 x
103.
2). Figures 41 and 42; vibrating cable am x/d - 0.291, Reynolds number
2.96 x 10.
3). Figures 43 and 44; stationary cable, five spheres spaced y/d - 20.0
apart, Reynolds number 2.96 x 10³.
4). Figures 45 and 46; vibrating cable amax/d - 0.233, five spheres
spaced y/d - 20.0 apart, Reynolds number 2.96 x 10³.
5). Figures 47 and 48; stationary cable, three spheres spaced y/d
28.0 apart, Reynolds number 2.96 x 10³.
58
'U
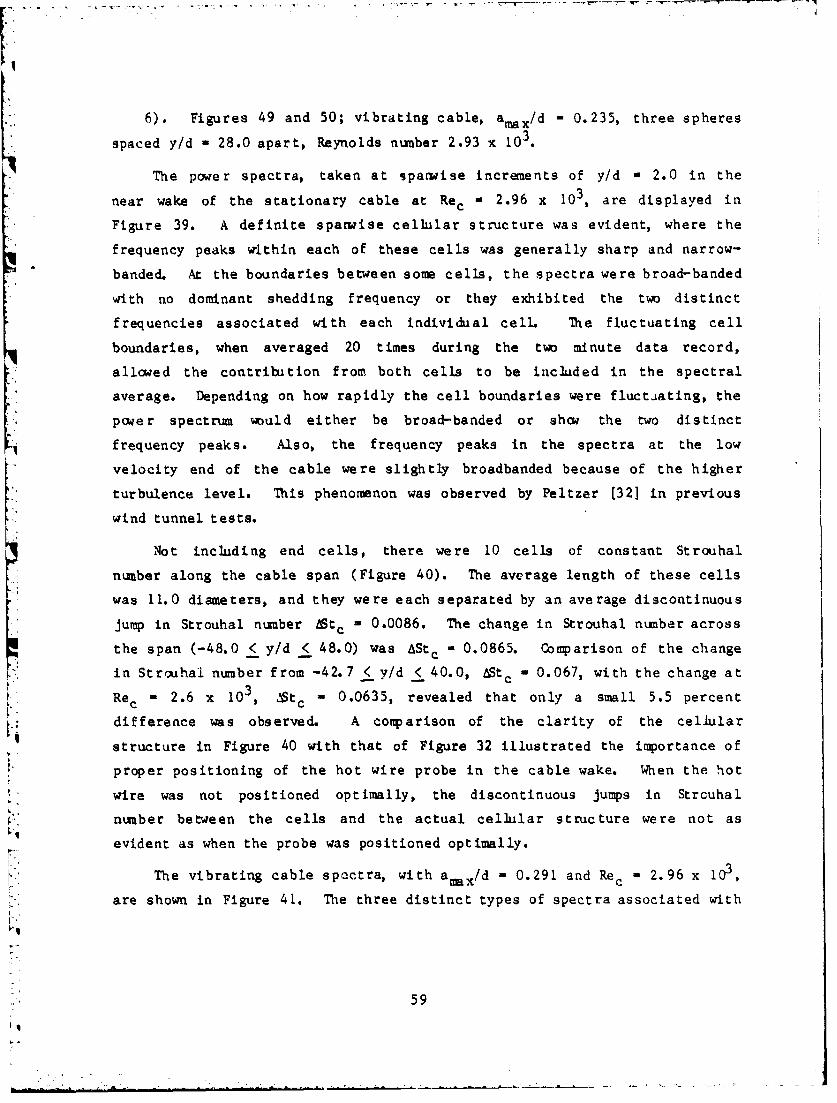
6). Figures 49 and 50; vibrating cable, amax/d - 0.235, three spheres
spaced y/d = 28.0 apart, Reynolds number 2.93 x 10³ .
The power spectra, taken at sparwise increments of y/d - 2.0 in the
near wake of the stationary cable at Rec a 2.96 x 10³, are displayed in
Figure 39. A definite sparwise cellular structure was evident, where the
frequency peaks vIthin each of these cells was generally sharp and narrow-
S"banded. At the boundaries between some cells, the spectra were broad-banded
with no dominant shedding frequency or they exhibited the two distinct
frequencies associated with each individual cell. The fluctuating cell
boundaries, when averaged 20 times during the two minute data record,
allowed the contribution from both cells to be included in the spectral
average. Depending on how rapidly the cell boundaries were fluctuating, the
power spectrum would either be broad-banded or show the two distinct
frequency peaks. Also, the frequency peaks in the spectra at the low
velocity end of the cable were slightly broadbanded because of the higher
turbulence level. This phenomenon was observed by Peltzer [321 in previous
wind tunnel tests.
Not including end cells, there were 10 cells of constant Strouhal
number along the cable span (Figure 40). The average length of these cells
was 11.0 diameters, and they were each separated by an average discontinuous
jump in Strouhal number Stc W 0.0086. The change in Strouhal number across
the span (-48.0 < y/d < 48.0) was AStc - 0.0865. Comparison of the change
in Strauhal number from -42.7 < y/d < 40.0, &Stc a 0.067, with the change at
Rec - 2.6 x 10³, $tc - 0.0635, revealed that only a small 5.5 percent
difference was observed. A comparison of the clarity of the cellular
structure in Figure 40 with that of Figure 32 illustrated the importance of
proper positioning of the hot wire probe in the cable wake. When the hot
wire was not positioned optimally, the discontinuous jumps in Strouhal
number between the cells and the actual cellular structure were not as
evident as when the probe was positioned optimally.
The vibrating cable spectra, with am x/d - 0.291 and Rec 2.96 x 10³
are shown in Figure 41. The three distinct types of spectra associated with
59
the locking-on process were present in the figure. The shedding was locked-
on to the vibration over the central portion of the cable span (Figure 42),
from -14.0 < y/d < 29.5. The locked-on cell was 43.5 diameters long. In
Figure 34 (first phase test, amax/d - 0.233, Rec W 2.6 x 10³), the locked-on
cell was 34 diameters long. The larger locked-on region in the present
figure was expected because the maximum vibration amplitude was larger. The
average length of the two cells, not adjacent to the end plate or motor, was
14.0 diameters, whereas the average length in Figure 34 was a comparable
13.5 diameters. The shedding was so well stabilized by the vibration that
no fluctuating boundary effects were present in the figures. All the cell
boundaries were marked by discontinuous jumps in Strouhal number. The
change in Strouhal number across the cable span, -48.0 < y/d < 40.0,
was AStc M 0.775 (from 0.2060 to 0.1285).
The sparwise power spectra, showing the vortex sh.-. ing frequency
variation along the stationary cable with five spheres at spanwise locations
y/d - -40.0, -20.0, 0.0, 20.0, 40.0, are shown in Figure 43. The flow
Reynolds number was 2.96 x 10 The shedding frequency of the spheres
increased proportionally to the velocity across the span. Between the
sphere shedding peaks, the cable vortex shedding frequency peaks were
7 generally more broad-banded than the narrcw-banded high energy peaks
characteristic of the bare stationary cable (Figure 39). The highly three-
dimensional turbulent wake behind the spheres broadened the shedding peaks
with the increased turbulent energy it imparted to the cable wake. The
three-dimensional sphere wakes totally disrupted the cellular shedding
pattern normally present in the bare cable wake. Figure 44 shows that the
presence of the spheres generally forced the cable shedding frequencies to
form into discrete cells in each of the spanwise areas between the
spheres. The only slight deviation away from this forced single cellular
structure was in the cell centered around y/d - -10.0. The spectra at y/d -
-12.0, -14.0 and -16.0 were very broad-banded, with the center ot the band
at a slightly lower frequency than the rest of the cell. Including the two
end cells, six vortex shedding frequency cells with an average length of
14.0 diameters, separated by five sphere shedding cells (Stc W f d/UJ withc ss c
60
b

an average length of 6.0 diameters, were located along the entire cable span
(-48.0 < y/d < 48.0). The arerage discontinuous change in Strouhal number
between each of tie cabl" shedding frequency cells was 6Stc = 0.0136, a much
larger change than AStc 0.0086 between the bare stationary cable cells.
The cable with the five spherical bluff body shapes attached 7as then
vibrated in the first mode (amax/d = 0.233). The spanwise power spectra,
corresponding to flow at Rec = 2.96 x 10, are shown in Figure 45. The
cable vortex shedding frequency power spectra in the regions separated by
the spheres were again slightly broad-banded. All three types of spectra,
characterizing the lock-on process associated with a flexible cable, were
represented in the figure. In the locked-on region around y/d - 0.0, the
single high energy narrow-band peak characteristic of syuchronous motion was
present. When the frequency data were plotted in Figure 46, it was
immediately apparent that the three central spheres (y/d = -20.0, 0.0, 20.0)
locked-on to a subnmltiple of the cable vibration, fssv/fcv = 1/2. The
presence of the spheres on the vibrating cable (amax/d = 0.233) had a
significant effect on the length of the lock-on region. The locked-on
region extended from -24.0 < y/d < 29 (53 diameters) compared to -14.0 < y/d
< 29.5 (43.5 diameters) on the bare vibrating cable with amax/d - 0.291, and
-5.0 < y/d < 29 (34 diameters) on the bare vibrating cable with amax/d -
0.233. The extension of the length of this locked-on region by as much as
56 percent, was very significant because it meant that the damaging
undesirable effects that accoipany synchronization (i.e. large amplitude
oscillations, increased drag and fluctuating lift forces, highly correlated
shedding, etc.) would extend over a longer portion of the cable span. The
cable vortex shedding frequency was constant between the spheres at y/d
40.0 and 20.0. Between the spheres at y/d = -20.0 and -40.0, the shedding
frequency broke into two short cells separated by a slight decrease in
Strouhal number. The change in Strouhal number across the span (-48.0 < y/d
< 36.0) of the v-ibrating cable with five spheres was AStc - 0.0685 (0.1970
to 0.1285), compared to t¢tc 0.069 (0.1950 to 0.1260) across the
stationary cable with five spheres, AStc 0.074 (0.2015 to 0.1275) across
61
IJ
the bare vibrating cable and AStc 0.0775 (0.2060 to 0.1285) across the
stationary cable.
The number of the spheres present on the cable was then reciaced to
three, and the spacing between them increased to 28.0 diameters. The
resulting spanwise power spectra, corresponding to flow past the stationary
cable at Rec a 2.96 x 10³, are shown in Figure 47. Those cable shedding
frequency peaks not directly in the regions adjacent to the '-pheres were
narrow-banded like those associated with the bare stationary cable frequency
peaks. The frequency peaks in the regions adjacent to the spheres were
again broad-banded, just as they were in Figure 43. The three-dimensional
turbulent wakes of the spheres were no longer able to exert influence over
the ent' :e spanwise distance between the spheres. The cable vortex shedding
frequencies were not forced into discrete cells between the spheres that
were spaced 28.0 diameters apart, as they had been when the spacing was 20.0
diameters. At the shear level 8 0.0053, 20.0 diameters was the maximum
spacing that forced the cable shedding frequencies between the spheres into
discrete cells. Generally, the maximum spacing that wouid force the vortex
shedding frequency between these discrete bluff body shapes into
identifiable cells of constant frequency should depend on the shear level a,the geometry of the discrete bluff body shape and the body it is mounted on,
the flow Reynolds number, the vortex formation length (stability of the
cells), and the stability of the flow itself (turbulence, upstream
disturbances, etc.).
The sparwise Strouhal number variation across the stationary cable,
with the three aL ached spheres, is illustrated in Figure 48. The influence
that the presence of the spheres had on the length and position of the
spanwise cells of cable shedding frequency was seen when these results were
compared to the stationary bare cable results (Figure 40). There were seven
or eight cells of constant cable shedding frequency, which ranged in length
from 2.0 to 18.0 diameters, plus the three cells which represented the
sphere shedding frequency, across the cable span (-48.0 < y/d < 48.0). The
broad-banded ranges between a few of the cells could be attributed to a
combination of fluctuating cell boundaries and three-dimensional sphere wake
62
influences. The change in Strouhal number across the span was tc - 0.0795
(0.2120 to 0.1325), compared to AStc M 0.069 (0.1950 to 0.126) across the
span of the cable with five spheres, and 6Stc - 0.0865 (0.2150 to 0.1285)
across the stationary bare cable. The average discontinuous change in
Strouhal number between the vortex shedding cells on the cable with three
spheres was &Stc 0 0.0102, as compared to eStc = 0.0136 between the cells on
the cable with five spheres and Stc = 0.0086 between the cells on the bare
cable. Generally, when the spheres were spaced at the maximum value which
forced the vortices to be shed in discrete cells of constant frequency
between them, the longest cells were present along the cable span with the
largest discontinuous change in Strouhal number between them, and the total
change in Strouhal number across the span was a minimum. As the spacing
between the spheres was increased, the number of the cells increased while
the average length of, and discontinuous spacing between, then decreased,
and the total change in Strouhal number increased. The disrribution of
vortex shedding would eventually become equal to the stationary bare cable
distribution.
For the sixth and final test in this series, the cable with the three
spheres was vibrated (amax/d - 0.235) in the first mode at a Reynolds number
of 2.93 x 10. The sparuise power spectra are shown in Figure 49. The
vortex shedding from the cable was locked-on to the vibration over the
entire spanwise region bounded by the spheres, -31.0 < y/d < 30.0. The
spheres, located at y/d - 0.0 and 1 28.0, were locked-on to a submultiple of
the cable vibration frequency, fssv/fcv = 1/2. Only the spanwise regions
outside the two end spheres exhibited unforced cable vortex shedding. The
length of the locked-on region, shown in Figure 50, was 61.0 diameters.
This length is 15 percent greater than the 53.0 diameter locked-on region in
the five sphere test (Figure 46), 40 percent larger than the locxed-on range
which corresponded to the bare vibrating cable with amax/d = 0.291, and 79
percent larger than the 34.0 diameter range found on the bare cable which
was vibrated at a comparable amplitude a x/d - 0.233. The spanwise
distance between the spheres had a very significant effect on the length of
the locked-on region. The total change in Strouha'. number across the span
63
*1

(-48.0 < y/d < 40.0) was &Stc - 0.0705, compared to 6Stc 0.0685 across the
vibrating cable with five spheres, and AStc = 0.074 along the bare vibrating
cable and bStc M 0.0775 on the bare stationary cable. Similarly to the non-
vibrating results, as the spacing between the spheres was increased, the
total change in Strouhal number across the span increased.
V 1. SUM MARY
A. Findings and Conclusions
There were many significant results discussed in the previous
section. Some corroborated previously established conclusions pertaining to
stationary and vibrating circular cross section cylinders and flexible
cables in uniform or sheared flow, while others had been documented for the
first time. This entire study was unique in that no previous authors had
studied the near wake of a stationary or vibrating cable, with attached
discrete bluff bodies, in any flow situation. In addition, no studies of
near wake properties of helically wound cables had been undertaken. A
summary of the major results dealing with the individual and combined
effects of vibration, shear, and bluff body shapes on the vortex shedding in
the near wake of a marine cable is as follows:1) The mean Strouhal number of the non-vibrating cable was constant
throughout the Reynolds number range 2.0 x 10³ < Re < 4.2 x 10⁴ at the value
St - 0.192.
2) Locked-on vortex shedding in the near wake of the forced
vibrating marine cable behaved similarly to that exhibited in the near walke
of a circular cross section cable undergoing natural synchronization. The
frequency range over which the vortex shedding locked-on to the cable
vibration increased proportionally with the amplitude of vibration. The
upper locked-on region (fcsv/fcv > 1.0) was significantly larger than the
lower region.
3) Perfect synchronization occurred when the critical reduced
velocity was U = 5.50. At the lower boundary of the lock-on region, ther
vortex shedding locked-on to the cable vibration at a constant reýJced
velocity which was independent of vibration amplitude a/d. The reduced
64
velocity values that defined the upper boundary of the locked-on re'ýion
increased linearly with the vibration amplitude a/d.
4) At the lower boundary of the locked-on region, the Strouhal
numbers and formation lengths varied inversely with the vibration amplitude
a/d, while the vortex strengths varied in direct proportion to a/d. At the
upper boundary the vortex strengths, Strouhal numbers, and formation lengths
in the wake of the vibrating cable were virtually amplitude independent and
nearly equaled those values measured in the wake of the non-vibrating marine
cable.
5) The three distinct flow regimes (flow near a cable node,
antinode and in the region between the two) that were present when the
vortex shedding and cable vibration frequencies interacted during lock-on,
were clearly defined by the spanwise power spectra variations.
6) The mean Strouhal number of the sphere-cable combination in the
sphere Reynolds number range 6.5 x 10³ < Re* < 2.4 x 10⁴ was St. = 0.296.
7) The width of the lock-on region for the sphere-cable combination
was significantly larger than the lock-on region for a bare cable. The
upper and loer boundaries of the sphere-cable lock-on region increased
linearly with the vibration amplitude a/d.
8) The helical cross section of the cable lengthened the vortex
formation region and changed the Reynolds number dependent properties of Lf
when conpared to circular cross section cable values and properties.
10) A sudden increase in the vortex formation length occurred
during perfecL synchronization (fcsv/fcv - 1.0, U = 5.50). Shortly afterr
the end of synchronization the Lf values returned to stationary values.
Other authors had found that the base pressure, wake width, spanwise vortex
shedding phase correlation, and fluctuating lift and steady drag were also
strongly influenced during perfect synchronization and returned to
stationary values shortly thereafter.
11) A small amount of linear shear in the upstream velocity profile
initiated a strong cellular vortex shedding structure in the wake of the
bare cable at the Reynolds numbers considered.
65

-. . . . ..- - - . . . - - - - - - - -
12) The length of the locked-on region in sheared flow was
vibration amplitude dependent.
13) The sparwiise vortex shedding cellular structure was
significantly stabilized by the vibration, and the unlocked cells on the
vibrating cable were longer than the unforced stationary cable cells.
14) When the spherical bluff body shapes were added to the cable,
their three-dimensional wakes significantly altered the sparwise shedding
pattern normally present in the bare cable wake. A maximun separation
distance (y/d - 20.0) was observed that would force the vortex shedding into
discrete cells of constant frequency between the spheres.
15) The presence of the spheres along the vibrating cable snan
measurably increased the length of the locked-on region. The amou.:t of
increase was dependent upon the spacing between the spheres. This finding
was significant because it meant that the undesirable effects that accompany
synchronization were extended over a longer portion of the cable span.
B. Recommendations for Further Study
1) Measuring the width of the lock-on region as a function of
vibration amplitudes greater than a/d - 0.322 in the wake of the cable and
sphere-cable combination would significantly extend the present study.
2) The dependence of the length and stability of spanwise cells of
constant shedding frequency in a sheared flow on the length of the vortex
formation region needs to be thoroughly studied. It is hoped tnat this type
of study would help explain why there i-re or are not discrete sparw.ise cells
at various Reynolds numbers, and also resolve some of the disagreements in
the literature.
3) The discrete bluff body shapes (spheces) used in the present
tests were considered massless. Adding variable masses to the bluff bodies
and investigating the effects of the added mass on the sparwise lock-on
regions and cellular structure would begin to realistically simulate full-
scale physical situations. The present results could be combined with those
of Vandiver and Griffin [46] to provide a basis for modifying the NCEL-
developed computer code NATFREQ which was developed to calculate the natural
66
frequencies and mode shapes of taut marine cables with large numbers of
attached masses.
4) Analysis of the general dependence of the length and stability
of forced and unforced spanwise vortex shedding cells on the attached bluff
b o dr and cable geometries, flow Reynolds number, vortex strength and
* formation length, and the stability of the incident flow would provide the
designer with a clearer understanding of the dynamic and physical properties
associated with flow around cables with bluff body shapes attached.
67

References
1. Achenbach, E., "Vortex Shedding from Spheres", JFM, Vol. 62, Part 2,1974, pp. 209-221.
2. Angrilli, F. and Cossalter, V., "Transverse oscillations of a verticalpile in waves", ASME Journal of Fluids Engineering, Vol. 104, No. 1,Mar. 1982, pp. 46-53
3. Barnett, K.M. and Cermak, J.E., "Turbulence induced changes in vortexshedding from a circular cylinder", NTIS report AD-775-885, Jan. 1974.
4. Bendat, J.S. and Piersol, A.G., Random Data: Analysis and MeasurementProcedures, Wiley-Interscience, New York, 1971.
5. Berland, G.D., "A guided tour of the fast Fourier transform", IEEESpectrum, Jul. 1969.
6. Blevins, R.D. and Burton, T.E., "Fluid forces induced by vortexshedding", ASME Publication 75-FE-10, 1975.
7. Bloor,M.S., "The transition to turbulence in the wake of a circularcylinder", JFM, Vol. 19, 1964, pp. 290-303.
8. Bloor, M.S.and Gerrard, J.H., "Measurements on turbulent vortices in acylinder wake", Royal Society of London Proceedings, Vol. 294, 1966, pp.319-342.
9. Davies, M.E., "A comparison of the wake structure of a stationary andoscillating bluff body, using a conditional averaging technique", JFM,Vol. 75, Part 2, 1976, pp. 209-231.
10. Davies, M.E., "The effects of turbulent shear flow on the criticalReynolds number of a circular cylinder", National Physics Laboratory
! (U.K.) NPL Report Mar Sci R 151, Jan. 1976.
11. Every, M.J., King, R. and Griffin, O.M., "Hydrodynamic loads on flexiblemarine structures due to vortex shedding", ASME Publication 81-WA/FE-24,Nov. 1981.
12. Fischer, J.F., Jones, W.T. and King, R., "Current induced oscillationsof Cognac piles during installation - prediction and measurement",Practical Experiences with flow-Induced Vibrations, E. Naudascher and D.Rockwell (eds.). Springer: Berlin, 1980, pp. 570-581.
13. Gerrard, J.H., "The three-dimensional structure of the wake of acircular cylinder", JFN, Vol. 25, Part 1, 1966, pp. 143-164.
q
L 68
O'l

14. Gerrard, J.H., "The mechanics of the formation region of vortices behindbluff bodies", JFM, Vol. 25, Part 2, 1966, pp. 401-413.
15. Griffin, O.M., "The unsteady wake of an oscillating cylinder at lowReynolds numbers", ASSME Journal of Applied Mechanics, paper no.71-APM-33, Dec. 1971, pp. 729-73o.
16. Griffin, O.M., "Flow near self-excited and forced vibrating circularcylinders", ASME Journal of Engineering for Industr.Z, Vol. 94, May 1972,pp. 539-548.
17. Griffin, O.M., "A universal Strouhal number for the 'locking-on' ofvortex shedding to the vibrations of bluff cylinders", JFM, Vol. 85.Part 3, 1978, pp. 591-606.
18. Griffin, O.M., "Vortex shedding from stationary and vibrating bluffbodies in a shear flow", NRL Memorandum Report 4287, Aug. 1980.
19. Griffin, O.M., "Universal similarity in the wakes of stationary andvibrating bluff structures", ASME Journal of Fluids Engineering, Vol.103, Mar. 1981, pp. 52-58.
20. Griffin, O.M., Ramberg, S.E., Skop, R.A., Meggitt, D.J. and Sergev,S.S., "The strumming vibrations of marine cables: State of the art",Naval Civil Engineering Laboratory Technical Note, TN no. N-1608,May 1981.
21. Griffin, O.M. and Ramberg, S.E., "The vortex-street wakes of vibratingcylinders", JFM, Vol. 66, Part 3, 1974, pp. 553-576.
22. Griffin, O.M. and Ramberg, S.E., "On vortex strength and drag in bluffbody wakes", JFM, Vol 69, Part 4, 1975, pp. 721-728.
23. Griffin, O.M. and Votaw, C.W., "The vortex street in the wake of avibrating cylinder", JFM Vol. 51, Part 1, 1972, pp. 31-48.
24. Hoerner, S.F., Fluid Dynamic Drag, Hoerner Fluid Dynamics, New Jersey,1965.
25. Koopmann, G.H., "The vortex wakes of vibrating cylinders at low Reynoldsnumbers", JFM, Vol. 28, Part 3, 1967, pp. 501-512.
26. Mair. W.A. and Stansby, P.K., "Vortex wakes of bluff cylinders in ashear flow", SIAM Journal of Applied Mathematics, Vol. 28, 1975,pp. 519-540.
27. Maull, D.J. and Young, R.A., "Vortex shedding from bluff bodies in ashear flow," JFM, Vol. 60, 1973, Part 2, pp. 401-409.
69

II
28. Newland, D.E., An Introduction to Random Vib"ations and SpectralAnalysis, Longman Group Limited, London, 1975.
29. Pao, H.P. and Kao, T.W., "Vortex structure in the wake of a sphere",Physics of Fluid, Vol. 20. No. 2, 1977, pp. 187-191.
30. Parkison, G.V., "Aspects of the aeroelastic behavior of bluffcylinders", Published by Engineering Institute of Canada, Montreal,Canada, 1961.
31. Peltzer, R.D. and Rooney, D.M., "Wake characteristics of high aspectratio cylinders in subcritical spanwise sheared flows", ASME Publication81-WA/FE-1O, Nov. 1981.
32. Peltzer, R.D., "The effect of upstream shear and surface roughness onthe vortex shedding patterns and pressure distributions aroung acircular cylinder in transitional Reynolds number flows", M.S. Thesis,VPI&SU, Apr. 1980, 176 pp.
33. Physitech Inc., Technical Instruction Manual for the Model 440 AutoCollimator, 1968, 43 pp.
34. Ramberg, S.E., "The influence of yaw angle upon the vortex wakes ofstationary and vibrating cylinders", NRL Memorandum Report 3822, Aug.1978, 114 pp.
35. Ramberg, S.E. and Griffin, O.M., "Vortex formation in the wake of avibrating, flexible cable", ASME Journal of Fluids Engineering, Dec.1974, pp. 317-322.
36. Ramberg, S.E. and Griffin, O.M., "The effects of vortex coherence,spacing and circulation on the flow-induced forces on vibrating cablesand bluff structures", NRL Report 7945, Jan. 1976, 32 pp.
37. Ramberg, S.E. and Griffin, O.M., "Velocity correlation and vortexspacing in the wake of a vibrating cable", ASME Jouranl of FluidsEngineering, Vol. 98, Mar. 1976, pp. 10-18.
38. Rooney, D.M. and Peltzer, R.D., "Pressure and vortex shedding patternsaround a low aspect ratio cylinder in a sheared flow at transitionalReynolds numbers," A3ME Journal of Fluids Engineering, Mar. 1981, pp.88-96.
39. Rooney, D.M. and Peltzer, R.D., "The effects of roughness and shear onvortex shedding cell lengths behind a circular cylinder", ASME Journalof Fluids Engineering, Vol. 104, No. 1, Mar. 1982, pp. 72-80.
40. Roshko, A., "On the wake and drag of bluff bodies", Journal ofAeronautical Sciences, Vol. 22, 1955, pp. 124-132.
70
41. Sarpkaya, T., "Vortex-induced oscillations; A selective review", ASMEJournal of Applied Mechanics, Vol. 46, Jun. 1979, pp. 241-258.
42. Sarpkaya, T. and Shoaff, R.L., "A discrete-vortex analysis of flow aboutstationary and transversely oscillating circular cylinders", NavalPostgraduate School Report NPS-69SL79011, Jan. 1979, 166 pp.
43. Schaefer, J.W. and Eskinazi, S., "An analysis of the vortex streetgeaterated in a viscous fluid", JFM, Vol. 6, 1959, pp. 241-260.
44. Stansby, P.K., "The locking-on of vortex shedding due to the crossstream vibration of circular cylinders in uniform and shear flows", JFM,Vol. 74, Part 4, 1976, pp. 641-665.
45. Sullerey, R.K., Gupta, A.K. and Moorthy, C.S., "Similarity in theturbulent near wake of bluff bodies", AIAA Journal, Nov. 1975, pp. 1425-1429.
46. Vandiver, J. K. and Griffin, 0. M., "Measurements of the Vortex-ExcitedStrumming Vibrations of Marine Cables", Ocean Structural DynamicsSymposium '82 Preprints, Oregon State University, to appear, September1982.
47. Walker, S., "Helical strake kit" to reduce flow-induced vibration of
single pile aids to navigation," Engineers Digest, 1980, pp. 22-25.
48. Woo, H.G.C., Cermak, J.E. and Peterka, J.A., "Experiments on vortexshedding from stationary and oscillating cables in a linear shear flow,"Final report on contract N68305-78-C-0055 for the Naval Civil
Engineering Laboratory, Colorado State University, Jul. 1981, 223 pp.
49. Wootton, L.R., Warner, M.H., Sainsbury, R.N. and Cooper, D.H.,"Oscillation of piles in marine structures," CIRIA Technical Note 41,Aug. 1972.
50. Zdravkovich, M.M., "Modification of vortex shedding in thesynchronization range," ASME paper 81-WA/FE-25, Nov. 1981, 8 pp.
71
r.I
Appendix A
Figures
72
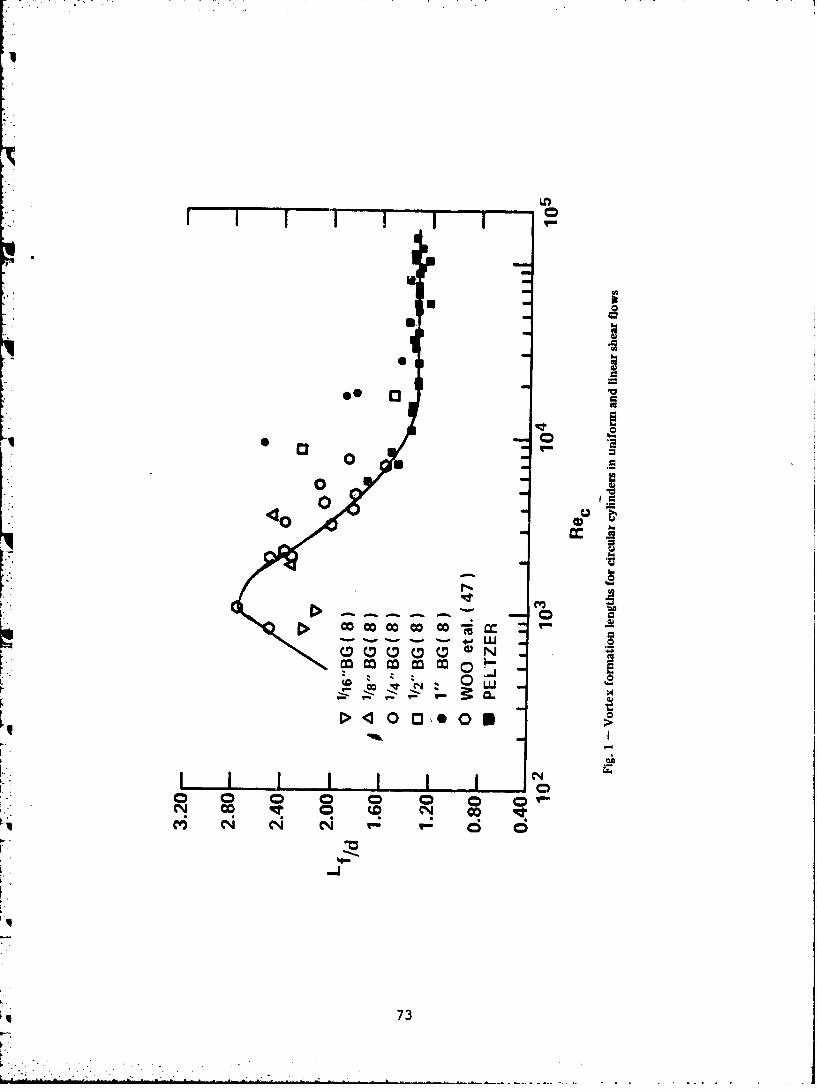
-I
LOl
I -I
020 0E
co co c
0 .
KIJillI I .2
C- 0 0 a 0c.2
73

1L
LA.
CIR
K7

z2
U CC,. z
C., A
w0 UTMw0 0 0 0 0 0 :
-co
0. u..M U.
DV
CL -.z
14 Cl
C.h
m 0.
0
75

-JJ
wX _
CL ,,
- UU
0 ý0LL2
LA-J
LLI-
*1 7r6

NU 00 GO0
C.) 0
LU 0
C3~ 00N0 0A00_
000
0 -
0e00oc
0 0
77(
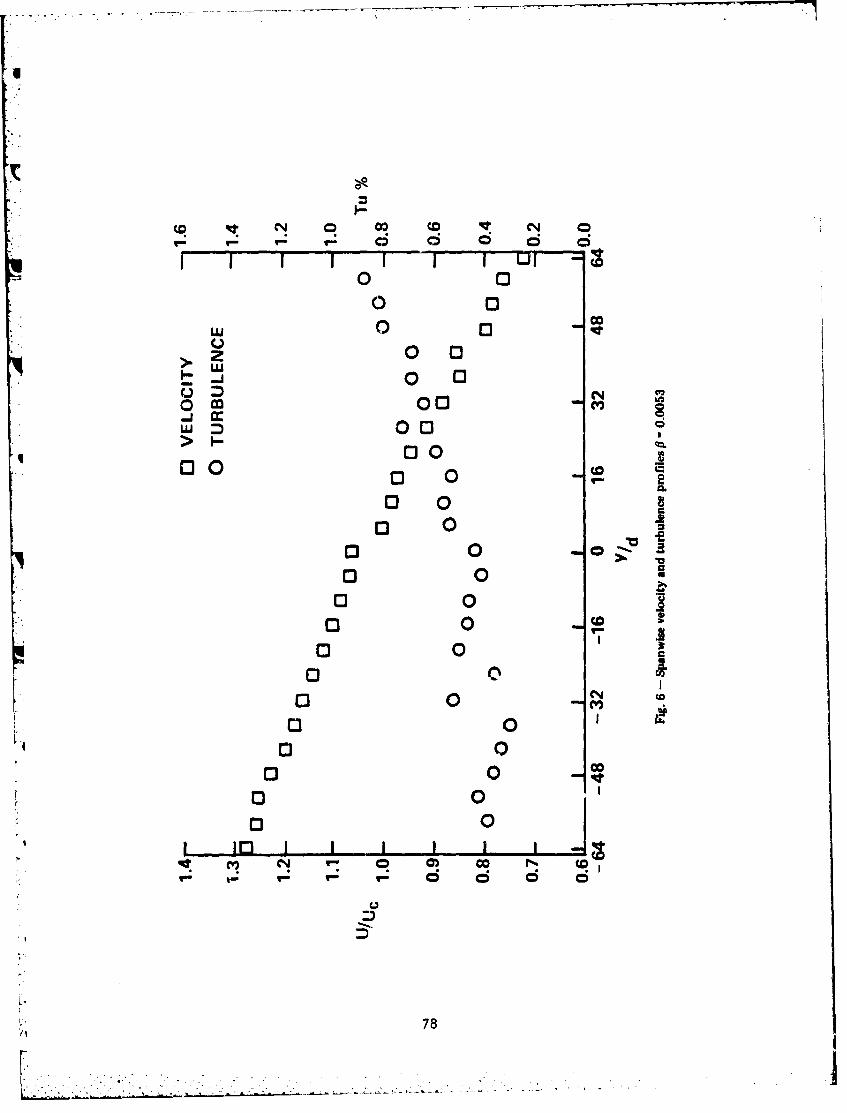
13
2 •Pm o 6• 6 • 6
I I I I ° I "I I° -
0 0
0 0 -
W 0 0000
0 0
2ogo
0000 0
>I
0013000 0C 2
0 0
"" 00 00 0V0 0
000 0
0 0
0 00 0
00000
00
qt CVj 0l c
78
I.

STRAINSET MODEL FL1USINGLE BRIDGE UNIVERSALFLAT LOAD CELL1000 lb CAPACITY
3mV/V EXCITATION OUTPUT
WESTON MODEL 3010-15V DC POWER SUPPLY
SUPPLIES 15V DCEXCITATION TOLOADCELL BRIDGE
HP 3476B MULTIMETER
DIGITAL MONITORINGOF CABLE TENSION
Fig. 7 - Cable tension measurement
79
f". , . I-,F. - l
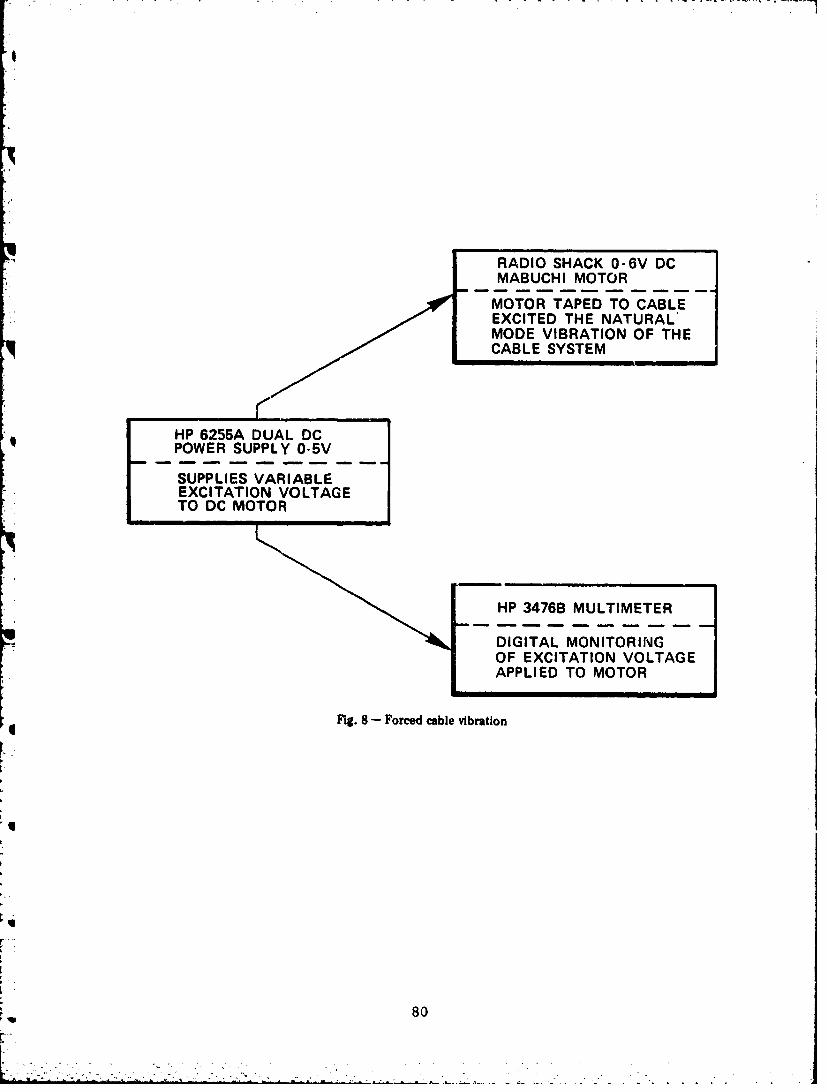
RADIO SHACK 0-6V DCMABUCHI MOTOR
MOTOR TAPED TO CABLEEXCITED THE NATURAL'MODE VIBRATION OF THECABLE SYSTEM
POWER SUPPLY 0-5V
HP 6255B MULTLMETE
SUPPLIES VARIABLEEXCITATION VOLTAGETO DC MOTOR
II
HP 3476B MULTIMETER
DIGITAL MONITORINGOF EXCITATION VOLTAGEAPPLIED TO MOTOR
Fig. 8 -- Forced cable vibration
80
' ,1 i :•:~ .i:•.-• ,.•, • .•. .~ - .•~ .•- - - . , • ,. : . _ . • • . i • iii i .•. ... •.. ;. . .• .. . . . .• ,• . . .

TECTRONIX 5103NOSCILLOSCOPE
VISUAL DISPLAYOF'VIBRATIONCHARACTERISTICS
PHYSITECH MODEL OH39B PHYSITECH MODEL 440REMOTE OPTICAL HEAD ELECTRO OPTICAL AUTO
COLLIMATOR CONTROL UNITFOCUSED ON THE VIBRATINGOBJECT IN FRONT OF AN IN- FILTER, ZERO SET,CANDESCENT LIGHT SOURCE GAIN CONTROL
III
DISA TYPE 55D35 TRUE KROHN HITE MODEL 335R
RMS VOLTMETER VARIABLE BANDPASS FILTER
VIBRATION AMP.OUTPUT IN USED AS AN
VOLTS 2V DC = 1 mm ANTIALIASING FILTER
ZTL INC.MULTICHANNEL TEKTRONIX 4010FFT PROCESSOR WITH GRAPHIC DISPLAY TERMINALDMS 5003 COMPUTER POWER SPECTRUM &
- - -- FREQUENCY OF VIBRATIONCALCULATE POWER SPECTRUM ARE DISPLAYED
Fig. 9 - Cable mode shape, vibration amplitudeand frequency measurement
81

TSI HOTWIRE P~ROBE TEKTRONIX 5103N- SI -OTWE PROBE -- OSCILLOSCOPEPOSITIONED AT POINT WHEREVORTEX SHEDDING VISUAL DISPLAY OF
STRONGEST HOTWIRE SIGNAL
TSI MODEL 10514 CONSTANT KROHN HITE MODEL 335RTEMPERATURE ANEMOMETER VARIABLE BANDPASS FILTER
NO LINEARIZER USED AS ANTIALIASING FILTER
ZTL INC. MULTICHANNEL REYNOLDS NUMBERS FROMFFT PROCESSOR WITH DATA ACQUISITION SYSTEMDMS 5003 COMPUTER
& HORIZONTAL POSITIONSFROM 3D TRAVERSECALCULATE POWER SPECTRUM
TEKTRONIX 4010 GRAFLEX CAMERAGRAPHICS DISPLAY TERMINAL TYPE 5710 FILM
(POLAROID HIGH SPEED)POWER SPECTRUM & VORTEXSHEDDING FREQUENCIES HARD COPIES ( PICTURES)DISPLAYFD OF SPECTRA OBTAINED
Fig. 10 - Vortex shedding frequencies measurement
82

1i
TEKTRONIX 5103NOSCILLOSCOPE
VISUAL DISPLAY OFHOTWIRE SIGNAL
TSI MODEL1051-6
TSI HOTWIRE PROBE CONSTANT TEMPERATURE-- ANEMOMETER
TRAVERSED ACROSS THEWAKE OR ALONG WIND AT NO LINEARIZERTHE BASE OF THE CABLE
MULTIMETRICS INC. DISA TYPE 55D35MODEL AF-420L TRUE RMS VOLTMETERACTIVE FILTERBAND PASS MODE 3 SEC AVERAGING USED
10 Hzt---- (2fcs fcs/2) THROUGH Lw & Lf2 fcs + TRAVERSESfcs/10
REYNOLDS NUMBER FROM HP MODEL 7100BDATA ACQUISITION SYSTEM STRIPCHART RECORDER& VERTICAL,HORIZONTAL ----
POSITIONS FROM 3D ACTUAL RMS TRACES ACROSSTRAVERSE WAKE & IN ALONGWIND
DIRECTIONS RECORDED
FIg. 11 - Cable wake width and vortexformation length Instrumentation
83
Lzi
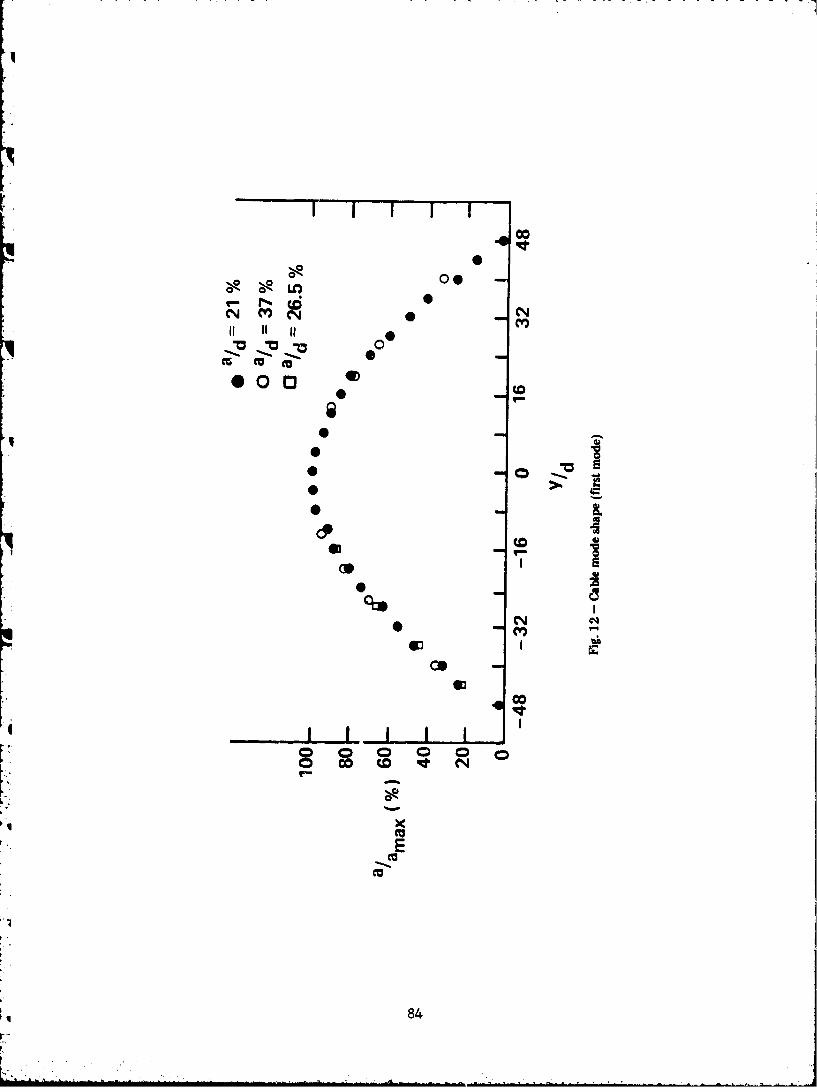
co-0
00
(0Cv0 0 ND
00
0
S3
S CDD
3~ 0 e
4 ~W4

100 . 0
80 •
armax (%) 60
40- 0
20-
0 I I I I I I a t I I 1 .1-48 -32 -16 0 16 32 48
Y/d
(a) SECOND PHASE TESTS
100 -
80 -
amax (%)60 0 •
40-
20-
L ) -'1 I I I I I I I I I I. I Il-48 -32 -16 0 16 32 48
Y/d
(b) FIRST PHASE TESTS
Mg. 13 - Cable mode shape (second mode)
85Ii

00
cn cULUU
0- OD
U~- U.
ww U 0
40 *upI
86

1C
00
w o0c
0. c
87

UU
C)~
!E 0ZQ .2 U
13 0
0
* 00
0 0
0 0o (a0
88=

0.20
000.19- 0 0 . * r
0.18
stc
* STATIONARY0.17- 0l VIBRATING a/d = 24%
o VIBRATING a/d = 24%(FIRST PHASE TESTS)
0.16-- 1--L0o I -LO--4
0.15
1 2 3 4 5 6 7 8Re(-.*103 )
Fig. 17 - Variation of the centerline Strouhal number as a function ofReynolds number of a stationary and vibrating cable
89
; _ _ _ _

Ii
Y//d
- 42.7 5.3
i I 10.7
S16.0
V~32.021
-26.7 i
j~26.7
-21.3 , i
j V•'• ,'A•%t, 32.0
-16.0
,-10.7
40 60O
S~-0.0
20 40 60 80 100e . sFREO.Hz20' 40 60 80 100
FREG .Hz
Fig. 18 - Spanwise behavior of the vortex shedding frequency during lock-on,Rec = 3.83 X 10³, second mode shape, a/d - 11.7%,,C - 0.0

0.190-
0.185-
0.189-stc
0.175-
0.165
0.160 I I I I I I I I I-48 -32 -16 0 16 32 48
Y/d
(a) FIRST PHASE TEST, Rec = 1.9 x 10³, a/d = 32.1%FIRST MODE
0195
0.190 -Stc 0.185 -
0.180-
0.175 II I1 j I I I I I-48 -32 -16 0 16 32 48
Y/d
(b) FIRST PHASE TEST, Rec 2.67 x 10³, a/d 10.2%SECOND MODE
Fig. 19 -- Spanwise variation of the vortex sheddingfrequency below the lock.on range, j
3 - 0.0
91

0.18 -0.17- 0
0 00
Stc 0.16-
0.15- 0 0 •
0.14-
0.13 I I 1 I I I I i I I I-48 -32 -16 0 16 32 48Y/d 3
(a) a/d=25.4% ,Re-=2.10x 10³
0.190-
0.185- .. 0000.180 00
0.175 Iz0,170 I I I I I I I-48 -32 -16 0 16 32 48
Y/d(b) a/d=25.4% ,Rec=4.3x 1O3
Fig. 20 - Spanwise variation of the vortex shedding frequencyaway from the lock-on region, first mode, • - 0.0
92

0.195
0.190.
61 c0,185- • • SYMMETRIC
0.180 I I I I I I I I
-48 -32 -16 0 16Y/d3
(a) a/d =25.4%,Rec =5.75x 10³
0.195
0.190 . 000 .-
0.185 see SYMMETRIC-
0180 I I I I I I L I I-48 -32 -16 0 16
Y/d(b) a/d= 10.5%,Rec = 5.78x 10³
0.195-
0.190 -Stc
0 SYMMETRIC0.185- 0I I I I I I I I
0.180 -48 -32 -16 0 16
Y/d(c) a/d =25.4%,Rec=6.9x 10³
Fig. 21 - Spanwise variation of the vortex shedding frequencyaway from the lock-on range, first mode,3 - 0.0
93
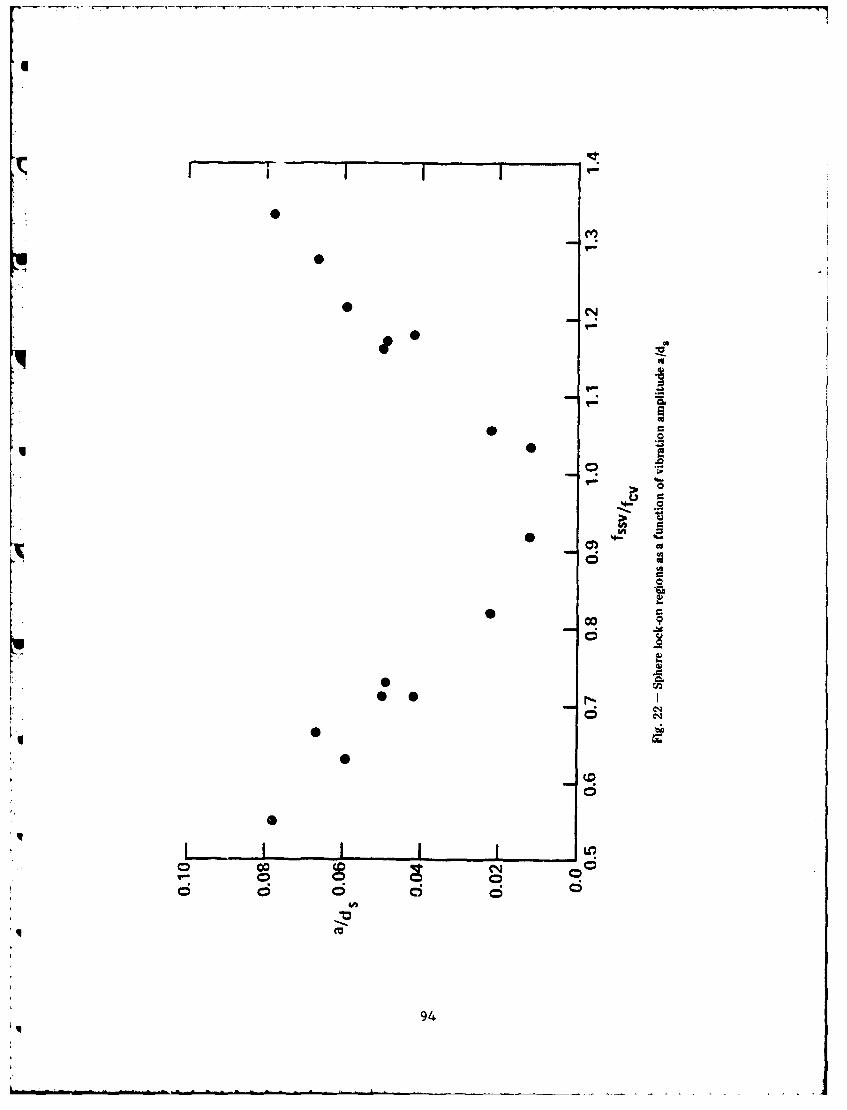
*13
0 m.
04
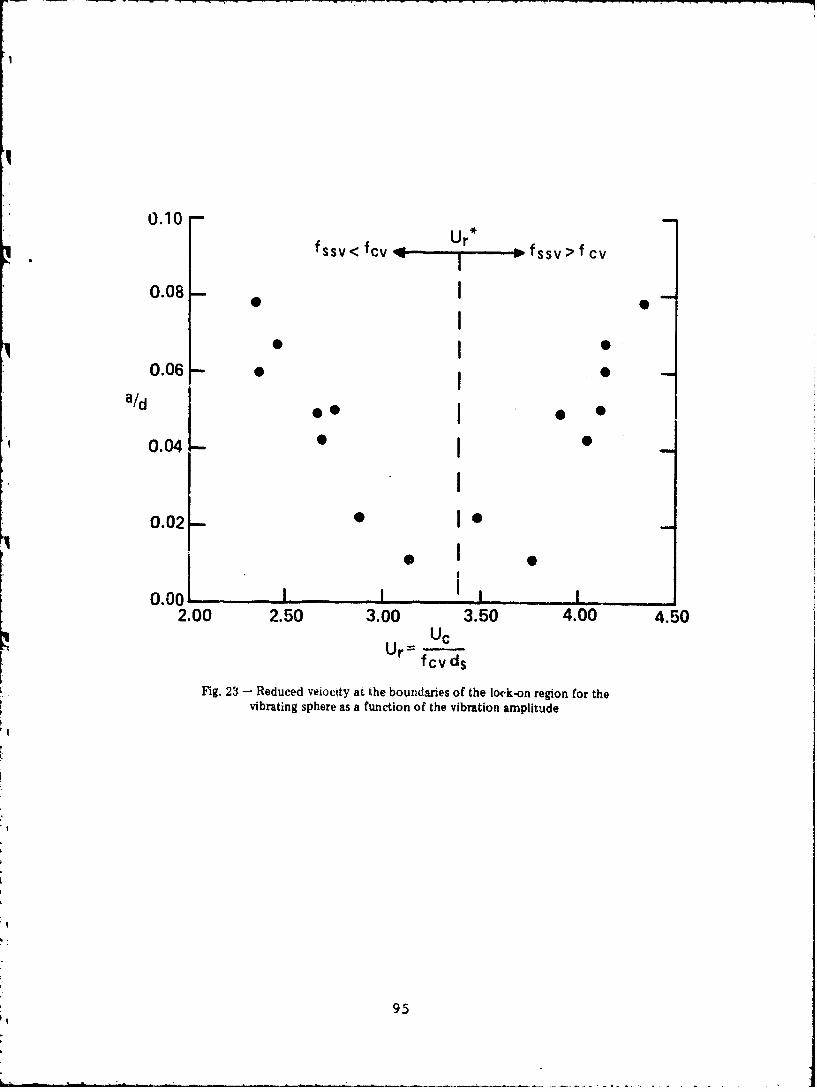
0.10
fssv< fcvUr* 1 fssv> f cv
0.08 - I
0 I
0.06-
a/d aid * I 0 *
0.04 - I
0.02 _• I •
0.001 I . I-2.00 2.50 3.00 3.50 4.00 4.50
UCUfcvds
Fig. 23 - Reduced veiocity at the boundaries of the lock-on region for thevibrating sphere as a function of the vibration amplitude
95

50-
40•
30 -
20-
Kd10-0-" -
-10-.-
-20 -
-30--40 -- -
- 5 0 _ , 1 .. AI .... . ,
0.060 0.083 0.100 0.120 0.140 0.160 0.180 0.200Stc
Fig. 24 - Spanwise Strouhal number variation along the vibrating cable with five spheres inunsheared flow, a/d - 24.2%,, first mode, Rec - 2.23 X 10³, away from lock-on range
9
96
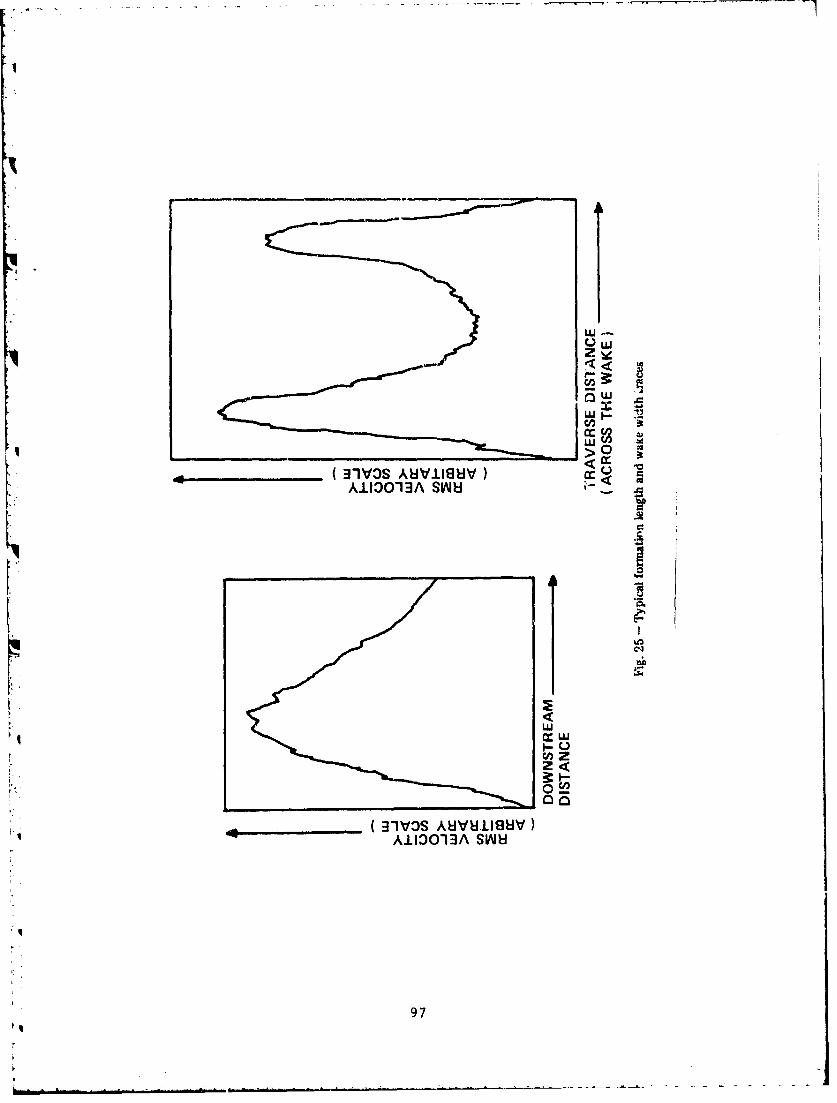
-. U~
1 U
C .w
w Jw>-C.
2<
____________ ( A1V3S IJ CCWI8
'6 AIIII OO1 A SIJU z
97U

2.9
2.7 -I
2.5--
2.3-Lf/d
1.9-
4 1.7
1.20- •
1.20-- o
60 LW/d 1.10- 1:4 Re10
1.00- a-
0.90-
0.80 - . 111 104, L1i0104 Re 105
(b) WAKE WIDTH Lwca
Fig. 26 - Variatior, of Lf and Lw as a functionof increasing Reynolds number
98
'I

2.5
2.3-
2.1-Lf/d
1.9 8 0
1.7- 0 0
1.5 I I I I 1 ltlo0 I I I I
103 104 Re. 105
(a) FORMATION LENGTH Lf a/d=9-9%
1.30
1.20 LU. l
1.10 0
0.90-
0.80 1 I .I I !l I . I I -,-,-,103 ()A Rec 105
(b) WAKE WIDTH Lw'a/d=99%
Fig. 27 - Variation of Lf and L, as a functionof increasing Reynolds number
99
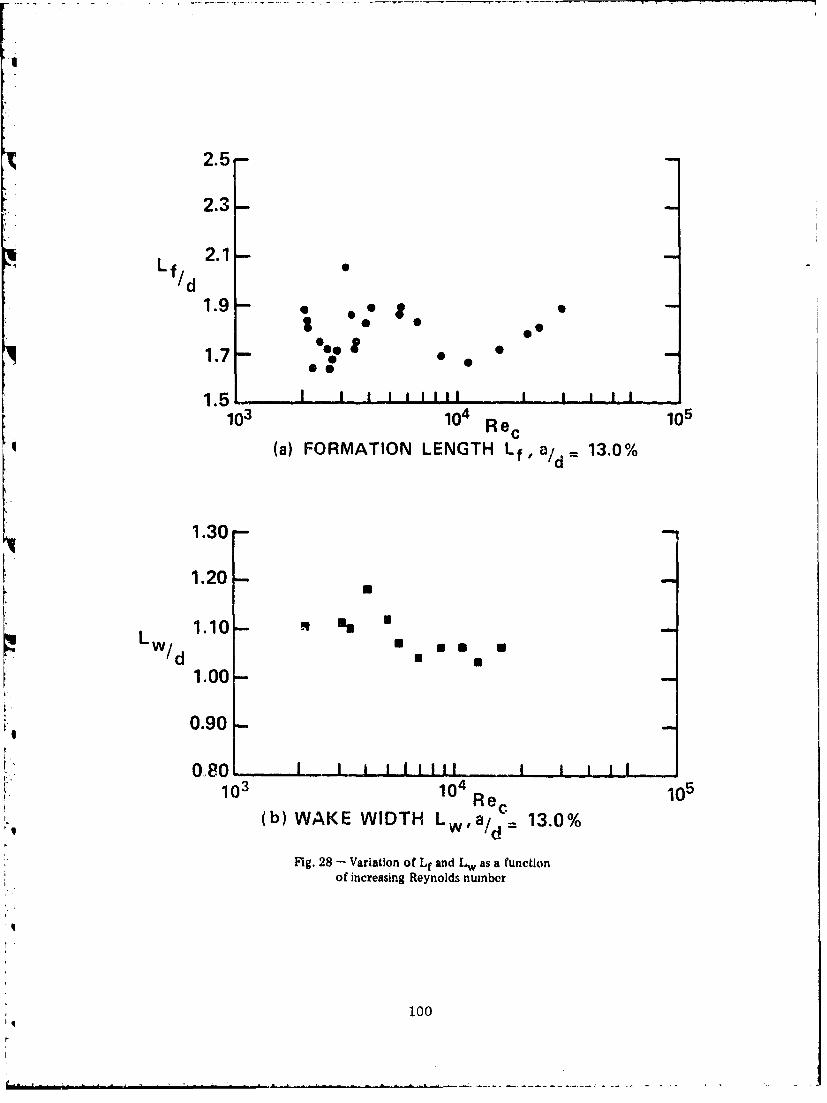
-- -- - - -
2.5
2.3
L 2.1-Lf/d
1.9 - a1.7 -s. I
60 0*
1.5 - I I i i I i l I I I I -103 104 Rec 105
(a) FORMATION LENGTH Lf, a/d 13.0%
1.30
1.20 i
L 1.10 , =W/d U *
1.00
K 0.90-
080 I I i II il I I I I103 10Re 105
(b) WAKE WIDTH Lw'a/d 13.0%
Fig. 28 - Variation of Lf and Lw as a functionof increasing Reynolds number
100
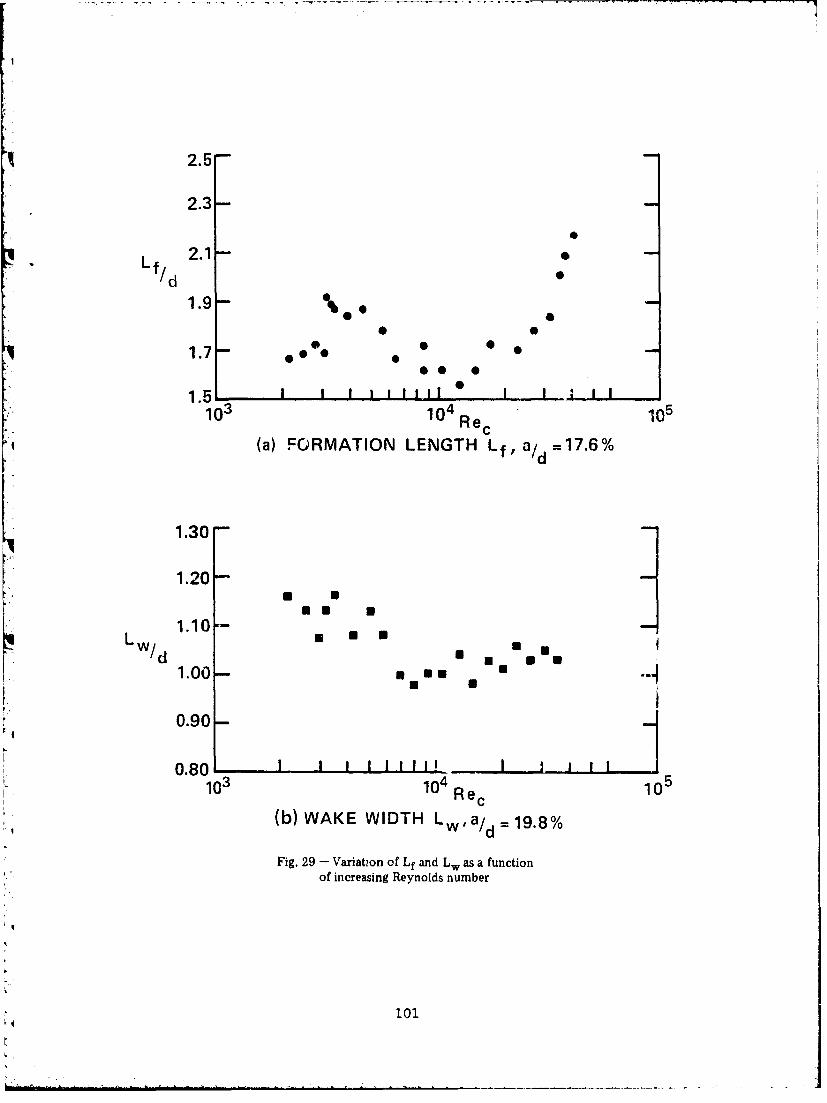
2.5
2.3
2.1-Lfd
1.9- %**
S S
1.7-
1,501.5 I I I tutum~ I I J103 104 Rec 105
(a) FORMATION LENGTH Lf, a/d =17.6%
1.30
1.20"
1.10w/d 10 o •M
0.90-
0.80 I II 1 liP I iii I103 104 Re15Re 10C
(b) WAKE WIDTH Lwa/d 19.8%
Fig. 29 - Variation of Lf and Lw as a functionof increasing Reynolds number
101
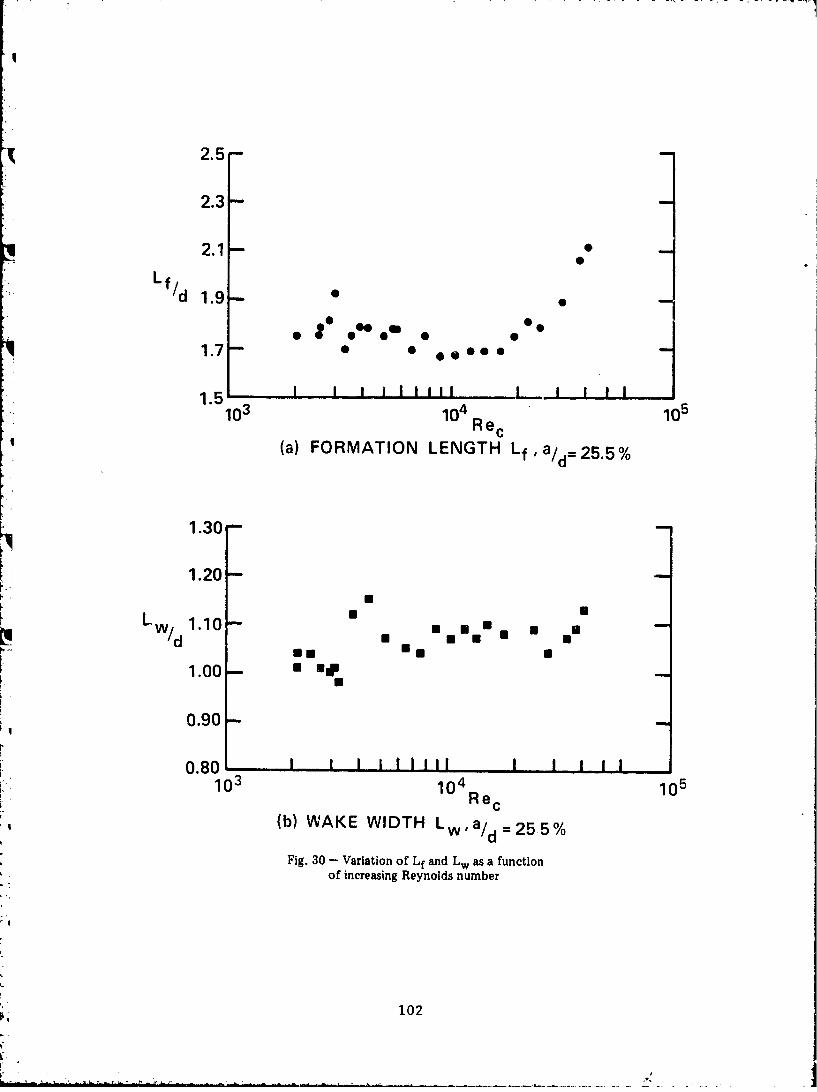
2.5
2.3
2.1 -
Lf/d 1.9-
1.7 0 0000 -1.5 I I nI Ii tnnl I I I I I
103 104 105Rec
(a) FORMATION LENGTH Lf ad= 25.5 %
1.30
1.20
LW/ 1.1 0 • •
1.00 a mnip
0.90
0.80 -- I I 111I I I I II103 10 4 105
Rec(b) WAKE WIDTH L /d 255 %
Fig. 30 - Variation of Lf and Lw as a functionof increasing Reynolds number
102

KY Id
S-42.7 V
I NN~ 2.7-40.05.3
-37.3
--34. 7
WX-32.0 "V10.7
A 13.3
w -29.3
-26.7 18.7
S-24.0
N'ý 213 "'021.3
* -18.7 24.0
-16.0 26.7
-13.3 29.3
-10.7 32.0
334.7
4 -5.3 "
37.3
40.
0 5 100 150 3 50 100 150FREQ.Hz FREQ.Hz
Fig. 31 - Power spectra showing the spanwise variation of the vortex shedding frequency,first phase test, Rec - 2.6 X 10³ no vibration, no spheres, -0.0053
103

50
40-
30-
20-
100
Yid 0 -- • -
-10 --
-20--
-30 -
-40 -o
-50 0I
0.120 0.140 0.160 0.180 0.200 0.220 0.240
Stc
Fig. 32 - Spanwise Strouhal number variation, first phase test,Re. = 2.I X 103, no vibration, no spheres, 0 0.0053
104
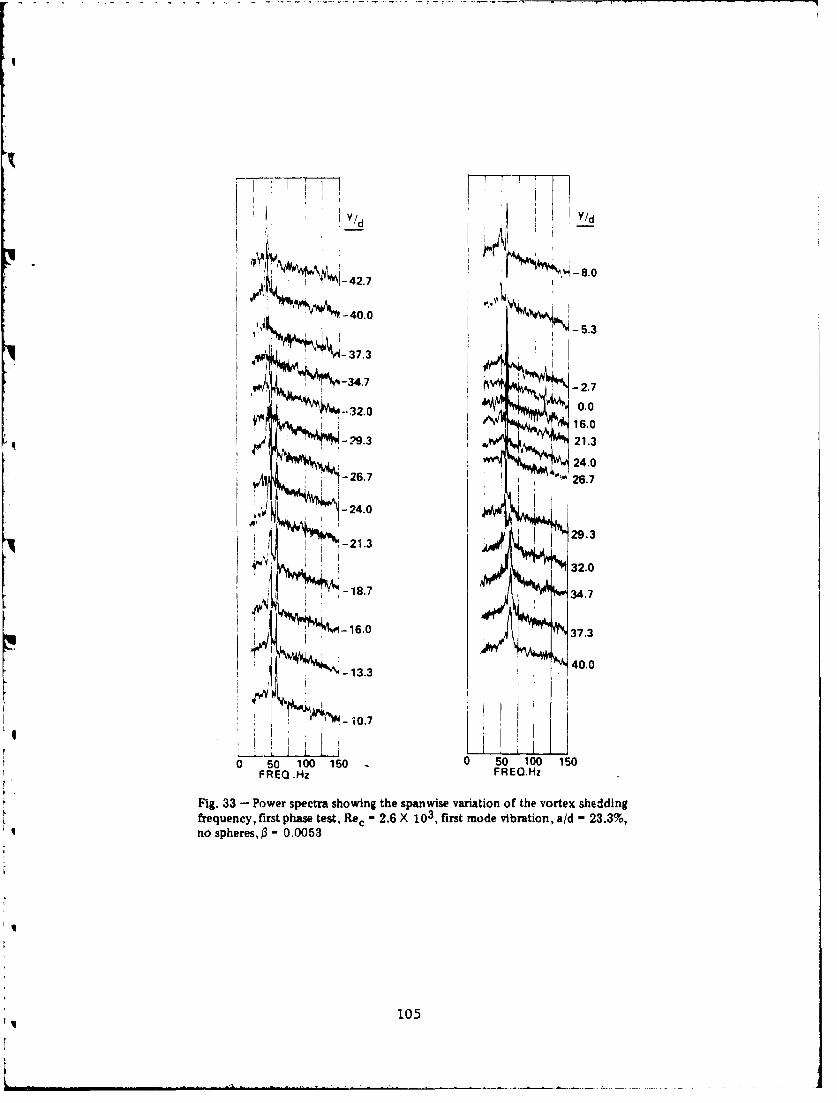
Y/d Y/d
Ii -8.0
-40.0-5.3
,,• -~37.3
-34.7
J -32.0 0.0
-29.3 21.3
24.0. -26.7 26.7
-24.0
-213 AIV.
32.0-18.7 3 .
•34.7
,• JI116.0 37.3
I -~' 13.3 ' ."40.0
So7 1M
0 50 100 150 - 0 50 100 150FREQ .Hz FREQ.Hz
Fig. 33 - Power spectra showing the spanwise variation of the vortex sheddingfrequency, first phase test, Re. - 2.6 X 10³ , first mode vibration, a/d - 23.3%,no spheres,/3 = 0.0053
105
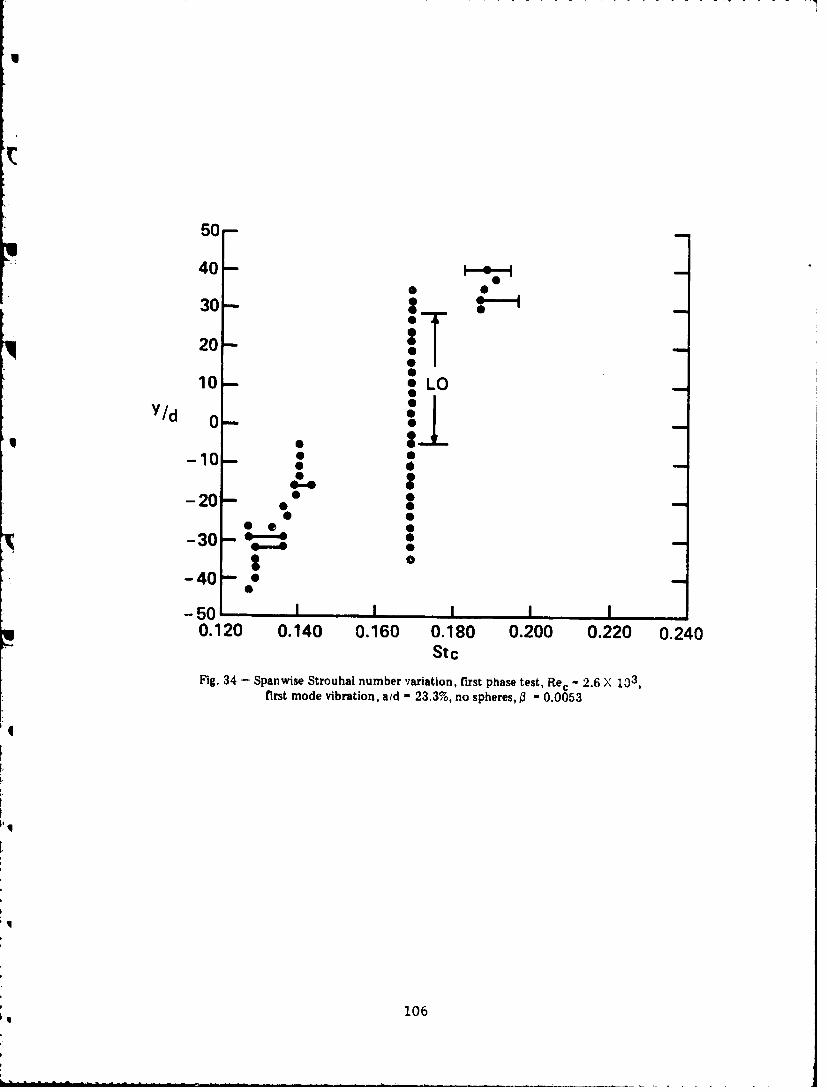
50-
40
30-
20-
10 SLO
"Y/d 0
-1006
000--0 3-20-30 " •
-40- 0
- 50 I I I I I0.120 0.140 0.160 0.180 0.200 0.220 0.240
Stc
Fig. 34 - Spanwise Strouhal number variation, first phase test, Rec 2.6 X 10 3 ,first mode vibration, aid - 23.3%, no spheres,/• - 0.0053
106

V/du
ý/d dS' 0.0
-42.7 0.0
-40.0 2.7
-34.753
-32.0 I 8.0
-29.3 10.7
q -26.7 I13.3-24.0 16.0
-21.3
-18.7 18.7
-16.0
21.3
24.0
-13.3 26.7
I 29.3
I -107 32.0
-5.3 34.7
I •-2.7 37.3
I J40.0
50 100 150 0 50 100 150FREQ.Hz FREO.Hz
Fig. 35 - Power spectra showing the spanwise variation of the vortex shedding frequency,first phase test, Re. - 3.72 X 10 3 , no vibration, no spheres, 13- 0.0053
107

50-
40-
30-
20-100
0 •.-.-4
Y/d 0 0 -*
"-10 --
- 20 - _,-•
-30 -_-
-40-
-50I I I I0.120. 0.140 0.160 0.180 0.200 0.220 0.240
Stc
Fig. 36 - Spanwlse Strouhal number variation, first phase test, Re. - 3.72 X 10³ ,no vibration, no spheres, j - 0.0053
108

UJ
S!ld Y/d
08.0
-42.7 20.02.7
-40.0
"• 13.3 2.3
18.0
-34.7 10.7.
3-32.016.0
-. 318.7
-29 .3 4.
-26.7 21.3
-24.0 24.0
-21.3
Si p-18.7 26.7
32.0-10.7
34.7
-8.0 37.3
-5.3 40.0
-2.7
0 50 I00 160 0 5o 100 150qFREQ.Hz FREO.Hz
Flg. 37 - Power spectra showing the spanwise variation of the vortex sheddingfrequency, first phase test, Rec 3.72 X 10³ , second mode vibration, aid11.7%, no spheres, ~I-0.0053
109
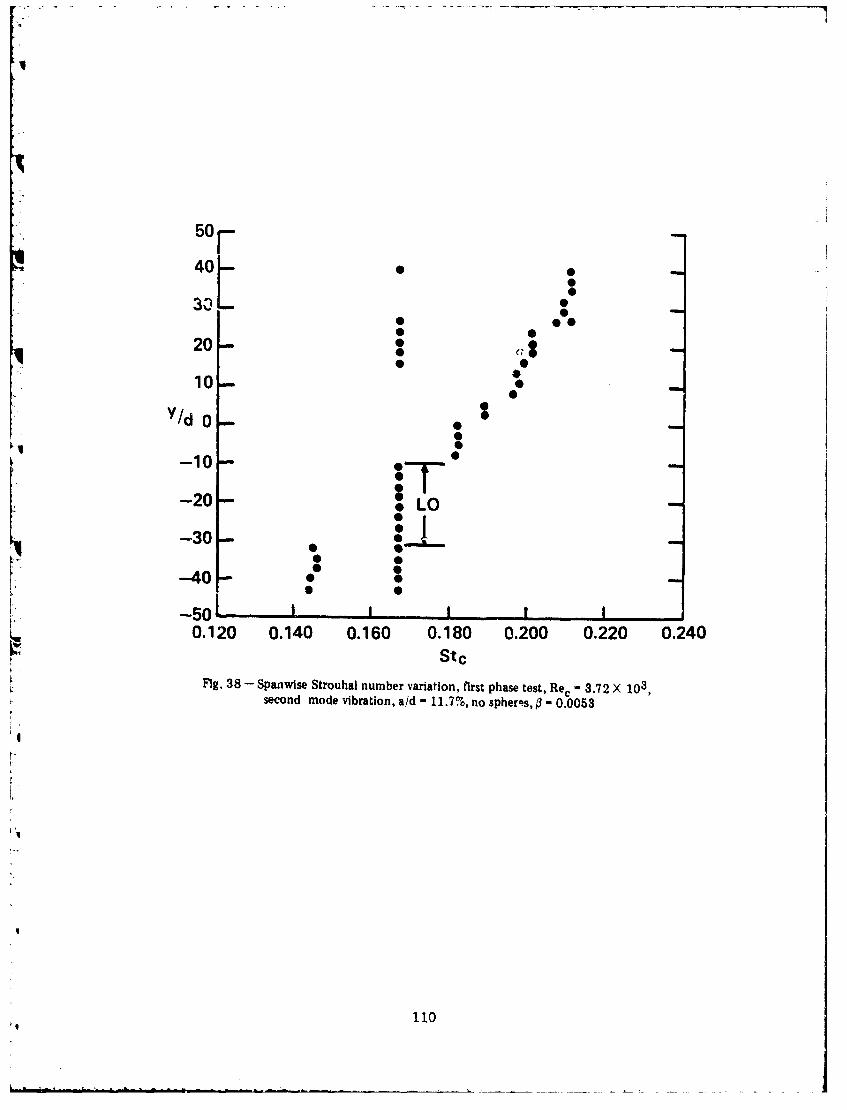
i'
50-
40 I-0 00
30) L200
10.0;.20 ** •
Y/d 0 .-10 0
-20- LO
-30.i1
-40- 0
-5010.120 0.140 0.160 0.180 0.200 0.220 0.240
StcFig. 38 - Spanwise Strouhal number variation, first phase test, Rec - 3.72 X 10³t
second mode vibration, a/d - 11.7%, no spheros, 3 - 0.0053
110

Y/ _d Y/du-- I -
-48
-40
-38 l-3012
i4
-36 .16-34 1
2-3220
-30 22
-28
24-26
0*4 IMP-24-22 2
I'ý ftI.ý4 O 302
34
*AV~ OW-636
4 I-140
-12
-10 44
2.- 20 46
-4 41J ~48
0 20 40 60 80 100 0 20 40 60 80 100FREQ.Hz FREQ.HZ
Fig. 39 - Power spectra showing the spanwise variation of th-, vortex shedding fr-quency,Re. 2.96 X 10" , no vibration, no spheres, i - 0.0053
111

50-
40- H
30
20-
10-
Y/d 0.
-10-
-20-
-30-
-40-
-50•J0.120 0.140 0.160 0.180 0.200 0.220 0.240
Stc
Fig. 40 - Spanwise Strouhal number variation, Rec - 2.96 X 10³ ,no vibration, no spheres,/1 = 0.0053
112
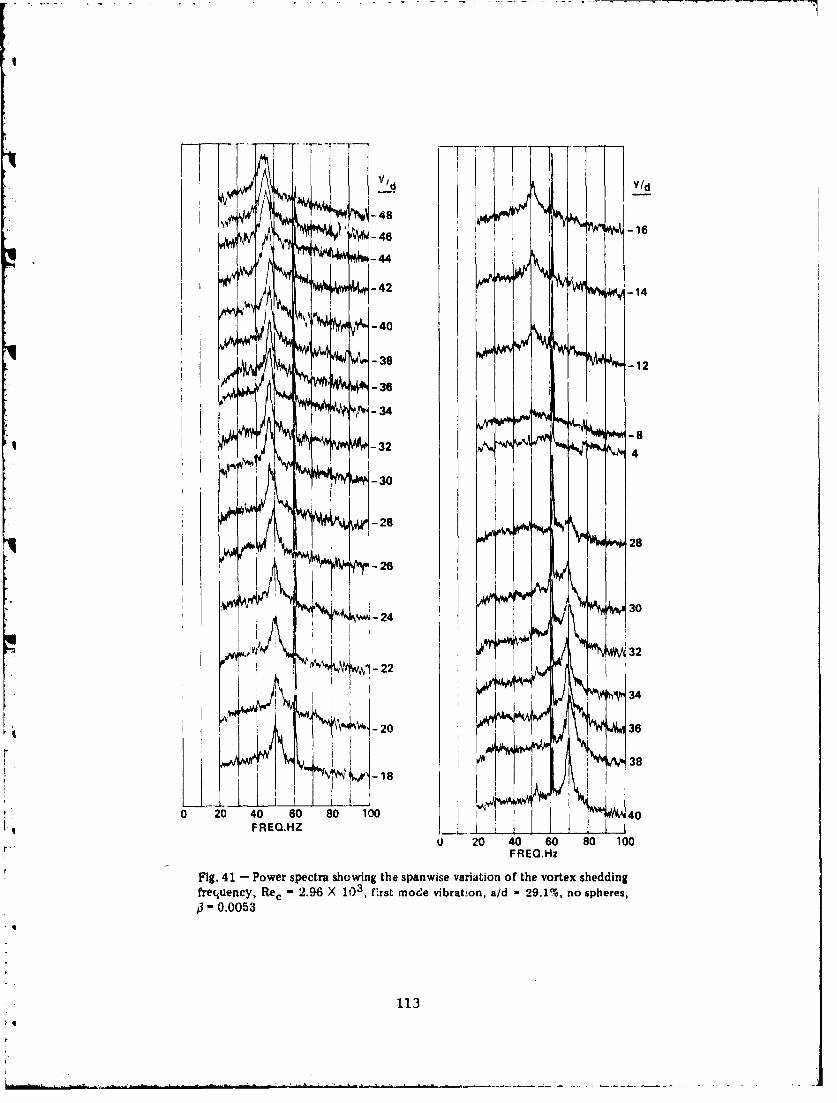
K ' -~48-1-46 M 1
-42-4
/ V -40
V 38 -Nkw 12
- 36
-34s
-32 N4
30
-28
F 28-26
WA30
I 32
I t~~'-22
'0OIN 34
0 20 40 60 80 100 40t iisaw:~4iex3
frequency, Rec -2.96 X 10 3 , fi.rst moevibato, a/ 2.1%, nloshrs-0.0053
113

50
4000
30
20-
10- LOYid 101--
-40-30'-40 • t
-50 L0.120 0.140 0.160 0.180 0.200 0.220 0.240
Stc
Fig. 42 - Spanwise Strouhal number variation, Re. - 2.96 X 10³, first modevibration, a/d - 29.1%, no spheres,/3 = 0.0053
114

Y
-48 ,6
-44 10
-40 V14
-38 11
20
-32
-30 I-28 24
-24
- 22 428
30
Fig. JLLL20
101k
_ J4

04
6N,
a00
00
.IjIS
coo
6
od
q• • 0 0 0 0 0 0 €cr
116
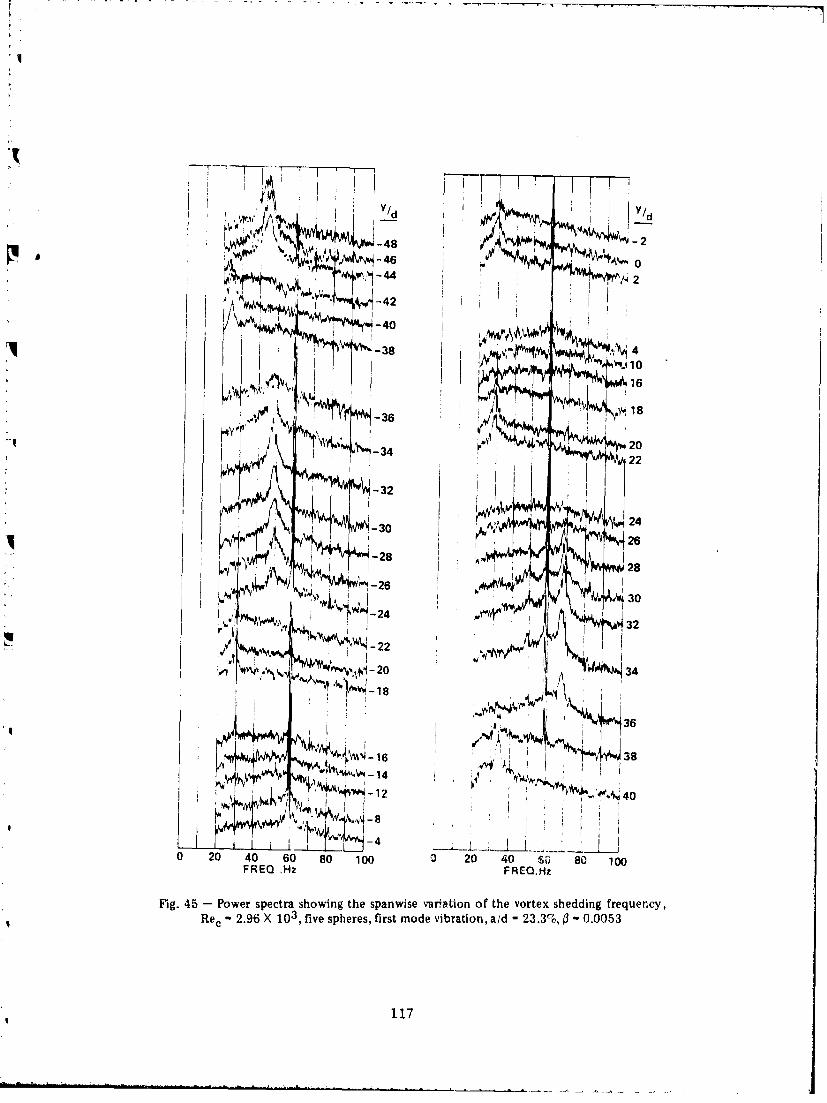
O ft r-"--, -' -2
422
-40
STw-• 3 8 1 44
S",,1-4".ttIP ti 4
10
1718
1t fi v 2022
I -30 24
30 26
-j 2 8 F
T 28
I F30
,F~ ~ ~ ~32
%jM 16 3F
*Wt -12 40
0 20 40 60 80 100 0 20 40 SD 86 100FREQ Hz FREQ.Hz
Fig. 45 - Power spectra showing the spanwase variation of the vortex shedding frequer~cy,Rec - 2.96 X 10³ , five spheres, first mode vibration, aid - 23.3%, ~ 0.0053
117
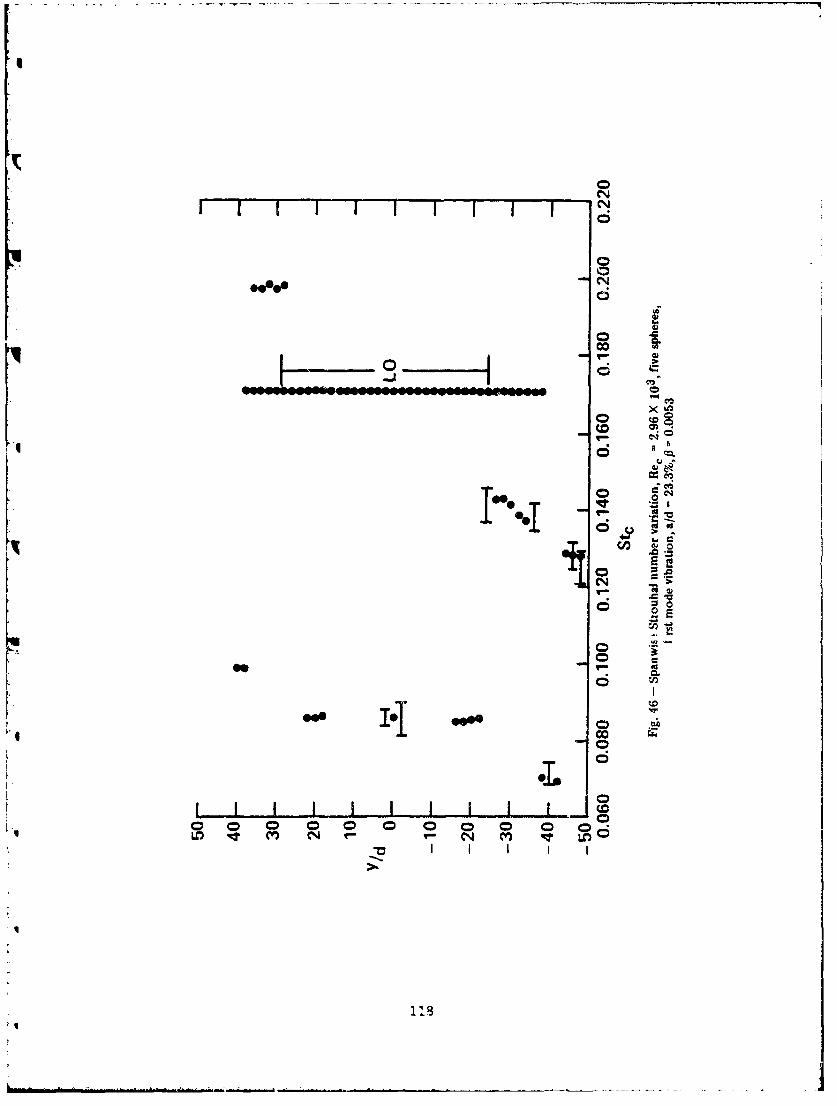
Ic
.Q[0
("4
C6
0
00
C.D
a'
I-
F-- 6
0 • 0
II
UM m 6
illo
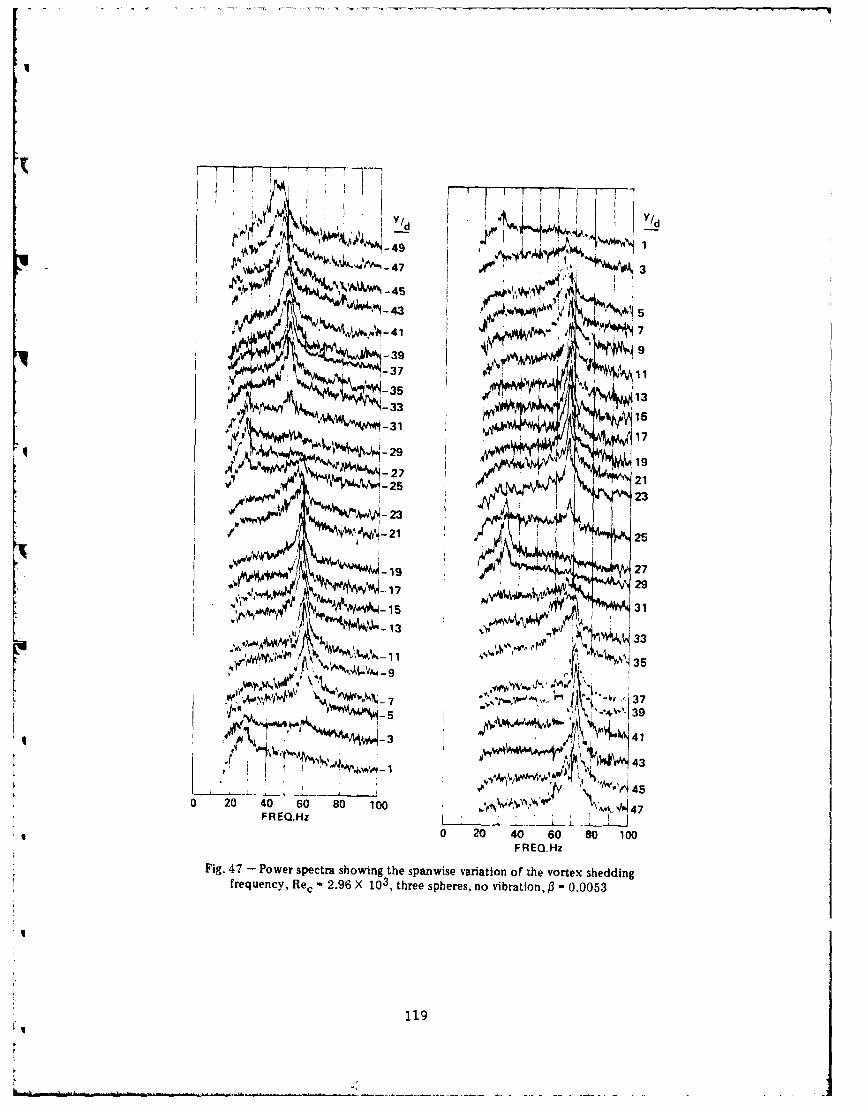
-49
- 47 3~A~%$.~i- 45 /
~-43 'NA 5
- 41"~ 7
-39 Al
-35l~ 13
-313I ~ i..15*-31 17
-299-27-25 I21
23
-23721 29
-17 2
35
A~7A 37,
iN - 43
0 20 40 60 go 100 4 47FREQ.HzL Lr XI LJ
0 20 40 60 80 100FREQ.Hz
Fig. 47 - Power spectra showing the spanwise variation of the vortex sheddingfrequency, Re~ 2.96 X 10³, three spheres, no vibration, j3-0.0053
1.19

04
em o
0 00
10

-~-3
S-41 3
-43
!~4 3
-379~2
~I 25
-377
29
-25
-2727
-31
S31
I 35
40 . 0 L ,L,__, _
0 20 40 60 80 100 0 20 40 60 80 100FREQ.Hz FREQ.Hz
Fig. 49 - Power spectrt showing the spanwise variatiorn of the vortex shedding frequency,
Re. - 2.93 X 10 3 , three spheres, Atst mode vibration, a/d - 23.5%,13 = 0.0053
A

'1" i I I I I I CmI
6-. - -- 2 2 2.S2 1 0"0 x
,- Cg
II
L6
I I I I0
b0
i .
S122;

Appendix B
Previously Established Methods
The experimental techniques that ,ere employed in the present study to
measure vortex shedding frequencies, vortex formation lengths, wake widths,
wind tunael velocity and turbulence values, vibration amplitudes and
vibration frequencies had been developed and proven accurate in previous
wind tunnel studies perfromed at VPI&StT by the present author [31,32,38].
Some commerLs regarding the accuracy of these techniques are provided in
this appendix to increase the readers confidence in the results that were
presented in this report.
The sparwise velocity and turbulence profiles that were measured during
the present tests showed no significant statistical variations from those
measured previously [32]. Two hundred individual velocity or turbulence
values were averaged to obtain each data'point in the profiles. Both the
uniform (8= 0.0) and linear shear (B 0.0053) flows in the present study
had turbulence intensities less than one percent across the spanwise working
distance. The flais were not considered to have been influenced by
turbulence. Power spectra of the fluctuating hot wire anemometer signal
revealed that there were no extraneous frequency components (wind tunnel
blade frequencies, sixty cycle noise, wire screen vortex shedding
frequencies, etc.) present in the flow or measurement system. Variations in
the kinematic viscosity, 4 due to ambient temperature and pressure changes
were taken into account when calculating the flhw Reynolds number. Blockage
effects created by the presence of the three-dimensional traverse, cable
endplate supports and the measuring instruments in the freestream were
insignificant.
The Zonic FFT with a DMS 5003 computer was used to calculate power
spectra of the fluctuating hot wire (cable vortex shedding frequency
measurement) signals. The signals were band-pass filtered before they were
input into the FFT to elimtinate aliasing. The Strouhal numbers, calculated
using the measured values of the cable vortex shedding frequencies, were all
virtually equivalent throughout the subcritical flow range covered by the
tests. These values were consistent with those measured previously for
circular cylinders. Power spectra of the fluctuating hot wire signal in the
freestream flow above the cable revealed that no extraneous frequencies were
123

qW
present. The measured values of the forced cable vibration frequencies were
3enerally consistent with the calculated values of the ideal (no bending
stiffaess) natural vibration frequencies of the cable under the same
conditions. When both the vortex shedding and forced cable vibration
frequencies were simultaneously present in the fluctuating hot wire signal,
no false addition and/or subtraction frequency components appeared in the
power spectra of the signal.
There was great care taken to accurately measure the values of the
vortex shedding frequencies in order to set the band-pass filter to the
correct values prior to measuring the position of the vortex formation
lengths in the Reynolds number range covered by these tests. The values of
Lf , measured behind the circular cylinder were in general argreemelt with
previous authors results. Low pass filtering was used to eliminate
contamination of the wake width traces by higher frequency multiples of the
vortex shedding frequency. The values of Lw measured behind both the high
aspect ratio cable and cylinder were virtually equivalent and nearly equal
to previous authors results. When the streamwise and vertical hot wire
traverses were performed to measure Lf and LW respectively, the traverse was
operated at a low speed in order to allow three second averaging to be used
in the rms meter to smooth out the signal trace on the strip chart recorder.
All the time based signals were monitored on an oscilloscope. This
assured that no large extraneous noise signals were present or generated
within the equipment, and also assured that all the equipment was
functioning properly.
124