Embed Size (px)
Citation preview
3 1 7 . 5 7 0 . 7 0 2 0
8 0 0 . 3 8 7 . 0 6 7 2
B A N G S L A B S . C O M
b a n g s b e a d sF L O W C Y T O M e T R Y s U P P L e M e n T
2 0 1 2 – 2 0 1 3
TA B L E O F C O N T E N T S TA B L E O F C O N T E N T S
2 0 1 2 – 2 0 1 3 F L O W s U P P L e M e n T B A N G S L A B S . C O Mii
ABOuT BANGS LABOrATOriES, iNC.bangs Laboratories, Inc. was founded april 1, 1988, and has grown to include a product list containing more than 1,500 varieties of the best microspheres in the world. bangs Laboratories is a manufacturer and supplier of specialty microsphere products for diagnostic, research, and flow cytometry applications.
COrpOrATE LOCATiONSbangs is a wholly owned subsidiary of Polysciences, Inc. With corporate locations around the world, we are ready to meet your global needs.
Bangs Laboratories, Inc. 9025 Technology Drive, Fishers, IN 46038-2886 • [email protected]
Polysciences, Inc. 400 Valley Road, Warrington, PA 18976 • [email protected] Polysciences Europe GmbH Handelsstrasse 3, D-69214 Eppelheim GERMANY • [email protected]
Polysciences Asia Pacific, Inc. 2F-1, 207 DunHua N. Rd. 10595 Taipei TAIWAN • [email protected]
QuALiTy pOLiCyIt is the policy of bangs Laboratories, Inc. to provide products, on time, that meet our customers’ quality and service requirements, and which exceed them whenever possible. To fulfill this policy, all bangs employees are committed to a total quality assurance program, driven by the philosophy of preventing quality problems. To ensure that our products merit and earn customer satisfaction, bangs Laboratories actively seeks a dynamic relationship with Customers, employees, and suppliers.
13 1 7 . 5 7 0 . 7 0 2 0 • 8 0 0 . 3 8 7 . 0 6 7 2
TA B L E O F C O N T E N T S TA B L E O F C O N T E N T S
QuALiTy CONTrOL . . . . . . . . . . . . . . . . . . . . . . . . . . . . . . . . . . . . . . . . . 3Routine Quality ContRol . . . . . . . . . . . . . . . . . . . . . . . . . . . . . . . . . . . . . . . . . . . . . . . . . . . . . . 4
FULL sPeCTRUM™ . . . . . . . . . . . . . . . . . . . . . . . . . . . . . . . . . . . . . . . . . . . . . . . . . . . . . . . . . . . . . . . . . . .5ULTRa RaInbOW FLUOResCenT PaRTICLes (bY sPheROTeCh™) . . . . . . . . . . . . . . . . . . . . . . . . . . . . .6FLUOResCenCe ReFeRenCe sTandaRds. . . . . . . . . . . . . . . . . . . . . . . . . . . . . . . . . . . . . . . . . . . . . . . . .6
alignment . . . . . . . . . . . . . . . . . . . . . . . . . . . . . . . . . . . . . . . . . . . . . . . . . . . . . . . . . . . . . . . . . . . . 8RIghT ReFeRenCe sTandaRd™ . . . . . . . . . . . . . . . . . . . . . . . . . . . . . . . . . . . . . . . . . . . . . . . . . . . . . . . .8
lineaRity . . . . . . . . . . . . . . . . . . . . . . . . . . . . . . . . . . . . . . . . . . . . . . . . . . . . . . . . . . . . . . . . . . . . . 9QUanTUM™ MesF . . . . . . . . . . . . . . . . . . . . . . . . . . . . . . . . . . . . . . . . . . . . . . . . . . . . . . . . . . . . . . . . . . .9
time Delay . . . . . . . . . . . . . . . . . . . . . . . . . . . . . . . . . . . . . . . . . . . . . . . . . . . . . . . . . . . . . . . . . . . 10TIMe deLaY CaLIbRaTIOn sTandaRd . . . . . . . . . . . . . . . . . . . . . . . . . . . . . . . . . . . . . . . . . . . . . . . . . .10
iNSTruMENT SET-up . . . . . . . . . . . . . . . . . . . . . . . . . . . . . . . . . . . . . . . . . . . . . .11geneRal instRument set-up . . . . . . . . . . . . . . . . . . . . . . . . . . . . . . . . . . . . . . . . . . . . . . . . . . . 12
QC WIndOWs® . . . . . . . . . . . . . . . . . . . . . . . . . . . . . . . . . . . . . . . . . . . . . . . . . . . . . . . . . . . . . . . . . . . . .13QC3™ . . . . . . . . . . . . . . . . . . . . . . . . . . . . . . . . . . . . . . . . . . . . . . . . . . . . . . . . . . . . . . . . . . . . . . . . . . . . .13FULL sPeCTRUM™ . . . . . . . . . . . . . . . . . . . . . . . . . . . . . . . . . . . . . . . . . . . . . . . . . . . . . . . . . . . . . . . . . .14ULTRa RaInbOW FLUOResCenT PaRTICLes (bY sPheROTeCh™) . . . . . . . . . . . . . . . . . . . . . . . . . . . .14
Compensation . . . . . . . . . . . . . . . . . . . . . . . . . . . . . . . . . . . . . . . . . . . . . . . . . . . . . . . . . . . . . . . 15FITC / Pe COMPensaTIOn sTandaRd . . . . . . . . . . . . . . . . . . . . . . . . . . . . . . . . . . . . . . . . . . . . . . . . . . .15sIMPLY CeLLULaR® COMPensaTIOn sTandaRd . . . . . . . . . . . . . . . . . . . . . . . . . . . . . . . . . . . . . . . . . .16sIMPLY CeLLULaR® anTI-MOUse FOR VIOLeT LaseR . . . . . . . . . . . . . . . . . . . . . . . . . . . . . . . . . . . . . .17FLOW CYTOMeTRY PROTeIn a OR PROTeIn g anTIbOdY bIndIng beads . . . . . . . . . . . . . . . . . . . . .18VIabILITY dYe COMPensaTIOn sTandaRd . . . . . . . . . . . . . . . . . . . . . . . . . . . . . . . . . . . . . . . . . . . . . .18
FLuOrESCENCE QuANTiTATiON . . . . . . . . . . . . . . . . . . . . . . . . . . . . . . . . . . . . . .19Quantum™ mesF . . . . . . . . . . . . . . . . . . . . . . . . . . . . . . . . . . . . . . . . . . . . . . . . . . . . . . . . . . . . . 21Quantum™ simply CellulaR® . . . . . . . . . . . . . . . . . . . . . . . . . . . . . . . . . . . . . . . . . . . . . . . . . . 22simply CellulaR® . . . . . . . . . . . . . . . . . . . . . . . . . . . . . . . . . . . . . . . . . . . . . . . . . . . . . . . . . . . . 22QuiCkCal® analysis template . . . . . . . . . . . . . . . . . . . . . . . . . . . . . . . . . . . . . . . . . . . . . . . . . 23 QUICkCaL® anaLYsIs TeMPLaTe InsTRUCTIOns . . . . . . . . . . . . . . . . . . . . . . . . . . . . . . . . . . . . . . . . .24
AppLiCATiONS . . . . . . . . . . . . . . . . . . . . . . . . . . . . . . . . . . . . . . . . . . . .25Cell CyCle analysis . . . . . . . . . . . . . . . . . . . . . . . . . . . . . . . . . . . . . . . . . . . . . . . . . . . . . . . . . . 26
FLUOResCenCe ReFeRenCe sTandaRds. . . . . . . . . . . . . . . . . . . . . . . . . . . . . . . . . . . . . . . . . . . . . . . .26VIabILITY dYe COMPensaTIOn sTandaRd . . . . . . . . . . . . . . . . . . . . . . . . . . . . . . . . . . . . . . . . . . . . . .27VIaCheCk™ VIabILITY and COnCenTRaTIOn COnTROLs . . . . . . . . . . . . . . . . . . . . . . . . . . . . . . . . . . .27
Cell size estimation . . . . . . . . . . . . . . . . . . . . . . . . . . . . . . . . . . . . . . . . . . . . . . . . . . . . . . . . . 28sIze CaLIbRaTIOn sTandaRds kIT . . . . . . . . . . . . . . . . . . . . . . . . . . . . . . . . . . . . . . . . . . . . . . . . . . . .28sMaLL bead CaLIbRaTIOn kITs . . . . . . . . . . . . . . . . . . . . . . . . . . . . . . . . . . . . . . . . . . . . . . . . . . . . . . .28
Cell Counting . . . . . . . . . . . . . . . . . . . . . . . . . . . . . . . . . . . . . . . . . . . . . . . . . . . . . . . . . . . . . . . 29FLOW CYTOMeTRY absOLUTe COUnT sTandaRd™ . . . . . . . . . . . . . . . . . . . . . . . . . . . . . . . . . . . . . . .29sUReCOUnT™ PaRTICLe COUnT sTandaRds . . . . . . . . . . . . . . . . . . . . . . . . . . . . . . . . . . . . . . . . . . . .29
suspension aRRays . . . . . . . . . . . . . . . . . . . . . . . . . . . . . . . . . . . . . . . . . . . . . . . . . . . . . . . . . . 30QUanTUMPLex™ . . . . . . . . . . . . . . . . . . . . . . . . . . . . . . . . . . . . . . . . . . . . . . . . . . . . . . . . . . . . . . . . . . .30
TA B L E O F C O N T E N T S TA B L E O F C O N T E N T S
2 0 1 2 – 2 0 1 3 F L O W s U P P L e M e n T B A N G S L A B S . C O M2
QUanTUMPLex™ sP. . . . . . . . . . . . . . . . . . . . . . . . . . . . . . . . . . . . . . . . . . . . . . . . . . . . . . . . . . . . . . . . .31QUanTUMPLex™M . . . . . . . . . . . . . . . . . . . . . . . . . . . . . . . . . . . . . . . . . . . . . . . . . . . . . . . . . . . . . . . . . .31QUanTUMPLex™M sP . . . . . . . . . . . . . . . . . . . . . . . . . . . . . . . . . . . . . . . . . . . . . . . . . . . . . . . . . . . . . . .32
STANdArdS . . . . . . . . . . . . . . . . . . . . . . . . . . . . . . . . . . . . . . . . . . . . . .33Viability stanDaRDs . . . . . . . . . . . . . . . . . . . . . . . . . . . . . . . . . . . . . . . . . . . . . . . . . . . . . . . . . . 34 VIaCheCk™ VIabILITY and COnCenTRaTIOn InsTRUMenT sTandaRds . . . . . . . . . . . . . . . . . . . . . .34 VIabILITY dYe COMPensaTIOn sTandaRds . . . . . . . . . . . . . . . . . . . . . . . . . . . . . . . . . . . . . . . . . . . . .34
size stanDaRDs . . . . . . . . . . . . . . . . . . . . . . . . . . . . . . . . . . . . . . . . . . . . . . . . . . . . . . . . . . . . . . 35 nIsT TRaCeabLe PaRTICLe sIze sTandaRds . . . . . . . . . . . . . . . . . . . . . . . . . . . . . . . . . . . . . . . . . . . .35
suReCount™ paRtiCle Count stanDaRDs . . . . . . . . . . . . . . . . . . . . . . . . . . . . . . . . . . . . . . . 37
FluoResCenCe intensity stanDaRDs . . . . . . . . . . . . . . . . . . . . . . . . . . . . . . . . . . . . . . . . . . . 38 dRagOn gReen InTensITY sTandaRd . . . . . . . . . . . . . . . . . . . . . . . . . . . . . . . . . . . . . . . . . . . . . . . . .38 FLash Red InTensITY sTandaRd . . . . . . . . . . . . . . . . . . . . . . . . . . . . . . . . . . . . . . . . . . . . . . . . . . . . .39
staRlight™ CalibRation sliDes . . . . . . . . . . . . . . . . . . . . . . . . . . . . . . . . . . . . . . . . . . . . . . . . 40
iNdEX . . . . . . . . . . . . . . . . . . . . . . . . . . . . . . . . . . . . . . . . . . . . . . . . . .41
33 1 7 . 5 7 0 . 7 0 2 0 • 8 0 0 . 3 8 7 . 0 6 7 2
TA B L E O F C O N T E N T S TA B L E O F C O N T E N T S
Q U a L I T Y C O n T R O L
In flow cytometry, a comprehensive quality assurance program is essential for achieving accurate and consistent results within a study, and generating comparable data between instruments and laboratories. bangs Laboratories’ flow cytometry supplement includes instrument standards that support the various aspects of quality assurance programs, from general instrument QC to study-specific standardization.
ROUTIne QUaLITY COnTROL . . . . . . . . . . . . . . . . . . . . . . . . . . . . . . . . . . . . . . . . . . . . . . . . . . . . . .4FuLL SpECTruM™ . . . . . . . . . . . . . . . . . . . . . . . . . . . . . . . . . . . . . . . . . . . . . . . . . . . . . . . . . . . . . . . . . . . 5uLTrA rAiNBOw FLuOrESCENT pArTiCLES (By SphErOTECh™) . . . . . . . . . . . . . . . . . . . . . . . . . . . . . . . . . . 6FLuOrESCENCE rEFErENCE STANdArdS . . . . . . . . . . . . . . . . . . . . . . . . . . . . . . . . . . . . . . . . . . . . . . . . . . . 6
aLIgnMenT . . . . . . . . . . . . . . . . . . . . . . . . . . . . . . . . . . . . . . . . . . . . . . . . . . . . . . . . . . . . . . . . . . . .8riGhT rEFErENCE STANdArd™. . . . . . . . . . . . . . . . . . . . . . . . . . . . . . . . . . . . . . . . . . . . . . . . . . . . . . . . . . 8
LIneaRITY . . . . . . . . . . . . . . . . . . . . . . . . . . . . . . . . . . . . . . . . . . . . . . . . . . . . . . . . . . . . . . . . . . . . .9QuANTuM™ MESF . . . . . . . . . . . . . . . . . . . . . . . . . . . . . . . . . . . . . . . . . . . . . . . . . . . . . . . . . . . . . . . . . . . 9
TIMe deLaY . . . . . . . . . . . . . . . . . . . . . . . . . . . . . . . . . . . . . . . . . . . . . . . . . . . . . . . . . . . . . . . . . . .10TiME dELAy CALiBrATiON STANdArd . . . . . . . . . . . . . . . . . . . . . . . . . . . . . . . . . . . . . . . . . . . . . . . . . . . . . .10
2 0 1 2 – 2 0 1 3 F L O W s U P P L e M e n T B A N G S L A B S . C O M4
Q u A L i T y C O N T r O L Q u A L i T y C O N T r O L
routine Quality Control
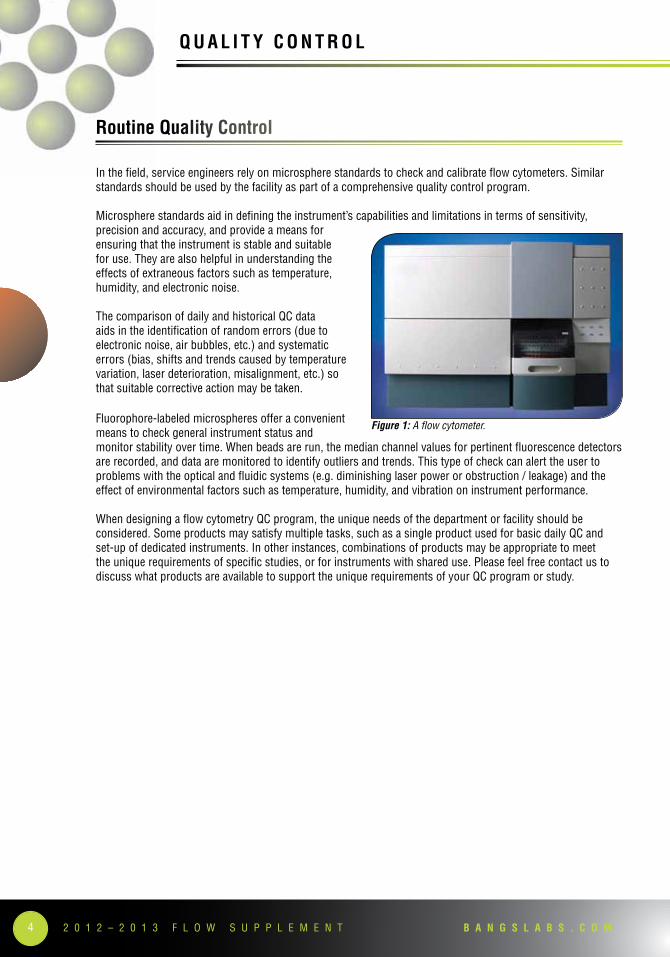
In the field, service engineers rely on microsphere standards to check and calibrate flow cytometers. similar standards should be used by the facility as part of a comprehensive quality control program.
Microsphere standards aid in defining the instrument’s capabilities and limitations in terms of sensitivity, precision and accuracy, and provide a means for ensuring that the instrument is stable and suitable for use. They are also helpful in understanding the effects of extraneous factors such as temperature, humidity, and electronic noise.
The comparison of daily and historical QC data aids in the identification of random errors (due to electronic noise, air bubbles, etc.) and systematic errors (bias, shifts and trends caused by temperature variation, laser deterioration, misalignment, etc.) so that suitable corrective action may be taken.
Fluorophore-labeled microspheres offer a convenient means to check general instrument status and monitor stability over time. When beads are run, the median channel values for pertinent fluorescence detectors are recorded, and data are monitored to identify outliers and trends. This type of check can alert the user to problems with the optical and fluidic systems (e.g. diminishing laser power or obstruction / leakage) and the effect of environmental factors such as temperature, humidity, and vibration on instrument performance.
When designing a flow cytometry QC program, the unique needs of the department or facility should be considered. some products may satisfy multiple tasks, such as a single product used for basic daily QC and set-up of dedicated instruments. In other instances, combinations of products may be appropriate to meet the unique requirements of specific studies, or for instruments with shared use. Please feel free contact us to discuss what products are available to support the unique requirements of your QC program or study.
Figure 1: a flow cytometer .
53 1 7 . 5 7 0 . 7 0 2 0 • 8 0 0 . 3 8 7 . 0 6 7 2
Q u A L i T y C O N T r O L Q u A L i T y C O N T r O L
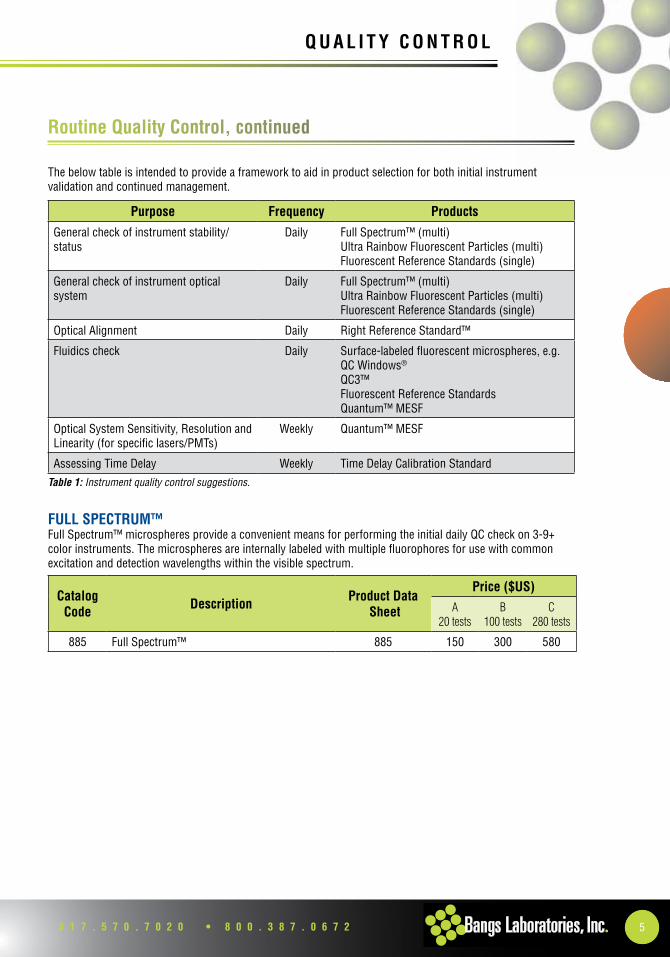
The below table is intended to provide a framework to aid in product selection for both initial instrument validation and continued management.
FuLL SpECTruM™Full spectrum™ microspheres provide a convenient means for performing the initial daily QC check on 3-9+ color instruments. The microspheres are internally labeled with multiple fluorophores for use with common excitation and detection wavelengths within the visible spectrum.
routine Quality Control, continued
Catalog Code
descriptionproduct data
Sheet
price ($uS)
A20 tests
B100 tests
C280 tests
885 Full spectrum™ 885 150 300 580
purpose Frequency products
general check of instrument stability/status
daily Full spectrum™ (multi)Ultra Rainbow Fluorescent Particles (multi)Fluorescent Reference standards (single)
general check of instrument optical system
daily Full spectrum™ (multi)Ultra Rainbow Fluorescent Particles (multi)Fluorescent Reference standards (single)
Optical alignment daily Right Reference standard™
Fluidics check daily surface-labeled fluorescent microspheres, e.g. QC Windows®
QC3™Fluorescent Reference standardsQuantum™ MesF
Optical system sensitivity, Resolution and Linearity (for specific lasers/PMTs)
Weekly Quantum™ MesF
assessing Time delay Weekly Time delay Calibration standard
Table 1: instrument quality control suggestions .
2 0 1 2 – 2 0 1 3 F L O W s U P P L e M e n T B A N G S L A B S . C O M6
Q u A L i T y C O N T r O L Q u A L i T y C O N T r O L
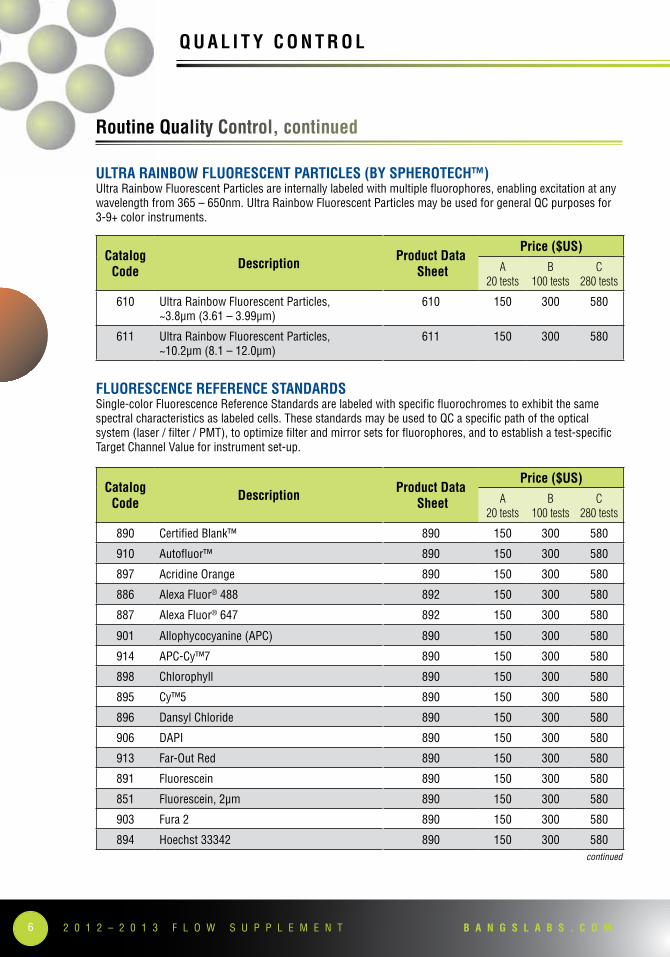
uLTrA rAiNBOw FLuOrESCENT pArTiCLES (By SphErOTECh™)Ultra Rainbow Fluorescent Particles are internally labeled with multiple fluorophores, enabling excitation at any wavelength from 365 – 650nm. Ultra Rainbow Fluorescent Particles may be used for general QC purposes for 3-9+ color instruments.
FLuOrESCENCE rEFErENCE STANdArdSsingle-color Fluorescence Reference standards are labeled with specific fluorochromes to exhibit the same spectral characteristics as labeled cells. These standards may be used to QC a specific path of the optical system (laser / filter / PMT), to optimize filter and mirror sets for fluorophores, and to establish a test-specific Target Channel Value for instrument set-up.
continued
Catalog Code
descriptionproduct data
Sheet
price ($uS)
A20 tests
B100 tests
C280 tests
890 Certified blank™ 890 150 300 580
910 autofluor™ 890 150 300 580
897 acridine Orange 890 150 300 580
886 alexa Fluor® 488 892 150 300 580
887 alexa Fluor® 647 892 150 300 580
901 allophycocyanine (aPC) 890 150 300 580
914 aPC-Cy™7 890 150 300 580
898 Chlorophyll 890 150 300 580
895 Cy™5 890 150 300 580
896 dansyl Chloride 890 150 300 580
906 daPI 890 150 300 580
913 Far-Out Red 890 150 300 580
891 Fluorescein 890 150 300 580
851 Fluorescein, 2µm 890 150 300 580
903 Fura 2 890 150 300 580
894 hoechst 33342 890 150 300 580
Catalog Code
descriptionproduct data
Sheet
price ($uS)
A20 tests
B100 tests
C280 tests
610 Ultra Rainbow Fluorescent Particles, ~3.8µm (3.61 – 3.99µm)
610 150 300 580
611 Ultra Rainbow Fluorescent Particles, ~10.2µm (8.1 – 12.0µm)
611 150 300 580
routine Quality Control, continued
73 1 7 . 5 7 0 . 7 0 2 0 • 8 0 0 . 3 8 7 . 0 6 7 2
Q u A L i T y C O N T r O L Q u A L i T y C O N T r O L
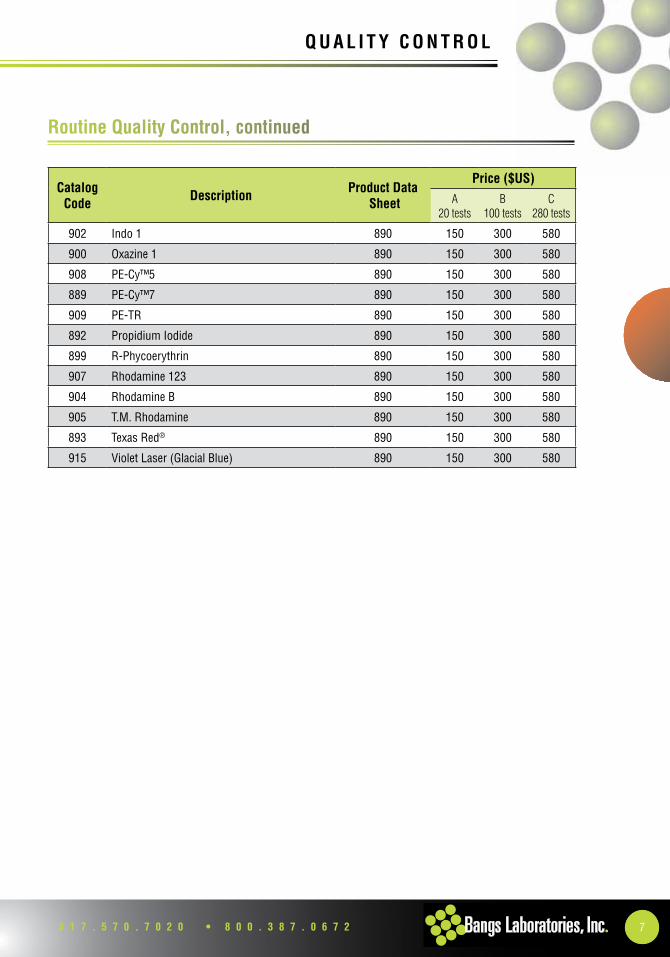
routine Quality Control, continued
Catalog Code
descriptionproduct data
Sheet
price ($uS)
A20 tests
B100 tests
C280 tests
902 Indo 1 890 150 300 580
900 Oxazine 1 890 150 300 580
908 Pe-Cy™5 890 150 300 580
889 Pe-Cy™7 890 150 300 580
909 Pe-TR 890 150 300 580
892 Propidium Iodide 890 150 300 580
899 R-Phycoerythrin 890 150 300 580
907 Rhodamine 123 890 150 300 580
904 Rhodamine b 890 150 300 580
905 T.M. Rhodamine 890 150 300 580
893 Texas Red® 890 150 300 580
915 Violet Laser (glacial blue) 890 150 300 580
2 0 1 2 – 2 0 1 3 F L O W s U P P L e M e n T B A N G S L A B S . C O M8
Q u A L i T y C O N T r O L Q u A L i T y C O N T r O L
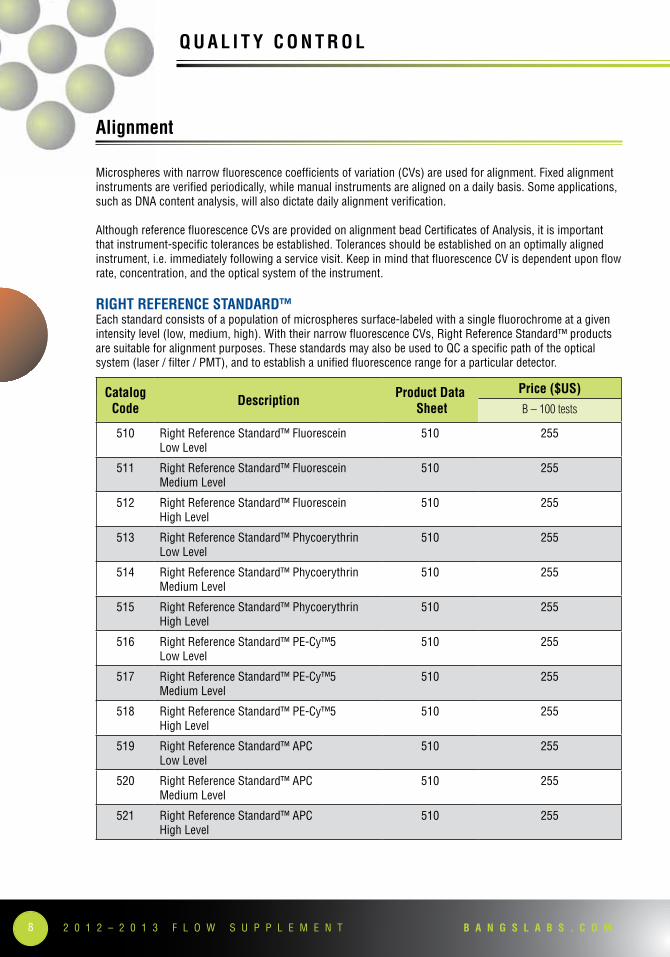
Microspheres with narrow fluorescence coefficients of variation (CVs) are used for alignment. Fixed alignment instruments are verified periodically, while manual instruments are aligned on a daily basis. some applications, such as dna content analysis, will also dictate daily alignment verification.
although reference fluorescence CVs are provided on alignment bead Certificates of analysis, it is important that instrument-specific tolerances be established. Tolerances should be established on an optimally aligned instrument, i.e. immediately following a service visit. keep in mind that fluorescence CV is dependent upon flow rate, concentration, and the optical system of the instrument.
riGhT rEFErENCE STANdArd™each standard consists of a population of microspheres surface-labeled with a single fluorochrome at a given intensity level (low, medium, high). With their narrow fluorescence CVs, Right Reference standard™ products are suitable for alignment purposes. These standards may also be used to QC a specific path of the optical system (laser / filter / PMT), and to establish a unified fluorescence range for a particular detector.
Catalog Code
descriptionproduct data
Sheet
price ($uS)
B – 100 tests
510 Right Reference standard™ Fluorescein Low Level
510 255
511 Right Reference standard™ Fluorescein Medium Level
510 255
512 Right Reference standard™ Fluorescein high Level
510 255
513 Right Reference standard™ Phycoerythrin Low Level
510 255
514 Right Reference standard™ Phycoerythrin Medium Level
510 255
515 Right Reference standard™ Phycoerythrin high Level
510 255
516 Right Reference standard™ Pe-Cy™5 Low Level
510 255
517 Right Reference standard™ Pe-Cy™5 Medium Level
510 255
518 Right Reference standard™ Pe-Cy™5 high Level
510 255
519 Right Reference standard™ aPC Low Level
510 255
520 Right Reference standard™ aPC Medium Level
510 255
521 Right Reference standard™ aPC high Level
510 255
Alignment
93 1 7 . 5 7 0 . 7 0 2 0 • 8 0 0 . 3 8 7 . 0 6 7 2
Q u A L i T y C O N T r O L Q u A L i T y C O N T r O L
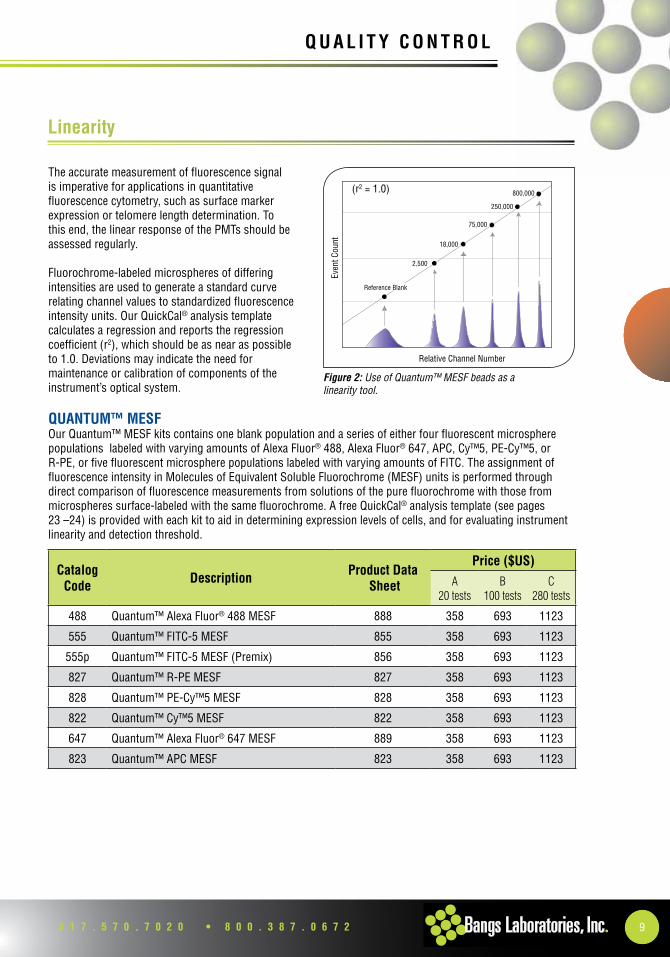
The accurate measurement of fluorescence signal is imperative for applications in quantitative fluorescence cytometry, such as surface marker expression or telomere length determination. To this end, the linear response of the PMTs should be assessed regularly.
Fluorochrome-labeled microspheres of differing intensities are used to generate a standard curve relating channel values to standardized fluorescence intensity units. Our QuickCal® analysis template calculates a regression and reports the regression coefficient (r2), which should be as near as possible to 1.0. deviations may indicate the need for maintenance or calibration of components of the instrument’s optical system.
QuANTuM™ MESFOur Quantum™ MesF kits contains one blank population and a series of either four fluorescent microsphere populations labeled with varying amounts of alexa Fluor® 488, alexa Fluor® 647, aPC, Cy™5, Pe-Cy™5, or R-Pe, or five fluorescent microsphere populations labeled with varying amounts of FITC. The assignment of fluorescence intensity in Molecules of equivalent soluble Fluorochrome (MesF) units is performed through direct comparison of fluorescence measurements from solutions of the pure fluorochrome with those from microspheres surface-labeled with the same fluorochrome. a free QuickCal® analysis template (see pages 23 –24) is provided with each kit to aid in determining expression levels of cells, and for evaluating instrument linearity and detection threshold.
Linearity
Catalog Code
descriptionproduct data
Sheet
price ($uS)
A20 tests
B100 tests
C280 tests
488 Quantum™ alexa Fluor® 488 MesF 888 358 693 1123
555 Quantum™ FITC-5 MesF 855 358 693 1123
555p Quantum™ FITC-5 MesF (Premix) 856 358 693 1123
827 Quantum™ R-Pe MesF 827 358 693 1123
828 Quantum™ Pe-Cy™5 MesF 828 358 693 1123
822 Quantum™ Cy™5 MesF 822 358 693 1123
647 Quantum™ alexa Fluor® 647 MesF 889 358 693 1123
823 Quantum™ aPC MesF 823 358 693 1123
Relative Channel Number
800,000
250,000
75,000
18,000
Reference Blank
Even
t Cou
nt
2,500
Figure 2: use of Quantum™ mesF beads as a linearity tool .
(r2 = 1.0)
2 0 1 2 – 2 0 1 3 F L O W s U P P L e M e n T B A N G S L A B S . C O M10
N O T E S N O T E S
Time delay
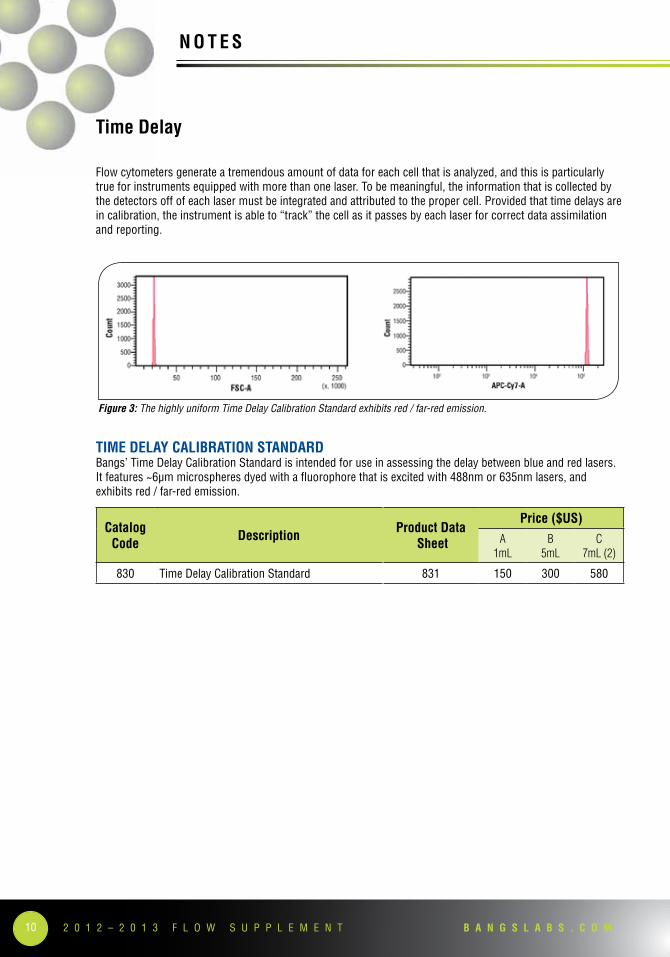
Flow cytometers generate a tremendous amount of data for each cell that is analyzed, and this is particularly true for instruments equipped with more than one laser. To be meaningful, the information that is collected by the detectors off of each laser must be integrated and attributed to the proper cell. Provided that time delays are in calibration, the instrument is able to “track” the cell as it passes by each laser for correct data assimilation and reporting.
TiME dELAy CALiBrATiON STANdArdbangs’ Time delay Calibration standard is intended for use in assessing the delay between blue and red lasers. It features ~6µm microspheres dyed with a fluorophore that is excited with 488nm or 635nm lasers, and exhibits red / far-red emission.
Catalog Code
descriptionproduct data
Sheet
price ($uS)
A1mL
B 5mL
C 7mL (2)
830 Time delay Calibration standard 831 150 300 580
Figure 3: the highly uniform time Delay Calibration standard exhibits red / far-red emission .
113 1 7 . 5 7 0 . 7 0 2 0 • 8 0 0 . 3 8 7 . 0 6 7 2
N O T E S N O T E S
I n s T R U M e n T s e T- U P
In flow cytometry, comprehensive standardization is particularly important for longitudinal studies and studies involving multiple instruments or centers. efforts to standardize should encompass reagent, protocols, instrument configuration, and, for qualitative analysis, fluorescence intensity units.
geneRaL InsTRUMenT seT-UP . . . . . . . . . . . . . . . . . . . . . . . . . . . . . . . . . . . . . . . . . . . . . . . . . . .12QC wiNdOwS® . . . . . . . . . . . . . . . . . . . . . . . . . . . . . . . . . . . . . . . . . . . . . . . . . . . . . . . . . . . . . . . . . . . . . .13QC3™ . . . . . . . . . . . . . . . . . . . . . . . . . . . . . . . . . . . . . . . . . . . . . . . . . . . . . . . . . . . . . . . . . . . . . . . . . . . .13FuLL SpECTruM™ . . . . . . . . . . . . . . . . . . . . . . . . . . . . . . . . . . . . . . . . . . . . . . . . . . . . . . . . . . . . . . . . . . .14uLTrA rAiNBOw FLuOrESCENT pArTiCLES (By SphErOTECh™) . . . . . . . . . . . . . . . . . . . . . . . . . . . . . . . . . .14
COMPensaTIOn . . . . . . . . . . . . . . . . . . . . . . . . . . . . . . . . . . . . . . . . . . . . . . . . . . . . . . . . . . . . . . .15FiTC / pE COMpENSATiON STANdArd . . . . . . . . . . . . . . . . . . . . . . . . . . . . . . . . . . . . . . . . . . . . . . . . . . . . . .15SiMpLy CELLuLAr® COMpENSATiON STANdArd . . . . . . . . . . . . . . . . . . . . . . . . . . . . . . . . . . . . . . . . . . . . . .16SiMpLy CELLuLAr® ANTi-MOuSE FOr viOLET LASEr . . . . . . . . . . . . . . . . . . . . . . . . . . . . . . . . . . . . . . . . . . .17FLOw CyTOMETry prOTEiN A Or prOTEiN G ANTiBOdy BiNdiNG BEAdS . . . . . . . . . . . . . . . . . . . . . . . . . . . . .18viABiLiTy dyE COMpENSATiON STANdArd . . . . . . . . . . . . . . . . . . . . . . . . . . . . . . . . . . . . . . . . . . . . . . . . . .18
Catalog Code
descriptionproduct data
Sheet
price ($uS)
A1mL
B 5mL
C 7mL (2)
830 Time delay Calibration standard 831 150 300 580
2 0 1 2 – 2 0 1 3 F L O W s U P P L e M e n T B A N G S L A B S . C O M12
i N S T r u M E N T S E T- u p i N S T r u M E N T S E T- u p
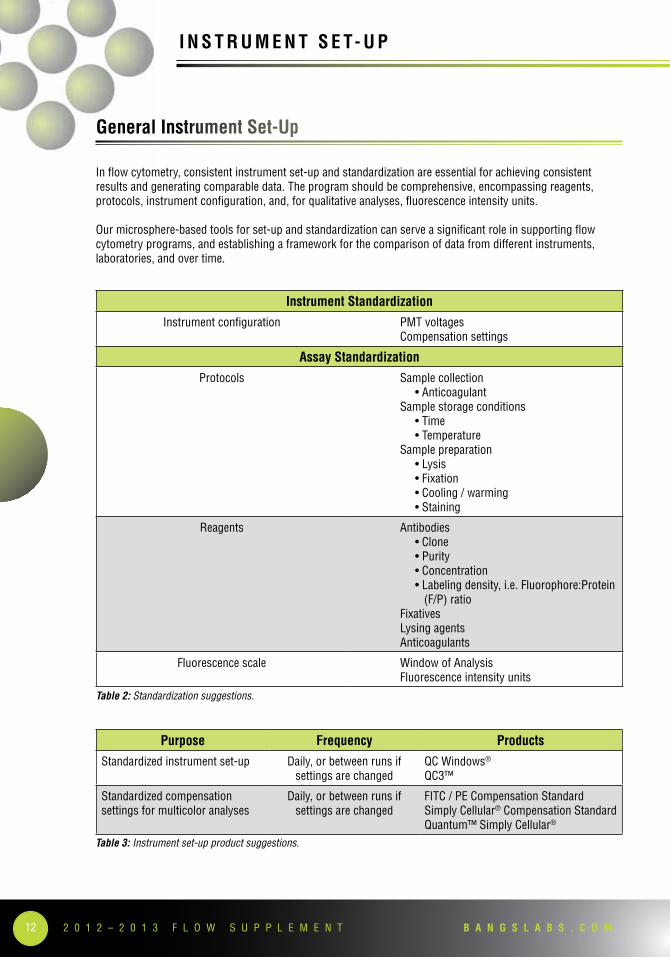
Table 2: standardization suggestions .
instrument Standardization
Instrument configuration PMT voltagesCompensation settings
Assay Standardization
Protocols sample collection • Anticoagulant sample storage conditions • Time • Temperature sample preparation • Lysis • Fixation • Cooling / warming • Staining
Reagents antibodies • Clone • Purity • Concentration • Labeling density, i.e. Fluorophore:Protein (F/P) ratio FixativesLysing agentsanticoagulants
Fluorescence scale Window of analysis Fluorescence intensity units
General instrument Set-up
In flow cytometry, consistent instrument set-up and standardization are essential for achieving consistent results and generating comparable data. The program should be comprehensive, encompassing reagents, protocols, instrument configuration, and, for qualitative analyses, fluorescence intensity units.
Our microsphere-based tools for set-up and standardization can serve a significant role in supporting flow cytometry programs, and establishing a framework for the comparison of data from different instruments, laboratories, and over time.
purpose Frequency products
standardized instrument set-up daily, or between runs if settings are changed
QC Windows® QC3™
standardized compensation settings for multicolor analyses
daily, or between runs if settings are changed
FITC / Pe Compensation standard simply Cellular® Compensation standard Quantum™ simply Cellular®
Table 3: instrument set-up product suggestions .
133 1 7 . 5 7 0 . 7 0 2 0 • 8 0 0 . 3 8 7 . 0 6 7 2
i N S T r u M E N T S E T- u p i N S T r u M E N T S E T- u p
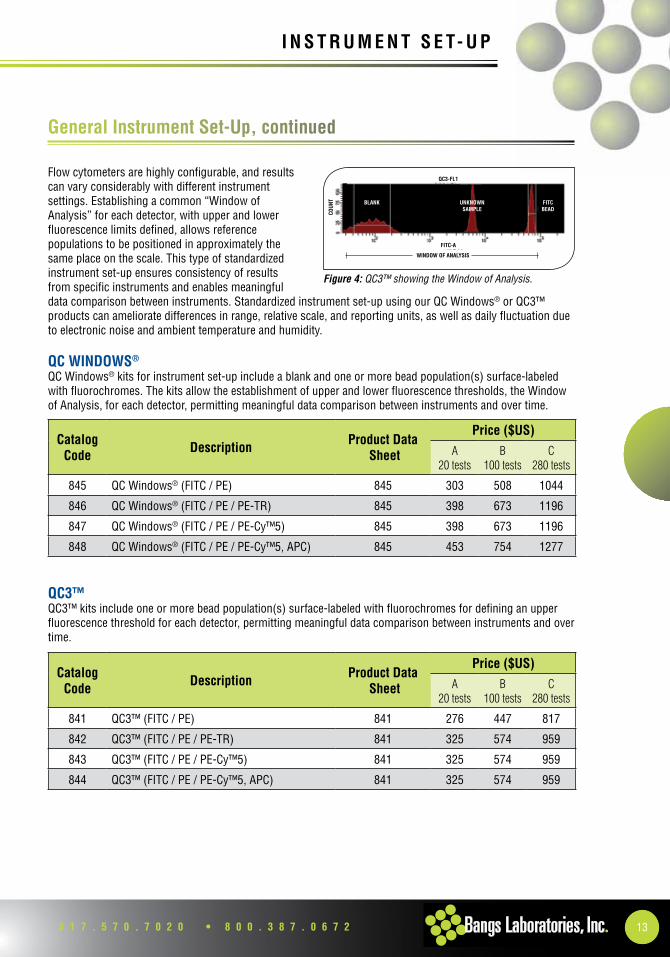
Flow cytometers are highly configurable, and results can vary considerably with different instrument settings. establishing a common “Window of analysis” for each detector, with upper and lower fluorescence limits defined, allows reference populations to be positioned in approximately the same place on the scale. This type of standardized instrument set-up ensures consistency of results from specific instruments and enables meaningful data comparison between instruments. standardized instrument set-up using our QC Windows® or QC3™ products can ameliorate differences in range, relative scale, and reporting units, as well as daily fluctuation due to electronic noise and ambient temperature and humidity.
QC wiNdOwS®
QC Windows® kits for instrument set-up include a blank and one or more bead population(s) surface-labeled with fluorochromes. The kits allow the establishment of upper and lower fluorescence thresholds, the Window of analysis, for each detector, permitting meaningful data comparison between instruments and over time.
QC3™QC3™ kits include one or more bead population(s) surface-labeled with fluorochromes for defining an upper fluorescence threshold for each detector, permitting meaningful data comparison between instruments and over time.
Catalog Code
descriptionproduct data
Sheet
price ($uS)
A20 tests
B100 tests
C280 tests
841 QC3™ (FITC / Pe) 841 276 447 817
842 QC3™ (FITC / Pe / Pe-TR) 841 325 574 959
843 QC3™ (FITC / Pe / Pe-Cy™5) 841 325 574 959
844 QC3™ (FITC / Pe / Pe-Cy™5, aPC) 841 325 574 959
Catalog Code
descriptionproduct data
Sheet
price ($uS)
A20 tests
B100 tests
C280 tests
845 QC Windows® (FITC / Pe) 845 303 508 1044
846 QC Windows® (FITC / Pe / Pe-TR) 845 398 673 1196
847 QC Windows® (FITC / Pe / Pe-Cy™5) 845 398 673 1196
848 QC Windows® (FITC / Pe / Pe-Cy™5, aPC) 845 453 754 1277
Figure 4: QC3™ showing the Window of analysis .
General instrument Set-up, continued
2 0 1 2 – 2 0 1 3 F L O W s U P P L e M e n T B A N G S L A B S . C O M14
i N S T r u M E N T S E T- u p i N S T r u M E N T S E T- u p
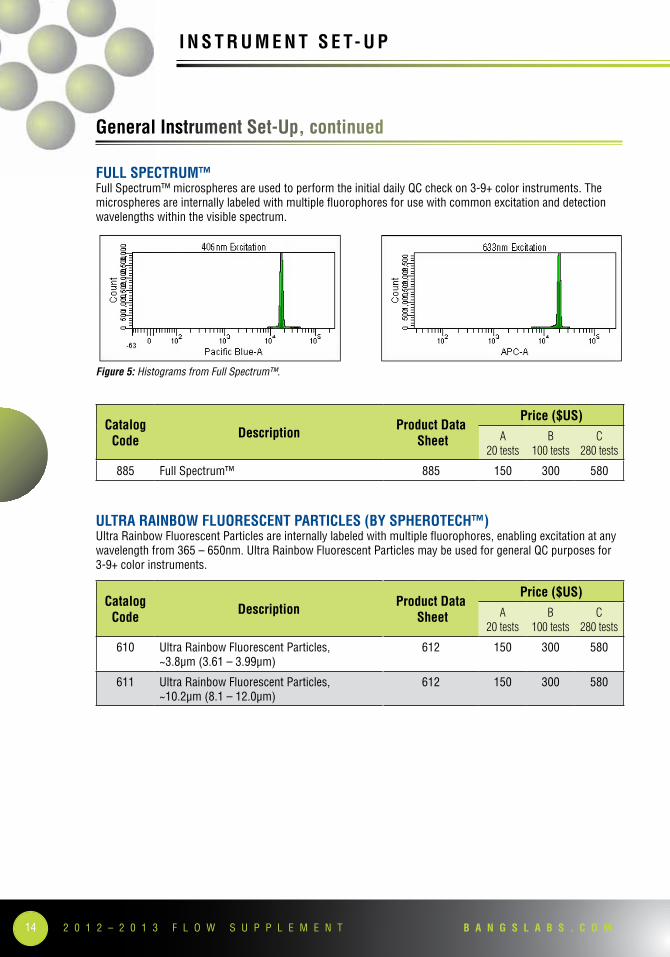
FuLL SpECTruM™Full spectrum™ microspheres are used to perform the initial daily QC check on 3-9+ color instruments. The microspheres are internally labeled with multiple fluorophores for use with common excitation and detection wavelengths within the visible spectrum.
uLTrA rAiNBOw FLuOrESCENT pArTiCLES (By SphErOTECh™)Ultra Rainbow Fluorescent Particles are internally labeled with multiple fluorophores, enabling excitation at any wavelength from 365 – 650nm. Ultra Rainbow Fluorescent Particles may be used for general QC purposes for 3-9+ color instruments.
General instrument Set-up, continued
Catalog Code
descriptionproduct data
Sheet
price ($uS)
A20 tests
B100 tests
C280 tests
610 Ultra Rainbow Fluorescent Particles, ~3.8µm (3.61 – 3.99µm)
612 150 300 580
611 Ultra Rainbow Fluorescent Particles, ~10.2µm (8.1 – 12.0µm)
612 150 300 580
Figure 5: histograms from Full spectrum™ .
Catalog Code
descriptionproduct data
Sheet
price ($uS)
A20 tests
B100 tests
C280 tests
885 Full spectrum™ 885 150 300 580
153 1 7 . 5 7 0 . 7 0 2 0 • 8 0 0 . 3 8 7 . 0 6 7 2
i N S T r u M E N T S E T- u p i N S T r u M E N T S E T- u p
Catalog Code
descriptionproduct data
Sheet
price ($uS)
A20 tests
B100 tests
C280 tests
610 Ultra Rainbow Fluorescent Particles, ~3.8µm (3.61 – 3.99µm)
612 150 300 580
611 Ultra Rainbow Fluorescent Particles, ~10.2µm (8.1 – 12.0µm)
612 150 300 580
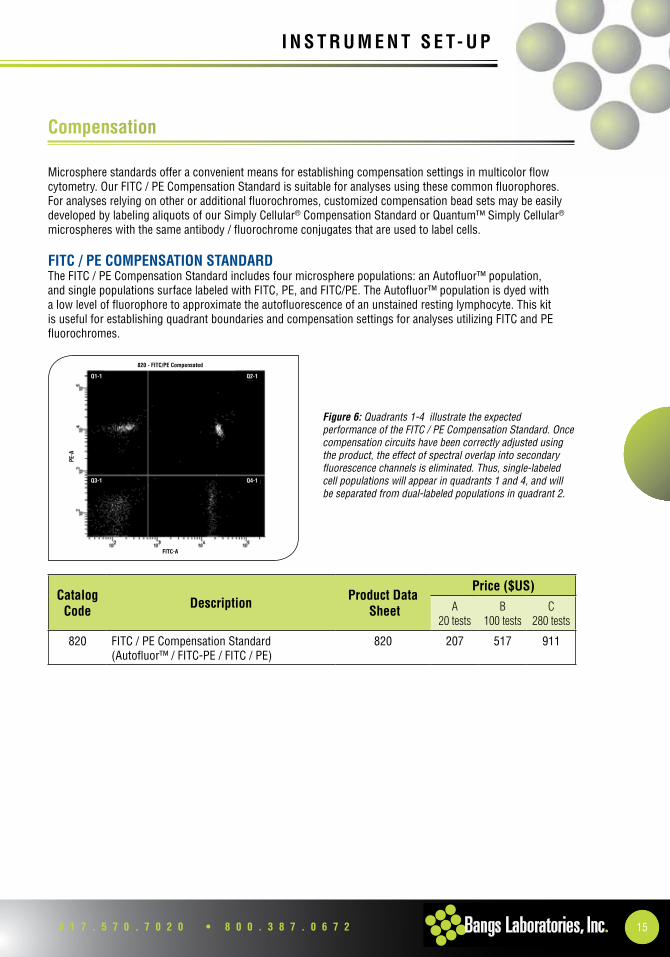
Microsphere standards offer a convenient means for establishing compensation settings in multicolor flow cytometry. Our FITC / Pe Compensation standard is suitable for analyses using these common fluorophores. For analyses relying on other or additional fluorochromes, customized compensation bead sets may be easily developed by labeling aliquots of our simply Cellular® Compensation standard or Quantum™ simply Cellular® microspheres with the same antibody / fluorochrome conjugates that are used to label cells.
FiTC / pE COMpENSATiON STANdArdThe FITC / PE Compensation Standard includes four microsphere populations: an Autofluor™ population, and single populations surface labeled with FITC, Pe, and FITC/Pe. The autofluor™ population is dyed with a low level of fluorophore to approximate the autofluorescence of an unstained resting lymphocyte. This kit is useful for establishing quadrant boundaries and compensation settings for analyses utilizing FITC and Pe fluorochromes.
820 - FITC/PE Compensated
FITC-A
PE-A
Q3-1 Q4-1
Q1-1 Q2-1
Figure 6: Quadrants 1-4 illustrate the expected performance of the FitC / pe Compensation standard . once compensation circuits have been correctly adjusted using the product, the effect of spectral overlap into secondary fluorescence channels is eliminated . thus, single-labeled cell populations will appear in quadrants 1 and 4, and will be separated from dual-labeled populations in quadrant 2 .
Catalog Code
descriptionproduct data
Sheet
price ($uS)
A20 tests
B100 tests
C280 tests
820 FITC / Pe Compensation standard (autofluor™ / FITC-Pe / FITC / Pe)
820 207 517 911
Compensation
2 0 1 2 – 2 0 1 3 F L O W s U P P L e M e n T B A N G S L A B S . C O M16
i N S T r u M E N T S E T- u p i N S T r u M E N T S E T- u p
SiMpLy CELLuLAr® COMpENSATiON STANdArdThe simply Cellular® Compensation standard includes a mixed population of low- and high-binding antibody-coated beads. Users label aliquots with antibody conjugates of interest to establish suitable compensation settings for a specific analysis.
Catalog Code
descriptionproduct data
Sheetprice ($uS)
B – 100 tests
550 simply Cellular® Compensation standard (anti-Mouse Igg)
850 255
551 simply Cellular® Compensation standard (anti-Rat Igg)
851 255
552 simply Cellular® Compensation standard (anti-human Igg)
852 255
Compensation, continued
173 1 7 . 5 7 0 . 7 0 2 0 • 8 0 0 . 3 8 7 . 0 6 7 2
i N S T r u M E N T S E T- u p i N S T r u M E N T S E T- u p
Catalog Code
descriptionproduct data
Sheetprice ($uS)
A – 20 tests B – 100 tests
835 simply Cellular® anti-Mouse for Violet Laser 835 266 448
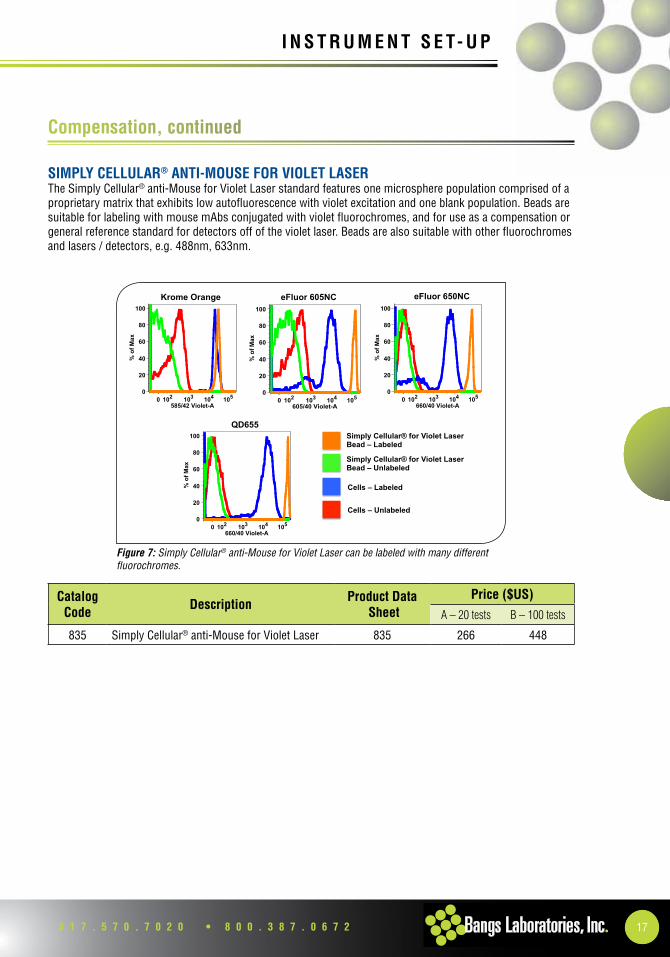
Figure 7: simply Cellular® anti-mouse for Violet laser can be labeled with many different fluorochromes .
0 102 103 104 105
585/42 Violet-A
0
20
40
60
80
100
% o
f Max
Krome Orange
0 102 103 104 105
660/40 Violet-A
0
20
40
60
80
100
% o
f Max
eFluor 650NC
0 102 103 104 105
660/40 Violet-A
0
20
40
60
80
100
% o
f Max
QD655
0 102 103 104 105
605/40 Violet-A
0
20
40
60
80
100
% o
f Max
eFluor 605NC
Simply Cellular® for Violet Laser Bead – Labeled
Simply Cellular® for Violet Laser Bead – Unlabeled
Cells – Labeled
Cells – Unlabeled
Compensation, continued
SiMpLy CELLuLAr® ANTi-MOuSE FOr viOLET LASErThe simply Cellular® anti-Mouse for Violet Laser standard features one microsphere population comprised of a proprietary matrix that exhibits low autofluorescence with violet excitation and one blank population. beads are suitable for labeling with mouse mabs conjugated with violet fluorochromes, and for use as a compensation or general reference standard for detectors off of the violet laser. beads are also suitable with other fluorochromes and lasers / detectors, e.g. 488nm, 633nm.
2 0 1 2 – 2 0 1 3 F L O W s U P P L e M e n T B A N G S L A B S . C O M18
i N S T r u M E N T S E T- u p i N S T r u M E N T S E T- u p
Compensation, continued
Catalog Code
descriptionproduct data
Sheet
price ($uS)
A20 tests
B100 tests
C280 tests
553 Flow Cytometry Protein a antibody binding beads
854 253 538 962
554 Flow Cytometry Protein g antibody binding beads
854 253 538 962
Catalog Code
descriptionproduct data
Sheet
price ($uS)
3mL
450 Viability dye Compensation standard, 4µm 853 326
451 Viability dye Compensation standard, 8µm 853 326
FLOw CyTOMETry prOTEiN A Or prOTEiN G ANTiBOdy BiNdiNG BEAdSsingle population Protein a or Protein g microspheres are suitable for labeling with conjugated antibodies from a range of hosts. Labeled microspheres may be used as single-population reference standards or in conjunction with an unlabeled population for compensation purposes.
viABiLiTy dyE COMpENSATiON STANdArdViability dye Compensation standards are suitable for labeling with LIVe / dead® stains or similarly-reactive dyes to generate compensation standards for flow cytometric analyses.
193 1 7 . 5 7 0 . 7 0 2 0 • 8 0 0 . 3 8 7 . 0 6 7 2
i N S T r u M E N T S E T- u p i N S T r u M E N T S E T- u p
Q U a n T I TaT I O n
bangs’ tools for quantitative flow cytometry provide the means to standardize fluorescence intensity measurements, thereby permitting truly quantitative analyses. Our products include Quantum™ MESF (Molecules of equivalent soluble Fluorochrome) and Quantum™ Simply Cellular® (abC, antibody binding Capacity) kits.
QUanTUM™ MesF . . . . . . . . . . . . . . . . . . . . . . . . . . . . . . . . . . . . . . . . . . . . . . . . . . . . . . . . . . . . .21QUanTUM™ sIMPLY CeLLULaR® . . . . . . . . . . . . . . . . . . . . . . . . . . . . . . . . . . . . . . . . . . . . . . . . . .22sIMPLY CeLLULaR® . . . . . . . . . . . . . . . . . . . . . . . . . . . . . . . . . . . . . . . . . . . . . . . . . . . . . . . . . . . .22QUICkCaL® anaLYsIs TeMPLaTe . . . . . . . . . . . . . . . . . . . . . . . . . . . . . . . . . . . . . . . . . . . . . . . . .23QuiCkCAL® ANALySiS TEMpLATE iNSTruCTiONS . . . . . . . . . . . . . . . . . . . . . . . . . . . . . . . . . . . . . . . . . . . . . .24
Catalog Code
descriptionproduct data
Sheet
price ($uS)
A20 tests
B100 tests
C280 tests
553 Flow Cytometry Protein a antibody binding beads
854 253 538 962
554 Flow Cytometry Protein g antibody binding beads
854 253 538 962
Catalog Code
descriptionproduct data
Sheet
price ($uS)
3mL
450 Viability dye Compensation standard, 4µm 853 326
451 Viability dye Compensation standard, 8µm 853 326
2 0 1 2 – 2 0 1 3 F L O W s U P P L e M e n T B A N G S L A B S . C O M20
Q u A N T i TAT i O N Q u A N T i TAT i O N
Fluorescence Quantitation
Fluorescence cytometry is an important tool for investigations in cell and molecular biology. This technology is routinely used for immunophenotyping and an expansive array of research applications, such as the study of protein phosphorylation and the determination of telomere length.
although fluorescence cytometry has proven to be a very powerful and versatile technology, it is not without limitations. notably, without a standardized measure of fluorescence intensity, results of analyses can be described only in relative terms, such as “negative,” “dim,” “intermediate,” and “bright,” or in arbitrary fluorescence intensity units. The interpretation of fluorescence intensity measurements can be further complicated by factors such as daily instrument variation, differences in hardware (laser power, filter sets), PMT settings, software, environmental factors such as buffer ph, and fluorochrome labeling density of antibodies (F/P ratio). Quantitative fluorescence analyses demand the highest level of standardization. however, cytometers lack internal calibrators for fluorescence intensity, and are limited to reporting results in relative terms.
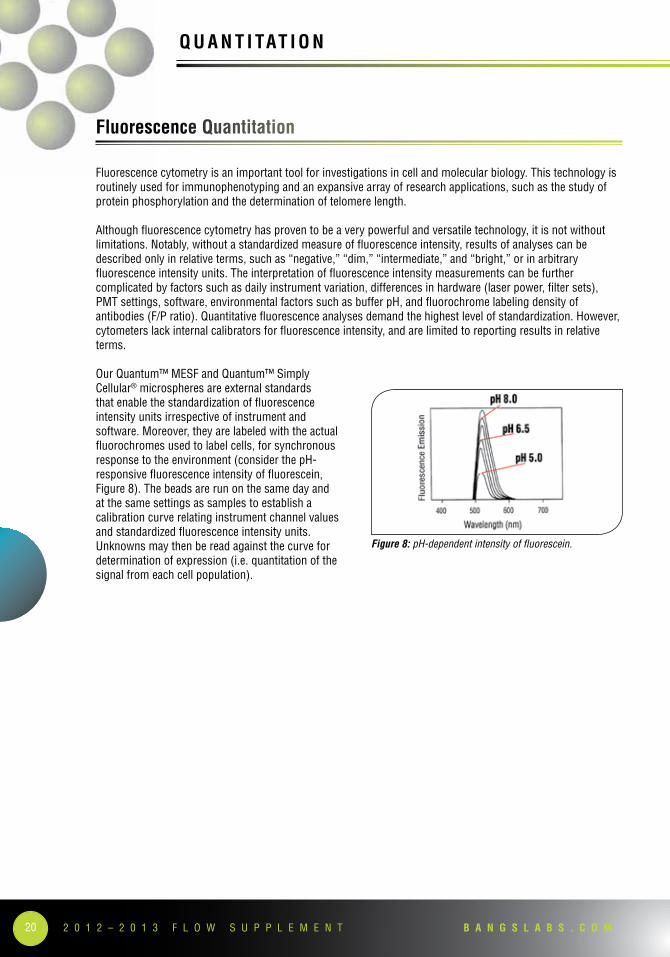
Our Quantum™ MesF and Quantum™ simply Cellular® microspheres are external standards that enable the standardization of fluorescence intensity units irrespective of instrument and software. Moreover, they are labeled with the actual fluorochromes used to label cells, for synchronous response to the environment (consider the ph-responsive fluorescence intensity of fluorescein, Figure 8). The beads are run on the same day and at the same settings as samples to establish a calibration curve relating instrument channel values and standardized fluorescence intensity units. Unknowns may then be read against the curve for determination of expression (i.e. quantitation of the signal from each cell population).
Figure 8: ph-dependent intensity of fluorescein .
213 1 7 . 5 7 0 . 7 0 2 0 • 8 0 0 . 3 8 7 . 0 6 7 2
Q u A N T i TAT i O N Q u A N T i TAT i O N
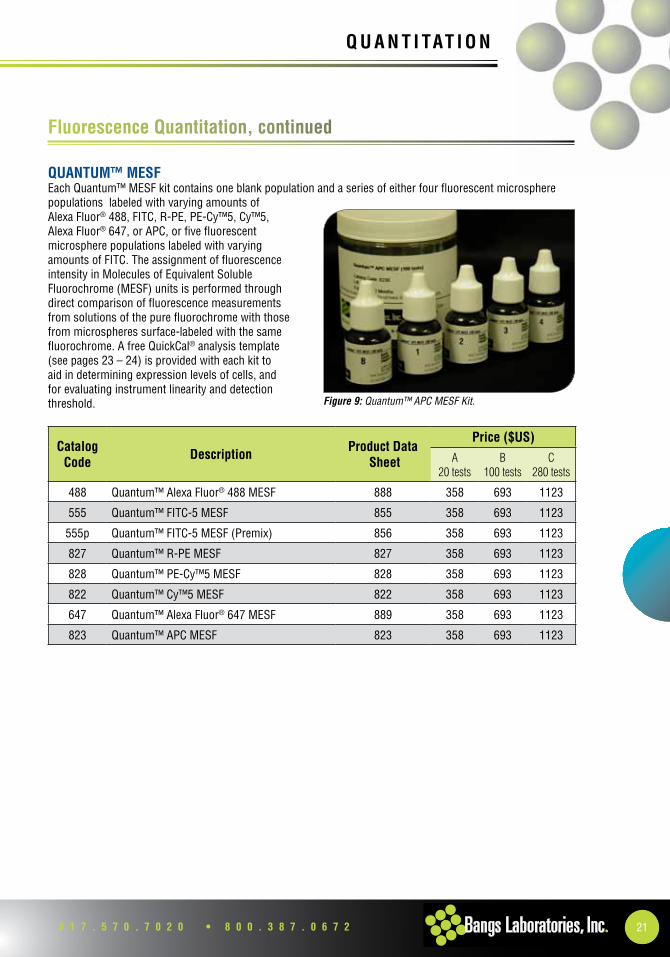
QuANTuM™ MESFeach Quantum™ MesF kit contains one blank population and a series of either four fluorescent microsphere populations labeled with varying amounts of alexa Fluor® 488, FITC, R-Pe, Pe-Cy™5, Cy™5, alexa Fluor® 647, or aPC, or five fluorescent microsphere populations labeled with varying amounts of FITC. The assignment of fluorescence intensity in Molecules of equivalent soluble Fluorochrome (MesF) units is performed through direct comparison of fluorescence measurements from solutions of the pure fluorochrome with those from microspheres surface-labeled with the same fluorochrome. a free QuickCal® analysis template (see pages 23 – 24) is provided with each kit to aid in determining expression levels of cells, and for evaluating instrument linearity and detection threshold.
Fluorescence Quantitation, continued
Figure 9: Quantum™ apC mesF kit .
Catalog Code
descriptionproduct data
Sheet
price ($uS)
A20 tests
B100 tests
C280 tests
488 Quantum™ alexa Fluor® 488 MesF 888 358 693 1123
555 Quantum™ FITC-5 MesF 855 358 693 1123
555p Quantum™ FITC-5 MesF (Premix) 856 358 693 1123
827 Quantum™ R-Pe MesF 827 358 693 1123
828 Quantum™ Pe-Cy™5 MesF 828 358 693 1123
822 Quantum™ Cy™5 MesF 822 358 693 1123
647 Quantum™ alexa Fluor® 647 MesF 889 358 693 1123
823 Quantum™ aPC MesF 823 358 693 1123
2 0 1 2 – 2 0 1 3 F L O W s U P P L e M e n T B A N G S L A B S . C O M22
Q u A N T i TAT i O N Q u A N T i TAT i O N
Catalog Code
descriptionproduct data
Sheet
price ($uS)
A20 tests
B100 tests
C280 tests
815 Quantum™ simply Cellular® anti-Mouse Igg 814 453 754 1277
816 Quantum™ simply Cellular® anti-human Igg 814 453 754 1277
817 Quantum™ simply Cellular® anti-Rat Igg 814 453 754 1277
QuANTuM™ SiMpLy CELLuLAr®
Quantum™ simply Cellular® (QSC) kits are comprised of five microsphere populations: one blank and four labeled with increasing amounts of antibody. each coated population binds a specific number of monoclonal antibodies of the noted species, which is equal to its antibody binding Capacity (abC) value. The investigator labels QsC beads using the same antibodies used to stain cells. In addition to quantitative fluorescence cytometry, QsC kits may be used for compensation. a free QuickCal® analysis template is provided with each kit to aid in determining expression levels of cells, and for evaluating instrument linearity and detection threshold.
SiMpLy CELLuLAr®
Our simply Cellular® standard consists of a single population of antibody-coated microspheres of known antibody binding Capacity (abC). The population is stained with the user’s primary antibody and used in conjunction with a suitable Quantum™ MesF kit for determination of the antibody’s effective Fluorophore / Protein (F/P) ratio. This standard may also be used to QC the fluorescence intensity of different antibody lots or clones.
Fluorescence Quantitation, continued
Catalog Code
descriptionproduct data
Sheet
price ($uS)
A20 tests
B100 tests
C280 tests
810 simply Cellular® anti-Mouse Igg 810 253 538 962
812 simply Cellular® anti-human Igg 812 253 538 962
813 simply Cellular® anti-Rat Igg 813 253 538 962
☞ QsC and sC standards are available for use with mouse (Cat . #815 and #810), rat (Cat . #817 and #813), and human (Cat . #816 and #812) monoclonal antibodies . For example, the anti-mouse kit is intended to bind mouse mabs, not for the analysis of mouse cells .
233 1 7 . 5 7 0 . 7 0 2 0 • 8 0 0 . 3 8 7 . 0 6 7 2
Q u A N T i TAT i O N Q u A N T i TAT i O N
Catalog Code
descriptionproduct data
Sheet
price ($uS)
A20 tests
B100 tests
C280 tests
815 Quantum™ simply Cellular® anti-Mouse Igg 814 453 754 1277
816 Quantum™ simply Cellular® anti-human Igg 814 453 754 1277
817 Quantum™ simply Cellular® anti-Rat Igg 814 453 754 1277
Catalog Code
descriptionproduct data
Sheet
price ($uS)
A20 tests
B100 tests
C280 tests
810 simply Cellular® anti-Mouse Igg 810 253 538 962
812 simply Cellular® anti-human Igg 812 253 538 962
813 simply Cellular® anti-Rat Igg 813 253 538 962
QuickCal® Analysis Template
QuiCkCAL® ANALySiS TEMpLATEbangs’ tools for quantitative flow cytometry provide the means to standardize fluorescence intensity measurements, thereby permitting truly quantitative analyses. Our products include Quantum™ MesF (Molecules of equivalent soluble Fluorochrome) and Quantum™ simply Cellular® (abC, antibody binding Capacity) kits. Fluorochrome-labeled microspheres are used to generate a standard curve relating fluorescence intensity to standardized MesF or abC values from Quantum™ MesF or Quantum™ simply Cellular® beads. The MesF or abC values of labeled cell samples may be determined by measuring their fluorescence intensities, and “reading” the corresponding MesF or abC values from the standard curve using the QuickCal® analysis template that is provided with the kit.
Bangs’ Quantum™ kits are uniquely qualified for applications in quantitative fluorescence cytometry:
• Precise MESF or ABC values are assigned to bead populations through meticulous primary calibrations.• MESF and ABC values provide standardized units of fluorescence intensity. The MESF unit has been
formally adopted by nIsT and nCCLs as a standardized measure of fluorescence intensity.• Quantum™ microspheres are labeled with the actual fluorochromes used in flow cytometry, ensuring that
quantitative assignments are truly relevant. • Surface-labeled microspheres are environmentally-responsive; the fluorochrome on the bead responds
to the buffer (ph, ionic strength) in the same manner as the fluorochrome on the labeled cell. The fluorescence intensity of beads thus mirrors that of cells, preserving the calibration when quantitative assignments are made.
2 0 1 2 – 2 0 1 3 F L O W s U P P L e M e n T B A N G S L A B S . C O M24
Q u A N T i TAT i O N Q u A N T i TAT i O N
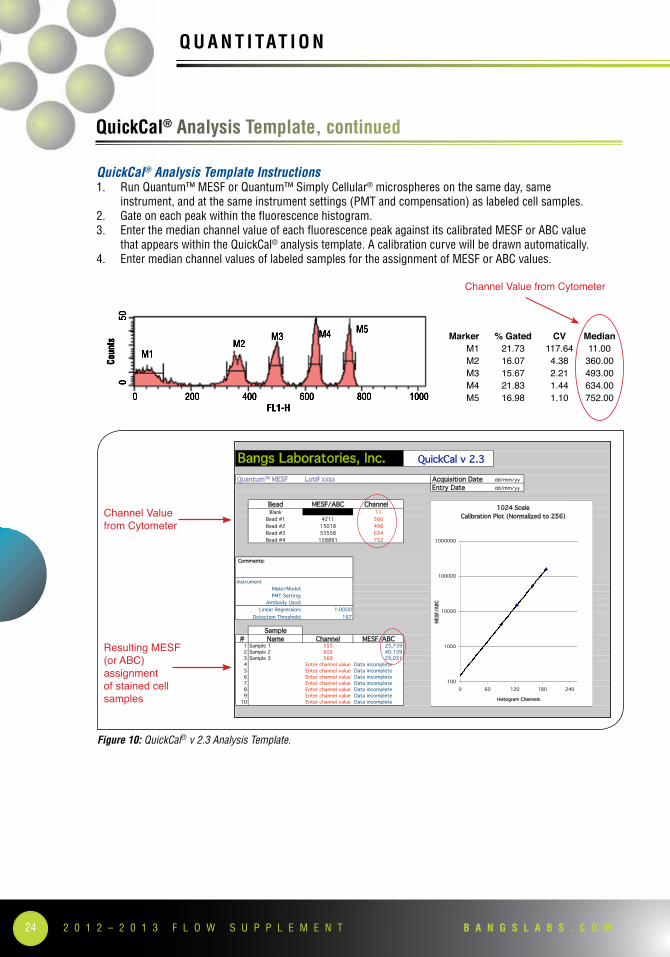
Figure 10: QuickCal® v 2 .3 analysis template .
Resulting MESF (or ABC) assignment of stained cell samples
Bangs Laboratories, Inc. QuickCal v 2.3
Quantum™ MESF Lot# xxxx Acquisition Date dd/mm/yy
Entry Date dd/mm/yy
Bead MESF/ABC Channel Rqd beads 4 Mod Factor 4Blank 0 11 2.75 x^2 log(y) log(y)^2 x*log(y)
Bead #1 4211 360 90 8100 3.624385 13.1362 326.19
Bead #2 15018 496 124 15376 4.176612 17.4441 517.9
Bead #3 53558 634 158.5 25122.3 4.728824 22.3618 749.52
Bead #4 158861 752 188 35344 5.201017 27.0506 977.79
560.5 83942.3 17.73084 79.9926 2571.4
Comments:
count 4
Instrument
Make/Model:
PMT Setting: m= 0.01608
Antibody Used: b= 2.17941
Linear Regression: 1.0000 corr= 0.99999
Detection Threshold: 167
Sample
# Name Channel MESF/ABC Mod Chan1 Sample 1 555 25,739 138.75
2 Sample 2 603 40,139 150.75
3 Sample 3 568 29,031 142
4 Enter channel value Data incomplete #VALUE!
5 Enter channel value Data incomplete #VALUE!
6 Enter channel value Data incomplete #VALUE!
7 Enter channel value Data incomplete #VALUE!
8 Enter channel value Data incomplete #VALUE!
9 Enter channel value Data incomplete #VALUE!
10 Enter channel value Data incomplete #VALUE!
1024 Scale
Calibration Plot (Normalized to 256)
100
1000
10000
100000
1000000
0 60 120 180 240
Histogram Channels
MESF/A
BC
Channel Value from Cytometer
M1M2
M3 M4 M5
FL1-h
Coun
ts
0 200 400 600 800 1000
050
Channel Value from Cytometer
Marker % Gated CV Median M1 21.73 117.64 11.00 M2 16.07 4.38 360.00 M3 15.67 2.21 493.00 M4 21.83 1.44 634.00 M5 16.98 1.10 752.00
QuickCal® Analysis Template Instructions1. Run Quantum™ MesF or Quantum™ simply Cellular® microspheres on the same day, same
instrument, and at the same instrument settings (PMT and compensation) as labeled cell samples.2. gate on each peak within the fluorescence histogram.3. enter the median channel value of each fluorescence peak against its calibrated MesF or abC value
that appears within the QuickCal® analysis template. a calibration curve will be drawn automatically.4. enter median channel values of labeled samples for the assignment of MesF or abC values.
QuickCal® Analysis Template, continued
253 1 7 . 5 7 0 . 7 0 2 0 • 8 0 0 . 3 8 7 . 0 6 7 2
Q u A N T i TAT i O N Q u A N T i TAT i O N
a P P L I C aT I O n s
Current applications in flow cytometry extend far beyond traditional lymphocyte immunophenotyping. Flow cytometry is used for such varied applications as cell cycle analysis, telomere length determination, microparticle analysis, and in phagocytosis and many other studies.
CeLL CYCLe anaLYsIs . . . . . . . . . . . . . . . . . . . . . . . . . . . . . . . . . . . . . . . . . . . . . . . . . . . . . . . . . .26FLuOrESCENCE rEFErENCE STANdArdS . . . . . . . . . . . . . . . . . . . . . . . . . . . . . . . . . . . . . . . . . . . . . . . . . . .26viABiLiTy dyE COMpENSATiON STANdArd . . . . . . . . . . . . . . . . . . . . . . . . . . . . . . . . . . . . . . . . . . . . . . . . . .27viAChECk™ viABiLiTy ANd CONCENTrATiON CONTrOLS . . . . . . . . . . . . . . . . . . . . . . . . . . . . . . . . . . . . . . . .27
CeLL sIze esTIMaTIOn. . . . . . . . . . . . . . . . . . . . . . . . . . . . . . . . . . . . . . . . . . . . . . . . . . . . . . . . . .28SizE CALiBrATiON STANdArdS kiT . . . . . . . . . . . . . . . . . . . . . . . . . . . . . . . . . . . . . . . . . . . . . . . . . . . . . . .28SMALL BEAd CALiBrATiON kiTS . . . . . . . . . . . . . . . . . . . . . . . . . . . . . . . . . . . . . . . . . . . . . . . . . . . . . . . . . .28
CeLL COUnTIng . . . . . . . . . . . . . . . . . . . . . . . . . . . . . . . . . . . . . . . . . . . . . . . . . . . . . . . . . . . . . . .29FLOw CyTOMETry ABSOLuTE COuNT STANdArd™ . . . . . . . . . . . . . . . . . . . . . . . . . . . . . . . . . . . . . . . . . . . .29SurECOuNT™ pArTiCLE COuNT STANdArdS . . . . . . . . . . . . . . . . . . . . . . . . . . . . . . . . . . . . . . . . . . . . . . . .29
sUsPensIOn aRRaYs . . . . . . . . . . . . . . . . . . . . . . . . . . . . . . . . . . . . . . . . . . . . . . . . . . . . . . . . . .30QuANTuMpLEX™ . . . . . . . . . . . . . . . . . . . . . . . . . . . . . . . . . . . . . . . . . . . . . . . . . . . . . . . . . . . . . . . . . . . .30QuANTuMpLEX™ Sp . . . . . . . . . . . . . . . . . . . . . . . . . . . . . . . . . . . . . . . . . . . . . . . . . . . . . . . . . . . . . . . . . .31QuANTuMpLEX™M . . . . . . . . . . . . . . . . . . . . . . . . . . . . . . . . . . . . . . . . . . . . . . . . . . . . . . . . . . . . . . . . . . .31QuANTuMpLEX™M Sp . . . . . . . . . . . . . . . . . . . . . . . . . . . . . . . . . . . . . . . . . . . . . . . . . . . . . . . . . . . . . . . .32
2 0 1 2 – 2 0 1 3 F L O W s U P P L e M e n T B A N G S L A B S . C O M26
A p p L i C AT i O N S A p p L i C AT i O N S
Cell Cycle Analysis
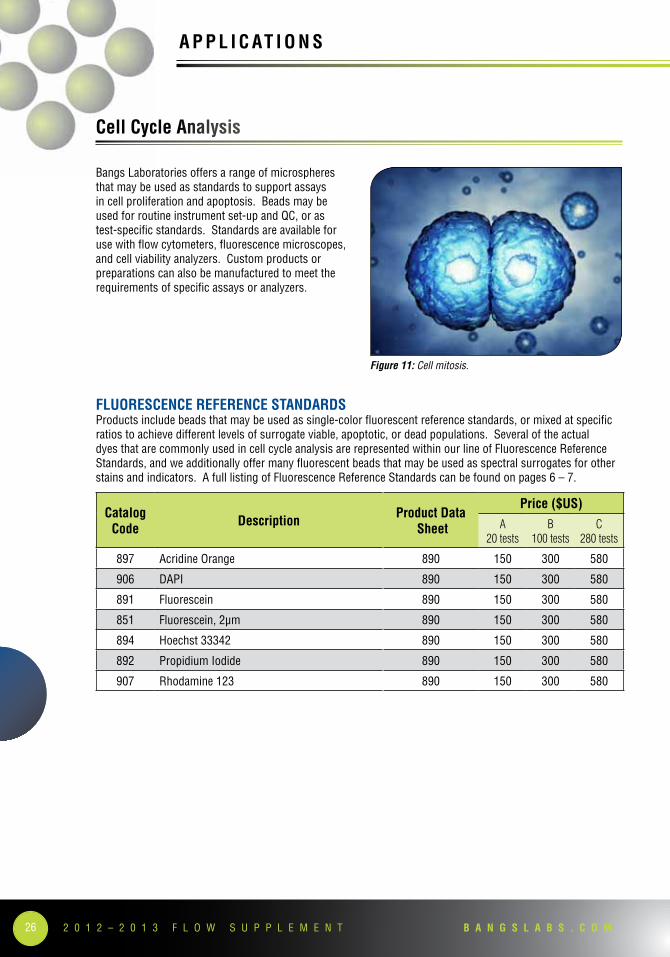
bangs Laboratories offers a range of microspheres that may be used as standards to support assays in cell proliferation and apoptosis. beads may be used for routine instrument set-up and QC, or as test-specific standards. standards are available for use with flow cytometers, fluorescence microscopes, and cell viability analyzers. Custom products or preparations can also be manufactured to meet the requirements of specific assays or analyzers.
FLuOrESCENCE rEFErENCE STANdArdSProducts include beads that may be used as single-color fluorescent reference standards, or mixed at specific ratios to achieve different levels of surrogate viable, apoptotic, or dead populations. several of the actual dyes that are commonly used in cell cycle analysis are represented within our line of Fluorescence Reference standards, and we additionally offer many fluorescent beads that may be used as spectral surrogates for other stains and indicators. a full listing of Fluorescence Reference standards can be found on pages 6 – 7.
Catalog Code
descriptionproduct data
Sheet
price ($uS)
A20 tests
B100 tests
C280 tests
897 acridine Orange 890 150 300 580
906 daPI 890 150 300 580
891 Fluorescein 890 150 300 580
851 Fluorescein, 2µm 890 150 300 580
894 hoechst 33342 890 150 300 580
892 Propidium Iodide 890 150 300 580
907 Rhodamine 123 890 150 300 580
Figure 11: Cell mitosis .
273 1 7 . 5 7 0 . 7 0 2 0 • 8 0 0 . 3 8 7 . 0 6 7 2
A p p L i C AT i O N S A p p L i C AT i O N S
Cell Cycle Analysis, continued
viABiLiTy dyE COMpENSATiON STANdArdViability dye Compensation standards are suitable for labeling with LIVe / dead® stains or other amine-reactive dyes to generate compensation or general reference standards for flow cytometric analyses. beads are available in two diameters that approximate the sizes of common cell populations.
viAChECk™ viABiLiTy ANd CONCENTrATiON CONTrOLSOur ViaCheck™ microsphere standards mimic the optical characteristics of live (undyed) and dead (blue dyed) cells in the trypan blue dye exclusion method. non-biological surrogates remove the need for significant sample preparation, and offer exceptional stability and reproducibility. ViaCheck™ microsphere standards are pre-stained, and need only be loaded into the analyzer for confirmation of live / dead ratios and counts.
Catalog Code
descriptionproduct data
Sheet
price ($uS)
20mL
VC10b ViaCheck™ 0% Viability Control 706 379
VC20b ViaCheck™ 50% Viability Control 707 379
VC30b ViaCheck™ 75% Viability Control 708 379
VC40b ViaCheck™ 90% Viability Control 709 379
VC50b ViaCheck™ 100% Viability Control 710 379
VC60n ViaCheck™ Concentration Control (1 x 10⁶) 711 163
VC70n ViaCheck™ Concentration Control (4 x 10⁶) 712 238
VC80n ViaCheck™ Concentration Control (8 x 10⁶) 713 301
Catalog Code
descriptionproduct data
Sheet
price ($uS)
3mL
450 Viability dye Compensation standard, 4µm 853 326
451 Viability dye Compensation standard, 8µm 853 326
2 0 1 2 – 2 0 1 3 F L O W s U P P L e M e n T B A N G S L A B S . C O M28
A p p L i C AT i O N S A p p L i C AT i O N S
Flow cytometry can be a useful tool for the estimation of cell size, as forward angle light scatter (FsC) measurements are proportional to the cross-sectional area of cells. FsC data from microspheres of known size may be compared to unknown samples to estimate cell size, and can also be used to generate calibration curves for quality control purposes.
SizE CALiBrATiON STANdArdS kiTThe size Calibration standards kit is comprised of five populations of undyed microspheres in the range of ~4 – 12µm. Forward scatter channel (FsC) values may be plotted against reported bead diameter to generate a curve that may be used for estimation of the sizes of cells run at the same instrument settings.
SMALL BEAd CALiBrATiON kiTSsome current applications in flow cytometry extend far beyond traditional lymphocyte immunophenotyping, with some involving the analysis of very small particles such as platelet- and endothelial-derived microparticles or microbial species. The small bead Calibration kits allow operators to verify the resolution capabilities of the flow cytometer, and to establish appropriate instrument settings for the analyses.
Cell Size Estimation
Catalog Code
descriptionproduct data
Sheetprice ($uS)
B – 5mL C – 14mL
829 size Calibration standards kit 829 372 660
Catalog Code
descriptionproduct data
Sheetprice ($uS)
3mL
832 Submicron Bead Calibration Kit • 0.2µm, 0.5µm, 0.8µm
832 224
833 Micron Bead Calibration Kit • 1.0µm, 3.0µm, 6.0µm
832 224
293 1 7 . 5 7 0 . 7 0 2 0 • 8 0 0 . 3 8 7 . 0 6 7 2
A p p L i C AT i O N S A p p L i C AT i O N S
Cell Counting
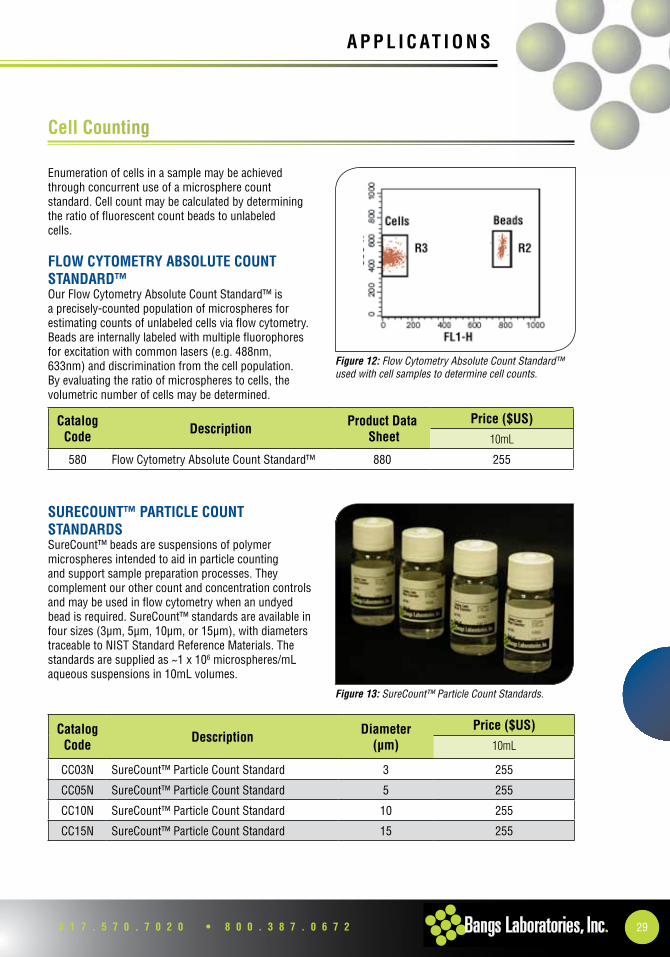
enumeration of cells in a sample may be achieved through concurrent use of a microsphere count standard. Cell count may be calculated by determining the ratio of fluorescent count beads to unlabeled cells.
FLOw CyTOMETry ABSOLuTE COuNT STANdArd™Our Flow Cytometry absolute Count standard™ is a precisely-counted population of microspheres for estimating counts of unlabeled cells via flow cytometry. beads are internally labeled with multiple fluorophores for excitation with common lasers (e.g. 488nm, 633nm) and discrimination from the cell population. by evaluating the ratio of microspheres to cells, the volumetric number of cells may be determined.
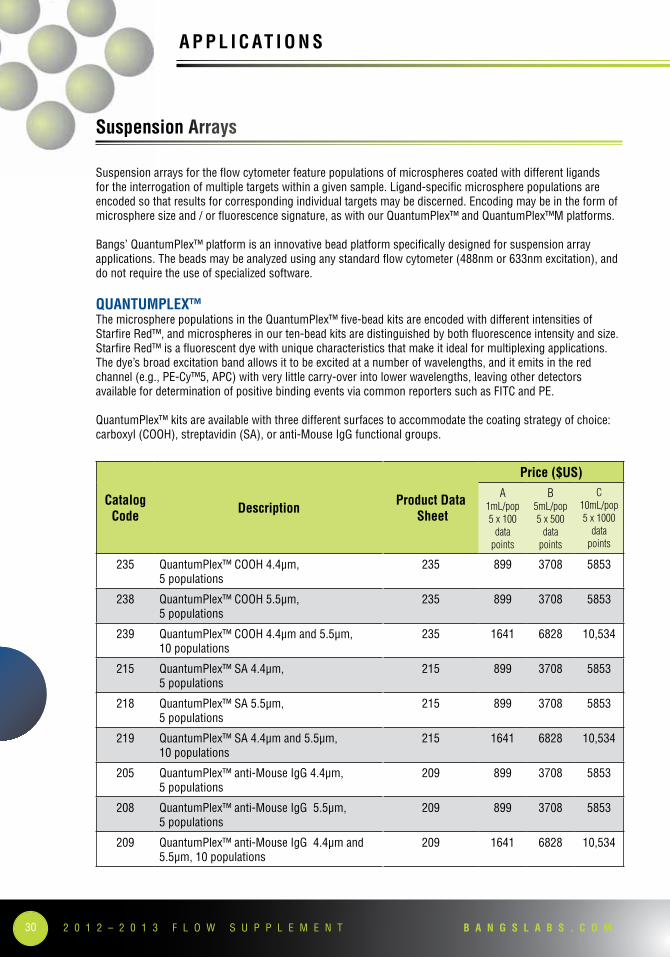
SurECOuNT™ pArTiCLE COuNT STANdArdSsureCount™ beads are suspensions of polymer microspheres intended to aid in particle counting and support sample preparation processes. They complement our other count and concentration controls and may be used in flow cytometry when an undyed bead is required. sureCount™ standards are available in four sizes (3µm, 5µm, 10µm, or 15µm), with diameters traceable to nIsT standard Reference Materials. The standards are supplied as ~1 x 10⁶ microspheres/mL aqueous suspensions in 10mL volumes. Figure 13: sureCount™ particle Count standards .
Catalog Code
descriptiondiameter
(µm)
price ($uS)
10mL
CC03n sureCount™ Particle Count standard 3 255
CC05n sureCount™ Particle Count standard 5 255
CC10n sureCount™ Particle Count standard 10 255
CC15n sureCount™ Particle Count standard 15 255
Figure 12: Flow Cytometry absolute Count standard™ used with cell samples to determine cell counts .
Catalog Code
descriptionproduct data
Sheetprice ($uS)
10mL
580 Flow Cytometry absolute Count standard™ 880 255
2 0 1 2 – 2 0 1 3 F L O W s U P P L e M e n T B A N G S L A B S . C O M30
A p p L i C AT i O N S A p p L i C AT i O N S
Suspension Arrays
suspension arrays for the flow cytometer feature populations of microspheres coated with different ligands for the interrogation of multiple targets within a given sample. Ligand-specific microsphere populations are encoded so that results for corresponding individual targets may be discerned. encoding may be in the form of microsphere size and / or fluorescence signature, as with our QuantumPlex™ and QuantumPlex™M platforms.
bangs’ QuantumPlex™ platform is an innovative bead platform specifically designed for suspension array applications. The beads may be analyzed using any standard flow cytometer (488nm or 633nm excitation), and do not require the use of specialized software.
QuANTuMpLEX™The microsphere populations in the QuantumPlex™ five-bead kits are encoded with different intensities of starfire Red™, and microspheres in our ten-bead kits are distinguished by both fluorescence intensity and size. starfire Red™ is a fluorescent dye with unique characteristics that make it ideal for multiplexing applications. The dye’s broad excitation band allows it to be excited at a number of wavelengths, and it emits in the red channel (e.g., Pe-Cy™5, aPC) with very little carry-over into lower wavelengths, leaving other detectors available for determination of positive binding events via common reporters such as FITC and Pe.
QuantumPlex™ kits are available with three different surfaces to accommodate the coating strategy of choice: carboxyl (COOh), streptavidin (sa), or anti-Mouse Igg functional groups.
Catalog Code
descriptionproduct data
Sheet
price ($uS)
A1mL/pop 5 x 100
data points
B5mL/pop 5 x 500
data points
C10mL/pop 5 x 1000
data points
235 QuantumPlex™ COOh 4.4µm, 5 populations
235 899 3708 5853
238 QuantumPlex™ COOh 5.5µm, 5 populations
235 899 3708 5853
239 QuantumPlex™ COOh 4.4µm and 5.5µm, 10 populations
235 1641 6828 10,534
215 QuantumPlex™ sa 4.4µm, 5 populations
215 899 3708 5853
218 QuantumPlex™ sa 5.5µm, 5 populations
215 899 3708 5853
219 QuantumPlex™ sa 4.4µm and 5.5µm, 10 populations
215 1641 6828 10,534
205 QuantumPlex™ anti-Mouse Igg 4.4µm, 5 populations
209 899 3708 5853
208 QuantumPlex™ anti-Mouse Igg 5.5µm, 5 populations
209 899 3708 5853
209 QuantumPlex™ anti-Mouse Igg 4.4µm and 5.5µm, 10 populations
209 1641 6828 10,534
313 1 7 . 5 7 0 . 7 0 2 0 • 8 0 0 . 3 8 7 . 0 6 7 2
A p p L i C AT i O N S A p p L i C AT i O N S
Catalog Code
descriptionproduct data
Sheet
price ($uS)
A1mL/pop 5 x 100
data points
B5mL/pop 5 x 500
data points
C10mL/pop 5 x 1000
data points
235 QuantumPlex™ COOh 4.4µm, 5 populations
235 899 3708 5853
238 QuantumPlex™ COOh 5.5µm, 5 populations
235 899 3708 5853
239 QuantumPlex™ COOh 4.4µm and 5.5µm, 10 populations
235 1641 6828 10,534
215 QuantumPlex™ sa 4.4µm, 5 populations
215 899 3708 5853
218 QuantumPlex™ sa 5.5µm, 5 populations
215 899 3708 5853
219 QuantumPlex™ sa 4.4µm and 5.5µm, 10 populations
215 1641 6828 10,534
205 QuantumPlex™ anti-Mouse Igg 4.4µm, 5 populations
209 899 3708 5853
208 QuantumPlex™ anti-Mouse Igg 5.5µm, 5 populations
209 899 3708 5853
209 QuantumPlex™ anti-Mouse Igg 4.4µm and 5.5µm, 10 populations
209 1641 6828 10,534
Catalog Code
descriptionproduct data
Sheet
price ($uS)
A1mL/pop 5 x 100
data points
B5mL/pop 5 x 500
data points
C10mL/pop 5 x 1000
data points
250 QuantumPlex™M COOh, 5 populations 250 899 3708 5853
252 QuantumPlex™M sa, 5 populations 252 899 3708 5853
Catalog Code
descriptionproduct data
Sheet
price ($uS)
A – 1mL 100 data points
B – 3mL 300 data points
234 QuantumPlex™ sP COOh 4.4µm 234 213 526
237 QuantumPlex™ sP COOh 5.5µm 234 213 526
214 QuantumPlex™ sP sa 4.4µm 214 213 526
217 QuantumPlex™ sP sa 5.5µm 214 213 526
204 QuantumPlex™ sP anti-Mouse 4.4µm 207 213 526
207 QuantumPlex™ sP anti-Mouse 5.5µm 207 213 526
QuANTuMpLEX™ SpQuantumPlex™ single Population (sP) is useful for the development of simplex flow cytometric assays or for the optimization of attachment chemistry and assay parameters before transitioning to a multiplexed format. Like QuantumPlex™, they are dyed with starfire Red™, and are suitable for use on standard flow cytometers.
QuANTuMpLEX™MQuantumPlex™ Magnetic (M) kits consist of five populations of ~6µm highly uniform superparamagnetic microspheres encoded with different intensities of starfire Red™. Like QuantumPlex™, they are suitable for use on standard flow cytometers. highly efficient separations may be performed using rare earth magnetic separators.
Suspension Arrays, continued
2 0 1 2 – 2 0 1 3 F L O W s U P P L e M e n T B A N G S L A B S . C O M32
A p p L i C AT i O N S A p p L i C AT i O N S
Catalog Code
descriptionproduct data
Sheet
price ($uS)
A – 1mL 100 data points
B – 3mL 300 data points
251 QuantumPlex™M sP COOh 251 213 526
253 QuantumPlex™M sP streptavidin 253 213 526
☞ our full line of ViaCheck™ Viability and Concentration Controls can be found on page 34 .
QuANTuMpLEX™M SpQuantumPlex™M sP (single Population) is useful for the development of simplex flow cytometric assays, or for the optimization of attachment chemistry and assay parameters before transitioning to a multiplexed format. Like QuantumPlex™M, they are ~6µm highly uniform superparamagnetic microspheres dyed with starfire Red™ and are suitable for use on standard flow cytometers.
Suspension Arrays, continued
333 1 7 . 5 7 0 . 7 0 2 0 • 8 0 0 . 3 8 7 . 0 6 7 2
A p p L i C AT i O N S A p p L i C AT i O N S
s Ta n d a R d s
We manufacture a comprehensive range of standards for analytical instruments such as cell analyzers, particle sizers, flow cytometers, and fluorescence microscopes. Our catalog includes nIsT Traceable Particle size standards, sureCount™ Particle Count standards, ViaCheck™ Cell Viability and Concentration Controls, and a broad range of fluorescent and antibody capture beads for flow cytometric and imaging applications.
VIabILITY sTandaRds . . . . . . . . . . . . . . . . . . . . . . . . . . . . . . . . . . . . . . . . . . . . . . . . . . . . . . . . . .34viAChECk™ viABiLiTy ANd CONCENTrATiON CONTrOLS . . . . . . . . . . . . . . . . . . . . . . . . . . . . . . . . . . . . . . . .34viABiLiTy dyE COMpENSATiON STANdArd . . . . . . . . . . . . . . . . . . . . . . . . . . . . . . . . . . . . . . . . . . . . . . . . . .34
sIze sTandaRds . . . . . . . . . . . . . . . . . . . . . . . . . . . . . . . . . . . . . . . . . . . . . . . . . . . . . . . . . . . . . .35NiST TrACEABLE pArTiCLE SizE STANdArdS . . . . . . . . . . . . . . . . . . . . . . . . . . . . . . . . . . . . . . . . . . . . . . . .35
sUReCOUnT™ PaRTICLe COUnT sTandaRds . . . . . . . . . . . . . . . . . . . . . . . . . . . . . . . . . . . . . . .37
FLUOResCenCe InTensITY sTandaRds . . . . . . . . . . . . . . . . . . . . . . . . . . . . . . . . . . . . . . . . . . .38drAGON GrEEN iNTENSiTy STANdArd . . . . . . . . . . . . . . . . . . . . . . . . . . . . . . . . . . . . . . . . . . . . . . . . . . . . .38FLASh rEd iNTENSiTy STANdArd . . . . . . . . . . . . . . . . . . . . . . . . . . . . . . . . . . . . . . . . . . . . . . . . . . . . . . . .39
sTaRLIghT™ CaLIbRaTIOn sLIdes . . . . . . . . . . . . . . . . . . . . . . . . . . . . . . . . . . . . . . . . . . . . . . . .40
2 0 1 2 – 2 0 1 3 F L O W s U P P L e M e n T B A N G S L A B S . C O M34
S TA N d A r d S S TA N d A r d S
viability Standards
Instrumental methods for cell viability analysis provide significant advantages over manual determinations, offering high accuracy, precision, and throughput. however, as with any analytical instrument, it is important to implement a QC program to ensure confidence in results.
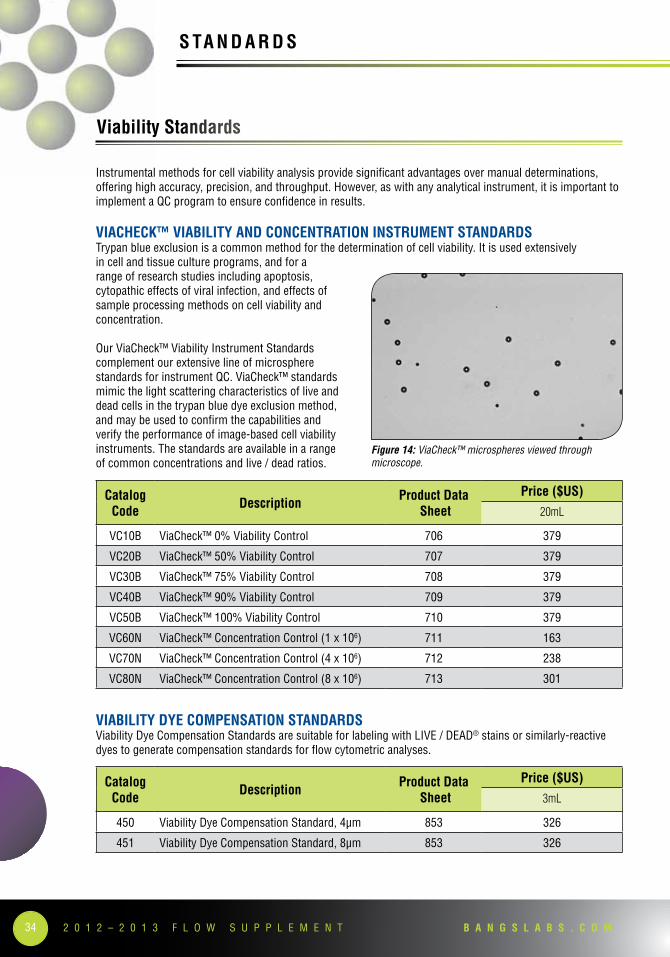
viAChECk™ viABiLiTy ANd CONCENTrATiON iNSTruMENT STANdArdS Trypan blue exclusion is a common method for the determination of cell viability. It is used extensively in cell and tissue culture programs, and for a range of research studies including apoptosis, cytopathic effects of viral infection, and effects of sample processing methods on cell viability and concentration.
Our ViaCheck™ Viability Instrument standards complement our extensive line of microsphere standards for instrument QC. ViaCheck™ standards mimic the light scattering characteristics of live and dead cells in the trypan blue dye exclusion method, and may be used to confirm the capabilities and verify the performance of image-based cell viability instruments. The standards are available in a range of common concentrations and live / dead ratios.
viABiLiTy dyE COMpENSATiON STANdArdSViability dye Compensation standards are suitable for labeling with LIVe / dead® stains or similarly-reactive dyes to generate compensation standards for flow cytometric analyses.
Catalog Code
descriptionproduct data
Sheet
price ($uS)
20mL
VC10b ViaCheck™ 0% Viability Control 706 379
VC20b ViaCheck™ 50% Viability Control 707 379
VC30b ViaCheck™ 75% Viability Control 708 379
VC40b ViaCheck™ 90% Viability Control 709 379
VC50b ViaCheck™ 100% Viability Control 710 379
VC60n ViaCheck™ Concentration Control (1 x 10⁶) 711 163
VC70n ViaCheck™ Concentration Control (4 x 10⁶) 712 238
VC80n ViaCheck™ Concentration Control (8 x 10⁶) 713 301
Figure 14: ViaCheck™ microspheres viewed through microscope .
Catalog Code
descriptionproduct data
Sheet
price ($uS)
3mL
450 Viability dye Compensation standard, 4µm 853 326
451 Viability dye Compensation standard, 8µm 853 326
353 1 7 . 5 7 0 . 7 0 2 0 • 8 0 0 . 3 8 7 . 0 6 7 2
S TA N d A r d S S TA N d A r d S
Catalog Code
descriptionproduct data
Sheet
price ($uS)
20mL
VC10b ViaCheck™ 0% Viability Control 706 379
VC20b ViaCheck™ 50% Viability Control 707 379
VC30b ViaCheck™ 75% Viability Control 708 379
VC40b ViaCheck™ 90% Viability Control 709 379
VC50b ViaCheck™ 100% Viability Control 710 379
VC60n ViaCheck™ Concentration Control (1 x 10⁶) 711 163
VC70n ViaCheck™ Concentration Control (4 x 10⁶) 712 238
VC80n ViaCheck™ Concentration Control (8 x 10⁶) 713 301
Catalog Code
descriptionproduct data
Sheet
price ($uS)
3mL
450 Viability dye Compensation standard, 4µm 853 326
451 Viability dye Compensation standard, 8µm 853 326
Size Standards
Particle size standards may be used to validate sizing instruments across their dynamic ranges. They are suitable for use in the performance of routine instrument calibration checks and corrections, and in the support of practice standards, such as those published by IsO, asTM International, Cen, and other organizations. additionally, the use of a reference material permits the standardization of results between runs, instruments, laboratories, and over time.
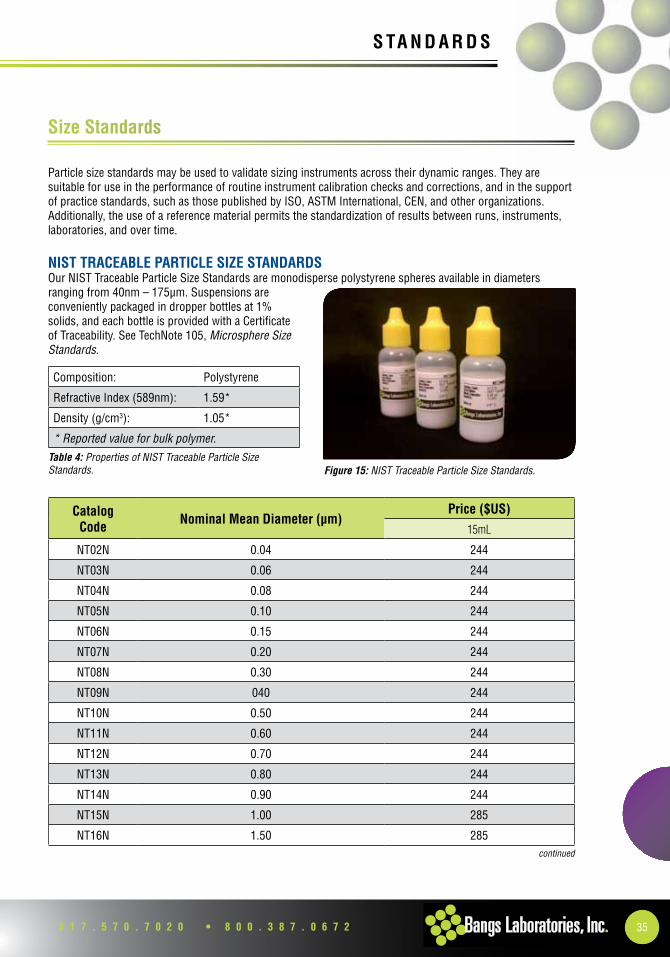
NiST TrACEABLE pArTiCLE SizE STANdArdSOur nIsT Traceable Particle size standards are monodisperse polystyrene spheres available in diameters ranging from 40nm – 175µm. suspensions are conveniently packaged in dropper bottles at 1% solids, and each bottle is provided with a Certificate of Traceability. see Technote 105, microsphere size standards.
continued
Catalog Code
Nominal Mean diameter (µm)price ($uS)
15mL
nT02n 0.04 244
nT03n 0.06 244
nT04n 0.08 244
nT05n 0.10 244
nT06n 0.15 244
nT07n 0.20 244
nT08n 0.30 244
nT09n 040 244
nT10n 0.50 244
nT11n 0.60 244
nT12n 0.70 244
nT13n 0.80 244
nT14n 0.90 244
nT15n 1.00 285
nT16n 1.50 285
Table 4: properties of nist traceable particle size standards .
Composition: Polystyrene
Refractive Index (589nm): 1.59*
density (g/cm3): 1.05*
* Reported value for bulk polymer .
Figure 15: nist traceable particle size standards .
2 0 1 2 – 2 0 1 3 F L O W s U P P L e M e n T B A N G S L A B S . C O M36
S TA N d A r d S S TA N d A r d S
Size Standards, continued
Catalog Code
Nominal Mean diameter (µm)price ($uS)
15mL
nT17n 2.00 285
nT18n 2.50 285
nT19n 3.00 285
nT20n 3.50 285
nT21n 4.00 285
nT22n 5.00 285
nT23n 6.00 285
nT24n 7.00 285
nT25n 8.00 285
nT26n 9.00 285
nT27n 10.00 285
nT28n 12.00 285
nT29n 15.00 285
nT30n 20.00 285
nT31n 25.00 285
nT32n 30.00 285
nT33n 40.00 285
nT34n 50.00 285
nT35n 60.00 285
nT36n 80.00 285
nT37n 100.00 285
nT38n 125.00 285
nT39n 150.00 285
nT40n 175.00 285
373 1 7 . 5 7 0 . 7 0 2 0 • 8 0 0 . 3 8 7 . 0 6 7 2
S TA N d A r d S S TA N d A r d S
SureCount™ particle Count Standards
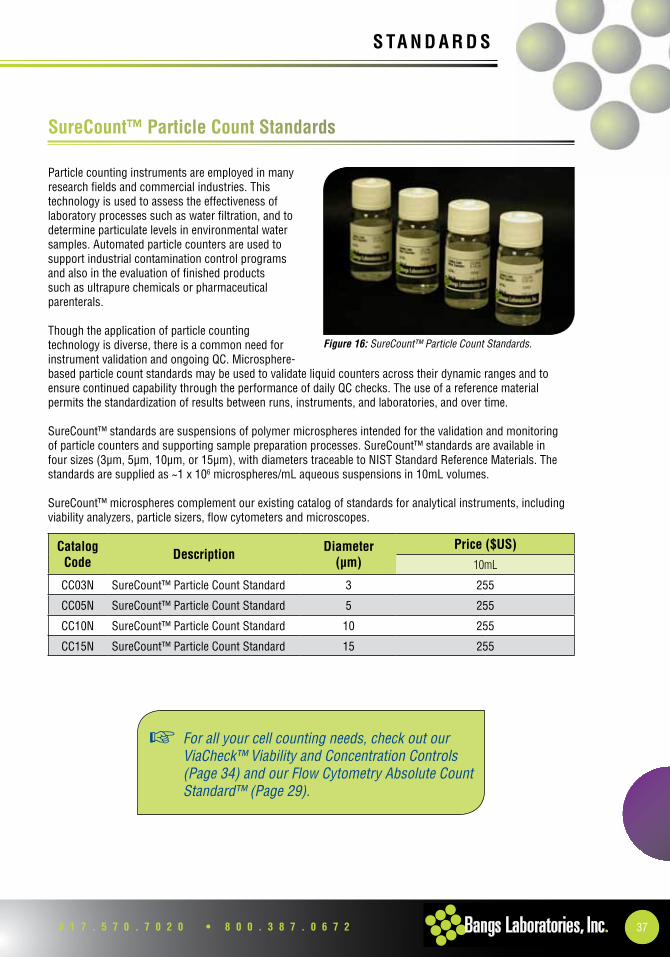
Particle counting instruments are employed in many research fields and commercial industries. This technology is used to assess the effectiveness of laboratory processes such as water filtration, and to determine particulate levels in environmental water samples. automated particle counters are used to support industrial contamination control programs and also in the evaluation of finished products such as ultrapure chemicals or pharmaceutical parenterals.
Though the application of particle counting technology is diverse, there is a common need for instrument validation and ongoing QC. Microsphere-based particle count standards may be used to validate liquid counters across their dynamic ranges and to ensure continued capability through the performance of daily QC checks. The use of a reference material permits the standardization of results between runs, instruments, and laboratories, and over time.
sureCount™ standards are suspensions of polymer microspheres intended for the validation and monitoring of particle counters and supporting sample preparation processes. sureCount™ standards are available in four sizes (3µm, 5µm, 10µm, or 15µm), with diameters traceable to nIsT standard Reference Materials. The standards are supplied as ~1 x 10⁶ microspheres/mL aqueous suspensions in 10mL volumes.
sureCount™ microspheres complement our existing catalog of standards for analytical instruments, including viability analyzers, particle sizers, flow cytometers and microscopes.
Catalog Code
descriptiondiameter
(µm)price ($uS)
10mL
CC03n sureCount™ Particle Count standard 3 255
CC05n sureCount™ Particle Count standard 5 255
CC10n sureCount™ Particle Count standard 10 255
CC15n sureCount™ Particle Count standard 15 255
☞ For all your cell counting needs, check out our ViaCheck™ Viability and Concentration Controls (page 34) and our Flow Cytometry absolute Count standard™ (page 29) .
Figure 16: sureCount™ particle Count standards .
2 0 1 2 – 2 0 1 3 F L O W s U P P L e M e n T B A N G S L A B S . C O M38
S TA N d A r d S S TA N d A r d S
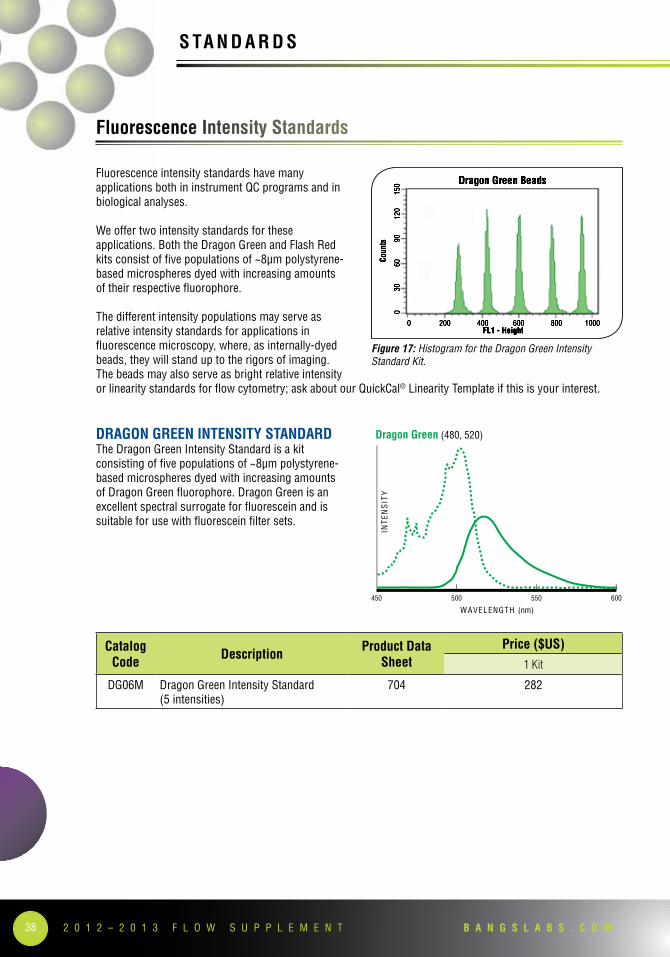
Fluorescence intensity Standards
Fluorescence intensity standards have many applications both in instrument QC programs and in biological analyses.
We offer two intensity standards for these applications. both the dragon green and Flash Red kits consist of five populations of ~8µm polystyrene-based microspheres dyed with increasing amounts of their respective fluorophore.
The different intensity populations may serve as relative intensity standards for applications in fluorescence microscopy, where, as internally-dyed beads, they will stand up to the rigors of imaging. The beads may also serve as bright relative intensity or linearity standards for flow cytometry; ask about our QuickCal® Linearity Template if this is your interest.
drAGON GrEEN iNTENSiTy STANdArdThe dragon green Intensity standard is a kit consisting of five populations of ~8µm polystyrene-based microspheres dyed with increasing amounts of dragon green fluorophore. dragon green is an excellent spectral surrogate for fluorescein and is suitable for use with fluorescein filter sets.
Catalog Code
descriptionproduct data
Sheetprice ($uS)
1 Kit
dg06M dragon green Intensity standard (5 intensities)
704 282
Dragon Green (480, 520)
INTE
NS
ITY
WAVELENGTH (nm)
450 500 550 600
Dragon Green Beads
Coun
ts
0 200 400 600 800 1000
0
30
60
90
1
20
1
50
FL1 - Height
Figure 17: histogram for the Dragon green intensity standard kit .
393 1 7 . 5 7 0 . 7 0 2 0 • 8 0 0 . 3 8 7 . 0 6 7 2
S TA N d A r d S S TA N d A r d S
Catalog Code
descriptionproduct data
Sheetprice ($uS)
1 Kit
dg06M dragon green Intensity standard (5 intensities)
704 282
Catalog Code
descriptionproduct data
Sheetprice ($uS)
1 Kit
FR06M Flash Red Intensity standard (5 intensities)
729 282
Flash Red (660, 690)
INTE
NS
ITY
WAVELENGTH (nm)
500 700600 800
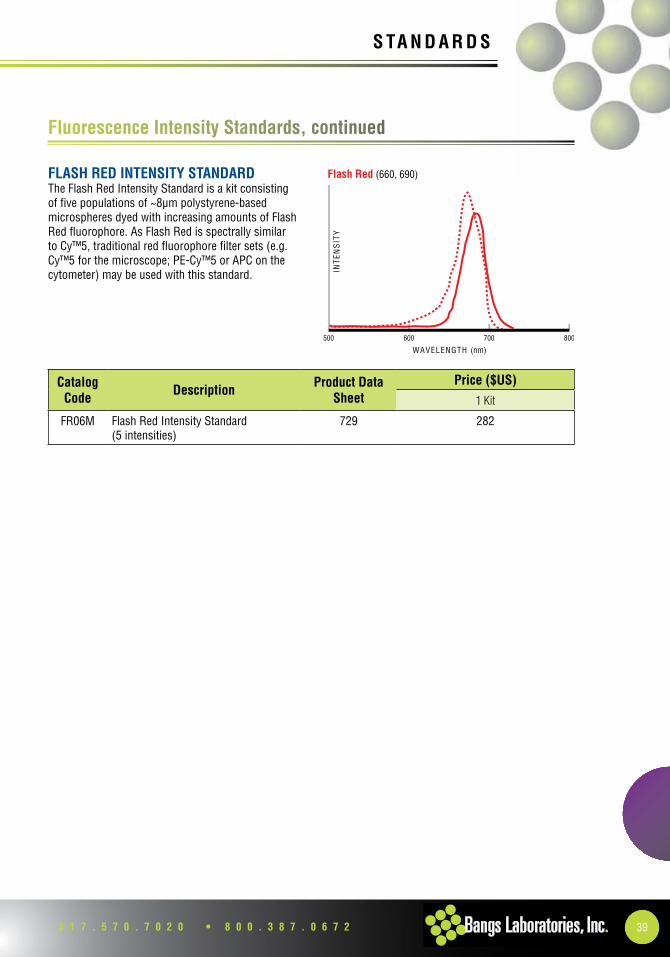
FLASh rEd iNTENSiTy STANdArdThe Flash Red Intensity standard is a kit consisting of five populations of ~8µm polystyrene-based microspheres dyed with increasing amounts of Flash Red fluorophore. as Flash Red is spectrally similar to Cy™5, traditional red fluorophore filter sets (e.g. Cy™5 for the microscope; PE-Cy™5 or APC on the cytometer) may be used with this standard.
Fluorescence intensity Standards, continued
2 0 1 2 – 2 0 1 3 F L O W s U P P L e M e n T B A N G S L A B S . C O M40
S TA N d A r d S S TA N d A r d S
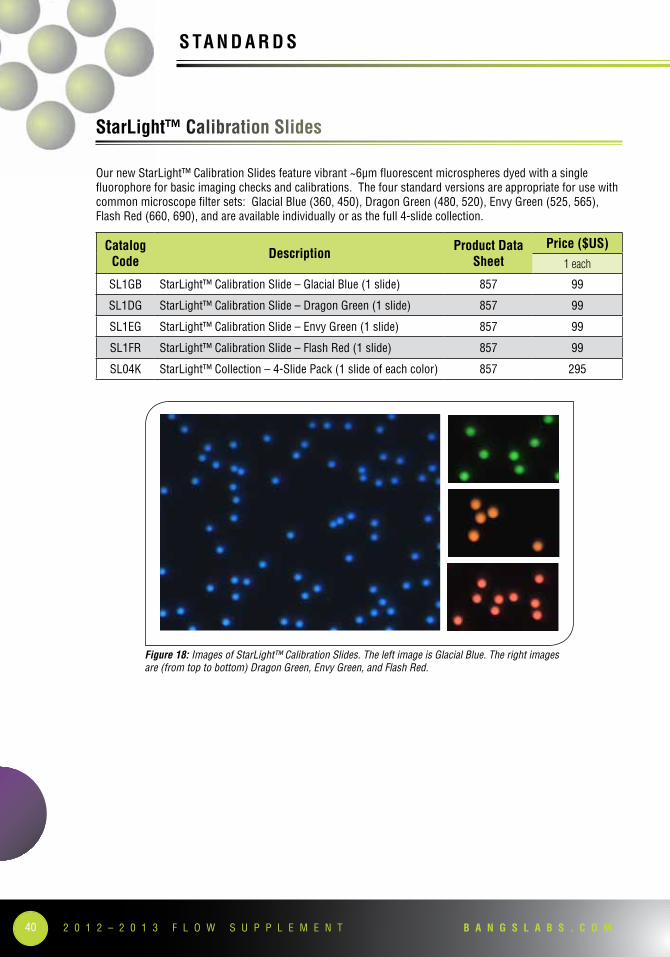
StarLight™ Calibration Slides
Our new starLight™ Calibration slides feature vibrant ~6µm fluorescent microspheres dyed with a single fluorophore for basic imaging checks and calibrations. The four standard versions are appropriate for use with common microscope filter sets: Glacial Blue (360, 450), Dragon Green (480, 520), Envy Green (525, 565), Flash Red (660, 690), and are available individually or as the full 4-slide collection.
Figure 18: images of starlight™ Calibration slides . the left image is glacial blue . the right images are (from top to bottom) Dragon green, envy green, and Flash Red .
Catalog Code
descriptionproduct data
Sheetprice ($uS)
1 each
sL1gb starLight™ Calibration slide – glacial blue (1 slide) 857 99
sL1dg starLight™ Calibration slide – dragon green (1 slide) 857 99
sL1eg starLight™ Calibration slide – envy green (1 slide) 857 99
sL1FR starLight™ Calibration slide – Flash Red (1 slide) 857 99
sL04k starLight™ Collection – 4-slide Pack (1 slide of each color) 857 295

413 1 7 . 5 7 0 . 7 0 2 0 • 8 0 0 . 3 8 7 . 0 6 7 2
S TA N d A r d S S TA N d A r d S
I n d e x
i N d E X i N d E X
2 0 1 2 – 2 0 1 3 F L O W s U P P L e M e n T B A N G S L A B S . C O M42
AALignment........................................................................................................................................................... 8ARRAYS ............................................................................................................................................................... 26
CCALiBRAtion SLideS ....................................................................................................................................... 34CeLL Counting ............................................................................................................................................... 25CeLL CYCLe AnALYSiS .................................................................................................................................... 22CeLL Size eStimAtion .................................................................................................................................... 24CompenSAtion .......................................................................................................................................14 – 16Count StAndARdS ................................................................................................................................... 25, 31
ddRAgon gReen intenSitY StAndARd .......................................................................................................... 32
FFitC / pe CompenSAtion StAndARd ............................................................................................................ 14FLASh Red intenSitY StAndARd .................................................................................................................. 33FLow CYtometRY ABSoLute Count StAndARd™ ..................................................................................... 25FLow CYtometRY AntiBodY Binding BeAdS ............................................................................................. 16FLuoReSCenCe intenSitY StAndARdS ............................................................................................... 32 – 33FLuoReSCenCe QuAntitAtion ...............................................................................................................17 – 21FLuoReSCenCe ReFeRenCe StAndARdS ................................................................................................. 6, 22FuLL SpeCtRum™ ....................................................................................................................................... 5, 13
GgeneRAL inStRument Set-up (FLow CYtometRY) ............................................................................ 11 – 16
iimAging .................................................................................................................................................... 32 – 34inStRument Set-up .............................................................................................................................. 11 – 16intenSitY StAndARdS............................................................................................................................ 32 – 33
LLineARitY ........................................................................................................................................................... 9
MmiCRon BeAd CALiBRAtion Kit ..................................................................................................................... 28
NniSt tRACeABLe pARtiCLe Size StAndARdS ....................................................................................... 29 – 30
433 1 7 . 5 7 0 . 7 0 2 0 • 8 0 0 . 3 8 7 . 0 6 7 2
i N d E X i N d E X
ppARtiCLe Count StAndARdS .................................................................................................................. 25, 31
QQC3™ ................................................................................................................................................................ 12QC windowS® ................................................................................................................................................. 12QuALitY ContRoL ..................................................................................................................................... 4 – 10QuAntumpLex™ ............................................................................................................................................. 26QuAntumpLex™m .......................................................................................................................................... 27QuAntumpLex™m Sp..................................................................................................................................... 27QuAntumpLex™ Sp ........................................................................................................................................ 27QuAntum™ meSF ....................................................................................................................................... 9, 18QuAntum™ SimpLY CeLLuLAR® .................................................................................................................... 19QuiCKCAL® AnALYSiS tempLAte ........................................................................................................... 20 – 21
rRight ReFeRenCe StAndARd™ ....................................................................................................................... 8Routine QuALitY ContRoL ..................................................................................................................... 4 – 10
SSimpLY CeLLuLAR® ................................................................................................................................... 15, 19SimpLY CeLLuLAR® Anti-mouSe FoR VioLet LASeR .................................................................................. 15SimpLY CeLLuLAR® CompenSAtion StAndARd .......................................................................................... 15Size CALiBRAtion StAndARdS Kit ................................................................................................................ 24Size StAndARdS .............................................................................................................................................. 24SmALL BeAd CALiBRAtion KitS ....................................................................................................................... 28 StARLight™ CALiBRAtion SLideS / CoLLeCtion ......................................................................................... 34SuBmiCRon BeAd CALiBRAtion Kit ................................................................................................................ 28SuReCount™ pARtiCLe Count StAndARdS ......................................................................................... 25, 31SuSpenSion ARRAYS .............................................................................................................................. 26 – 27
Ttime deLAY CALiBRAtion StAndARd ............................................................................................................ 10
uuLtRA RAinBow FLuoReSCent pARtiCLeS .............................................................................................. 5, 13
vViABiLitY dYe CompenSAtion StAndARd ....................................................................................... 16, 23, 28ViABiLitY StAndARdS ..................................................................................................................................... 28ViACheCK™ ViABiLitY And ConCentRAtion ContRoLS ..................................................................... 23, 28ViACheCK™ ViABiLitY And ConCentRAtion inStRument StAndARdS .................................................. 28
2 0 1 2 – 2 0 1 3 F L O W s U P P L e M e n T B A N G S L A B S . C O M44
N O T E S N O T E S
_______________________________________________________________________________________
_______________________________________________________________________________________
_______________________________________________________________________________________
_______________________________________________________________________________________
_______________________________________________________________________________________
_______________________________________________________________________________________
_______________________________________________________________________________________
_______________________________________________________________________________________
_______________________________________________________________________________________
_______________________________________________________________________________________
_______________________________________________________________________________________
_______________________________________________________________________________________
_______________________________________________________________________________________
_______________________________________________________________________________________
_______________________________________________________________________________________
_______________________________________________________________________________________
_______________________________________________________________________________________
N O T E S N O T E S
9025 Technology dr iveF ishers , In 46038
to l l f ree : 800.387.0672t : 317.570.7020 • f : 317.570.7034
www.bangslabs.com