Embed Size (px)
Citation preview
Flow Cytometric Analysis of Immunoprecipitates:High-Throughput Analysis of Protein Phosphorylation
and Protein–Protein InteractionsFridtjof Lund-Johansen,1* Ken Davis,2 James Bishop,2 and Rene de Waal Malefyt1
1DNAX Research Institute for Cellular and Molecular Biology, Palo Alto, California2Becton Dickinson Immunocytometry Systems, San Jose, California
Received 5 July 1999; Revision Received 26 November 1999; Accepted 7 December 1999
Background: Activation-induced protein phosphoryla-tion can be studied by Western blotting, but this methodis time consuming and depends on the use of radioactiveprobes for quantitation. We present a novel assay for theassessment of protein phosphorylation based on latexparticles and flow cytometry.Methods: This method employs monoclonal antibodiescoupled to latex particles to immobilize protein kinasesubstrates. Their phosphorylation status is assessed byreactivity with phosphoepitope-specific antibodies. Theamount of immobilized protein on the particles was ana-lyzed by direct or indirect immunofluorescence with an-tibodies to nonphosphorylated epitopes.Results: The assay allowed measurement of phosphoryla-tion of multiple protein kinase substrates in stimulated T
cells, including the z chain of the T-cell receptor, ZAP-70,CD3, CD5, SHP-1, and ERK-2, using 1–3 mg of total cellprotein per sample. The assay provided high resolution ofkinetics of phosphorylation and dephosphorylation. Inter-actions of protein kinase substrates with associated signal-ing molecules were demonstrated.Conclusions: The novel assay allows high-throughputquantitative measurement of protein modifications duringsignal transduction. Cytometry 39:250–259, 2000.© 2000 Wiley-Liss, Inc.
Key terms: flow cytometry; tyrosine phosphorylation; Tlymphocyte; ERK-2; method; microspheres
Protein phosphorylation and protein–protein interac-tions play important roles in cellular signal transduction(1,2). These parameters can be measured by Westernimmunoblotting after immunoprecipitation and gel elec-trophoresis. This procedure is, however, laborious andtime consuming, and quantitation depends on the use ofradioactive probes. Therefore, there is a need for novelassays that allow high-throughput quantitative analysis ofsignal transduction-associated protein modification.
Flow cytometry (FCM) has several advantages over im-munoblotting such as better quantitation and ease of use.We and others have demonstrated that protein tyrosinephosphorylation can be measured by FCM (3,4). Measure-ment of phosphorylaton of invidual proteins has also beenperformed at the single-cell level by using antibodies tophosphorylated forms (5–8). For the majority of proteinkinase substrates, however, such antibodies are not yetavailable. However, flow cytometers may still be used forstudies at the molecular level, provided that the moleculescan be immobilized to particles (9–16). FCM immunoas-says can be optimized to allow measurement of widerranges of analyte concentration than can standard en-zyme-linked immunosorbent protocols (11,14–16).
Thus far, FCM-based immunoassays have been used forquantitative analysis of factors in serum. In the presentstudy, we investigated the possibility that latex particlescould replace sepharose beads for immunoprecipitationof proteins from cellular lysates. Rather than releasingbound molecules from the particles and performing West-ern blotting, we investigated whether phosphorylationstatus and associations of individual molecules could bemeasured directly on the particles by FCM and fluoro-chrome-conjugated antibodies. The results show that thisprocedure allows sensitive, high-throughput analysis ofsignal transduction events.
MATERIALS AND METHODSReagents
Antibodies used for capture and detection of phospho-proteins are listed in Table 1. A nonrelevant antibody(anti–Keyhole Limpet Hemocyanine, KLH; Becton Dickin-son Immunocytometry Systems [BDIS], San Jose, CA) was
*Correspondence to: Fridtjof Lund-Johansen, The Norwegian ResearchDefense Establishment, N-2027 Kjeller, Norway.
E-mail: [email protected]
© 2000 Wiley-Liss, Inc. Cytometry 39:250–259 (2000)
also used as a capture antibody to control for nonspecificbinding. Antibodies were diluted in phosphate bufferedsaline (PBS) containing 10% fetal calf serum and 0.1%Tween 20 (block buffer). Anti-phosphotyrosine (PTyr)PY20 (catalog no. P111020) and peroxidase-conjugatedRC20 (catalog no. E120H) were obtained from Transduc-tion Laboratories (Lexington, KY). Agarose-conjugated an-tibody to ERK-2 was obtained from Santa Cruz Biotech(Santa Cruz, CA). Phycoerythrin-conjugated anti-PY20 wasprepared at the Research Department at BDIS by QudratNasraty.
Secondary Antibodies
The following secondary antibodies were obtainedfrom Jackson Immunoresearch (West Grove, PA): peroxi-dase (HRPO)-conjugated F(ab9)2 donkey anti-rabbit im-munoglobulin (IgG; catalog no. 711-036-152), R-phyco-erythrin F(ab9)2 donkey anti-rabbit IgG (catalog no. 711-116-152), and purified F(ab9)2 goat anti-mouse IgG heavyand light chains (catalog no. 115-006-062). Biotinylated(catalog no. 1030-08) and unlabeled (catalog no. 1030-01)goat anti-mouse IgG g-chain was obtained from SouthernBiotechnology (Birmingham, AL; www.southernbiotech.com). Fluorochrome-conjugated secondary antibodieswere used at 20 mg/ml.
Preparation of Latex Particlesfor Immunoprecipitation
Amino-modified 5.5-mm-diameter poly-methyl-meth-ac-rylate particles (catalog no. P0055000AN) were obtainedfrom Bangs Laboratories (Carmel, IN). The particles werechosen because of their low background fluorescencelevels and high density (1.19), which is an advantagewhen immunoprecipitating from glycerol-containing celllysis buffers. Antibodies were coupled to the particles bya method that is independent of physical adsorption toavoid loss of binding in detergents. All coupling reactionswere performed at room temperature (20–22°C). Be-tween each reaction step, particles were washed and
pelletted by centrifugation. The protein-to-particle ratiowas always 1 mg protein per 106 particles. Particles (108/ml) were first incubated for 1 h in PBS containing 0.5%Tween 20 (PBT; Sigma Chemicals, St. Louis, MO) and 1mM biotin succimidyl ester (catalog no. B1606; MolecularProbes, Eugene, OR). The particles were subsequentlywashed five times in PBT and resuspended in PBT con-taining streptavidin (catalog no. S888; Molecular Probes)and rotated for 2 h. Streptavidin-coupled particles werewashed four times in PBT and then fixed for 1 h in a bufferprepared from PBT and 1% (v/w) paraformaldehyde.Streptavidin-coupled latex was washed four times in PBTand resuspended in PBT with 10% fetal bovine serum(block buffer). Biotinlyated antibodies were coupled tothe particles by mixing particles with biotinylated anti-body suspended in block buffer. The particles were left inthe antibody solution and stored at 4°C until use. Forindirect coating of mouse IgG monoclonal antibodies,streptavidin-coupled particles were first incubated withbiotinylated goat anti-mouse IgG g-chain (catalog no.1030-08; Southern Biotechnology), washed twice in blockbuffer, and then resuspended at 107/ml in block buffercontaining the monoclonal capture antibody. Particleswere stored in this solution at 4°C until use. Particlescoupled to anti-mouse IgG that were stored at 4°C for 1year showed a binding capacity for phycoerythrin-conju-gated mouse IgG similar to that of particles that werefreshly prepared. All particles were washed twice withlysis buffer immediately before use.
Immunoprecipitation and Western Blotting
T cells were lysed in a buffer containing 140 mM NaCl,50 mM HEPES, 1% Triton X-100, and 1 mM ethylene-diaminetetraacetic acid. Immediately before lysis, the fol-lowing protease and phosphatase inhibitors were addedfrom 1003 stock solutions that were kept at 220°C:phenyl methyl sulfonyl fluoride (final concentration, 1mM) leupeptin (10 mg/ml), aprotinin (10 mg/ml), andsodium orthovanadate (1 mM; all from Sigma Chemicals)
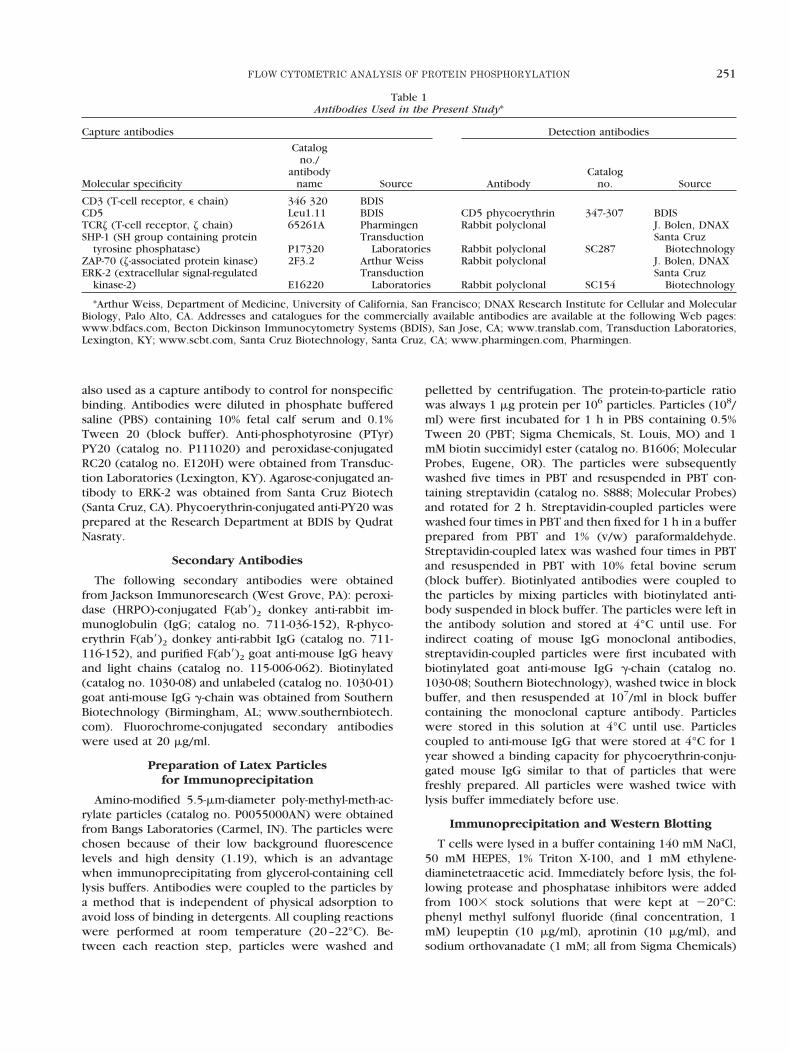
Table 1Antibodies Used in the Present Study*
Capture antibodies Detection antibodies
Molecular specificity
Catalogno./
antibodyname Source Antibody
Catalogno. Source
CD3 (T-cell receptor, e chain) 346 320 BDISCD5 Leu1.11 BDIS CD5 phycoerythrin 347-307 BDISTCRz (T-cell receptor, z chain) 65261A Pharmingen Rabbit polyclonal J. Bolen, DNAXSHP-1 (SH group containing protein
tyrosine phosphatase) P17320Transduction
Laboratories Rabbit polyclonal SC287Santa Cruz
BiotechnologyZAP-70 (z-associated protein kinase) 2F3.2 Arthur Weiss Rabbit polyclonal J. Bolen, DNAXERK-2 (extracellular signal-regulated
kinase-2) E16220Transduction
Laboratories Rabbit polyclonal SC154Santa Cruz
Biotechnology
*Arthur Weiss, Department of Medicine, University of California, San Francisco; DNAX Research Institute for Cellular and MolecularBiology, Palo Alto, CA. Addresses and catalogues for the commercially available antibodies are available at the following Web pages:www.bdfacs.com, Becton Dickinson Immunocytometry Systems (BDIS), San Jose, CA; www.translab.com, Transduction Laboratories,Lexington, KY; www.scbt.com, Santa Cruz Biotechnology, Santa Cruz, CA; www.pharmingen.com, Pharmingen.
251FLOW CYTOMETRIC ANALYSIS OF PROTEIN PHOSPHORYLATION
and Pefablock (1 mM; Boehringer Mannheim, Indianap-olis, IN). Agarose-conjugated mouse IgG (10 ml/100 mllysate; Jackson Immunoresearch, catalog no. 015-000-052) was added to remove IgG-binding proteins. Thelysates were centrifuged for 15 min at 16,000 rpm in amicrocentrifuge at 4°C. Protein concentration was de-termined by a BCA assay kit according to the manufac-turer’s instructions (Pierce, Rockford, IL). Typically,20 –30 mg protein was obtained from 106 T-cell blasts(results not shown). Lysates were frozen on dry ice andkept at 270°C until use.
For immunoprecipitation, 5–10 mg antibody was addedto 100–300 mg native cellular lysate or lysate that wasdenatured by adding 1% sodium dodecyl sulfate (SDS),boiled for 5 min, and diluted 1:10 in lysis buffer. After 1 hof incubation on ice, 50 ml protein G sepharose (SigmaChemicals) was added, and the samples were rotated at4°C overnight. The immunoprecipitates were subse-quently washed three times in lysis buffer, resuspended in53 SDS sample buffer (250 mM Tris, pH 6.8, 0.5 M DTT,10% SDS, 0.5% bromophenol blue, 20% glycerol), anddiluted 1:5 in lysis buffer. The samples were boiled for 5min, centrifuged, and either frozen at 270°C or subjectedimmediately to SDS polyacrylamide gel electrophoresis(PAGE) using 4–20% Tris-glycine gradient gels (Novex,San Diego, CA). The proteins were blotted onto Immo-bilon P membranes (Millipore Corp., Bedford, MA). Beforestaining with antibodies, the membranes were incubatedovernight at 4°C in block buffer. The blots were thenincubated and washed with peroxidase-conjugated anti-PTyr antibody RC-20 according to the manufacturer’s rec-ommendations (Transduction Laboratories, Lexington,KY). Peroxidase activity was detected by enhanced chemi-luminescence (Amersham, Buckinghamshire, UK) and vi-sualized by exposing blots to light-sensitive films (KodakBiomax MR, Kodak, Rochester, NY).
Measurement of ERK-2 Kinase Activity by ImmuneComplex Kinase Assay
Agarose-conjugated anti-ERK-2 was used to precipitateERK-2 from cellular lysates. The agarose beads werewashed twice in ERK-2 wash buffer and then twice inmicrotubule-associated protein–kinase wash buffer (140mM NaCl, 50 mM Tris HCl pH 7.4, 2 mM MgCl2, 15%glycerol). For the kinase assay, the beads were resus-pended in 20 ml of a solution containing 40 mM MgCl2, 40mM HEPES, pH 7.4, 1 mg/ml myelin basic protein, 0.2 mMATP, and 1 mCi g-ATP (Amersham). The samples wereincubated at 30°C for 30 min. Subsequently, the reactionwas stopped by adding 5 ml 53 SDS sample buffer, and thesamples were boiled for 5 min. Myelin basic protein wasseparated from free ATP by SDS-PAGE (4–20% gradientgel; Novex) and blotted onto Immobilon P membranes.Incorporation of radioactive phosphate into myelin basicprotein was quantitated by a Storm phosphoimager (Mo-lecular Dynamics, Sunnyvale, CA).
Preparation of Latex Particle Immunoprecipitatesfor FCM Analysis
Immunoprecipitations with latex particles were per-formed in 96-well V-bottomed polystyrene plates (Costar).Ten microliters of cellular lysate (1–3 mg unless otherwisenoted) and 10 ml lysis buffer containing 2 3 104 latexparticles were added to each well, and the plate wasincubated between 1 and 15 h at 4°C depending on theabundance of target protein in the extracts. The particleswere washed twice in block buffer, and the supernatantwas removed by vacuum pipetting. Before adding antibod-ies, the particles were resuspended in 10 ml sterile-filteredblock buffer containing 20% normal mouse serum and0.1% sodium azide to block free binding sites for IgG.After 30 min of incubation on ice, 10 ml of antibodies(10–20 mg/ml) was added to each well. The remainingsteps were performed at 22°C. The plate was incubatedfor another 30 min, and the samples were washed twice inblock buffer. For indirect staining, 10 ml of a mixture ofanti-rabbit IgG phycoerythrin (PE; 120 mg/ml) mixed withan equal volume of block buffer with 10% mouse serumand 10% goat serum was added to each well, and thesamples were incubated for 30 min on ice, washed twice,and resuspended in block buffer. The samples were trans-ferred to microtubes (catalog no. 223-9391; Bio-Rad, Rich-mond, CA) and kept on ice. The microtubes were placedinto the standard tubes used for FCM analysis at the timeof analysis.
Stimulation of Cells
T cells (day 5 phytohemeagglutinin-stimulated blasts orperipheral blood CD41 cells cultured as lines) were sus-pended at 5 3 107/ml in ice-cold PBS containing 0.5 mMMgCl2, 1 mM CaCl2, and 1% fetal bovine serum (PBS-FBS-Ca/Mg). The cells were incubated with 1 mg anti-CD3monoclonal antibody (mAb) and 1 mg anti-CD4 mAb per106 cells for 10 min on ice. The cells were washed onceand resuspended in ice-cold PBS-FBS-Ca/Mg. F(ab9)2 goat-anti mouse IgG was added at 1 mg/106 cells. The sampleswere kept on ice for 30 min and then transferred to a bathwith 37°C water. At indicated time points, 1 ml ice-coldPBS was added, and the cells were pelletted in a micro-centrifuge and lysed as described above. For stimulationwith pervanadate, equal volumes of solutions containing300 mM H2O2 and 100 mM NaVO42 were mixed imme-diately before use and added to T cells at a final concen-tration of 1.5 mM H2O2 and 0.5 mM NaVO42. After 7 min,the cells were pelletted and lysed in lysis buffer.
RESULTSDetection of Tyrosine Phosphorylated Proteins by
Immunoprecipitation and Western Blotting
Activation of T cells leads to tyrosine phosphorylationof several molecules including the z chain of the T-cellreceptor (TCRz) and the z-chain–associated tyrosine ki-nase ZAP-70 (17). Initially, T cells were treated with theprotein tyrosine phosphatase inhibitor pervanadate to ob-tain large amounts of the tyrosine phosphorylated forms
252 LUND-JOHANSEN ET AL.
and to reveal the majority of potentially tyrosine phos-phorylated proteins that might be associated. The reactiv-ity of monoclonal antibodies to TCRz and ZAP-70 wastested by standard immunoprecipitation and Western blot-ting.
Immunoprecipitates of TCRz appeared as two specificbands on Western blots (Fig. 1, lane 1, arrows). An addi-tional band at 30 kDa was observed, but this was alsopresent when no lysate was added (lane 4) and thereforerepresents light chains of the precipitating antibody. Thetwo specific bands had molecular weights correspondingto the phosphorylated TCRz (Fig. 1, lane 1, closed arrow)and the z-chain–associated tyrosine kinase ZAP-70 (Fig. 1,lane 1, open arrow) (17). When the lysate was denaturedto abolish noncovalent associations before immunopre-cipitation, the only specific band had a molecular weightcorresponding to that of TCRz (Fig. 1, lane 2, closedarrow).
Immunoprecipitates of ZAP-70 from denatured extractsappeared as a strong specific band at 70 kDa (Fig. 1, lane3, open arrow) in addition to the heavy and light chainsand a faint band that most likely corresponds to residualTCRz. The anti-ZAP-70 mAb was less efficient for precip-itating under native conditions (not shown).
Immobilization of TCRz to Latex Particles andDetection by FCM
We reasoned that TCRz could be immobilized to mAb-coupled latex particles rather than to sepharose beads,
i.e., an FCM immunoprecipitate analysis (FCM-IP analysis).To investigate this possibility, latex particles with boundanti-TCRz or nonrelevant mAb (anti-KLH) were incubatedwith lysates of T cells. The particles were then labeledwith polyclonal rabbit anti-TCRz and PE-conjugated anti-rabbit IgG, as described in Materials and Methods. Parti-cles were identified by combined measurement of for-ward angle and 90° light scattering (Fig. 2A). Fluorescencefrom single particles (within the region shown in Fig. 2A)
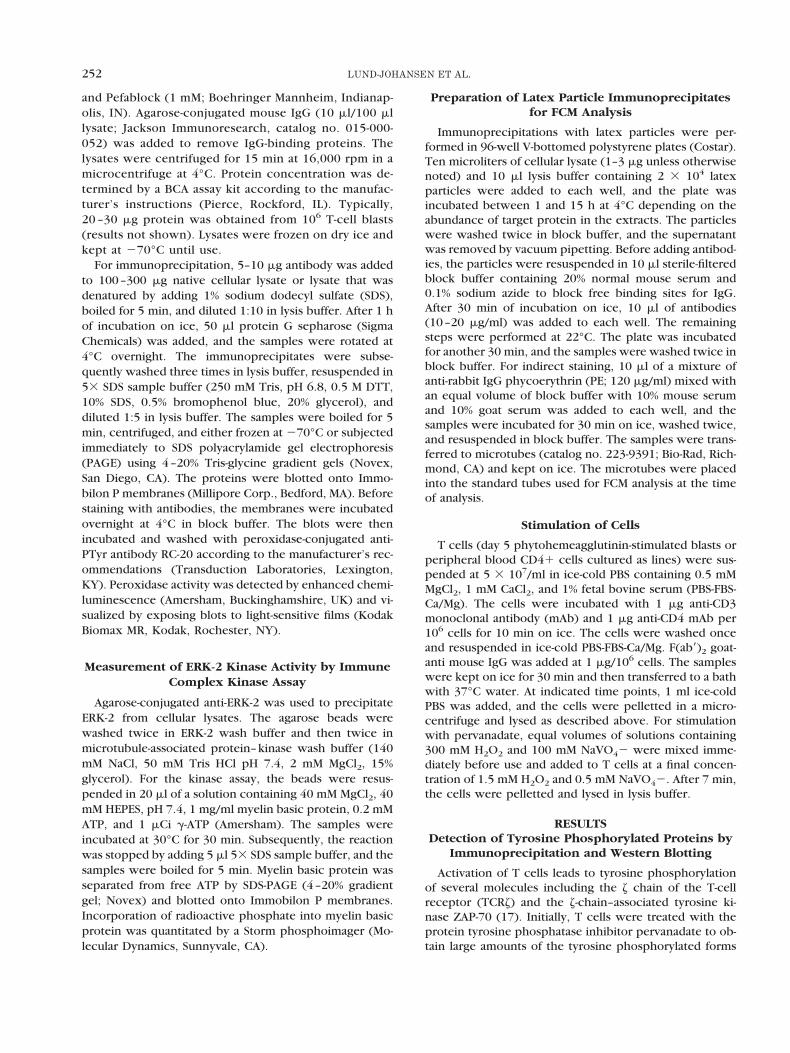
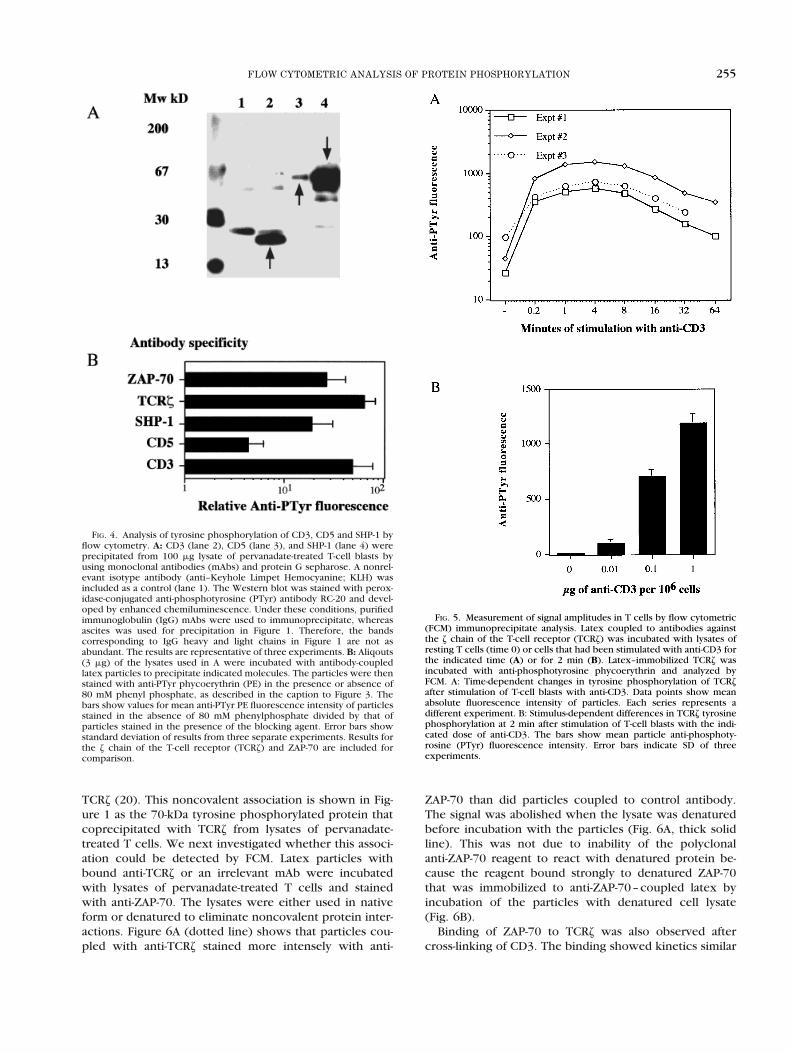
FIG. 1. Analysis of tyrosine phosphorylation of the z chain of the T-cellreceptor (TCRz) and ZAP-70 by Western blotting. TCRz and ZAP-70 wereprecipitated from 100 mg lysate of pervanadate-treated T-cell blasts withmonoclonal antibodies and protein G sepharose. The Western blot wasstained with peroxidase-conjugated anti-phosphotyrosine antibody RC-20and developed with enhanced chemiluminescence. Lanes 1 and 2: TCRzprecipitated from native and denatured cell lysates, respectively. Lane 3:ZAP-70 precipitated from denatured cell lysate. Closed and open arrowsindicate positions of TCRz and ZAP-70, respectively. Lanes 4 and 5:Anti-TCRz (4) and anti-ZAP-70 (5) antibody was precipitated with proteinG sepharose in the absence of cell lysate to demonstrate nonspecificbands. The results are representative of three experiments.
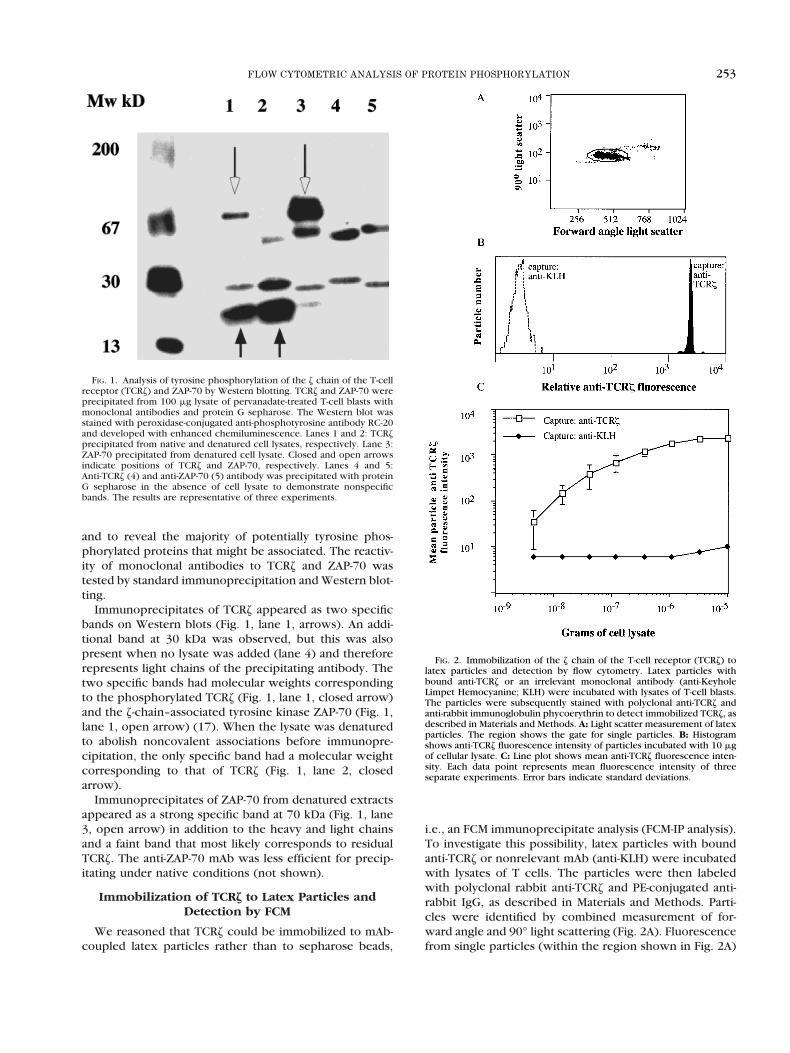
FIG. 2. Immobilization of the z chain of the T-cell receptor (TCRz) tolatex particles and detection by flow cytometry. Latex particles withbound anti-TCRz or an irrelevant monoclonal antibody (anti-KeyholeLimpet Hemocyanine; KLH) were incubated with lysates of T-cell blasts.The particles were subsequently stained with polyclonal anti-TCRz andanti-rabbit immunoglobulin phycoerythrin to detect immobilized TCRz, asdescribed in Materials and Methods. A: Light scatter measurement of latexparticles. The region shows the gate for single particles. B: Histogramshows anti-TCRz fluorescence intensity of particles incubated with 10 mgof cellular lysate. C: Line plot shows mean anti-TCRz fluorescence inten-sity. Each data point represents mean fluorescence intensity of threeseparate experiments. Error bars indicate standard deviations.
253FLOW CYTOMETRIC ANALYSIS OF PROTEIN PHOSPHORYLATION
was gated to a histogram (Fig. 2B). Doublets constitutedfewer than 5% of particles in all experiments (Fig. 2A; datanot shown).
As shown in Figure 2B, particles with bound anti-TCRzstained several orders of magnitude more brightly withpolyclonal anti-TCRz than did particles with the nonrel-evant antibody. Particle staining intensity was dependenton the amount of lysate used, and saturation was observedwhen using 1–10 mg cell lysate (Fig. 2C). For triplicatesamples analyzed within an experiment, the coefficient ofvariation was less than 7% (n 5 6). The larger variability inresults obtained between experiments (Fig. 2) is, there-fore, likely to be due to errors in measurement of proteinconcentration and pipetting. The results were similarwhen the lysate was denatured before adding the particles(not shown). ZAP-70 was detected in a similar way byusing mouse monoclonal and rabbit polyclonal anti-ZAP-70 for capture and detection, respectively (notshown).
Measurement of Substrate-Specific TyrosinePhosphorylation Using Latex Particles and FCM
We next investigated whether the phosphorylation sta-tus of latex-immobilized TCRz and ZAP-70 could be deter-mined by FCM-IP analysis. Particles with bound anti-TCRzor anti-ZAP-70 were sequentially incubated with lysates ofpervanadate-treated T-cell blasts and PE-labeled anti-PTyrmAb. The lysates were denatured before adding the par-ticles to ensure that phosphorylation was determined foreach molecule individually (Fig. 1). Particles with boundanti-TCRz (Fig. 3A) or ZAP-70 (Fig. 3B) stained brightlywith anti-PTyr antibodies compared with particles with anonrelevant mAb (Fig. 3C). The signal was abolished bymixing the anti-PTyr antibody with 80 mM phenyl phos-phate, which blocks the antigen-binding site of the anti-PTyr antibody (Fig. 3). The average ratio of fluorescenceof particles stained with anti-PTyr in the presence orabsence of phenylphosphate was 65.0 6 23.9 and 27.2 617.0 for TCRz and ZAP-70, respectively (average and SD offour experiments). Figure 1 shows data from 50–100 mgof cell lysate, but only 3 mg was sufficient to saturate thelatex particles (Fig. 2) and obtain the results by FCM-IPanalysis.
A small shift in the fluorescence intensity of the non-specific mAb was also noted (1.5 6 0.2, n 5 4; Fig. 3C).This shift may indicate that some tyrosine phosphorylatedproteins bind nonspecifically to the particles. Because thesignal was low and we did not observe any bands on theWestern blot prepared with the same antibody (Fig. 4A,lane 1), we did not pursue this result any further.
We searched for antibodies to other tyrosine kinasesubstrates that would precipitate single tyrosine phos-phorylated proteins from lysates of pervanadate-treatedT-cell blasts. Antibodies to CD3 (18), CD5 (19), and theprotein tyrosine phosphatase SHP-1 were found to precip-itate single bands under native conditions (Fig. 4A). Theseproteins were found to be extensively tyrosine phosphor-ylated when using FCM-IP analysis (Fig. 4B). These resultsdemonstrate that FCM-IP analysis can be used as a general
approach for the analysis of substrate-specific tyrosinephosphorylation under conditions where the antibodiesprecipitate a single tyrosine phosphorylated molecule.
FCM-IP Detects Time- and Stimulus-DependentChanges in the Amplitude ofSubstrate Phosphorylation
To test whether the FCM-IP analysis detected biologi-cally relevant phosphorylation, lysates were preparedfrom unstimulated T cells and cells that were stimulatedwith anti-CD3 and anti-mouse IgG for different time inter-vals. For this stimulus one would expect to see a time-dependent increase in tyrosine phosphorylation, a singlepeak, and then a gradual decrease. Figure 5A shows thatthe assay demonstrated high and reproducible resolutionof the kinetics for TCRz tyrosine phosphorylation (r2 .0.98 for the correlation between each data series shownin Fig. 5A).
We next investigated whether the assay could discrim-inate dose-related differences in signal amplitude. T cellswere stimulated with different doses of anti-CD3 mAb for2 min. Figure 5B shows that increasing the amount of mAbused to cross-link CD3 led to increasing levels of tyrosinephosphorylation of TCRz.
Detection of TCRz-Associated ZAP-70 by FCM
Cross-linking of TCRs also induce binding of ZAP-70tyrosine kinase to tyrosine phosphorylated ITAM motifs of
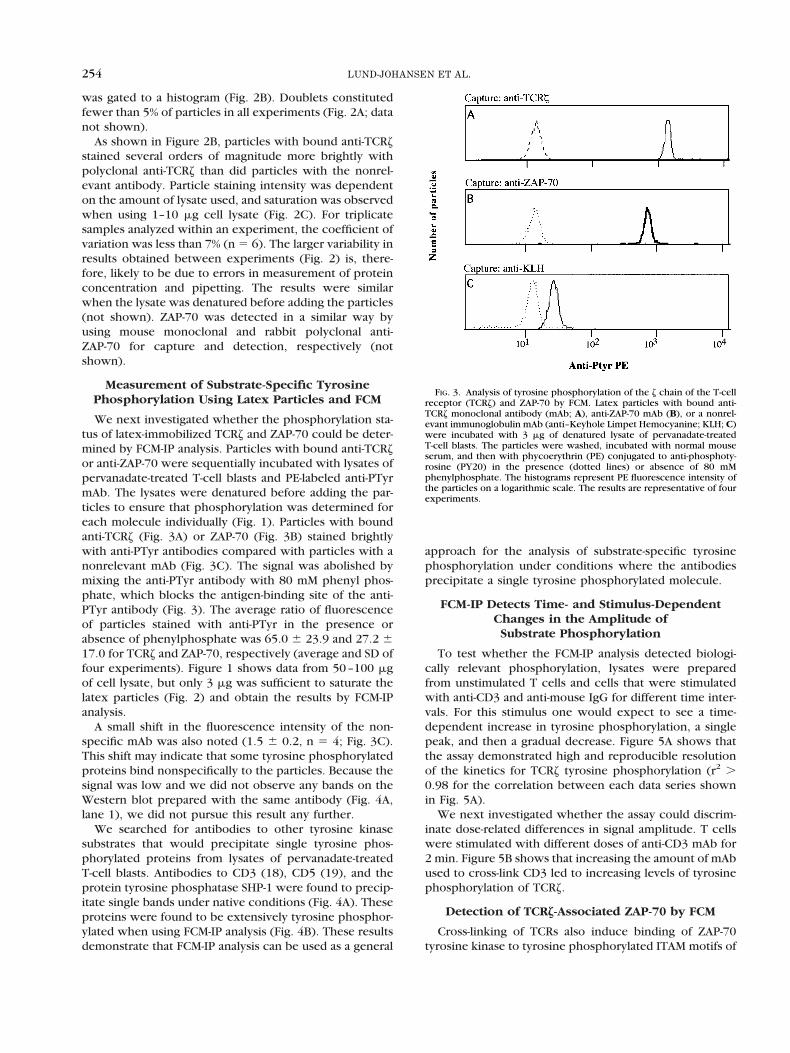
FIG. 3. Analysis of tyrosine phosphorylation of the z chain of the T-cellreceptor (TCRz) and ZAP-70 by FCM. Latex particles with bound anti-TCRz monoclonal antibody (mAb; A), anti-ZAP-70 mAb (B), or a nonrel-evant immunoglobulin mAb (anti–Keyhole Limpet Hemocyanine; KLH; C)were incubated with 3 mg of denatured lysate of pervanadate-treatedT-cell blasts. The particles were washed, incubated with normal mouseserum, and then with phycoerythrin (PE) conjugated to anti-phosphoty-rosine (PY20) in the presence (dotted lines) or absence of 80 mMphenylphosphate. The histograms represent PE fluorescence intensity ofthe particles on a logarithmic scale. The results are representative of fourexperiments.
254 LUND-JOHANSEN ET AL.
TCRz (20). This noncovalent association is shown in Fig-ure 1 as the 70-kDa tyrosine phosphorylated protein thatcoprecipitated with TCRz from lysates of pervanadate-treated T cells. We next investigated whether this associ-ation could be detected by FCM. Latex particles withbound anti-TCRz or an irrelevant mAb were incubatedwith lysates of pervanadate-treated T cells and stainedwith anti-ZAP-70. The lysates were either used in nativeform or denatured to eliminate noncovalent protein inter-actions. Figure 6A (dotted line) shows that particles cou-pled with anti-TCRz stained more intensely with anti-
ZAP-70 than did particles coupled to control antibody.The signal was abolished when the lysate was denaturedbefore incubation with the particles (Fig. 6A, thick solidline). This was not due to inability of the polyclonalanti-ZAP-70 reagent to react with denatured protein be-cause the reagent bound strongly to denatured ZAP-70that was immobilized to anti-ZAP-70–coupled latex byincubation of the particles with denatured cell lysate(Fig. 6B).
Binding of ZAP-70 to TCRz was also observed aftercross-linking of CD3. The binding showed kinetics similar
FIG. 4. Analysis of tyrosine phosphorylation of CD3, CD5 and SHP-1 byflow cytometry. A: CD3 (lane 2), CD5 (lane 3), and SHP-1 (lane 4) wereprecipitated from 100 mg lysate of pervanadate-treated T-cell blasts byusing monoclonal antibodies (mAbs) and protein G sepharose. A nonrel-evant isotype antibody (anti–Keyhole Limpet Hemocyanine; KLH) wasincluded as a control (lane 1). The Western blot was stained with perox-idase-conjugated anti-phosphotyrosine (PTyr) antibody RC-20 and devel-oped by enhanced chemiluminescence. Under these conditions, purifiedimmunoglobulin (IgG) mAbs were used to immunoprecipitate, whereasascites was used for precipitation in Figure 1. Therefore, the bandscorresponding to IgG heavy and light chains in Figure 1 are not asabundant. The results are representative of three experiments. B: Aliqouts(3 mg) of the lysates used in A were incubated with antibody-coupledlatex particles to precipitate indicated molecules. The particles were thenstained with anti-PTyr phycoerythrin (PE) in the presence or absence of80 mM phenyl phosphate, as described in the caption to Figure 3. Thebars show values for mean anti-PTyr PE fluorescence intensity of particlesstained in the absence of 80 mM phenylphosphate divided by that ofparticles stained in the presence of the blocking agent. Error bars showstandard deviation of results from three separate experiments. Results forthe z chain of the T-cell receptor (TCRz) and ZAP-70 are included forcomparison.
FIG. 5. Measurement of signal amplitudes in T cells by flow cytometric(FCM) immunoprecipitate analysis. Latex coupled to antibodies againstthe z chain of the T-cell receptor (TCRz) was incubated with lysates ofresting T cells (time 0) or cells that had been stimulated with anti-CD3 forthe indicated time (A) or for 2 min (B). Latex–immobilized TCRz wasincubated with anti-phosphotyrosine phycoerythrin and analyzed byFCM. A: Time-dependent changes in tyrosine phosphorylation of TCRzafter stimulation of T-cell blasts with anti-CD3. Data points show meanabsolute fluorescence intensity of particles. Each series represents adifferent experiment. B: Stimulus-dependent differences in TCRz tyrosinephosphorylation at 2 min after stimulation of T-cell blasts with the indi-cated dose of anti-CD3. The bars show mean particle anti-phosphoty-rosine (PTyr) fluorescence intensity. Error bars indicate SD of threeexperiments.
255FLOW CYTOMETRIC ANALYSIS OF PROTEIN PHOSPHORYLATION
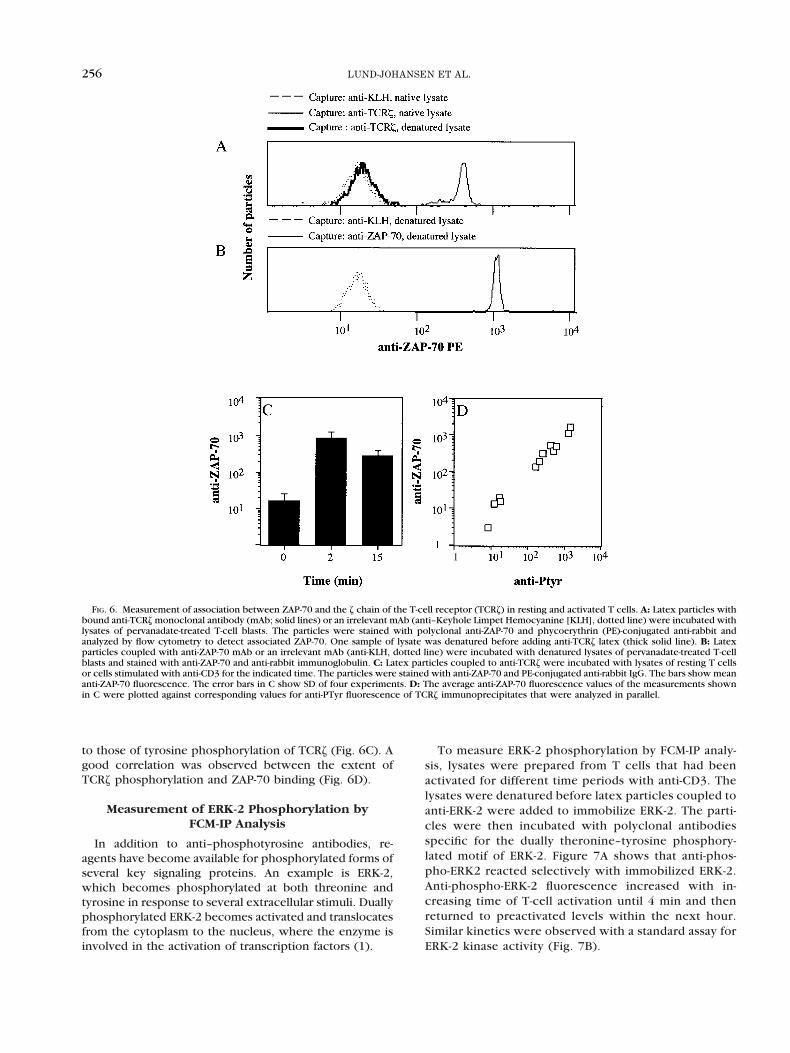
to those of tyrosine phosphorylation of TCRz (Fig. 6C). Agood correlation was observed between the extent ofTCRz phosphorylation and ZAP-70 binding (Fig. 6D).
Measurement of ERK-2 Phosphorylation byFCM-IP Analysis
In addition to anti–phosphotyrosine antibodies, re-agents have become available for phosphorylated forms ofseveral key signaling proteins. An example is ERK-2,which becomes phosphorylated at both threonine andtyrosine in response to several extracellular stimuli. Duallyphosphorylated ERK-2 becomes activated and translocatesfrom the cytoplasm to the nucleus, where the enzyme isinvolved in the activation of transcription factors (1).
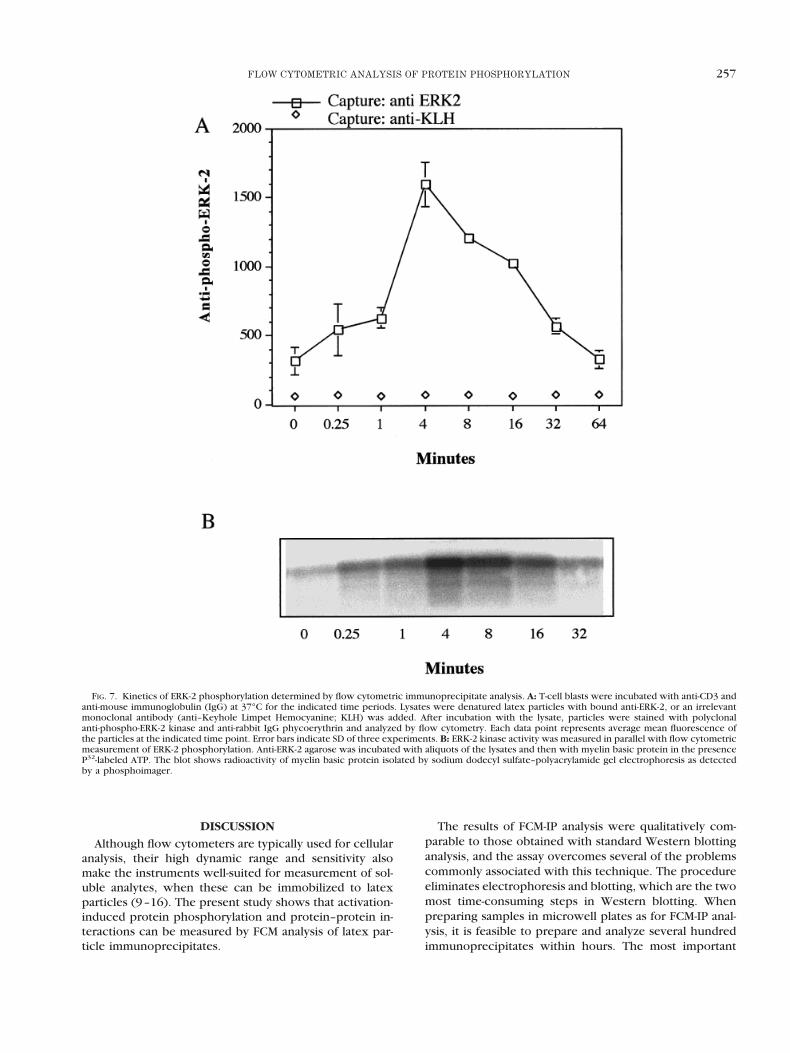
To measure ERK-2 phosphorylation by FCM-IP analy-sis, lysates were prepared from T cells that had beenactivated for different time periods with anti-CD3. Thelysates were denatured before latex particles coupled toanti-ERK-2 were added to immobilize ERK-2. The parti-cles were then incubated with polyclonal antibodiesspecific for the dually theronine–tyrosine phosphory-lated motif of ERK-2. Figure 7A shows that anti-phos-pho-ERK2 reacted selectively with immobilized ERK-2.Anti-phospho-ERK-2 fluorescence increased with in-creasing time of T-cell activation until 4 min and thenreturned to preactivated levels within the next hour.Similar kinetics were observed with a standard assay forERK-2 kinase activity (Fig. 7B).
FIG. 6. Measurement of association between ZAP-70 and the z chain of the T-cell receptor (TCRz) in resting and activated T cells. A: Latex particles withbound anti-TCRz monoclonal antibody (mAb; solid lines) or an irrelevant mAb (anti–Keyhole Limpet Hemocyanine [KLH], dotted line) were incubated withlysates of pervanadate-treated T-cell blasts. The particles were stained with polyclonal anti-ZAP-70 and phycoerythrin (PE)-conjugated anti-rabbit andanalyzed by flow cytometry to detect associated ZAP-70. One sample of lysate was denatured before adding anti-TCRz latex (thick solid line). B: Latexparticles coupled with anti-ZAP-70 mAb or an irrelevant mAb (anti-KLH, dotted line) were incubated with denatured lysates of pervanadate-treated T-cellblasts and stained with anti-ZAP-70 and anti-rabbit immunoglobulin. C: Latex particles coupled to anti-TCRz were incubated with lysates of resting T cellsor cells stimulated with anti-CD3 for the indicated time. The particles were stained with anti-ZAP-70 and PE-conjugated anti-rabbit IgG. The bars show meananti-ZAP-70 fluorescence. The error bars in C show SD of four experiments. D: The average anti-ZAP-70 fluorescence values of the measurements shownin C were plotted against corresponding values for anti-PTyr fluorescence of TCRz immunoprecipitates that were analyzed in parallel.
256 LUND-JOHANSEN ET AL.
DISCUSSION
Although flow cytometers are typically used for cellularanalysis, their high dynamic range and sensitivity alsomake the instruments well-suited for measurement of sol-uble analytes, when these can be immobilized to latexparticles (9–16). The present study shows that activation-induced protein phosphorylation and protein–protein in-teractions can be measured by FCM analysis of latex par-ticle immunoprecipitates.
The results of FCM-IP analysis were qualitatively com-parable to those obtained with standard Western blottinganalysis, and the assay overcomes several of the problemscommonly associated with this technique. The procedureeliminates electrophoresis and blotting, which are the twomost time-consuming steps in Western blotting. Whenpreparing samples in microwell plates as for FCM-IP anal-ysis, it is feasible to prepare and analyze several hundredimmunoprecipitates within hours. The most important
FIG. 7. Kinetics of ERK-2 phosphorylation determined by flow cytometric immunoprecipitate analysis. A: T-cell blasts were incubated with anti-CD3 andanti-mouse immunoglobulin (IgG) at 37°C for the indicated time periods. Lysates were denatured latex particles with bound anti-ERK-2, or an irrelevantmonoclonal antibody (anti–Keyhole Limpet Hemocyanine; KLH) was added. After incubation with the lysate, particles were stained with polyclonalanti-phospho-ERK-2 kinase and anti-rabbit IgG phycoerythrin and analyzed by flow cytometry. Each data point represents average mean fluorescence ofthe particles at the indicated time point. Error bars indicate SD of three experiments. B: ERK-2 kinase activity was measured in parallel with flow cytometricmeasurement of ERK-2 phosphorylation. Anti-ERK-2 agarose was incubated with aliquots of the lysates and then with myelin basic protein in the presenceP32-labeled ATP. The blot shows radioactivity of myelin basic protein isolated by sodium dodecyl sulfate–polyacrylamide gel electrophoresis as detectedby a phosphoimager.
257FLOW CYTOMETRIC ANALYSIS OF PROTEIN PHOSPHORYLATION
advantage over Western blotting is, however, the ability tobetter standardize and quantitate signals. Currently, quan-titative analysis of Western blots is largely limited to ra-dioactive methods, and multiple steps involved in samplepreparation increase chances of errors due to variableloading and transfer efficiency. Previous studies haveshown that immunoassays based on FCM and latex parti-cles can be optimized to allow accurate measurements ofanalyte concentrations over several orders of magnitude(11). In the present study the working range for detectionof TCRz in lysates of T cells was approximately twodecades (Fig. 2). The relation between fluorescence inten-sity and analyte concentration was not linear (Fig. 2). Apossible explanation for this phenomenon is that sterichinderance results in a gradual decrease in binding capac-ity as the amount of bound TCRz increases on the parti-cles. It is also possible that lack of linearity reflects incom-plete precision of the instruments, such as logarithimcamplification. Therefore, a standard curve is necessary toquantitate the analyte exactly. The use of porous particlesmay enhance binding capacity and provide a proportionalsignal over a wider range of analyte concentration (12).
The primary aim of the present study was not analytequantitation but rather to optimize reproducibility ofphosphorylation measurements. Importantly, the dilutioncurve shown for TCRz demonstrates that particles weresaturated with analyte when using more than 3 mg ofcellular lysate. Thus, errors due to loading variability canbe minimized by using a relatively modest amount ofcellular protein. The ability of the assay to discriminatesignal intensities is clearly demonstrated in Figure 5. For aresponse such as TCRz phosphorylation, one would ex-pect a gradual time-dependent increase followed by agradual decrease. Several possible variables could obscurethis pattern such as differences in protein loading andaddition of antibody. Nevertheless, the pattern was alwaysobserved, even when differences in measured fluores-cence intensity for the time points around the peak of thesignal were only in the order of 10–20%.
The gradual changes in signal intensity were also ob-served for ERK-2. Whereas the development of mAb toPTyr has greatly facilitated studies signaling via tyrosinekinases, similar reagents have not been widely availablefor the study of serine and threonine phosporylation.Therefore, it is particularly intriguing that ERK-2 phos-phorylation could be measured. The similarity in the re-sults obtained with anti-phospho-ERK-2 staining andERK-2 activity suggest that complex multistep radioactivekinase assays may be replaced by simple sandwich assays.
Phosphorylation of ERK-2 is several steps downstreamof phosphorylation of TCRz and ZAP-70 (1). This wasreflected in the kinetics of the two events shown inFigures 5 and 7. Whereas the maximal change in TCRzphosphorylation was observed during the first time inter-val, the largest increase in ERK-2 activation was observedat 1–4 min. Furthermore, ERK-2 phosphorylation returnedto basal levels before TCRz phosphorylation. The ERK-2family of kinases has been suggested to be an importantpoint of integration of multiple signals that are necessary
for T-cell responses such as proliferation and productionof interleukin-2 (21–23). Antibodies to phosphorylatedforms of other members of this important family of kinasesare rapidly becoming available (1); therefore, their activa-tion can most likely be examined in a similar way. Withthe present assay, it should be possible to correlate am-plitudes of phosphorylation of molecules at different lev-els in signaling cascades to better understand how suchintegration occurs and to identify possible thresholds forsignal transduction.
Sandwich assays such as FCM-IP analysis do not provideinformation about molecular weight. Immunoprecipitatesmay contain more than one protein depending on thespecificity of the antibody and the presence of associatedmolecules (Fig. 1). Therefore, interpretation of resultsobtained by FCM-IP analysis depends on prior testing ofreagents in Western blot analysis to determine possiblecross-reactivities and the presence of coprecipitating pro-teins. Ideally, monoclonal antibodies with epitopes ex-posed on denatured proteins such as those used in thepresent study for ZAP-70, TCRz, and ERK-2 should beapplied for immunoprecipitation. However, several anti-bodies precipitate single tyrosine phosphorylated bandsunder native conditions, even when cells are stimulated toachieve very high levels of tyrosine phosphorylation (Fig.4). Therefore, the approach may be suitable for a numberof signaling proteins. The ability to demonstrate an asso-ciation between ZAP-70 and TCRz also suggests that theapproach is generally useful for studies of molecular com-plexes. Initial studies of associations of cyclins have pro-vided promising results (not shown).
Perhaps the largest advantage of FCM over other tech-niques for molecular analysis is the possibility of multiplexanalysis, where each capture reagent is bound to a particlethat can be identified by size or color (10,13). In thepresent study, emphasis was put on simplicity of anti-body–particle conjugation and optimizing capture charac-teristics of the surface by ensuring correct antibody ori-entation. Future work should focus on modification of theconjugation procedure to allow covalent binding of cap-ture mAb to the particles. This is necessary for the use ofmultiple different particles in the same assay. It will thenbe possible to directly correlate multiple signaling eventsin lysates obtained from a small number of cells.
In conclusion, we have developed a method for theanalysis of immunoprecipitates by FCM. The assay allowshigh-throughput determination of amplitudes of signalingevents.
LITERATURE CITED1. Marshall C. MAP kinase kinase kinase, MAP kinase kinase and MAP
kinase. Curr Opin Genet Dev 1995;4:82–89.2. Weiss A, Littman DR. Signal transduction by lymphocyte antigen
receptors. Cell 1994;76:263–274.3. Far D, Peyron J, Imbert V, Rossi B. Immunofluorescent quantification
of tyrosine phosphorylation of cellular proteins in whole cells by flowcytometry. Cytometry 1994;15:327–334.
4. Lund-Johansen F, Frey T, Ledbetter JA, Thompson PA. Apoptosis inhematopoietic cells is associated with an extensive decrease in cel-lular phosphotyrosine content that can be inhibited by the tyrosinephosphatase antagonist pervanadate. Cytometry 1996;25:182–190.
5. Fleisher TA, Dorman SE, Anderson JA, Vail M, Brown MR, Holland SM.
258 LUND-JOHANSEN ET AL.
Detection of intracellular phosphorylated STAT-1 by flow cytometry.Clin Immunol 1999;90:425–430.
6. Juan G, Li X, Darzynkiewicz Z. Phosphorylation of retinoblastomaprotein assayed in individual HL-60 cells during their proliferation anddifferentiation. Exp Cell Res 1998;244:83–92.
7. Juan G, Traganos F, James WM, Ray JM, Roberge M, Sauve DM,Anderson H, Darzynkiewicz Z. Histone H3 phosphorylation and ex-pression of cyclins A and B1 measured in individual cells during theirprogression through G2 and mitosis. Cytometry 1998;32:71–77.
8. Schwarz UR, Geiger J, Walter U, Eigenthaler M. Flow cytometryanalysis of intracellular VASP phosphorylation for the assessment ofactivating and inhibitory signal transduction pathways in humanplatelets—definition and detection of ticlopidine/clopidogrel effects[in process citation]. Thromb Haemost 1999;82:1145–1152.
9. Bishop J, Davis K. A flow cytometric immunoassay for beta(2) micro-globulin in whole blood. J Immunol Methods 1997;210:79–87.
10. Frengen J, Lindmo T, Paus E, Schmid R, Nustad K. Dual analyte assaybased on particle types of different size measured by flow cytometry.J Immunol Methods 1995;178:141–151.
11. Frengen J, Nustad K, Schmid R, Lindmo T. A sequential binding assaywith a working range extending beyond seven orders of magnitude.J Immunol Methods 1995;178:131–140.
12. Frengen J, Schmid R, Kierulf B, Nustad K, Paus E, Berge A, Lindmo T.Homogeneous immunofluorometric assays of alpha-fetoprotein withmacroporous, monosized particles and flow cytometry. Clin Chem1993;39:2174–2181.
13. Fulton RJ, McDade RL, Smith PL, Kienker LJ, Kettman JJ. Advancedmultiplexed analysis with the FlowMetrix system. Clin Chem 1997;43:1749–1756.
14. McHugh TM, Wang YJ, Chong HO, Blackwood LL, Stites DP. Devel-opment of a microsphere-based fluorescent immunoassay and itscomparison to an enzyme immunoassay for the detection of antibod-ies to three antigen preparations from Candida albicans. J ImmunolMethods 1989;116:213–219.
15. Scillian JJ, McHugh TM, Busch MP, Tam M, Fulwyler MJ, Chien DY,Vyas GN. Early detection of antibodies against rDNA-producedHIV proteins with a flow cytometric assay. Blood 1989;73:2041–2048.
16. Utgaard JO, Frengen J, Stigbrand T, Ullen A, Schmid R, Lindmo T.Analyte and label binding assay read by flow cytometry. Clin Chem1996;42:1702–1708.
17. Chan A, Irving B, Fraser J, Weiss A. The z chain is associated with atyrosine kinase and upon T cell antigen receptor stimulation associ-ates with ZAP-70, a 70kDa tyrosine phosphoprotein. Proc Natl AcadSci USA 1991;88:9166–9171.
18. Barber E, Dasgupta J, Schlossman S, Trevillyan J, Rudd C. The CD4and CD8 antigens are coupled to a protein tyrosine kinase (p56lck)that phosphorylates the CD3 complex. Proc Natl Acad Sci USA 1989;86:3277.
19. Davies A, Ley S, Crumpton M. CD5 is phosphorylated on tyrosineafter stimulation of the T cell antigen receptor complex. Proc NatlAcad Sci USA 1992;89:6368.
20. Iwashima M, Irving BA, van ON, Chan AC, Weiss A. Sequentialinteractions of the TCR with two distinct cytoplasmic tyrosine ki-nases. Science 1994;263:1136–1139.
21. Calvo C, Amsen D, Am K. Cytotoxic T lymphocytes antigen 4(CTLA-4) interferes with extracellular signal regulated kinase (ERK)and jun NH2 terminal kinase (JNK) activation, but does not affectphosphorylaton of T cell receptor zeta and ZAP-70. J Exp Med1997;186:1645–1653.
22. Li W, Whaley C, Mondino A, Mueller D. Blocked signal transductionto the ERK and JNK protein kinases in anergic CD41 T cells. Science1996;271:1272–1276.
23. Su B, Jacinto E, Hibi M, Kallunki T, Karin M, Ben-Neriah Y. JNK isinvolved in signal integration during costimulation of T lymphocytes.Cell 1994;77:727–736.
259FLOW CYTOMETRIC ANALYSIS OF PROTEIN PHOSPHORYLATION