Embed Size (px)
Citation preview

This content has been downloaded from IOPscience. Please scroll down to see the full text.
Download details:
IP Address: 129.130.252.222
This content was downloaded on 17/07/2014 at 02:54
Please note that terms and conditions apply.
Flow control by periodic devices: a unifying language for the description of traffic, production,
and metabolic systems
View the table of contents for this issue, or go to the journal homepage for more
J. Stat. Mech. (2011) P05004
(http://iopscience.iop.org/1742-5468/2011/05/P05004)
Home Search Collections Journals About Contact us My IOPscience
J.Stat.M
ech.(2011)
P05004
ournal of Statistical Mechanics:J Theory and Experiment
Flow control by periodic devices: aunifying language for the description oftraffic, production, and metabolicsystems
Till Becker1, Moritz E Beber1, Katja Windt1,Marc-Thorsten Hutt1 and Dirk Helbing2
1 School of Engineering and Science, Jacobs University Bremen, Bremen,Germany2 ETH Zurich, Swiss Federal Institute of Technology, Clausiusstrasse 50, Zurich,SwitzerlandE-mail: [email protected], [email protected],[email protected], [email protected] [email protected]
Received 31 March 2011Accepted 6 April 2011Published 4 May 2011
Online at stacks.iop.org/JSTAT/2011/P05004doi:10.1088/1742-5468/2011/05/P05004
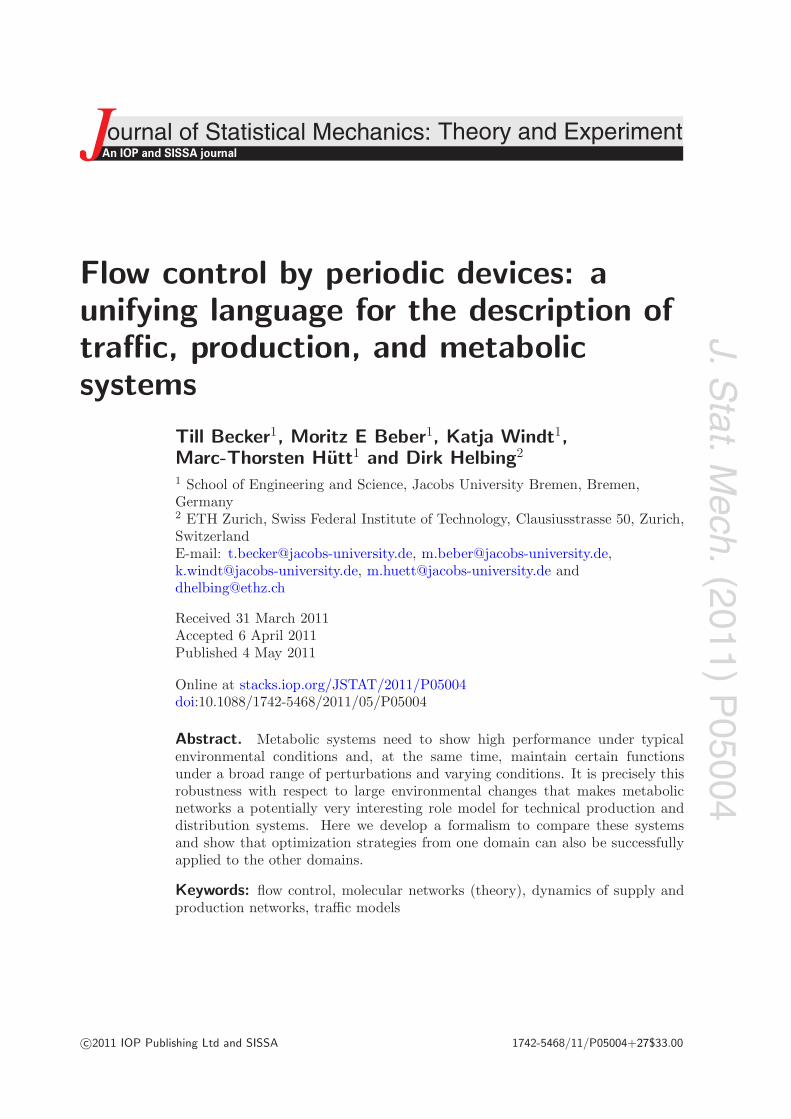
Abstract. Metabolic systems need to show high performance under typicalenvironmental conditions and, at the same time, maintain certain functionsunder a broad range of perturbations and varying conditions. It is precisely thisrobustness with respect to large environmental changes that makes metabolicnetworks a potentially very interesting role model for technical production anddistribution systems. Here we develop a formalism to compare these systemsand show that optimization strategies from one domain can also be successfullyapplied to the other domains.
Keywords: flow control, molecular networks (theory), dynamics of supply andproduction networks, traffic models
c©2011 IOP Publishing Ltd and SISSA 1742-5468/11/P05004+27$33.00
J.Stat.M
ech.(2011)
P05004
Flow control by periodic devices
Contents
1. Introduction 2
2. Systemic analogies 52.1. Periodic devices . . . . . . . . . . . . . . . . . . . . . . . . . . . . . . . . . 52.2. System use and behavior . . . . . . . . . . . . . . . . . . . . . . . . . . . . 6
3. Comparison of system structures 73.1. Network topology . . . . . . . . . . . . . . . . . . . . . . . . . . . . . . . . 73.2. Network elements . . . . . . . . . . . . . . . . . . . . . . . . . . . . . . . . 113.3. Flow organization . . . . . . . . . . . . . . . . . . . . . . . . . . . . . . . . 133.4. System dynamics . . . . . . . . . . . . . . . . . . . . . . . . . . . . . . . . 13
4. Network simulation experiments 174.1. Experiment setup . . . . . . . . . . . . . . . . . . . . . . . . . . . . . . . . 174.2. Results of the computer simulations . . . . . . . . . . . . . . . . . . . . . . 20
5. Summary and conclusion 24
Acknowledgments 25
References 25
1. Introduction
The control of material flow in networks is a common task in many man-made systems.Typical goals of such control strategies are maximizing the output, minimizing waitingtimes, or maintaining stability of the system frequency under changing conditions. Thesesystems can be, e.g., production logistic systems or urban traffic networks. Rising demandfor versatile production processes and the strong interdependencies of different systemshave led to increasingly complex networks with fluctuating inputs, variable operation andsetup times, and a shift from linear to highly networked material flows organized acrossmultiple scales. The more complex these systems become, the less feasible pre-calculatedplans like production programs or simple decision rules based on average system behaviorare. Recent investigations of traffic control in urban road networks have discovered anumber of strategies that allow for a flexible control that adapts to the actual trafficsituation [25, 27]. Despite local decisions, these strategies perform better globally than thepresently used standard system optimization techniques. Adaptive control is a desirableproperty in networks of production logistics and a transfer of those strategies seemspromising especially in the light of the discussion on adaptive/autonomous control [43].An alternative perspective on material flows is offered by metabolic systems. By now,the naturally evolved networks of biochemical reactions making up the metabolic systemsare well characterized for a number of organisms [14]. A complete understanding of thesystem level behavior and the mechanisms of regulation of these reactions, however, is still
doi:10.1088/1742-5468/2011/05/P05004 2
J.Stat.M
ech.(2011)
P05004
Flow control by periodic devices
missing. The difficulties, to some extent, lie in the multiple kinds of regulation that occuron different timescales: (1) transcriptional, (2) post-transcriptional, (3) translational,(4) post-translational, (5) metabolic regulation, and (6) signaling pathways.
In spite of the deep functional parallels between these systems—material flows inprocesses of industrial production, traffic flows in urban road networks and metabolicflows in biochemical networks in cells—and the strong similarities in the challenges andunsolved problems, a methodological transfer and attempts at quantitative comparisonhave been difficult. They are in particular impeded by the lack of a common terminologyand common formal representation of these systems. Here, we argue that we can map allthese systems onto the formal language of flow networks controlled by interdependentperiodic devices. Providing such an abstract treatment yet applicable formalism forsystems from traffic control, logistics, and the study of metabolism enables a commonconsideration of the remaining problems and allows for the transfer of existing solutions.
All three areas have unanswered questions regarding network behavior. Complexnetworks in production logistics make it difficult to establish a feasible productionplan. Companies struggle to control the production in such a way that its realizationmatches the production plan. Additionally, the companies’ internal resource distribution(e.g. employment of workforce, purchasing of raw material, etc) is dependent oncorrespondence of production planning and control. Complexity in logistics is notonly influenced by network structure, but also by heterogeneous products and varyingproduction parameters. Different production steps can require different lead times, whichmay vary between seconds and hours. Lot sizes can also differ from product to productor variant to variant. Consequently, a favorable sequencing of orders at one point in theproduction does not necessarily need to be favorable at a different point. Synchronizationof production processes is a possibility to control a production flow over multiple stages andthus is expected to decrease waiting times in production. However, the above mentionedcomplexity impedes simple approaches to synchronization. Synchronization algorithmsneed to deal with the specific characteristics of logistic networks and production processes,e.g. varying input and varying setup and operation times.
Traffic networks tend to be less heterogeneous than production networks regardingthe network elements. A major challenge in traffic networks is the varying networkload depending on the time of the day. Control algorithms for switching traffic lightsat intersections need to be adaptive so that they can adjust to the current traffic load. Ifalgorithms are optimized for specific traffic load situations, they are expected to performworse under different conditions. Algorithms that are designed for average situationsmay even never perform as well as desired, as the average situation itself may neveroccur. The circumstances of varying network loads experienced in traffic networks canalso be observed in production networks as stated above. Therefore, existing traffic controlalgorithms could be applied in logistic networks in an effort to deal with varying input.
Metabolic systems are not only diverse in their regulation (as described above), butalso in the elements (compounds and enzymes) as well as the conditions under whichthey operate and the objectives they perform. Furthermore, the timescales of differentprocesses in metabolism vary greatly. The complicated interaction of all these aspectsmakes metabolism a difficult subject to study, but at the same time it represents anefficient ‘solution’ to problems like operation under varying system inputs, which hassteadily improved through evolution and has clear parallels in traffic and logistics systems.
doi:10.1088/1742-5468/2011/05/P05004 3
J.Stat.M
ech.(2011)
P05004
Flow control by periodic devices
We hope to answer the following questions in the future by creating a common formaldescription. How does network topology affect existing adaptive control procedures? Dothe network size and further parameters have an influence on control performance? Doesmetabolism offer control principles that can be transferred to traffic or production control?However, before we deal with all of these problems, we want to describe the model andanswer the following basic questions.
(1) Is it possible to develop a unified description of control in traffic, production, andmetabolic networks?
(2) Can we transfer existing, well performing control procedures from one network typeto the other network types and simultaneously keep up the level of performance?
(3) Can we identify coherent or synchronous behaviors in adaptive control structuresregardless of the network type?
Subsequent to our analysis of the different network types, we address these three questionsin our simulation study in section 4.
The starting point for our comparison of system elements is a series of recentpublications on traffic flow control in urban road networks (see, e.g., [23, 25, 27]). All thosepublications depend on a treatment of traffic lights as periodic devices, an observationthat equally applies to the mechanics of production machines [33] and enzymes [7, 10, 17].We extend this parallel to the system level by the use of graph-theoretical models fromall three fields of study. This work deals primarily with the analysis of control in existingnetworks. We want to gain an understanding of the dynamics of flow control in thedifferent disciplines and their networks. A future step would be the derivation of rulesfor network design aimed at finding the most suitable network structures for flow controlusing periodic devices, as well as bringing the formal (minimal) model gradually closerto each field of application by incorporating more realistic descriptions of the (generic)periodic devices.
In this paper, we present the first step toward a framework suitable for modelingscenarios from traffic, metabolism, and production logistics. The framework contains acollection of descriptions regarding network structure, elements, and dynamics, as well asa definition of commonalities and differences. In section 2 we describe cyclic machines(periodic devices) as the basic constituents of the system and explore how they shapesystem behavior observations that are at the basis of a unified treatment of the threesystems. In order to establish a systematic collection of parallel elements, three differentmodel layers are presented in section 3, namely necessary abstractions for a uniformnetwork structure (section 3.1), a common treatment of network elements (section 3.2),and the expected system dynamics resulting from such a model (section 3.4). Section 4presents a simulation study which shows the applicability of the model.
As a consequence of this unifying perspective on traffic, logistics, and metabolism, weexpect a mutual transfer of insights. For example, metabolic regulation may be explainedfrom an engineering perspective or an understanding of biological design may be appliedto the construction and control of artificial networks. Even unsuccessful attempts atknowledge transfer have interesting implications for the boundaries of the consideredhypotheses.
doi:10.1088/1742-5468/2011/05/P05004 4
J.Stat.M
ech.(2011)
P05004
Flow control by periodic devices
(a) (b)
(c)
(d)
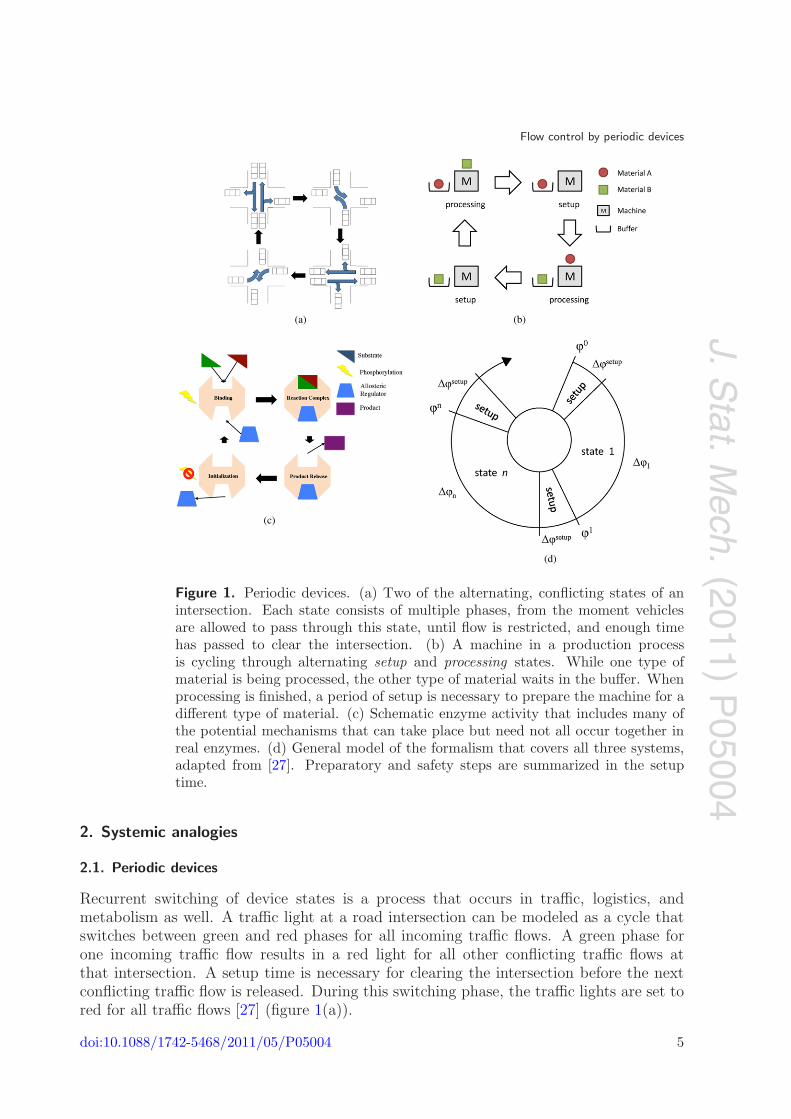
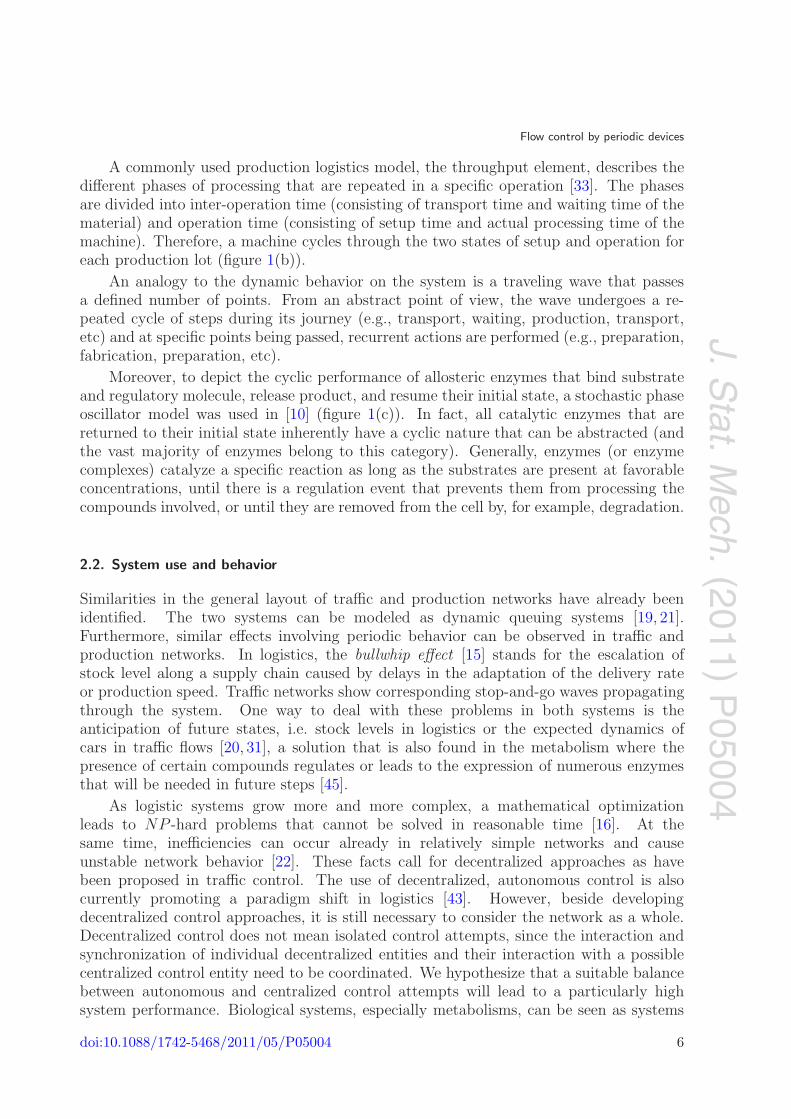
Figure 1. Periodic devices. (a) Two of the alternating, conflicting states of anintersection. Each state consists of multiple phases, from the moment vehiclesare allowed to pass through this state, until flow is restricted, and enough timehas passed to clear the intersection. (b) A machine in a production processis cycling through alternating setup and processing states. While one type ofmaterial is being processed, the other type of material waits in the buffer. Whenprocessing is finished, a period of setup is necessary to prepare the machine for adifferent type of material. (c) Schematic enzyme activity that includes many ofthe potential mechanisms that can take place but need not all occur together inreal enzymes. (d) General model of the formalism that covers all three systems,adapted from [27]. Preparatory and safety steps are summarized in the setuptime.
2. Systemic analogies
2.1. Periodic devices
Recurrent switching of device states is a process that occurs in traffic, logistics, andmetabolism as well. A traffic light at a road intersection can be modeled as a cycle thatswitches between green and red phases for all incoming traffic flows. A green phase forone incoming traffic flow results in a red light for all other conflicting traffic flows atthat intersection. A setup time is necessary for clearing the intersection before the nextconflicting traffic flow is released. During this switching phase, the traffic lights are set tored for all traffic flows [27] (figure 1(a)).
doi:10.1088/1742-5468/2011/05/P05004 5
J.Stat.M
ech.(2011)
P05004
Flow control by periodic devices
A commonly used production logistics model, the throughput element, describes thedifferent phases of processing that are repeated in a specific operation [33]. The phasesare divided into inter-operation time (consisting of transport time and waiting time of thematerial) and operation time (consisting of setup time and actual processing time of themachine). Therefore, a machine cycles through the two states of setup and operation foreach production lot (figure 1(b)).
An analogy to the dynamic behavior on the system is a traveling wave that passesa defined number of points. From an abstract point of view, the wave undergoes a re-peated cycle of steps during its journey (e.g., transport, waiting, production, transport,etc) and at specific points being passed, recurrent actions are performed (e.g., preparation,fabrication, preparation, etc).
Moreover, to depict the cyclic performance of allosteric enzymes that bind substrateand regulatory molecule, release product, and resume their initial state, a stochastic phaseoscillator model was used in [10] (figure 1(c)). In fact, all catalytic enzymes that arereturned to their initial state inherently have a cyclic nature that can be abstracted (andthe vast majority of enzymes belong to this category). Generally, enzymes (or enzymecomplexes) catalyze a specific reaction as long as the substrates are present at favorableconcentrations, until there is a regulation event that prevents them from processing thecompounds involved, or until they are removed from the cell by, for example, degradation.
2.2. System use and behavior
Similarities in the general layout of traffic and production networks have already beenidentified. The two systems can be modeled as dynamic queuing systems [19, 21].Furthermore, similar effects involving periodic behavior can be observed in traffic andproduction networks. In logistics, the bullwhip effect [15] stands for the escalation ofstock level along a supply chain caused by delays in the adaptation of the delivery rateor production speed. Traffic networks show corresponding stop-and-go waves propagatingthrough the system. One way to deal with these problems in both systems is theanticipation of future states, i.e. stock levels in logistics or the expected dynamics ofcars in traffic flows [20, 31], a solution that is also found in the metabolism where thepresence of certain compounds regulates or leads to the expression of numerous enzymesthat will be needed in future steps [45].
As logistic systems grow more and more complex, a mathematical optimizationleads to NP -hard problems that cannot be solved in reasonable time [16]. At thesame time, inefficiencies can occur already in relatively simple networks and causeunstable network behavior [22]. These facts call for decentralized approaches as havebeen proposed in traffic control. The use of decentralized, autonomous control is alsocurrently promoting a paradigm shift in logistics [43]. However, beside developingdecentralized control approaches, it is still necessary to consider the network as a whole.Decentralized control does not mean isolated control attempts, since the interaction andsynchronization of individual decentralized entities and their interaction with a possiblecentralized control entity need to be coordinated. We hypothesize that a suitable balancebetween autonomous and centralized control attempts will lead to a particularly highsystem performance. Biological systems, especially metabolisms, can be seen as systems
doi:10.1088/1742-5468/2011/05/P05004 6
J.Stat.M
ech.(2011)
P05004
Flow control by periodic devices
involving transportation, decomposition, and production of compounds. At the sametime, the ensemble of these individual operations forms a complex network that has beenfrequently analyzed with graph-theoretical methods over the past ten years [24, 41]. Thisenables us to draw parallels between all three areas from a functional and from a structuralperspective. Biologically inspired control approaches have already been used and appliedin logistics systems [2, 3, 8, 36, 37, 39]. The reason for learning from biology in engineeringis the aim of creating stable and robust systems. Driving systems toward maximumperformance can lead to instability and breakdowns, whereas, on evolutionary grounds,biological systems can be expected to contain an adequate (and competitive) balanceof high performance and investments into systemic robustness. Metabolic pathwaysthemselves (and not only their regulation on the genetic level) are subject to adaptiveprocesses guided by evolutionary selection. Some parts, e.g., the TCA cycle and glycolysis,are highly conserved among all organisms, indicating a universally applicable designpattern [13]. It is relevant that biological systems, on an evolutionary timescale and acrosslarge populations, ‘afford’ the ‘luxury’ of sampling a broad range of variations before asolution stabilizes over time and within a range of species. This luxury is difficult to mimicin the technical realm because, for technical systems, one cannot try out a multitude ofblueprints and check them all for robustness against fluctuations or for ease of control.However, given the reliability of available models, computer simulations could do so.
Another problem results from the fact that the metabolism can producesimultaneously a plethora of different products, while avoiding conflicts induced by sharedresources (e.g., acetyl-CoA, ATP, etc), involved in a multitude of biochemical reactions.Biological systems are renowned for achieving homeostasis, i.e., the ability to functionstably despite serious fluctuations both in their surroundings and within themselves. Inorder to understand the effects and merits of different forms of control that make suchrobust behavior possible, a systematic comparison of parallels between the systems willbe carried out in the following section.
3. Comparison of system structures
3.1. Network topology
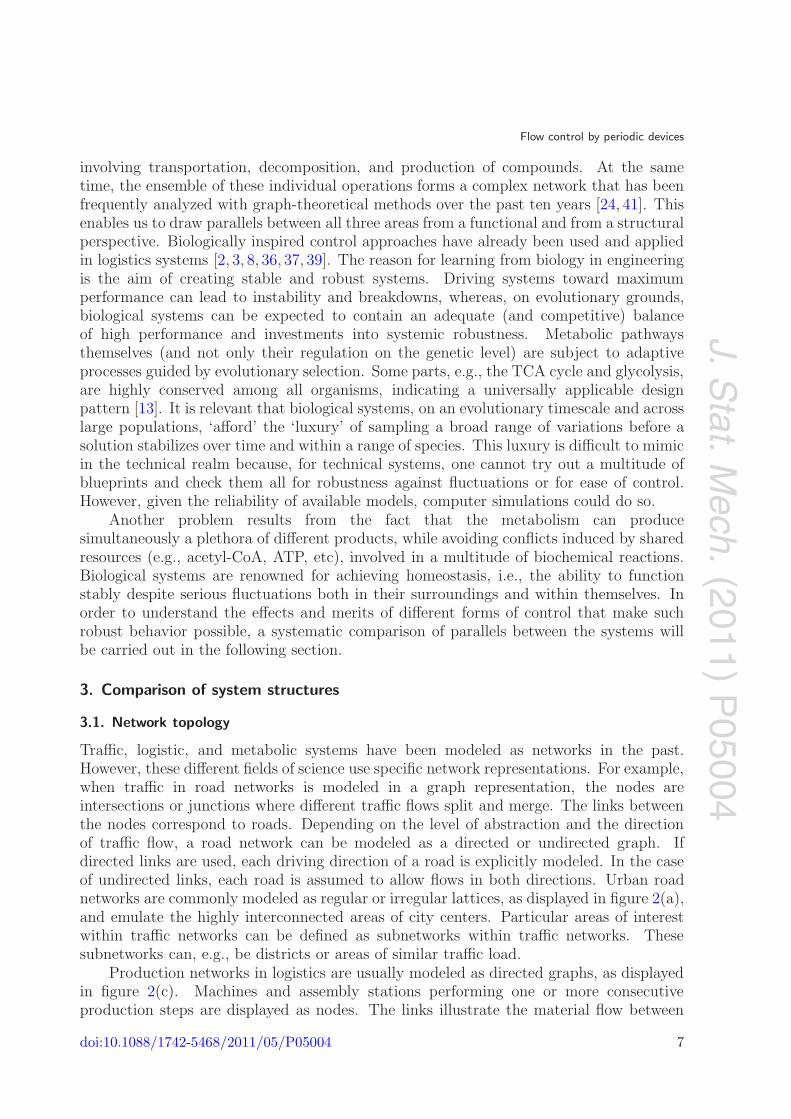
Traffic, logistic, and metabolic systems have been modeled as networks in the past.However, these different fields of science use specific network representations. For example,when traffic in road networks is modeled in a graph representation, the nodes areintersections or junctions where different traffic flows split and merge. The links betweenthe nodes correspond to roads. Depending on the level of abstraction and the directionof traffic flow, a road network can be modeled as a directed or undirected graph. Ifdirected links are used, each driving direction of a road is explicitly modeled. In the caseof undirected links, each road is assumed to allow flows in both directions. Urban roadnetworks are commonly modeled as regular or irregular lattices, as displayed in figure 2(a),and emulate the highly interconnected areas of city centers. Particular areas of interestwithin traffic networks can be defined as subnetworks within traffic networks. Thesesubnetworks can, e.g., be districts or areas of similar traffic load.
Production networks in logistics are usually modeled as directed graphs, as displayedin figure 2(c). Machines and assembly stations performing one or more consecutiveproduction steps are displayed as nodes. The links illustrate the material flow between
doi:10.1088/1742-5468/2011/05/P05004 7
J.Stat.M
ech.(2011)
P05004
Flow control by periodic devices
Figure 2. Network representations. (a) Urban road network. (b) Metabolicpathway network. (c) Production network. (d) Product structure graph.(e) Assembly priority chart.
the machines. As the direction of the material flow is of major importance along theproduction cycle of a product, the links need to be directed. Backward steps in aproduction process occur in very few instances. A backward-oriented or cyclic materialflow can take place, e.g., for rework purposes after quality control. A second, commongraph representation in logistics is the product structure graph, also called the bill ofmaterials [34, 38], as illustrated in figure 2(d). The product structure graph is a tree.The root node symbolizes the final product after the assembly is complete. The nodeson the following levels of the tree are either assembly groups or parts. Assembly groupsconsist of multiple parts or additional assembly groups. Parts are always leaf nodes asthey are atomistic elements. Consequently, they cannot be found in any other level ofthe tree. An assembly group cannot be a leaf node as it is still divisible. In contrast tothe machine-centered view of the production network graph, the product structure graphis product-centered. It can be used to determine how many atomistic parts a product iscomposed of and in which order the parts need to be assembled. Figure 2(e) shows anassembly priority chart which has a similar function: it displays the assembly activitiesas nodes and dependences between the activities as links. A directed link pointing froma node A to a node C indicates that activity A has to be finished before activity C canbegin. The more to the left an activity is located, the earlier it can be carried out in theassembly process. This kind of graph is machine/activity-centered and indicates temporaldependences between production steps [4, 32].
doi:10.1088/1742-5468/2011/05/P05004 8
J.Stat.M
ech.(2011)
P05004
Flow control by periodic devices
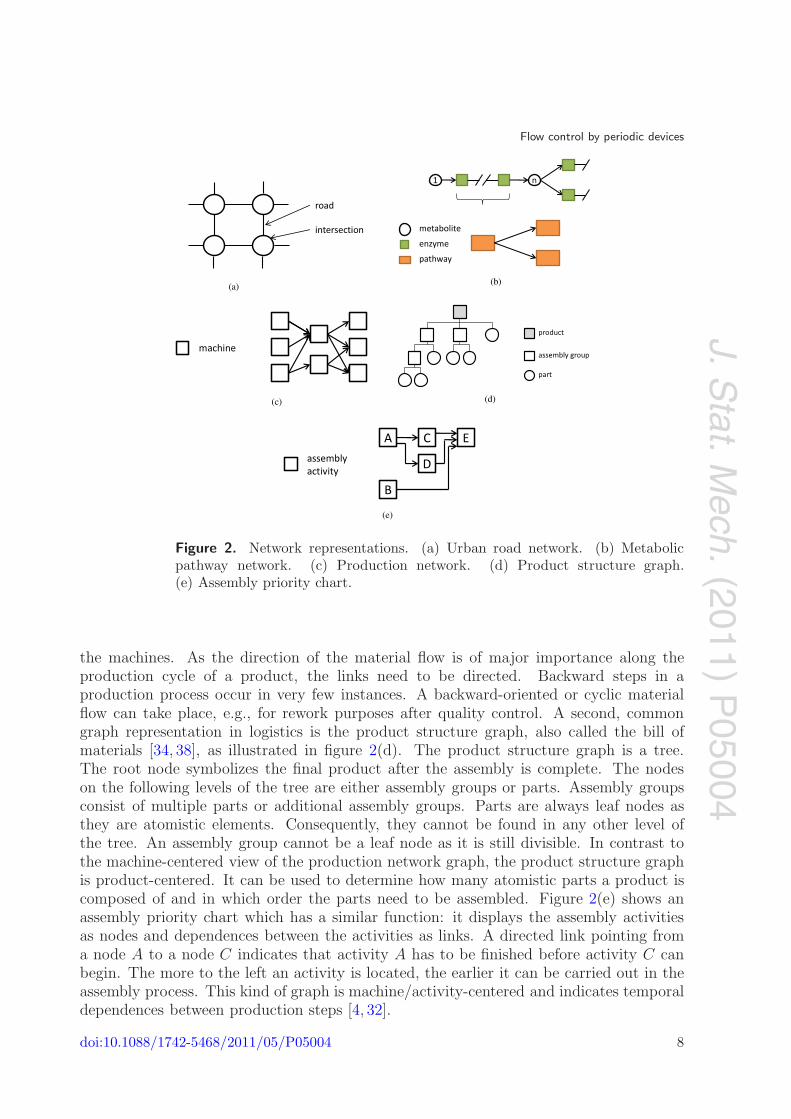
Figure 3. Transformation of a bipartite metabolic network into two unipartitenetworks. The enzyme-centric network (c) is generated by omitting themetabolite nodes from the bipartite network (a). The remaining networkcorresponds to the production network in logistics. It displays in which orderthe enzymes act, but does not show the involved metabolites (the links areprovided with metabolites in this figure to make the transformation clearer).The metabolite-centric network (b) is equivalent to a product structure graphin logistics. Here, the enzyme nodes are omitted and the remaining metabolitenodes are connected by directed links. The direction of the link indicates whichmetabolites are transformed into which product.
The metabolism is the complete set of biochemical reactions that take place in anorganism. In this study we restrict our view to single cell behavior which, nevertheless,may be subdivided into multiple compartments. Reactions transform a number ofcompounds (substrates) into others (products) in a stoichiometrically balanced fashion,i.e., in relative proportions dictated by chemical requirements, similar to prescribedassembly groups in an industrial production process. Most reactions are made availablethrough the catalytic activity of enzymes, i.e., proteins that are the product of certaingenes. When and how genes are expressed determines, in principle, which transformationscan occur and which ones are unavailable.
A complete view of the metabolism requires a bipartite network representing bothcompounds and reactions as nodes that share directional links as defined by substrateand product status (see figure 3 top left). Nevertheless, the whole metabolism object canbe projected onto a unipartite network (having only one type of node), e.g., a metabolite-centric network, a reaction-centric network, or a phenomenological pathway map. Sucha phenomenological map is defined by biochemical knowledge and divides the systeminto functional modules built up from main metabolites (with secondary or ‘currency’metabolites balancing charge and other chemical properties at each step). The unipartiteprojections of the metabolism have their drawbacks due to the condensation of informationbut, interestingly, they very closely resemble the graph structures used in logistics.
The reaction-centric graph, which consists of reaction nodes and links between themif they share a compound (substrate for one and product for the other), mirrors the
doi:10.1088/1742-5468/2011/05/P05004 9
J.Stat.M
ech.(2011)
P05004
Flow control by periodic devices
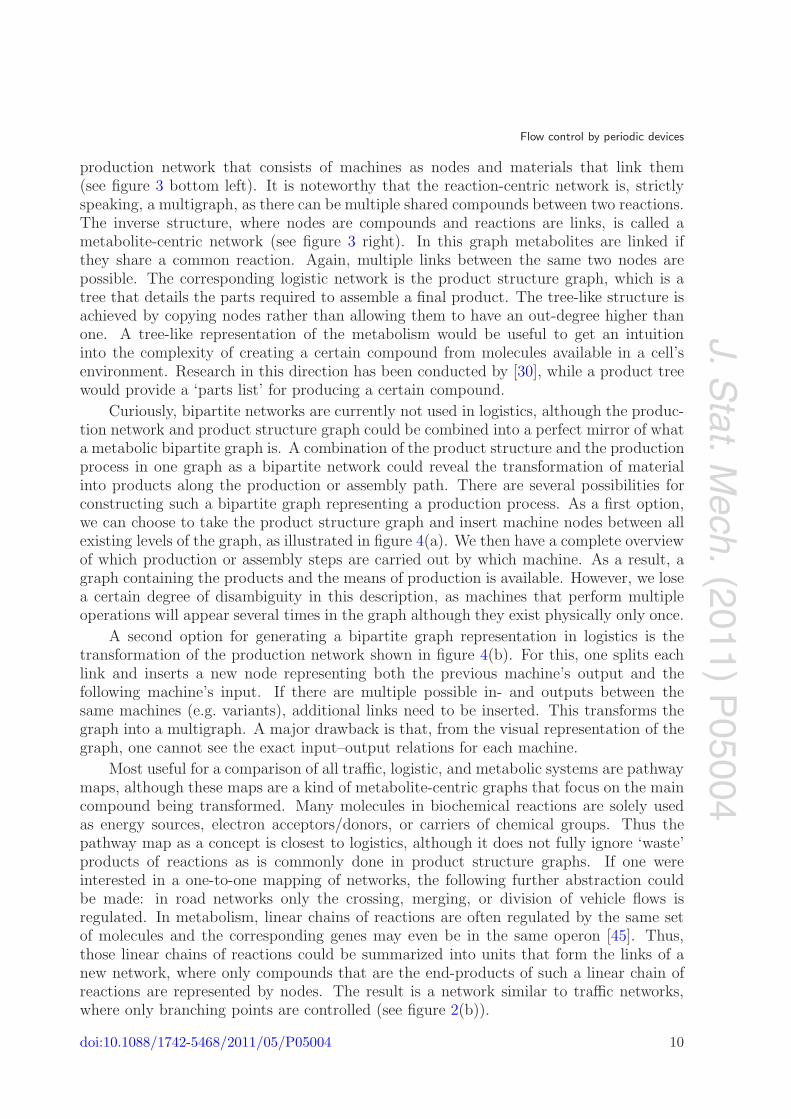
production network that consists of machines as nodes and materials that link them(see figure 3 bottom left). It is noteworthy that the reaction-centric network is, strictlyspeaking, a multigraph, as there can be multiple shared compounds between two reactions.The inverse structure, where nodes are compounds and reactions are links, is called ametabolite-centric network (see figure 3 right). In this graph metabolites are linked ifthey share a common reaction. Again, multiple links between the same two nodes arepossible. The corresponding logistic network is the product structure graph, which is atree that details the parts required to assemble a final product. The tree-like structure isachieved by copying nodes rather than allowing them to have an out-degree higher thanone. A tree-like representation of the metabolism would be useful to get an intuitioninto the complexity of creating a certain compound from molecules available in a cell’senvironment. Research in this direction has been conducted by [30], while a product treewould provide a ‘parts list’ for producing a certain compound.
Curiously, bipartite networks are currently not used in logistics, although the produc-tion network and product structure graph could be combined into a perfect mirror of whata metabolic bipartite graph is. A combination of the product structure and the productionprocess in one graph as a bipartite network could reveal the transformation of materialinto products along the production or assembly path. There are several possibilities forconstructing such a bipartite graph representing a production process. As a first option,we can choose to take the product structure graph and insert machine nodes between allexisting levels of the graph, as illustrated in figure 4(a). We then have a complete overviewof which production or assembly steps are carried out by which machine. As a result, agraph containing the products and the means of production is available. However, we losea certain degree of disambiguity in this description, as machines that perform multipleoperations will appear several times in the graph although they exist physically only once.
A second option for generating a bipartite graph representation in logistics is thetransformation of the production network shown in figure 4(b). For this, one splits eachlink and inserts a new node representing both the previous machine’s output and thefollowing machine’s input. If there are multiple possible in- and outputs between thesame machines (e.g. variants), additional links need to be inserted. This transforms thegraph into a multigraph. A major drawback is that, from the visual representation of thegraph, one cannot see the exact input–output relations for each machine.
Most useful for a comparison of all traffic, logistic, and metabolic systems are pathwaymaps, although these maps are a kind of metabolite-centric graphs that focus on the maincompound being transformed. Many molecules in biochemical reactions are solely usedas energy sources, electron acceptors/donors, or carriers of chemical groups. Thus thepathway map as a concept is closest to logistics, although it does not fully ignore ‘waste’products of reactions as is commonly done in product structure graphs. If one wereinterested in a one-to-one mapping of networks, the following further abstraction couldbe made: in road networks only the crossing, merging, or division of vehicle flows isregulated. In metabolism, linear chains of reactions are often regulated by the same setof molecules and the corresponding genes may even be in the same operon [45]. Thus,those linear chains of reactions could be summarized into units that form the links of anew network, where only compounds that are the end-products of such a linear chain ofreactions are represented by nodes. The result is a network similar to traffic networks,where only branching points are controlled (see figure 2(b)).
doi:10.1088/1742-5468/2011/05/P05004 10
J.Stat.M
ech.(2011)
P05004
Flow control by periodic devices
(a)
(b)
Figure 4. Possible bipartite graph representations in logistics. (a) Transformationof a product structure graph into a bipartite graph. The product structure graphrepresents the decomposition of the final product (root node) into its assemblygroups (intermediate nodes) and atomistic parts (leaf nodes). The parts andgroups are assembled bottom-up, therefore a machine node is inserted betweeneach assembly group (output) and all its composing parts (input). The machinenode illustrates which machine (or assembly station) performs the transformationof the lower level nodes to the assembly group one level above. This can lead to amultiple appearance of one and the same machine, e.g. if the transformation stepsat M2 and M3 are performed by an identical machine. (b) Transformation of aproduction network into a bipartite graph. The links are provided by the partthat is the output of the link’s source and the input for the link’s target. If thereare multiple possible output parts that flow to the same machine (e.g. variants),the graph becomes a multigraph (see dotted link). From this graph representationit is not recognizable which input–output combinations a machine has, if thereare multiple input or output parts. For example, it remains unclear whether aand b are prerequisites for both d and e , or whether maybe only a is transformedto d and b to e .
3.2. Network elements
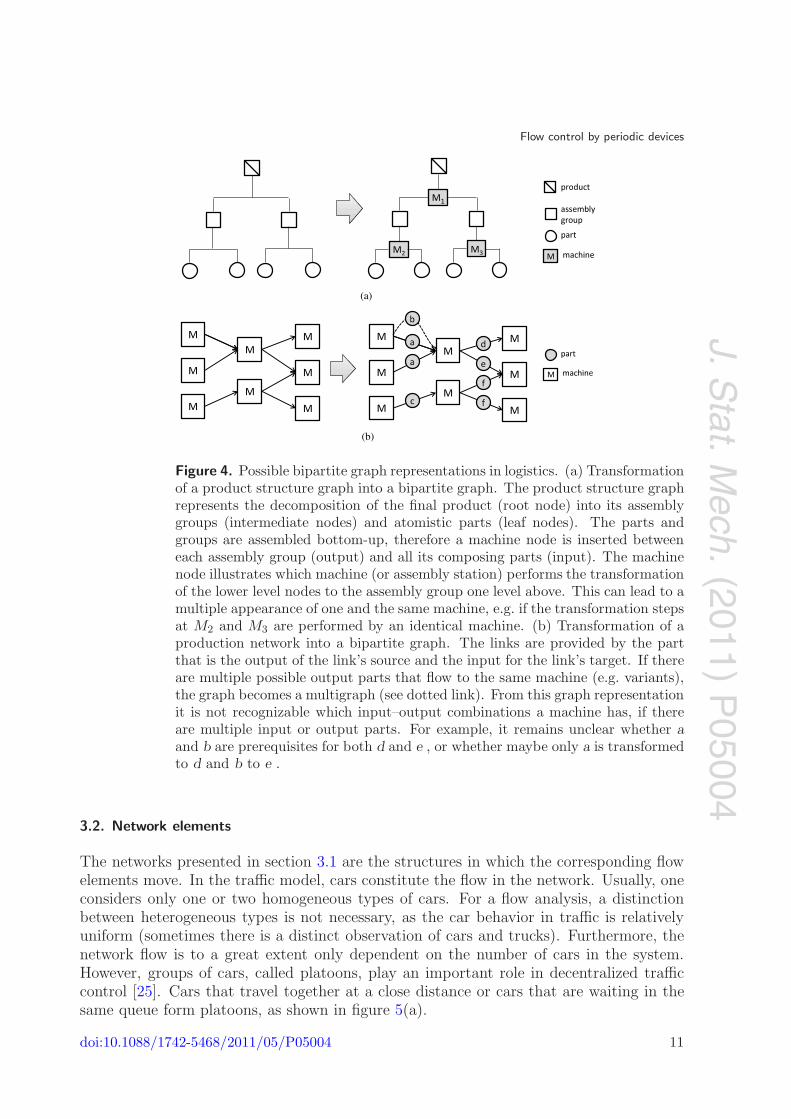
The networks presented in section 3.1 are the structures in which the corresponding flowelements move. In the traffic model, cars constitute the flow in the network. Usually, oneconsiders only one or two homogeneous types of cars. For a flow analysis, a distinctionbetween heterogeneous types is not necessary, as the car behavior in traffic is relativelyuniform (sometimes there is a distinct observation of cars and trucks). Furthermore, thenetwork flow is to a great extent only dependent on the number of cars in the system.However, groups of cars, called platoons, play an important role in decentralized trafficcontrol [25]. Cars that travel together at a close distance or cars that are waiting in thesame queue form platoons, as shown in figure 5(a).
doi:10.1088/1742-5468/2011/05/P05004 11
J.Stat.M
ech.(2011)
P05004
Flow control by periodic devices
(a) (b)
Figure 5. Flow elements and groups in traffic and logistics. (a) Platoons of carsin road networks. (b) Production lots in a logistic production network.
The flow elements in logistic networks are materials and products at every stage ofproduction or assembly. The elements can range from raw materials over semi-finishedproducts to finished and packed products. Groups of products in logistics are usuallycalled lots or batches, as displayed in figure 5(b). Lot-sizing takes place whenever itis reasonable to handle a group of products instead of single products. This appliesespecially to mass products and is less often the case when products are rather individual.Using lots in production primarily avoids setup times as one operation is carried outrepeatedly. However, lots may also be formed due to customer orders or packagingrestrictions. Operating traffic lights in a manner that leads to ‘group formation’ hastwo advantages that are very similar to the case of production logistics. (1) The ‘cost’ ofsetup times is equally distributed over all elements in a group so that, at the system level,switching becomes less expensive. (2) Due to the ‘cost mechanics’, groups of elementsare prioritized (for example, by ‘green waves’) which leads to less switching and highersystem throughput [25]. Additional flow elements in production networks, depending onthe level of detail, can be workers, tools, consumables, files, etc. Finally, there can be anon-physical information flow representing, e.g., orders or status information.
Similarly to production logistics, compounds are transformed at each step of a reactionnetwork. However, when it comes to a heterogeneity of elements and group formation,two perspectives exist:
(1) a generalization of material flow into metabolic fluxes whose heterogeneity is onlygiven by their corresponding reaction; the only importance in this view is given tothe amount of material carried per unit of time (typically measured as mmol s−1);
(2) a more detailed look at the transport of specific kinds of atoms (most prominentlycarbon) or chemical groups (for example nitrate) and their flows through the system;here, the individual molecule matters because it consists of a particular numberof elements that it carries through the system, and the aspect of grouping can beexplored.
Depending on the concentration of these compounds, there may be large groups of thesame kind present in a cell but there are never the same kinds of compounds in differentparts of the network, in contrast to road networks. However, since we know the exactrules of material combination, as given by the network, and we know that only one typeof material can be on a given link (or node if we consider the bipartite network), we canneglect the heterogeneity of the compounds and focus only on the material fluxes, theirdivision, and fusion. Such a view on metabolism is adopted, for example, by flux balanceanalysis (FBA—see [40]). In flux balance analysis optimal material flows are computedfrom the stoichiometric information on metabolism and an assumed objective function.
doi:10.1088/1742-5468/2011/05/P05004 12
J.Stat.M
ech.(2011)
P05004
Flow control by periodic devices
Compounds and reactions in metabolism are specific, a distinction we can neglect fora unified mathematical treatment. We only require the stoichiometric balancing of thesystem and all the other information is encoded in the metabolic network.
3.3. Flow organization
The routes of material s through a given network are determined by a number of factors.For each system, the degree of freedom of each factor varies between ‘adaptive’ and‘predetermined’.
(1) Plasticity. Networks are usually perceived as static, but this often corresponds onlyto a momentary snapshot. Roads may be closed due to construction works, jams,accidents, and other emergencies, production facilities in factories may break down,and the effective metabolic network is given by the fluxes through biochemicalreactions triggered by gene expression.
(2) Autonomy of elements. Despite the apparent homogeneity of cars in traffic networks,they are actually agents that behave individually since they have a specific originand destination. Nevertheless, drivers behave in typical ways that can be reasonablywell modeled, e.g., their preference for main roads, the main flow directions duringrush hours, etc. In production and metabolic systems, the flow consists of inanimateobjects and their fate is fully encoded by the system (see the next point).
(3) Control. As specified in the previous point, the flow works differently in trafficnetworks on the one hand and logistics and metabolic networks on the other.Consequently, material flows are controlled differently as well. In urban road networksit is only the continuation of flow that is controlled. Usually, no constraints areimposed on the direction of the elements (with respect to the underlying network, ofcourse). In logistics networks, the standard procedure is to maintain a productionplan which details the exact route through the network. In the metabolism, we canbroadly distinguish three different control strategies. (1) Similarly to the productionplan there are global strategies in place that affect plasticity. Part of those globalstrategies respond to external signals and part to internal system states. (2) Thenthere are local feedback mechanisms, i.e., the concentration of downstream elementseither negatively or positively influences the production rate of precursors upstream.(3) If more than one reaction competes for the same compound, the final route ofthat compound through the system depends on a stochastic process that is usuallymodeled by the likelihood of compound and enzyme (complex) encounter. The routestaken by compounds are then finally determined by stochastic processes that dependon the concentrations of enzymes and educts.
The idea of feedback has recently been adapted by the logistics community and wasdiscussed in the framework of ‘autonomous control’ in, for example, [35, 43, 44]. Feedbackcontrol of machines itself is not a new topic, however, and has been discussed at lengthby systems theorists, e.g., Wiener [42].
3.4. System dynamics
As discussed in section 3.3, control is a major contributor to the paths of material flowsthrough a network. Control is also the key component of implementing system ‘goals’ or
doi:10.1088/1742-5468/2011/05/P05004 13
J.Stat.M
ech.(2011)
P05004
Flow control by periodic devices
the enforcement of a desired system behavior. For all three types of system, based on theprevious discussion of network elements, we can broadly distinguish two different kinds ofcontrol: (1) flow control carried out by the nodes determining which one of the incoming,conflicting flows is released; (2) path selection of the individual flow elements. The twomeans of control may also be used in a combined approach, as they are not mutuallyexclusive. However, the two approaches have different characteristics. The intersection-oriented flow control tends to be less complex because only the nodes make decisions. Incontrast to this, the path-selection approach needs to take individual decisions for eachflow element. Moreover, the path through the network may be fixed due to the abovementioned constraints resulting from the initial network design. Therefore, focusing onthe network nodes as flow control devices seems to be the most promising approach.
To be able to carry out the aspired to comparison and transfer of control structuresbetween the three fields of research, we need to take a closer look at the control structuresof the different network types. In traffic networks, traffic lights at the intersection nodescontrol the flow of incoming cars by releasing or inhibiting selected flow directions.Thus, traffic lights switch between discrete states of flow and setups that are repeatedperiodically, as depicted in figure 1(a). The behavior in production logistics is analogous:a buffer containing selected items is released for production on a machine. While theseitems are processed, any other items have to wait. Between the processing of twodifferent flows, a setup time can be required. Hence, the controlling node in the logisticnetwork cycles through discrete states, akin to the traffic light control. Control structuresin metabolic networks, however, are more complex. There are three major means ofmetabolic regulation.
(1) Gene regulation and what it entails determines which reactions are available. Ifenzymes of a certain kind are not expressed, the probability of the correspondingreaction is very low. In the case where the expression of an enzyme is discontinued, itwill take a while until the existing enzymes are degraded and the material flow stops.
(2) Covalent enzyme modifications through, for example, signaling pathways. A typicalmodification is phosphorylation of an enzyme which leads to a conformational changethat will either activate or deactivate the enzyme. This is a continuous type ofregulation that, nevertheless, behaves in a switch-like way, as there are numerousenzymes present in a cell, but the signal is usually very abundant.
(3) Regulation of the enzyme through non-covalent binding with other molecules.Examples are the competition of similarly shaped molecules for the active site ofthe enzyme, binding of a regulatory molecules at a site other than the active site(allosteric), and positive or negative feedbacks via products of the same reaction.
There are, generally, no discrete states of flow and no-flow in metabolic networks.Rather, continuous states between zero and maximum flow (as physiologically determined)are possible and experiments measuring metabolic fluxes have shown that they span sixorders of magnitude [1]. Despite the continuity of states, however, they often displaysigmoid behavior individually, which is very close to an ‘on–off switch’. For an overviewof mathematical modeling of regulation in the metabolism, see [11, 12, 18, 45].
Importantly, the control devices form their own network layer on top of the materialflow network and these two networks may be interconnected in various ways (for anintroduction to interconnectedness, see [9]). We can imagine different scenarios here.
doi:10.1088/1742-5468/2011/05/P05004 14
J.Stat.M
ech.(2011)
P05004
Flow control by periodic devices
(a)
(b) (c)
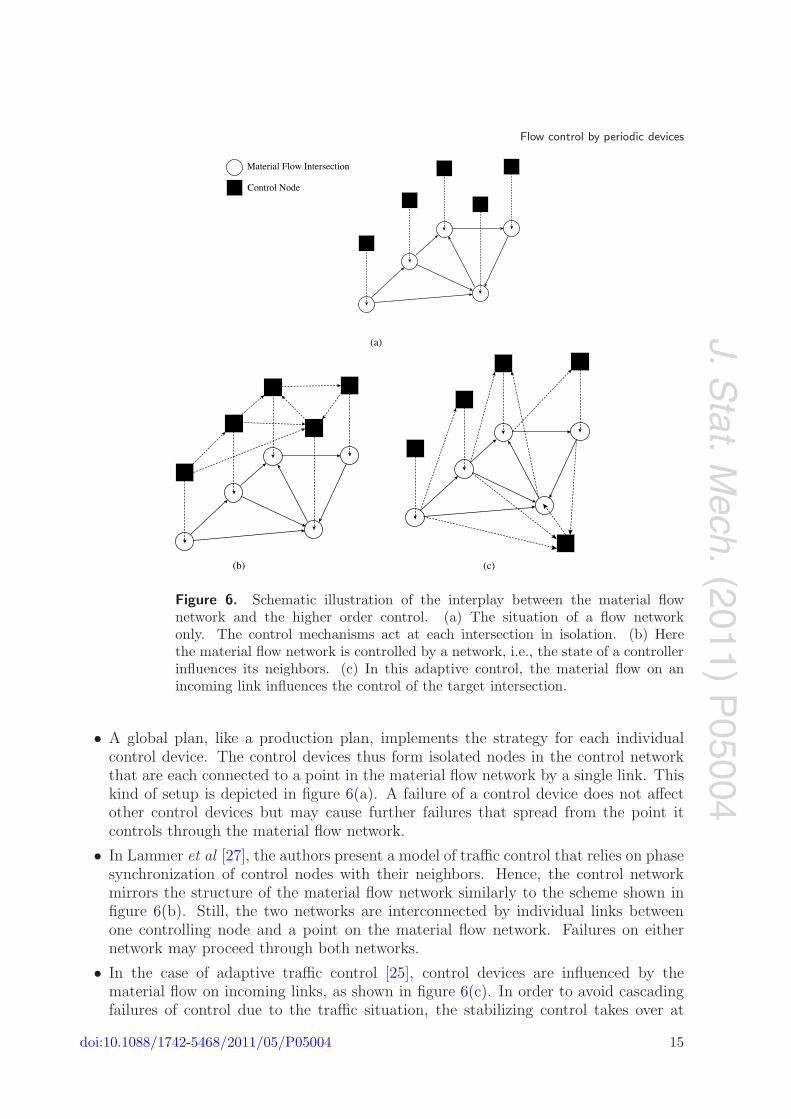
Figure 6. Schematic illustration of the interplay between the material flownetwork and the higher order control. (a) The situation of a flow networkonly. The control mechanisms act at each intersection in isolation. (b) Herethe material flow network is controlled by a network, i.e., the state of a controllerinfluences its neighbors. (c) In this adaptive control, the material flow on anincoming link influences the control of the target intersection.
• A global plan, like a production plan, implements the strategy for each individualcontrol device. The control devices thus form isolated nodes in the control networkthat are each connected to a point in the material flow network by a single link. Thiskind of setup is depicted in figure 6(a). A failure of a control device does not affectother control devices but may cause further failures that spread from the point itcontrols through the material flow network.
• In Lammer et al [27], the authors present a model of traffic control that relies on phasesynchronization of control nodes with their neighbors. Hence, the control networkmirrors the structure of the material flow network similarly to the scheme shown infigure 6(b). Still, the two networks are interconnected by individual links betweenone controlling node and a point on the material flow network. Failures on eithernetwork may proceed through both networks.
• In the case of adaptive traffic control [25], control devices are influenced by thematerial flow on incoming links, as shown in figure 6(c). In order to avoid cascadingfailures of control due to the traffic situation, the stabilizing control takes over at
doi:10.1088/1742-5468/2011/05/P05004 15
J.Stat.M
ech.(2011)
P05004
Flow control by periodic devices
critical traffic levels. The stabilization scheme resorts to a control scheme, as shownin figure 6(a).
• The metabolism offers the most complicated situation of all. Gene regulationrepresents a network with clear hierarchies but no evidence for centralized control.The state of the regulatory networks depends on key external signals, but certainelements of the material flow may also influence the regulatory state and thus becomecontrol devices themselves. Beyond the transcriptional regulatory network, othermechanisms of regulation exert an influence on the expression state of metabolic genesand thus on the availability of enzymes: the three-dimensional folding structure ofthe DNA determines whether a gene can be read off and small regulatory RNAs playa major role as a set of specific regulatory factors. In addition, the transcriptionalmachinery is under strong regulation, as are the proteins involved in the shaping ofDNA compactification and decompactification [29].
Local, decentralized control is in place to achieve one or more system-wide goals. Theoverall goal in traffic networks is obviously to minimize the average travel time of eachcar, or the overall travel time [6, 19, 25]. As there is a maximum velocity for cars in roadnetworks, minimizing or avoiding waiting times or times of reduced speed (congestion)seems an appropriate goal. One important constraint, however, exists: there is a maximumwaiting time at intersections for single cars, as drivers would not accept excessive waitingtimes, even if this would contribute to a higher performance regarding the overall goal.
The performance of a production logistics system is measured according to the fourtargets of production logistics: high schedule reliability, short throughput time, highutilization, and low work in progress [33]. Beside these four performance measures, lowcost per unit is a goal.
Short throughput time more or less corresponds to the aspired to low travel time intraffic. High schedule reliability corresponds to the aforementioned constraint of aimingto avoid excessive waiting times. The two remaining targets, high utilization and lowwork in progress have no counterparts in the traffic model, as utilization and the numberof elements in the system are externally determined parameters. The four logistic targetsare interconnected and influence each other. For example, enforcing a high utilization ofthe system usually leads to a high amount of work in progress, and vice versa. Therefore,a simple optimization of the target system consisting of the four individual targets isnot possible. A trade-off has to be found between the conflicting targets rather thanoptimizing all of them at once. This can be achieved by using weighting factors to displaya certain preference for each target [44]. Another possibility is to find a suitable switchingstrategy that selects the target that currently needs to be controlled depending on thestate of target achievement.
As in logistics, the metabolism and its regulation underlie a number of often conflictinggoals. One of the most well-known goals is energy production and minimization of energyconsumption, which is in direct conflict with robustness and necessary redundancy. Butthere are a number of other factors that play a role, for example the synthesis of buildingblocks for the maintenance and proliferation of the cell, minimal production of toxic orreactive compound species, or maintenance of physiological conditions (which includeacidity, salinity, osmolarity, etc). In the field of flux balance analysis, some of these goalsare stated in a vector of compounds a cell should produce, and others may be encoded inthe system itself (like export of toxic substances, robustness to fluctuating conditions, etc).
doi:10.1088/1742-5468/2011/05/P05004 16
J.Stat.M
ech.(2011)
P05004
Flow control by periodic devices
Overall, the goals discussed so far define distinct strategies that steer the systemtoward certain behaviors. Beyond that we can also identify ‘meta-goals’ that can onlybe achieved by a combination of strategies implemented in the system. In logistics, forexample, one such ‘meta-goal‘is sustainable production that results in long market times.Quite similarly, the struggle for survival in organisms allows more time for reproductionand potentially successful proliferation of genetic material. Surprisingly, success in bothfields is measured as performance in competition, be that at the market or in evolution.
In summary, we have identified elements from traffic, logistics, and metabolic systemsthat perform similar functions and display comparable behavior. Thus we have shown thatextending an existing mathematical formalism to all three systems is not only plausiblebut also advantageous. We have therefore found the common description that we askedfor in section 1. Consequently, any description or theory found in one field of studycan immediately be applied to and verified in the other fields. Apart from the benefitseach area of research may reap from this, it also clarifies the generalizable and limitingproperties of any such model. On the basis of this general formalism we can proceed toelucidate the remaining questions posed in section 1 that ask about the performance ofexisting procedures in other areas of research and whether synchronous system behaviordepends on system topology.
4. Network simulation experiments
4.1. Experiment setup
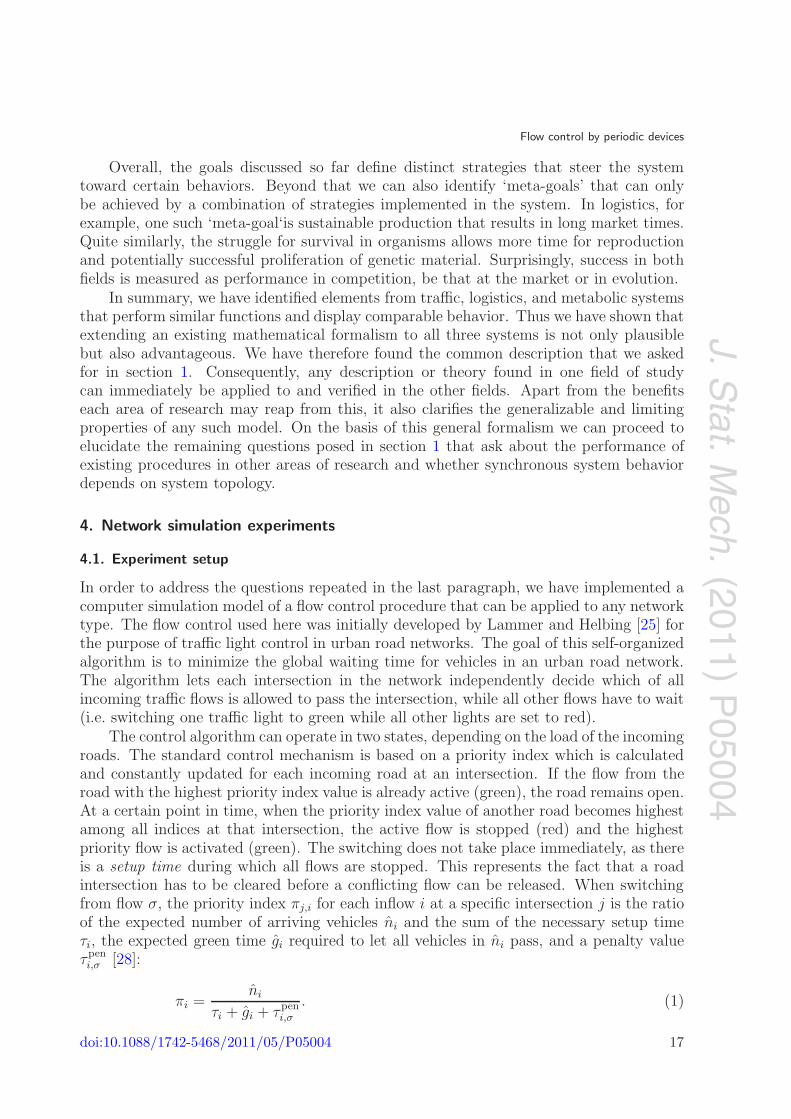
In order to address the questions repeated in the last paragraph, we have implemented acomputer simulation model of a flow control procedure that can be applied to any networktype. The flow control used here was initially developed by Lammer and Helbing [25] forthe purpose of traffic light control in urban road networks. The goal of this self-organizedalgorithm is to minimize the global waiting time for vehicles in an urban road network.The algorithm lets each intersection in the network independently decide which of allincoming traffic flows is allowed to pass the intersection, while all other flows have to wait(i.e. switching one traffic light to green while all other lights are set to red).
The control algorithm can operate in two states, depending on the load of the incomingroads. The standard control mechanism is based on a priority index which is calculatedand constantly updated for each incoming road at an intersection. If the flow from theroad with the highest priority index value is already active (green), the road remains open.At a certain point in time, when the priority index value of another road becomes highestamong all indices at that intersection, the active flow is stopped (red) and the highestpriority flow is activated (green). The switching does not take place immediately, as thereis a setup time during which all flows are stopped. This represents the fact that a roadintersection has to be cleared before a conflicting flow can be released. When switchingfrom flow σ, the priority index πj,i for each inflow i at a specific intersection j is the ratioof the expected number of arriving vehicles ni and the sum of the necessary setup timeτi, the expected green time gi required to let all vehicles in ni pass, and a penalty valueτpeni,σ [28]:
πi =ni
τi + gi + τpeni,σ
. (1)
doi:10.1088/1742-5468/2011/05/P05004 17
J.Stat.M
ech.(2011)
P05004
Flow control by periodic devices
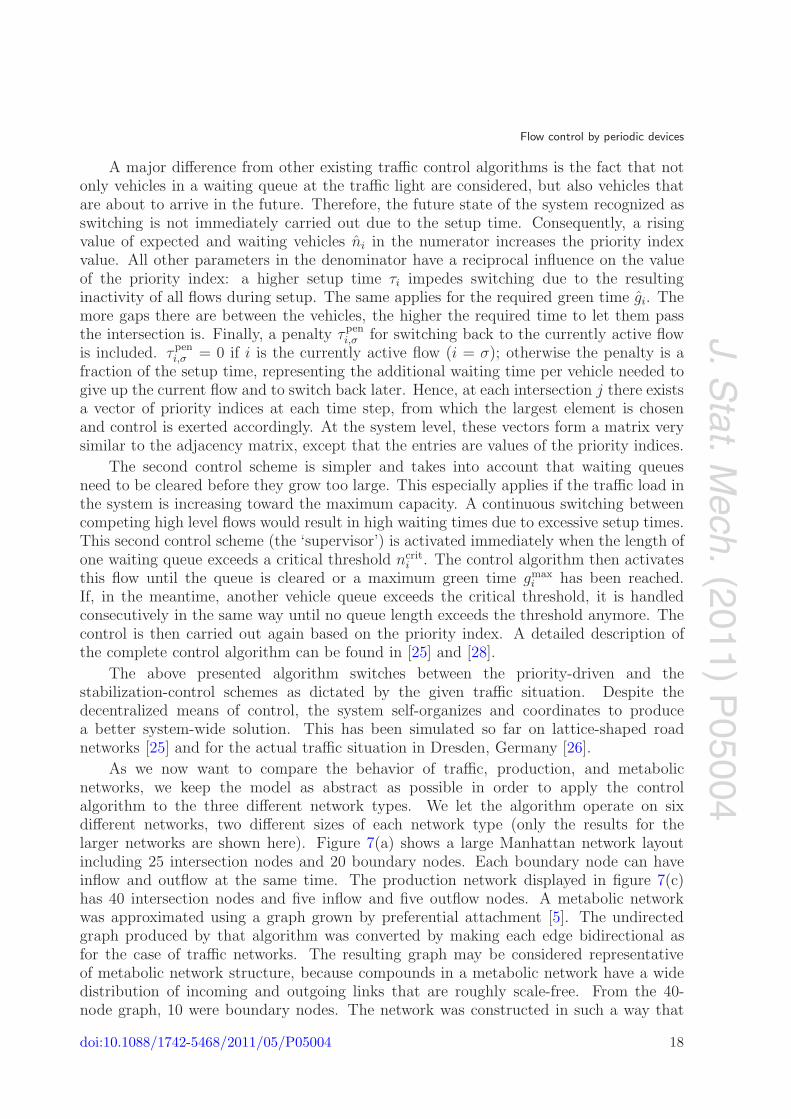
A major difference from other existing traffic control algorithms is the fact that notonly vehicles in a waiting queue at the traffic light are considered, but also vehicles thatare about to arrive in the future. Therefore, the future state of the system recognized asswitching is not immediately carried out due to the setup time. Consequently, a risingvalue of expected and waiting vehicles ni in the numerator increases the priority indexvalue. All other parameters in the denominator have a reciprocal influence on the valueof the priority index: a higher setup time τi impedes switching due to the resultinginactivity of all flows during setup. The same applies for the required green time gi. Themore gaps there are between the vehicles, the higher the required time to let them passthe intersection is. Finally, a penalty τpen
i,σ for switching back to the currently active flowis included. τpen
i,σ = 0 if i is the currently active flow (i = σ); otherwise the penalty is afraction of the setup time, representing the additional waiting time per vehicle needed togive up the current flow and to switch back later. Hence, at each intersection j there existsa vector of priority indices at each time step, from which the largest element is chosenand control is exerted accordingly. At the system level, these vectors form a matrix verysimilar to the adjacency matrix, except that the entries are values of the priority indices.
The second control scheme is simpler and takes into account that waiting queuesneed to be cleared before they grow too large. This especially applies if the traffic load inthe system is increasing toward the maximum capacity. A continuous switching betweencompeting high level flows would result in high waiting times due to excessive setup times.This second control scheme (the ‘supervisor’) is activated immediately when the length ofone waiting queue exceeds a critical threshold ncrit
i . The control algorithm then activatesthis flow until the queue is cleared or a maximum green time gmax
i has been reached.If, in the meantime, another vehicle queue exceeds the critical threshold, it is handledconsecutively in the same way until no queue length exceeds the threshold anymore. Thecontrol is then carried out again based on the priority index. A detailed description ofthe complete control algorithm can be found in [25] and [28].
The above presented algorithm switches between the priority-driven and thestabilization-control schemes as dictated by the given traffic situation. Despite thedecentralized means of control, the system self-organizes and coordinates to producea better system-wide solution. This has been simulated so far on lattice-shaped roadnetworks [25] and for the actual traffic situation in Dresden, Germany [26].
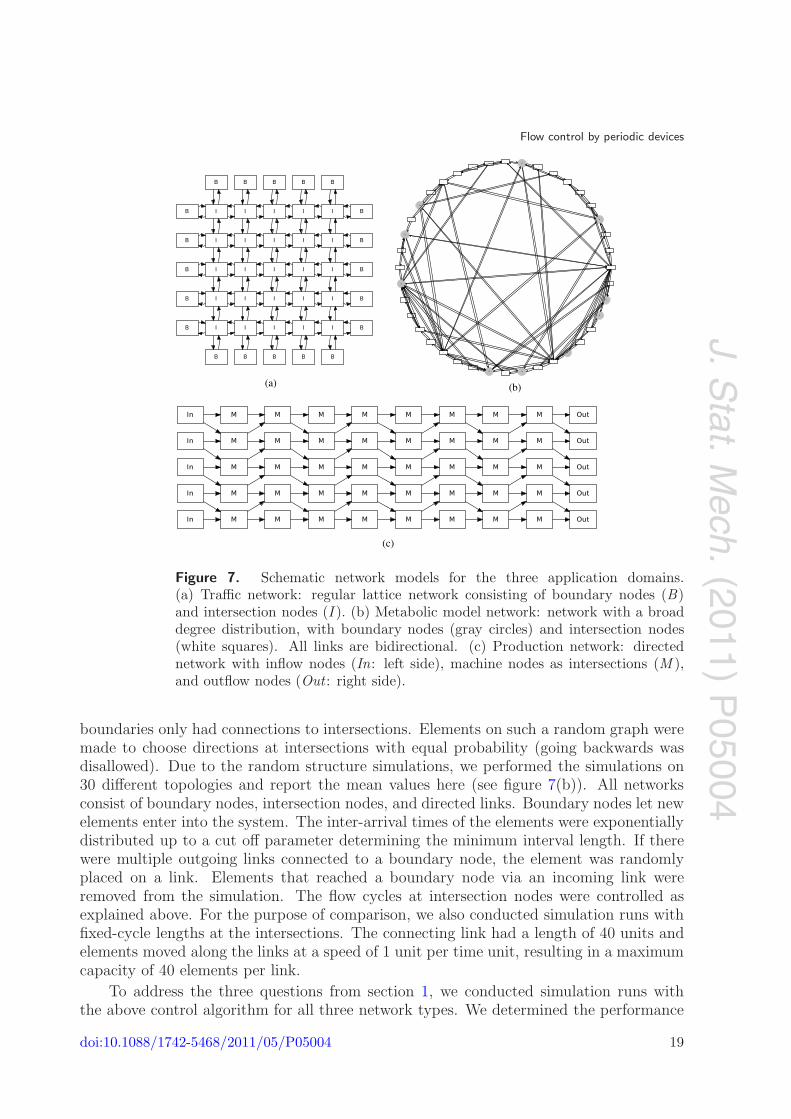
As we now want to compare the behavior of traffic, production, and metabolicnetworks, we keep the model as abstract as possible in order to apply the controlalgorithm to the three different network types. We let the algorithm operate on sixdifferent networks, two different sizes of each network type (only the results for thelarger networks are shown here). Figure 7(a) shows a large Manhattan network layoutincluding 25 intersection nodes and 20 boundary nodes. Each boundary node can haveinflow and outflow at the same time. The production network displayed in figure 7(c)has 40 intersection nodes and five inflow and five outflow nodes. A metabolic networkwas approximated using a graph grown by preferential attachment [5]. The undirectedgraph produced by that algorithm was converted by making each edge bidirectional asfor the case of traffic networks. The resulting graph may be considered representativeof metabolic network structure, because compounds in a metabolic network have a widedistribution of incoming and outgoing links that are roughly scale-free. From the 40-node graph, 10 were boundary nodes. The network was constructed in such a way that
doi:10.1088/1742-5468/2011/05/P05004 18
J.Stat.M
ech.(2011)
P05004
Flow control by periodic devices
(a) (b)
(c)
Figure 7. Schematic network models for the three application domains.(a) Traffic network: regular lattice network consisting of boundary nodes (B)and intersection nodes (I ). (b) Metabolic model network: network with a broaddegree distribution, with boundary nodes (gray circles) and intersection nodes(white squares). All links are bidirectional. (c) Production network: directednetwork with inflow nodes (In: left side), machine nodes as intersections (M ),and outflow nodes (Out : right side).
boundaries only had connections to intersections. Elements on such a random graph weremade to choose directions at intersections with equal probability (going backwards wasdisallowed). Due to the random structure simulations, we performed the simulations on30 different topologies and report the mean values here (see figure 7(b)). All networksconsist of boundary nodes, intersection nodes, and directed links. Boundary nodes let newelements enter into the system. The inter-arrival times of the elements were exponentiallydistributed up to a cut off parameter determining the minimum interval length. If therewere multiple outgoing links connected to a boundary node, the element was randomlyplaced on a link. Elements that reached a boundary node via an incoming link wereremoved from the simulation. The flow cycles at intersection nodes were controlled asexplained above. For the purpose of comparison, we also conducted simulation runs withfixed-cycle lengths at the intersections. The connecting link had a length of 40 units andelements moved along the links at a speed of 1 unit per time unit, resulting in a maximumcapacity of 40 elements per link.
To address the three questions from section 1, we conducted simulation runs withthe above control algorithm for all three network types. We determined the performance
doi:10.1088/1742-5468/2011/05/P05004 19
J.Stat.M
ech.(2011)
P05004
Flow control by periodic devices
(waiting time per element in system) and created figures reflecting the oscillatory behavior(i.e. the frequency distribution of green phase intervals).
4.2. Results of the computer simulations
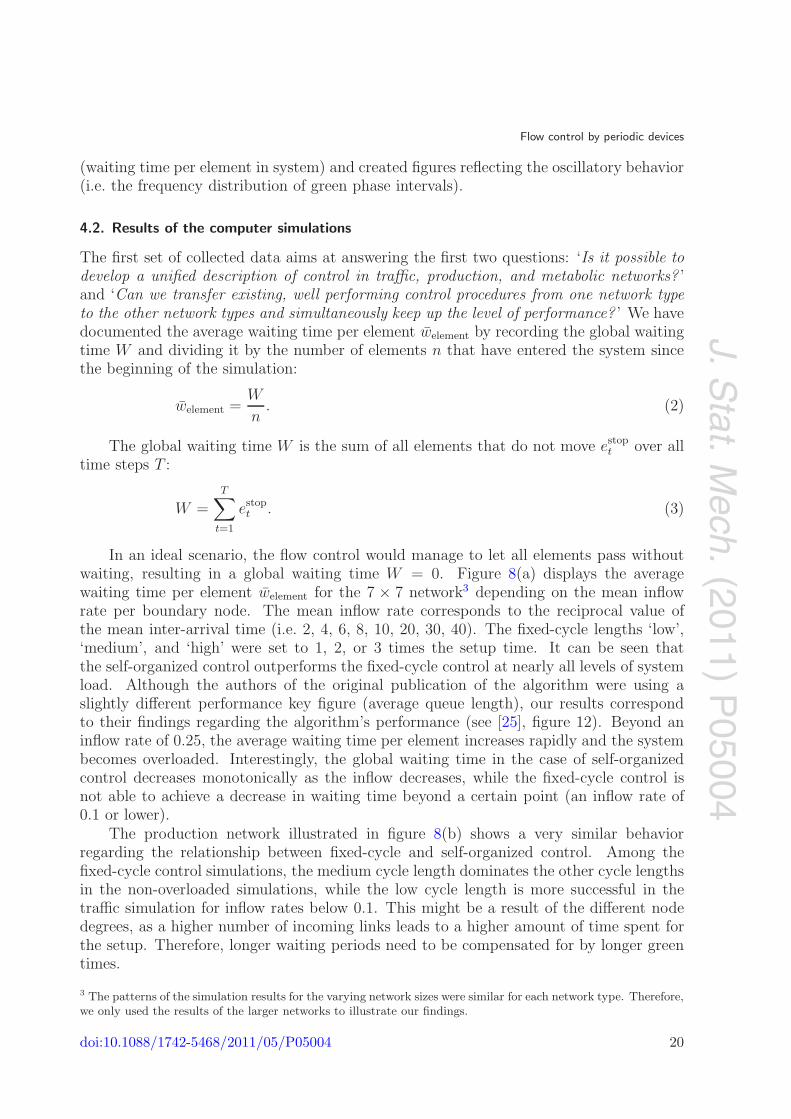
The first set of collected data aims at answering the first two questions: ‘Is it possible todevelop a unified description of control in traffic, production, and metabolic networks? ’and ‘Can we transfer existing, well performing control procedures from one network typeto the other network types and simultaneously keep up the level of performance? ’ We havedocumented the average waiting time per element welement by recording the global waitingtime W and dividing it by the number of elements n that have entered the system sincethe beginning of the simulation:
welement =W
n. (2)
The global waiting time W is the sum of all elements that do not move estopt over all
time steps T :
W =T∑
t=1
estopt . (3)
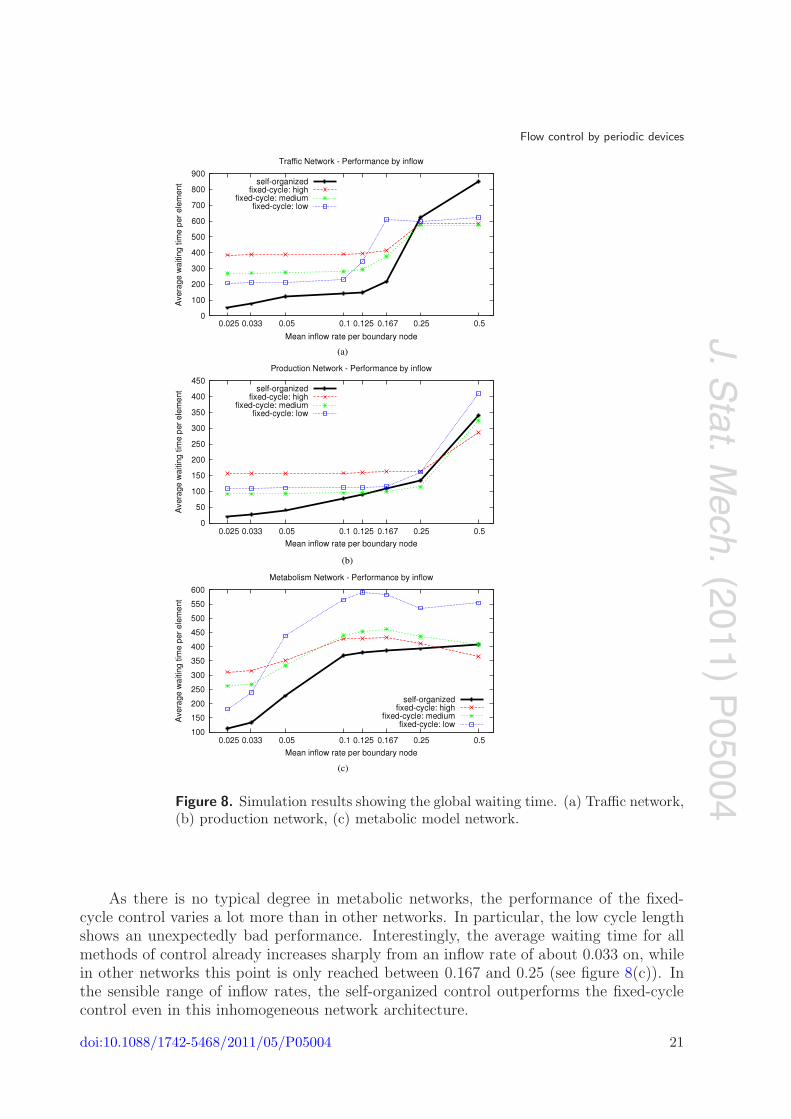
In an ideal scenario, the flow control would manage to let all elements pass withoutwaiting, resulting in a global waiting time W = 0. Figure 8(a) displays the averagewaiting time per element welement for the 7 × 7 network3 depending on the mean inflowrate per boundary node. The mean inflow rate corresponds to the reciprocal value ofthe mean inter-arrival time (i.e. 2, 4, 6, 8, 10, 20, 30, 40). The fixed-cycle lengths ‘low’,‘medium’, and ‘high’ were set to 1, 2, or 3 times the setup time. It can be seen thatthe self-organized control outperforms the fixed-cycle control at nearly all levels of systemload. Although the authors of the original publication of the algorithm were using aslightly different performance key figure (average queue length), our results correspondto their findings regarding the algorithm’s performance (see [25], figure 12). Beyond aninflow rate of 0.25, the average waiting time per element increases rapidly and the systembecomes overloaded. Interestingly, the global waiting time in the case of self-organizedcontrol decreases monotonically as the inflow decreases, while the fixed-cycle control isnot able to achieve a decrease in waiting time beyond a certain point (an inflow rate of0.1 or lower).
The production network illustrated in figure 8(b) shows a very similar behaviorregarding the relationship between fixed-cycle and self-organized control. Among thefixed-cycle control simulations, the medium cycle length dominates the other cycle lengthsin the non-overloaded simulations, while the low cycle length is more successful in thetraffic simulation for inflow rates below 0.1. This might be a result of the different nodedegrees, as a higher number of incoming links leads to a higher amount of time spent forthe setup. Therefore, longer waiting periods need to be compensated for by longer greentimes.
3 The patterns of the simulation results for the varying network sizes were similar for each network type. Therefore,we only used the results of the larger networks to illustrate our findings.
doi:10.1088/1742-5468/2011/05/P05004 20
J.Stat.M
ech.(2011)
P05004
Flow control by periodic devices
Figure 8. Simulation results showing the global waiting time. (a) Traffic network,(b) production network, (c) metabolic model network.
As there is no typical degree in metabolic networks, the performance of the fixed-cycle control varies a lot more than in other networks. In particular, the low cycle lengthshows an unexpectedly bad performance. Interestingly, the average waiting time for allmethods of control already increases sharply from an inflow rate of about 0.033 on, whilein other networks this point is only reached between 0.167 and 0.25 (see figure 8(c)). Inthe sensible range of inflow rates, the self-organized control outperforms the fixed-cyclecontrol even in this inhomogeneous network architecture.
doi:10.1088/1742-5468/2011/05/P05004 21
J.Stat.M
ech.(2011)
P05004
Flow control by periodic devices
Coming back to the need for a unified description of control in the different type ofsystems and the possible transfer of existing control procedures between them, we canstate that such a unified model exists and furthermore that the simulation experimentsshow that this model can also be applied to a large variety of environments. Additionally,the self-organized traffic light control has been successfully transferred and applied todifferent network structures. We are confident that additional control strategies can beapplied across different network types.
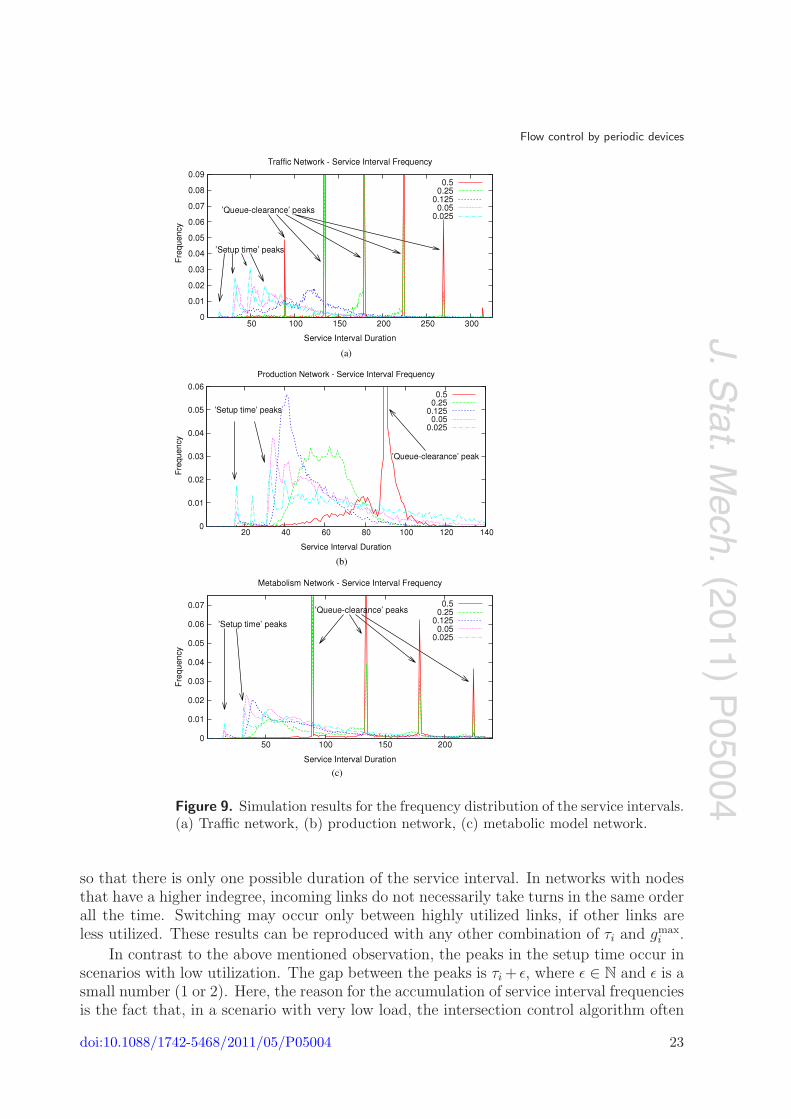
A second set of data has been collected to support the search for an answer to thethird question: ‘Can we identify coherent or synchronous behavior in adaptive controlstructures regardless of the network type? ’ To study this we chose again a measure usedin [25], the service interval frequency distribution. The service interval zi of a link idirected to a node p is defined as the duration between the start of a green phase and thestart of the successive green phase. This means that zi is the sum of the green time gi,the red time ri, and the setup time τi:
zi = gi + ri + τi (4)
ri =∑
gj + τj ∀ j ∈ Ip\i. (5)
The red time ri is again the sum of the green times and setup times of all incominglinks Ip at the intersection node p, except link i itself.
The frequency of the occurrence of a service interval tells us a lot about periodicbehavior. If certain service interval durations occur more often than other intervals, wecan assume that there is a repetitive process of equal duration. Let us now discuss theservice interval frequency density graphs of the three network types. Figure 9 shows theservice interval frequencies for five different inflow ratios at the boundary nodes. Eachinflow rate is represented by one of the curves. The graphs have several of the expectedpeaks indicating periodic behavior. We divided the observed peaks into queue-clearancepeaks and setup-time peaks. The queue-clearance peaks have already been observed in[25] and these peaks have been associated with self-organization behavior. Here, we wantto give a more detailed explanation of the origin of the queue-clearance peaks: first, thepeaks occur exactly at multiples of 45; second, there is no peak at 45 itself. Finally,the queue-clearance peaks only occur for high inflow rates, i.e. at high system load. Itturns out that there is a simple reason that explains these observations. All simulationscenarios were run with a setup time τi of 15 and a maximum green time gmax
i of 30for all links i, which adds up to 45. As the networks under high load tend to workpredominantly in the second control regime which clears the queues on a rotating basis,we observe service interval durations which are multiples of the sum of the maximumgreen time and the setup time. Service interval durations of 45 do not appear, becausethis would mean that one link would be served immediately again after its own greenphase (including setup), which is not possible according to the control rules of the clearqueue control state. Therefore, the periodic behavior we see here is determined by thesystem parameters. All three network types show these peaks. However, the frequencydistribution of the production network service interval frequency density differs slightlyfrom the other types, because there is only one peak that can be observed. This is a resultof the nodes’ indegree of 2. The switching can only take place between two alternatives,
doi:10.1088/1742-5468/2011/05/P05004 22
J.Stat.M
ech.(2011)
P05004
Flow control by periodic devices
Figure 9. Simulation results for the frequency distribution of the service intervals.(a) Traffic network, (b) production network, (c) metabolic model network.
so that there is only one possible duration of the service interval. In networks with nodesthat have a higher indegree, incoming links do not necessarily take turns in the same orderall the time. Switching may occur only between highly utilized links, if other links areless utilized. These results can be reproduced with any other combination of τi and gmax
i .
In contrast to the above mentioned observation, the peaks in the setup time occur inscenarios with low utilization. The gap between the peaks is τi + ε, where ε ∈ N and ε is asmall number (1 or 2). Here, the reason for the accumulation of service interval frequenciesis the fact that, in a scenario with very low load, the intersection control algorithm often
doi:10.1088/1742-5468/2011/05/P05004 23
J.Stat.M
ech.(2011)
P05004
Flow control by periodic devices
lets only one element pass the intersection and immediately switches to another flow. Inthe scenario with a mean inflow rate of 0.025, we have a mean inter-arrival time of 40between elements. This implies the appearance of isolated elements on the network links.The intersection often needs to serve one element only and then switches to another flow,as there is simply no other element approaching in the currently served flow direction.Therefore, the duration of the service interval consists only of a multiple of the sum ofthe setup time and the time needed to let a single element (or sometimes two elements)pass. A major difference from the queue-clearance control is the occurrence of durationsof the service interval of single green phase lengths (e.g. τi + 1, but not 2(τi + 1)). Whilein the setup time, the priority index control allows the intersection to update its decisionon which flow to activate next. It is possible that the priority indices change during thesetup time, and, consequently, after the setup time, the same flow may be activated again,resulting in a service interval duration zi with τi + 1 < zi < 2(τi + 1).
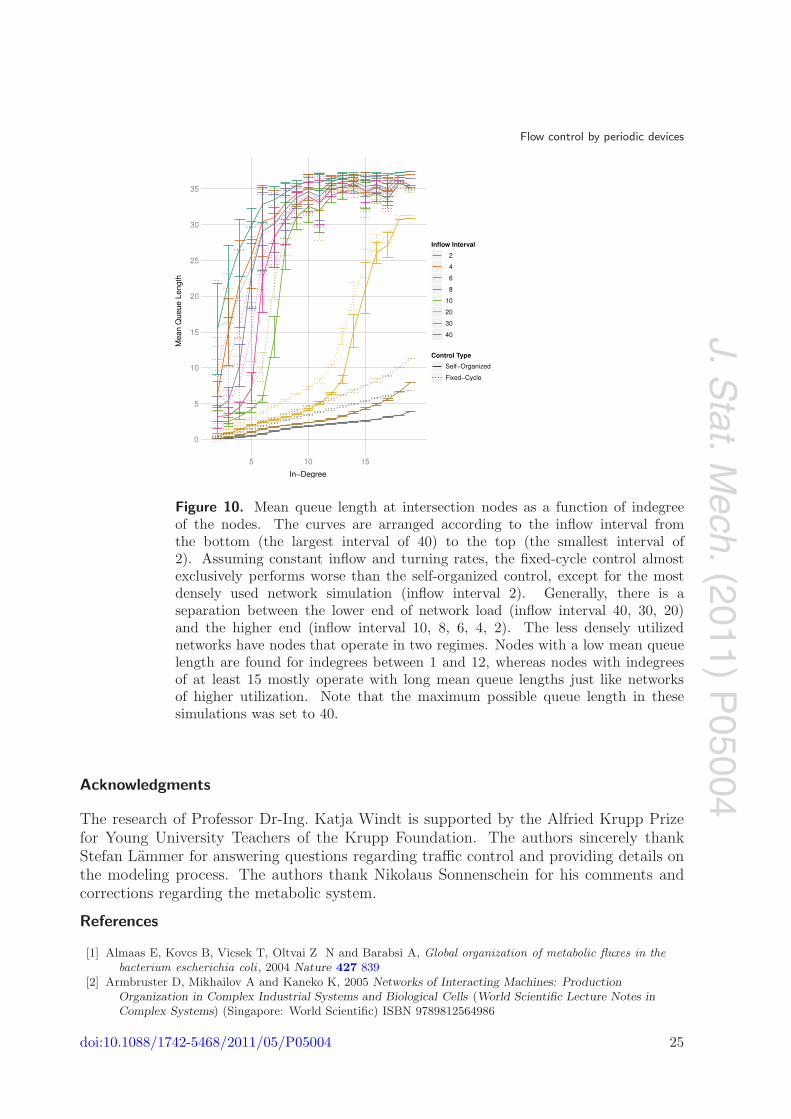
The metabolic model networks were also analyzed for the effect of topology on theaverage queue length at intersection nodes. In figure 10, we can observe that the meanqueue length at intersection nodes is correlated with their indegree. The figure depictsthe results for 30 randomly initialized networks and their simulations. For intermediateloads (inflow intervals of 40, 30, 20), one observes a sigmoid dependence of the queuelength on the indegree. In this regime, the graphs consist, qualitatively speaking, of twotypes of nodes: low-degree nodes with very small queue lengths and high-degree nodeswith very large queue lengths. The results using betweenness centrality as a topologicalmeasure look very similar but, of course, betweenness centrality and indegree are stronglycorrelated. An analogous analysis regarding the edge betweenness centrality reveals nosuch correlation (results not shown).
5. Summary and conclusion
In this work, we have shown that there exists a formalism suitable for treating traffic,logistic, and metabolic systems in a unified way. Furthermore, this formalism allowedus to transfer a control setup for urban traffic flows to other systems, where it alsoperformed well, independently of system structure. Future work will focus on the transferof control strategies in the reverse direction, i.e. from metabolic networks to traffic orlogistic networks.
To that end, we will propose an even more general model as well as more specificadaptations thereof that resemble production logistics and metabolic systems. Amongthis range of models from very abstract to very realistic we will then be able to studythe impact of particular control strategies and how they affect the system performance atvarying degrees of model complexity.
Perhaps the following, more detailed studies of the individual systems will alsoelaborate on two aspects that were largely ignored here. (1) There is an extreme separationof scales when comparing traffic, logistics, and metabolic systems. The separation appliesto both time (the extensive manufacturing process or the travel time in traffic as comparedto chemical alterations by enzymes) and space (from the size of cities down to the levelof individual molecules). (2) Efficient management of resources is key to all of life. Anextremely important aspect of the efficiency is recycling, an idea that has not yet firmlytaken hold in the thinking of traffic control or production planning.
doi:10.1088/1742-5468/2011/05/P05004 24
J.Stat.M
ech.(2011)P
05004
Flow control by periodic devices
Figure 10. Mean queue length at intersection nodes as a function of indegreeof the nodes. The curves are arranged according to the inflow interval fromthe bottom (the largest interval of 40) to the top (the smallest interval of2). Assuming constant inflow and turning rates, the fixed-cycle control almostexclusively performs worse than the self-organized control, except for the mostdensely used network simulation (inflow interval 2). Generally, there is aseparation between the lower end of network load (inflow interval 40, 30, 20)and the higher end (inflow interval 10, 8, 6, 4, 2). The less densely utilizednetworks have nodes that operate in two regimes. Nodes with a low mean queuelength are found for indegrees between 1 and 12, whereas nodes with indegreesof at least 15 mostly operate with long mean queue lengths just like networksof higher utilization. Note that the maximum possible queue length in thesesimulations was set to 40.
Acknowledgments
The research of Professor Dr-Ing. Katja Windt is supported by the Alfried Krupp Prizefor Young University Teachers of the Krupp Foundation. The authors sincerely thankStefan Lammer for answering questions regarding traffic control and providing details onthe modeling process. The authors thank Nikolaus Sonnenschein for his comments andcorrections regarding the metabolic system.
References
[1] Almaas E, Kovcs B, Vicsek T, Oltvai Z N and Barabsi A, Global organization of metabolic fluxes in thebacterium escherichia coli , 2004 Nature 427 839
[2] Armbruster D, Mikhailov A and Kaneko K, 2005 Networks of Interacting Machines: ProductionOrganization in Complex Industrial Systems and Biological Cells (World Scientific Lecture Notes inComplex Systems) (Singapore: World Scientific) ISBN 9789812564986
doi:10.1088/1742-5468/2011/05/P05004 25
J.Stat.M
ech.(2011)P
05004
Flow control by periodic devices
[3] Armbruster D, de Beer C, Freitag M, Jagalski T and Ringhofer C, Autonomous control of productionnetworks using a pheromone approach, 2006 Physica A 363 104
[4] Arnold D, 2008 Handbuch Logistik (Berlin: Springer)[5] Barabasi A and Albert R, Emergence of scaling in random networks, 1999 Science 286 509[6] Bentley R and Lambe T, Assignment of traffic to a network of signalized city streets, 1980 Transp. Res. A
14 57[7] Blumenfeld L A and Tikhonov A N, 1994 Biophysical Thermodynamics of Intracellular Processes:
Molecular Machines of the Living Cell (Berlin: Springer) ISBN 0-387-94179-7[8] Bonabeau E, Dorigo M and Theraulaz G, Swarm intelligence: from natural to artificial systems, 1999 Santa
Fe Institute Studies in the Sciences of Complexity (Oxford: Oxford University Press) ISBN9780195131598
[9] Buldyrev S V, Parshani R, Paul G, Stanley H E and Havlin S, Catastrophic cascade of failures ininterdependent networks, 2010 Nature 464 1025
[10] Casagrande V, Togashi Y and Mikhailov A, Molecular synchronization waves in arrays of allostericallyregulated enzymes, 2007 Phys. Rev. Lett. 99 48301
[11] Covert M W and Palsson B Ø, Transcriptional regulation in constraints-based metabolic models ofescherichia coli , 2002 J. Biol. Chem. 277 28058
[12] Covert M W, Schilling C H and Palsson B Ø, Regulation of gene expression in flux balance models ofmetabolism, 2001 J. Theor. Biol. 213 73
[13] Csete M E and Doyle J C, Reverse engineering of biological complexity , 2002 Science 295 1664[14] Feist A M, Herrgard M J, Thiele I, Reed J L and Palsson B Ø, Reconstruction of biochemical networks in
microorganisms, 2009 Nat. Rev. Microbiol. 7 129[15] Forrester J and Wright J, 1961 Industrial Dynamics (Cambridge, MA: MIT Press)[16] Garey M and Johnson D, 1979 Computers and Intractability (New York: Freeman)[17] Gerstein M, Lesk A M and Chothia C, Structural mechanisms for domain movements in proteins, 1994
Biochemistry 33 6739[18] Gianchandani E P, Joyce A R, Palsson B Ø and Papin J A, Functional states of the Genome-Scale
escherichia coli transcriptional regulatory system, 2009 PLoS Comput. Biol. 5 e1000403[19] Helbing D, Production, supply, and traffic systems: a unified description, 2005 Traffic and Granular Flow’03
pp 173–88[20] Helbing D, Lammer S, Witt U and Brenner T, Network-induced oscillatory behavior in material flow
networks and irregular business cycles, 2004 Phys. Rev. E 70 056118[21] Helbing D, Armbruster D, Mikhailov A and Lefeber E, Information and material flows in complex
networks, 2006 Physica A 363 xi[22] Helbing D, Seidel T, Lammer S and Peters K, Self-organization principles in supply networks and
production systems, 2006 Econophysics and Sociophysics: Trends and Perspectives ed B K Chakrabarti,A Chakrabarti and A Chatterjee (Weinheim: Wiley)
[23] Helbing D et al , Biologistics and the struggle for efficiency: concepts and perspectives, 2009 Adv. ComplexSyst. 12 533
[24] Jeong H, Tombor B, Albert R, Oltvai Z N and Barabasi A, The large-scale organization of metabolicnetworks, 2000 Nature 407 651
[25] Lammer S and Helbing D, Self-control of traffic lights and vehicle flows in urban road networks, 2008 J.Stat. Mech. P04019
[26] Lammer S and Helbing D, Self-stabilizing decentralized signal control of realistic, saturated network traffic,2010 Santa Fe Institute Working Paper 10-09-019
[27] Lammer S, Kori H, Peters K and Helbing D, Decentralised control of material or traffic flows in networksusing phase-synchronisation, 2006 Physica A 363 39
[28] Lammer S, Donner R and Helbing D, Anticipative control of switched queueing systems, 2008 Eur. Phys. J.B 63 341
[29] Marr C, Geertz M, Hutt M and Muskhelishvili G, Dissecting the logical types of network control in geneexpression profiles, 2008 BMC Syst. Biol. 2 18
[30] Matthus F, Salazar C and Ebenhh O, Biosynthetic potentials of metabolites and their hierarchicalorganization, 2008 PLoS Comput. Biol. 4 e1000049
[31] Nagatani T and Helbing D, Stability analysis and stabilization strategies for linear supply chains, 2004Physica A 335 644
[32] Nof S, Wilhelm W and Warnecke H, 1997 Industrial Assembly (London: Chapman & Hall)[33] Nyhuis P and Wiendahl H, 2008 Fundamentals of Production Logistics: Theory, Tools and Applications
(Berlin: Springer)
doi:10.1088/1742-5468/2011/05/P05004 26
J.Stat.M
ech.(2011)
P05004
Flow control by periodic devices
[34] Panneerselvam R, 2006 Production and Operations Management (New Delhi: PHI Learning Pvt)[35] Scholz-Reiter B, Freitag M, de Beer C and Jagalski T, Modelling dynamics of autonomous logistic processes:
discrete-event versus continuous approaches, 2005 CIRP Ann.-Manuf. Technol. 54 413[36] Scholz-Reiter B, de Beer C, Freitag M and Jagalski T, Bio-inspired and pheromone-based shop-floor control ,
2008 Int. J. Comput. Integr.Manuf. 21 201[37] Scholz-Reiter B, Jagalski T and Bendul J, Autonomous control of a shop floor based on bees foraging
behaviour , 2008 Dynamics in Logistics. 1st Int. Conf., LDIC 2007 ed H-D Haasis, H-J Kreowski andB Scholz-Reiter (Berlin: Springer) p 415
[38] Schonsleben P, 2007 Integral Logistics Management: Operations and Supply Chain Management inComprehensive Value-Added Networks (Boca Raton, FL: Auerbach Publications)
[39] Ueda K, Hatono I, Fujii N and Vaario J, Reinforcement learning approaches to biological manufacturingsystems, 2000 CIRP Ann.-Manuf. Technol. 49 343
[40] Varma A and Palsson B O, Metabolic flux balancing: Basic concepts, scientific and practical use, 1994 Nat.Biotechnol. 12 994
[41] Wagner A and Fell D A, The small world inside large metabolic networks, 2001 Proc.: Biol. Sci. 268 1803[42] Wiener N, Cybernetics or control and communication in the animal and the machine, 1965 MIT Press
Paperback Series (Cambridge, MA: MIT Press) ISBN 9780262730099[43] Windt K, Bose F and Philipp T, Autonomy in production logistics—identification, characterisation and
application, 2008 Int. J. Robot. CIM 24 572[44] Windt K, Philipp T, Bose F and Becker T, Application of the 3-component evaluation system for
autonomous control in logistics, 2010 Proc. Inst. Mech. Eng. B 224 1267[45] Zaslaver A, Mayo A E, Rosenberg R, Bashkin P, Sberro H, Tsalyuk M, Surette M G and Alon U,
Just-in-time transcription program in metabolic pathways, 2004 Nat. Genet. 36 486
doi:10.1088/1742-5468/2011/05/P05004 27