Embed Size (px)
Citation preview

© 2017 - ntop.org
Flow-Based Monitoring, Troubleshootingand Security using nProbe
Luca Deri <[email protected]> @lucaderi

© 2017 - ntop.org
Packets, Flows, Activities [1/3]
• For years monitoring tools focused on standards often fostered by vendors: NetFlow vs sFlow vs SNMP, Cisco vs Juniper…
• This has plagued the market by creating tools more vendor oriented, than result oriented.
• Fortunately recent advances in computing and in particular the big data movement, have pushed companies to overcome the market/vendor fragmentation and produce tools able to produce data on a standard format (often JSON) that could be consumed even by non-monitoring tools (e.g. Hadoop, ElasticSearch).
2

© 2017 - ntop.org
Packets, Flows, Activities [2/3]
• As data increases and people demand feature rich monitoring tools, it has become necessary to ‘compress’ monitoring data.
• Network packets are still important for providing evidence or troubleshooting problems (packets or it didn't happen!) but they are “too raw” and take too much storage space, so limiting them to specific situations is a good idea.
• Network flow analysis is a good way to “compress packets” into events: sFlow do it with sampling, NetFlow with stateful connection-based packet classification.
3

© 2017 - ntop.org
Packets, Flows, Activities [3/3]
• These days, saving flows on a big data system is a common practice but it still plagued by the visibility issue:◦What flows are “more relevant” than others?◦Can we use flows for more than just host/protocol/application traffic accounting ?◦How can a network administrator look for a needle in a haystack when the monitoring platform is emitting tenth of thousand flows/second?
• We need yet another level of abstraction on top of flows able to identify activities on top of flows (e.g. these 20 HTTPS connections and 5 DNS queries mean that host X just open the landing page of newspaper corriere.it).
4

© 2017 - ntop.org
Flow Generation [1/2]
• Unfortunately there are still too many “NetFlow dialects” (e.g. Cisco ASA or Barracuda Networks flows) available that make interoperability not that simple
• sFlow is even simpler than NetFlow/IPFIX to implement and available in most switches deployed today (Cisco features a sFlow-like protocol named NetFlow Lite).
• With the baseline bytes/packets of traffic flow from these flow protocols, we can do a lot with good analytics. This including congestion, cost analysis, DDoS detection, security and forensics.
5

© 2017 - ntop.org
Flow Generation [2/2]
• Ideally, we want to gather rich measurement metrics, from everywhere possible.
• For the above goals 5-tuples (IPs, Ports, Protocol) and and bytes/packets are not enough as we expect at least:◦Latency, Packet Drops, Retransmissions.◦QoE (e.g. HTTP service time).◦Application visibility (DPI, URLs, DNS responses).
• And with those metrics per flow, we can provide even more actionable insights into performance and security issues.
6

© 2017 - ntop.org
Do We Need Custom Probes in 2017? [1/2]
• Flow-based traffic analysis relies on network probes that are usually implemented in network devices such as routers and firewalls.
• Unfortunately being probe development driven by vendors, probes have not evolved much over the past 10 years, and where it happened, it as not been in a standard way.
• Most collectors complexity is due to the support of various IPFIX/NF dialects rather on using the collected data.
7

© 2017 - ntop.org
Do We Need Custom Probes in 2017? [2/2]
• More than 10 years ago, (at ntop) we realised that improvements in network monitoring were limited by the ability of network probes to generate rich monitoring data.
• In essence we cannot expect to move forward waiting the Cisco, Juniper… to embed in routers a next-generation probe.
• This was the motivation to create our own software probe, named nProbe.
8

© 2017 - ntop.org
nProbe [1/4]
9
• nProbe is a high-speed (multi 10G) traffic probe/collector for Linux and Windows platforms.
nProbe
Log Managers
Redis
Incoming Packets(Raw Traffic)
NetFlow/IPFIXsFlow
nFlow
Export
DiskDatabase
MySQL/SQLiteRaw Files
JSON
ntopng
JSON

© 2017 - ntop.org
nProbe [2/4]
• Originally designed as a drop-in replacement of a physical NetFlow probe, currently it can:◦Convert flow format (sFlow-to-NetFlow/IPFIX) or version (e.g. v5 to v9).◦High-speed packet-to-flow processing.◦Leverage on in-memory-databases to maintain flow state coherency (e.g. SIP/RTP, Radius/Diameter or GTP traffic).◦Ability to pre-compute data for realtime traffic aggregation.
10

© 2017 - ntop.org
nProbe [3/4]
• It has an open architecture extensible by means of plugins that include:◦GTP (v0, v1, v2) plugins.◦VoIP (SIP and RTP) plugins for analysing voice signalling (who’s calling who/when) and voice quality (Jitter and pseudo-MOS/R-Factor).◦HTTP(S), Email (SMTP, IMAP, POP3), Radius, Database (Oracle and MySQL), FTP, DHCP, and BGP.◦ JSON export (TCP, Kafka and ElasticSearch)
11

© 2017 - ntop.org
nProbe [4/4]
• nProbe supports flexible NetFlow, that allows data export format to be customised at runtime.
• nProbe allow users to define a template on the command line.
• In addition to the standard fields (IP, port…), nProbe can export many other fields such as packet stats (TTL and size distribution), network/application latency, geolocation, packets retransmitted/out-of-order, tunnel information, and DPI (Deep Packet Inspection).
12

© 2017 - ntop.org
nProbe vs YAF
• Ability to dissect application protocols (e.g. VoIP, Radius, HTTP) and export them in standard flow records (with ntop PEN).
• Network (latency, retransmission, OOO, TCP Window/TTL stats…) and application metrics (response time).
• Application metadata (URL, BitTorrent Hash, SSL certification information, OperatingSystem).
• Flow user info (Radius/GTP/Diameter) in-probe flow correlation.
• Probe scriptability via Lua to extend flow information or to manipulate flow export policy.
13

© 2017 - ntop.org
DNS Traffic Monitoring
• Using nProbe it is possible to generate flow records containing DNS req/reply… and dump them to disk
• Malformed DNS packets can be saved in pcap format for later analysis and troubleshooting.
14
# # When[epoch] DNS_Client[ascii:32] AS[uint] ClientCountry[ascii:32] ClientCity[ascii:32] DNS_Server[ascii:32] Query[ascii:64] NumRetCode[uint] RetCode[ascii:16] NumAnswer[uint] NumQueryType[uint] QueryType[ascii:8] TransactionId[uint] Answers[ascii:128] AuthNSs[ascii:32] Cli2SrvTTL[uint] Srv2CliTTL[uint] NumQueryPkts[uint] NumReplyPkts[uint] ServerResponseTime(ms)[float] RecordTTL[uint] # 1481220355 192.168.1.7 0 8.8.8.8 bramp.github.io 0 NOERROR 2 1 A 36320 151.101.16.133/A;github.map.fastly.net/CNAME 0 255 1 1 65.628 12 1481220356 192.168.1.7 0 8.8.8.8 edition.cnn.com 0 NOERROR 3 1 A 30012 151.101.60.73/A;www.edition.cnn.com/CNAME;turner.map.fastly.net/CNAME 255 255 2 1 1044.427 29 1481220357 192.168.1.7 0 8.8.8.8 tpc.googlesyndication.com 0 NOERROR 2 1 A 41074 172.217.16.1/A;pagead-googlehosted.l.google.com/CNAME 0 255 1 1 46.898 299 1481220357 192.168.1.7 0 8.8.8.8 pagead2.googlesyndication.com 0 NOERROR 2 1 A 21182 216.58.205.66/A;pagead46.l.doubleclick.net/CNAME 0 255 1 1 49.280 299 1481220357 192.168.1.7 0 8.8.8.8 www.google.com 0 NOERROR 1 1 A 33128 216.58.205.196/A 0 255 1 1 47.855 292 1481220357 192.168.1.7 0 8.8.8.8 aax.amazon-adsystem.com 0 NOERROR 3 1 A 44800 52.94.218.7/A;aax.amazon-adsystem.amazon.com/CNAME;aax-eu.amazon-adsystem.com/CNAME 0 255 1 1 81.974 29

© 2017 - ntop.org
VoIP Traffic Monitoring [1/3]
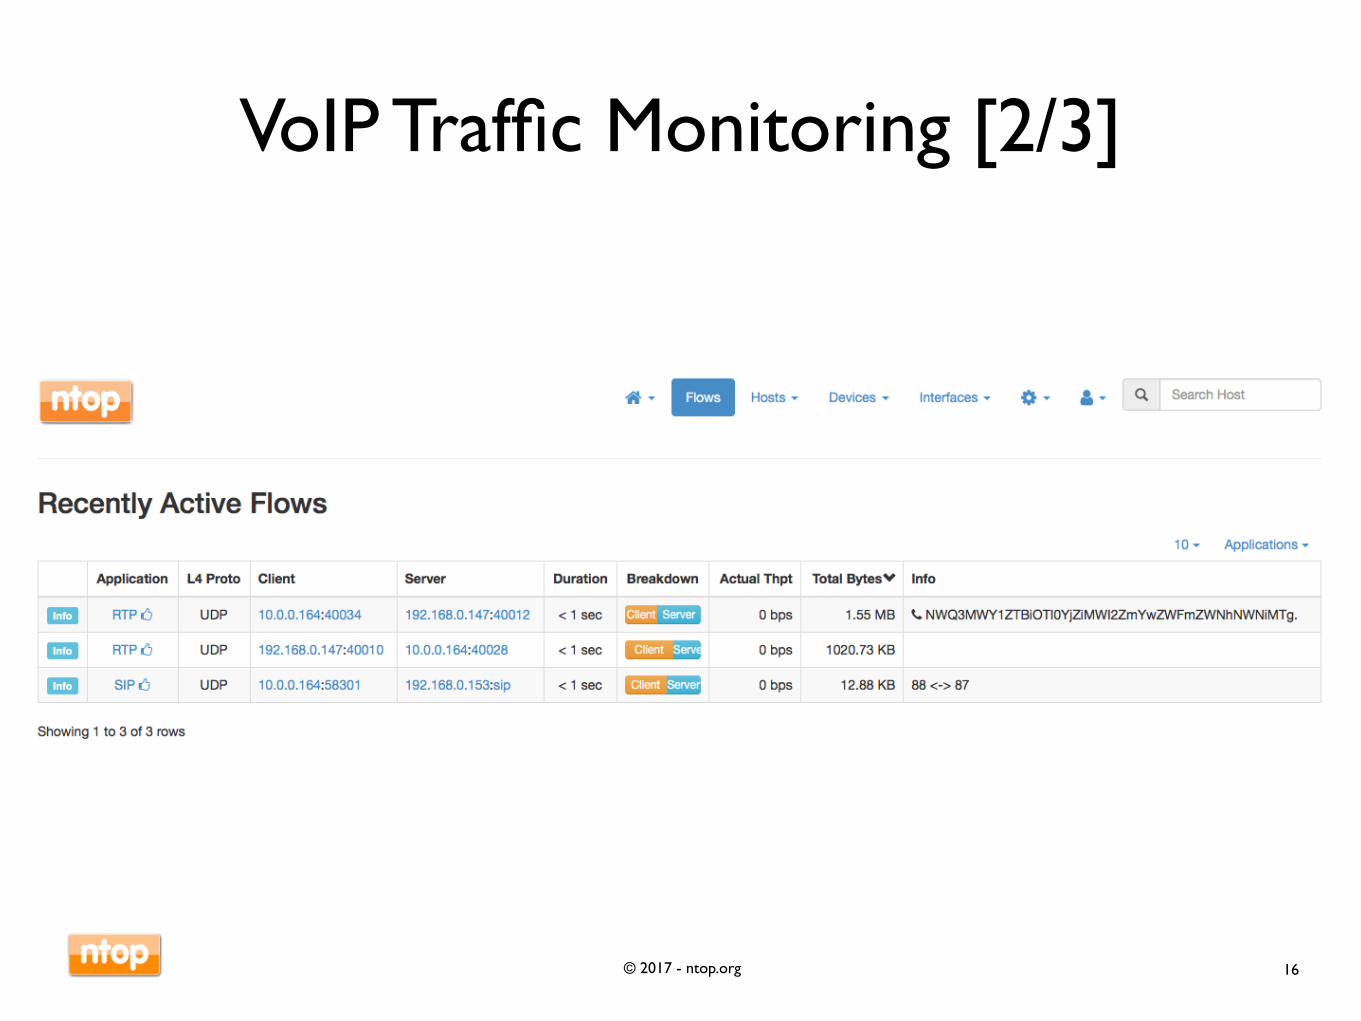
• nProbe can monitor both SIP and RTP, and correlate signalling to traffic via the redis cache.
• It can:◦Generate “legacy” CDR (Call Data Records) containing caller/called/duration… information on SIP traffic.◦Dissect RTP traffic and generate call quality metrics including jitter, packet lost, max inter-arrival time, pseudo-MOS (Mean Opinion Score) and R-Factor.
• A low-end x86 PC with nProbe can monitor thousand of simultaneous VoIP calls.
15
© 2017 - ntop.org
VoIP Traffic Monitoring [2/3]
16

© 2017 - ntop.org
VoIP Traffic Monitoring [3/3]
17

© 2017 - ntop.org
BitTorrent Traffic Monitoring [1/3]
• BitTorrent traffic is encrypted and so its content cannot be inspected. However sometimes it is necessary to track what users are downloading to check if the what they are doing is legitimate.
• Fortunately BitTorrent traffic tracks resources by means of a hashId that it can be dissected by nProbe.
• Using a search engine it is possible to bind a hashId to a downloaded resource and thus decide if the downloaded files are legitimate.
18

© 2017 - ntop.org
BitTorrent Traffic Monitoring [2/3]
19

© 2017 - ntop.org
BitTorrent Traffic Monitoring [3/3]
20

© 2017 - ntop.org
HTTP Traffic Analysis [1/2]
• The HTTP plugin is used by many users to both analyse user traffic and detect malware. For this reason it produces a rich set of metrics and metadata to make detection possible.
• As flow-based probes usually emit flows after some timeouts are past (e.g. flow duration), in order to promptly trigger detection, nProbe plugins can emit events immediately (e.g. as soon as the HTTP headers have been observed).
21

© 2017 - ntop.org
HTTP Traffic Analysis [2/2]
• The plugin supports both HTTP 1.0 and 1.1 (multi-requests per TCP connection).
22
# # Client[ascii:32] Server[ascii:32] Protocol[ascii:8] Method[ascii:8] URL[ascii:255] HTTPReturnCode[uint] Location[ascii:255] Referer[ascii:255] UserAgent[ascii:255] ContentType[ascii:96] Bytes[uint] BeginTime[epoch] EndTimeWithPayload[epoch] FlowHash[ascii:16] Cookie[ascii:255] Terminator[ascii:4] ApplLatency(ms)[uint] ClientLatency(ms)[uint] ServerLatency(ms)[uint] ApplicationId[uint] Application[ascii:32] BalancerHost[ascii:32] ServerIP[ascii:32] RehttpPkts[uint] Client2Server_TEID[ascii:8] Server2Client_TEID[ascii:8] FlowUserName (User or IMSI/LAC/CCI/CSAC/NSAPI)[ascii:32] AdditionalInfo[ascii:32] Pkts_Cli2Srv[uint] Pkts_Svr2Cli[uint] Bytes_Cli2Srv[uint] Bytes_Svr2Cli[uint] OOO_Cli2Srv[uint] OOO_Svr2Cli[uint] Retr_Cli2Srv[uint] Retr_Svr2Cli[uint] Duration_Cli2Srv(ms)[uint] Duration_Svr2Cli(ms)[uint] FlowID[uint] X-Forwarded-For[ascii:255] Via[ascii:255] POSTParams[ascii:256] # 217.31.54.202 www.ntop.org http GET /blog/?feed=rss2 301 www.ntop.org/blog/feed www.ntop.org/blog/?feed=rss2 SimplePie/1.4-dev (Feed Parser; http://simplepie.org; Allow like Gecko) Build/20130924065456 text/html 1387 1481268507 1481268507 1553062676 U 1.712 0.004 0.380 7 HTTP 131.114.21.22 0 00000000 00000000 5 5 700 687 0 0 0 0 2.539 1.782 1 217.31.54.202 www.ntop.org http GET /blog/feed/ 200 www.ntop.org/blog/?feed=rss2 SimplePie/1.4-dev (Feed Parser; http://simplepie.org; Allow like Gecko) Build/20130924065456 text/xml 19480 1481268507 1481268507 1553062704 U 0.089 0.001 0.002 7 HTTP 131.114.21.22 0 00000000 00000000 16 7 1267 18213 0 0 0 0 0.451 0.447 4 192.41.231.101 version.ntop.org http GET /version.xml 200 ntop/5.0.2 host/x86_64-2.6.32-279.5.2.el6.x86_64-linux-gnu distro/centos release/6.3 kernrlse/2.6.32-279.14.1.el6.x86_64 GCC/4.4.6 config() run(u; W; a; F; d) gdbm/1.8.0 openssl/1.0.0-fips zlib/1.2.3 access/https interfaces(eth1) application/xml 2803 1481268507 1481268507 1134337097 U 0.019 0.011 0.012 7 HTTP 131.114.21.22 0 00000000 00000000 7 6 645 2158 0 0 0 0 0.168 0.141 5

© 2017 - ntop.org
MySQL/Oracle Latency Analysis
• Same as for HTTP, DNS, DHCP, FTP… nProbe is also able to analyse applications protocols (when not used with encryption) and extract relevant metadata that is used to troubleshoot both network and coding issues.
23
# # Client[ascii:32] Server[ascii:32] User[ascii:32] Query[ascii:256] ResponseCode[uint] ResponseMsg[ascii:32] Bytes[uint] BeginTime epoch[EndTime] epoch[QueryDuration(sec)[uint]] ClientLatency(ms)[uint] ServerLatency(ms)[uint] # 10.96.4.141 10.96.4.28 root SELECT msisdn FROM big_white_list WHERE authid = 459 1403 no data found 6536 1481314177 1481314177 0.000 0.002 0.067 10.96.4.141 10.96.4.28 root SELECT msisdn FROM big_white_list WHERE authid = 159 1403 no data found 6527 1481314177 1481314177 0.001 0.000 0.002 10.96.4.141 10.96.4.28 root SELECT msisdn FROM big_white_list WHERE authid = 759 1403 no data found 6527 1481314177 1481314177 0.001 0.001 0.001 10.96.4.141 10.96.4.28 root SELECT msisdn FROM big_white_list WHERE authid = 559 1403 no data found 6527 1481314177 1481314177 0.001 0.000 0.001

© 2017 - ntop.org
Lua Scripting [1/2]
• During flow export, it is possible to instrument nProbe to execute some actions using Lua scripts.
• nProbe embeds a LuaJIT interpreter that executes a function when a flow is exported.
• Network administrators can use scripts to◦Execute actions when specific flow values are observed (e.g. when a malware URL is reported).◦Selectively prevent flow export (e.g. unidirectional flows)
24

© 2017 - ntop.org
Lua Scripting [2/2]
25
function checkFlow(label, flow, rule) for i = 1,#rule do local id = rule[i].id local filter = rule[i].filter
local rsp = true -- be optimistic
if(debug == true) then io.write("Checking rule "..id.."\n") end
for j = 1,#filter do …. end
if(debug == true) then io.write("Result for rule "..id.."="..tostring(rsp).."\n") end
if(rsp == true) then execMatchCommand(label, flow, id, r) end end end

© 2017 - ntop.org
Final Remarks
nProbe is a modern network probe:◦Flow generation and collection, 10 Gbit capable.◦Able to produce “rich” monitoring metrics (augmented flows).◦Extensible by means of plugins (SDK available).◦Scriptable using Lua.◦Available for Linux, Windows and embedded systems.◦BigData friendly (JSON export, Syslog, Kafka, ELK).◦Free for no-profit, research, and education.
26