Embed Size (px)
Citation preview
FLOW-BASED AUTOMATIC ANALYSIS SYSTEMS
by
SOFIA GALANIS, B.S.
A THESIS
IN
CHEMISTRY
Submitted to the Graduate Faculty of Texas Tech University in
Partial Fulfillment of the Requirements for
the Degree of
MASTER OF SCIENCE
Approved
Accepted
May, 2000

% o£ ACKNOWLEDGMENTS
/^lo il) """ ^ author wishes to thank Purnendu K. Dasgupta, Paul Whitfield Horn
C^ >;."2 Professor of Chemistry, for this opportunity, his guidance, and most importantly,
his hard work. The author wishes to acknowledge the financial support of the
work herein by Dow Chemical Co. in Freeport, Texas. It would not have been
possible to complete this work without the help of Ray Plepys from Dow, for
which I have deep appreciation. The author also wishes to thank Dr. Carol L.
Korzenlewski and Dr. Dennis C. Shelly for their support, encouragement, and
assistance during this work.
Dr. C. Bradley Boring, Dr. John N. Marx, Bill Good, Duane Hindes, and all
research group members over the course of time this work was completed are
acknowledged for their assistance in various aspects of this work. Jennifer
Dunfield, Cheryl Blasingame, and the stockroom staff are appreciated for their
hard work.
A heartfelt thanks to my colleagues and friends, Cheryl H. Baker, Dawn J.
Kardash, Melissa Goodlet, Rosemarie Papaleo and Nancy Greenwood who
provided friendship and support during the challenging times of this work and in
my personal life. A special thanks to all of my family members and friends for
their support and encouragement to pursue my goals and dreams.
I am grateful for the patience, support, understanding and love of my
fiance, Gregory Hohnholt, who has helped me find balance and peace. Finally, I
am humbly thankful for God's grace and mercy.

TABLE OF CONTENTS
ACKNOWLEDGMENTS ii
ABSTRACT iv
LIST OF TABLES vi
LIST OF FIGURES vii
LIST OF ABBREVIATIONS ix
CHAPTER
I. INTRODUCTION 1
II. FLOW ANALYSIS WITH CONDUCTOMETRIC DETECTION 12
III. REVERSE FLOW INJECTION WITH COLORIMETRIC DETECTION 31
IV SUMMARY AND CONCLUSIONS 65
III
ABSTRACT
Polyurethane foam is utilized by furniture, automotive, construction,
insulation and footwear industries at a growing rate. A dominant prepolymer for
polyurethane foam is polyether polyol. The current technique for analyzing
potassium hydroxide (KOH) in polyol involves a laborious wet chemical method,
in which a significant time lag exists between sample collection and availability of
the analytical result. An on-line, near real time KOH analyzer to monitor the
polyol is desirable.
An automated flow analysis system utilizing conductivity detection was
investigated. If KOH is the principal electrolyte contaminant, it will be the
dominant current carrier. By mixing the polyol with an acid solution at different
ratios, the neutralization point was successfully indicated by a minimum in
conductivity in initial experiments. The suitability of acid introduction by
permeation tubes, gaseous acids and alcohol solution injections was tested.
However, the presence of significant background conductivity suggested that the
method will not be feasibe at low parts per million (ppm) levels of KOH.
Therefore, an alternative approach was required.
An automated reverse flow injection (Fl) based continuous analyzer with a
fiber-optic based optical absorbance detector was fabricated and various
schemes were tested. The most successful of these involved the injections of a
solution of bromocresol green (BCG) in 2-Propanol, with or without added
mineral acid, into the sample polyol stream in a single-line Fl manifold
iv

maintained at 110°C (dispersion factor of 50-25 for a dilute aqueous stream at
room temperature with 10 and 30 iL of solution injected). Measurements could
be made In the present system every 4 minutes. Deliberate alteration of water
content of the polyol stream in the range of interest was found to have no
discernible effect on the measurement.

LIST OF TABLES
1.1 Common starters for polyurethane polyols 10
3.1 Behavior of polyol samples of low KOH content with different indicators 55
VI

LIST OF FIGURES
1 • 1 Final stages of polyol production process 11
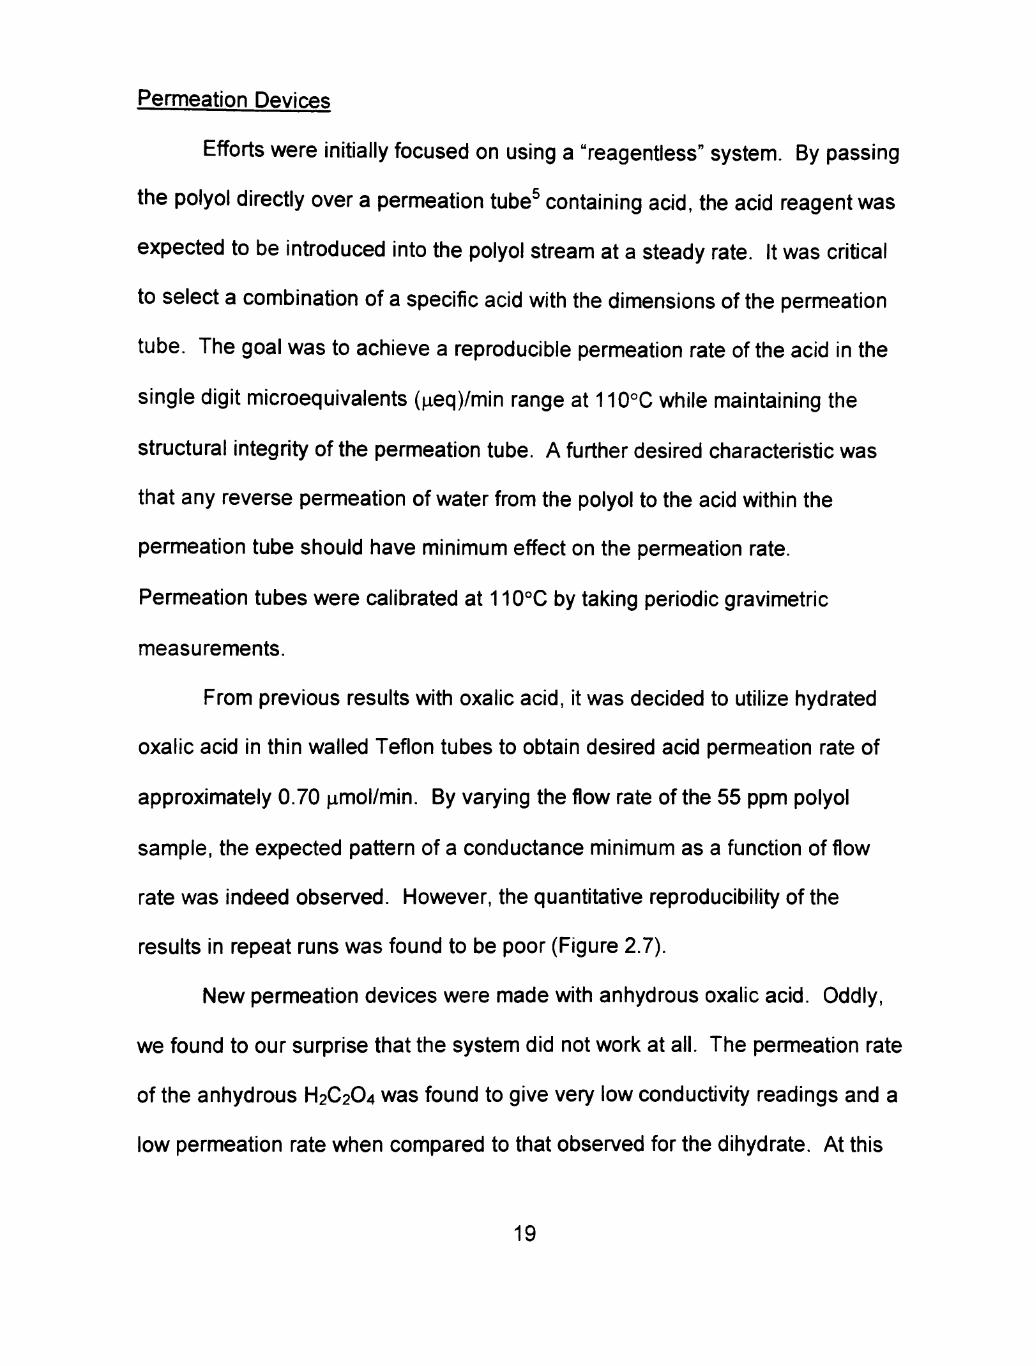
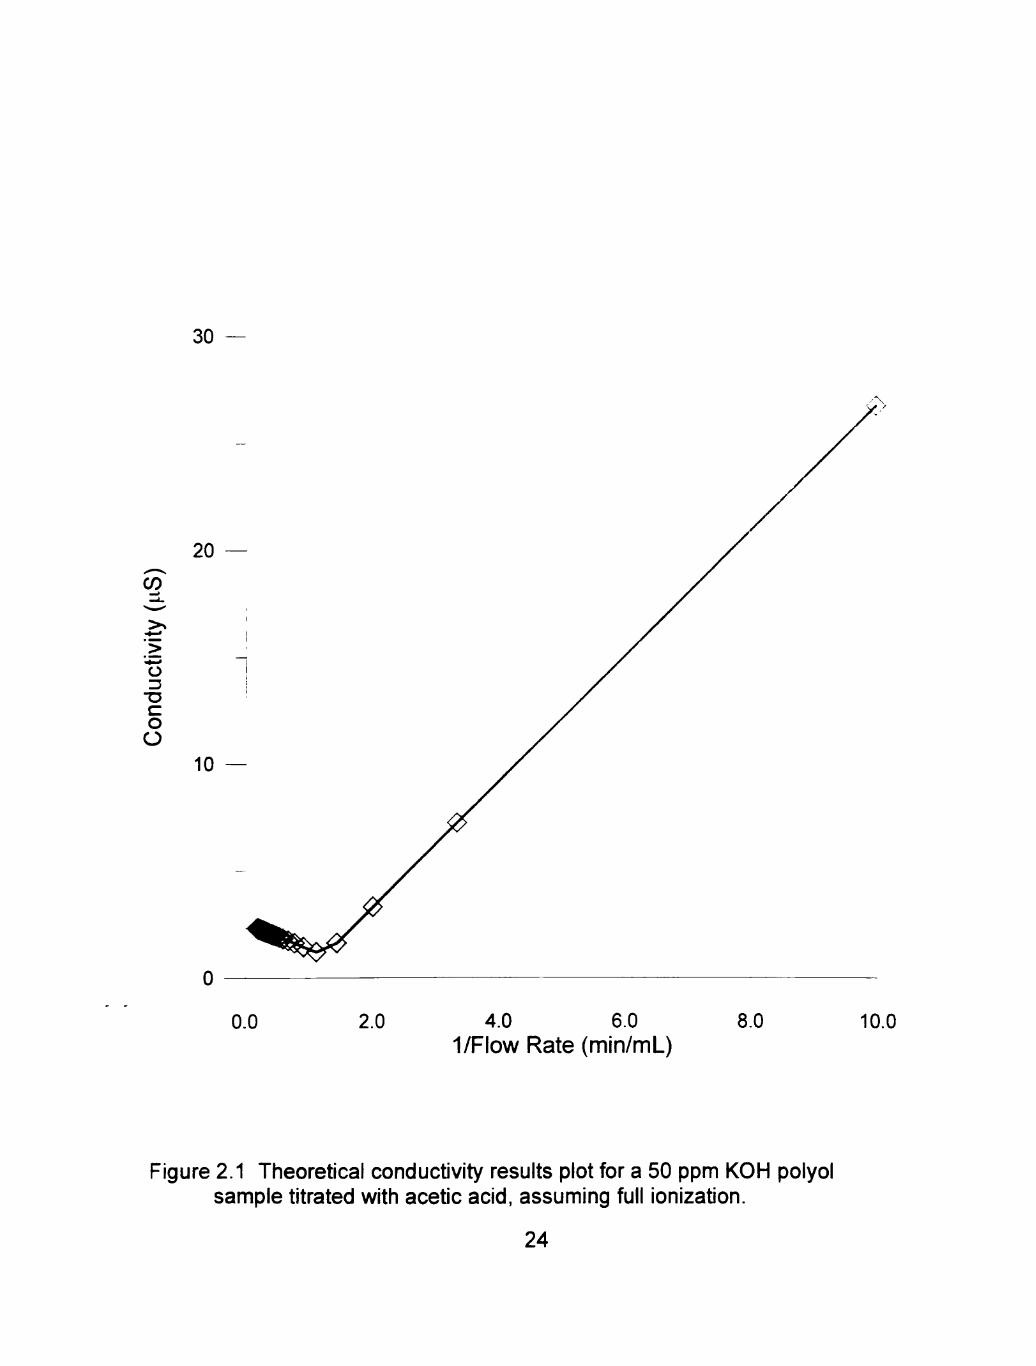
2.1 Theoretical conductivity results for a 50 ppm KOH
polyol sample with acetic acid, assuming full ionization 24
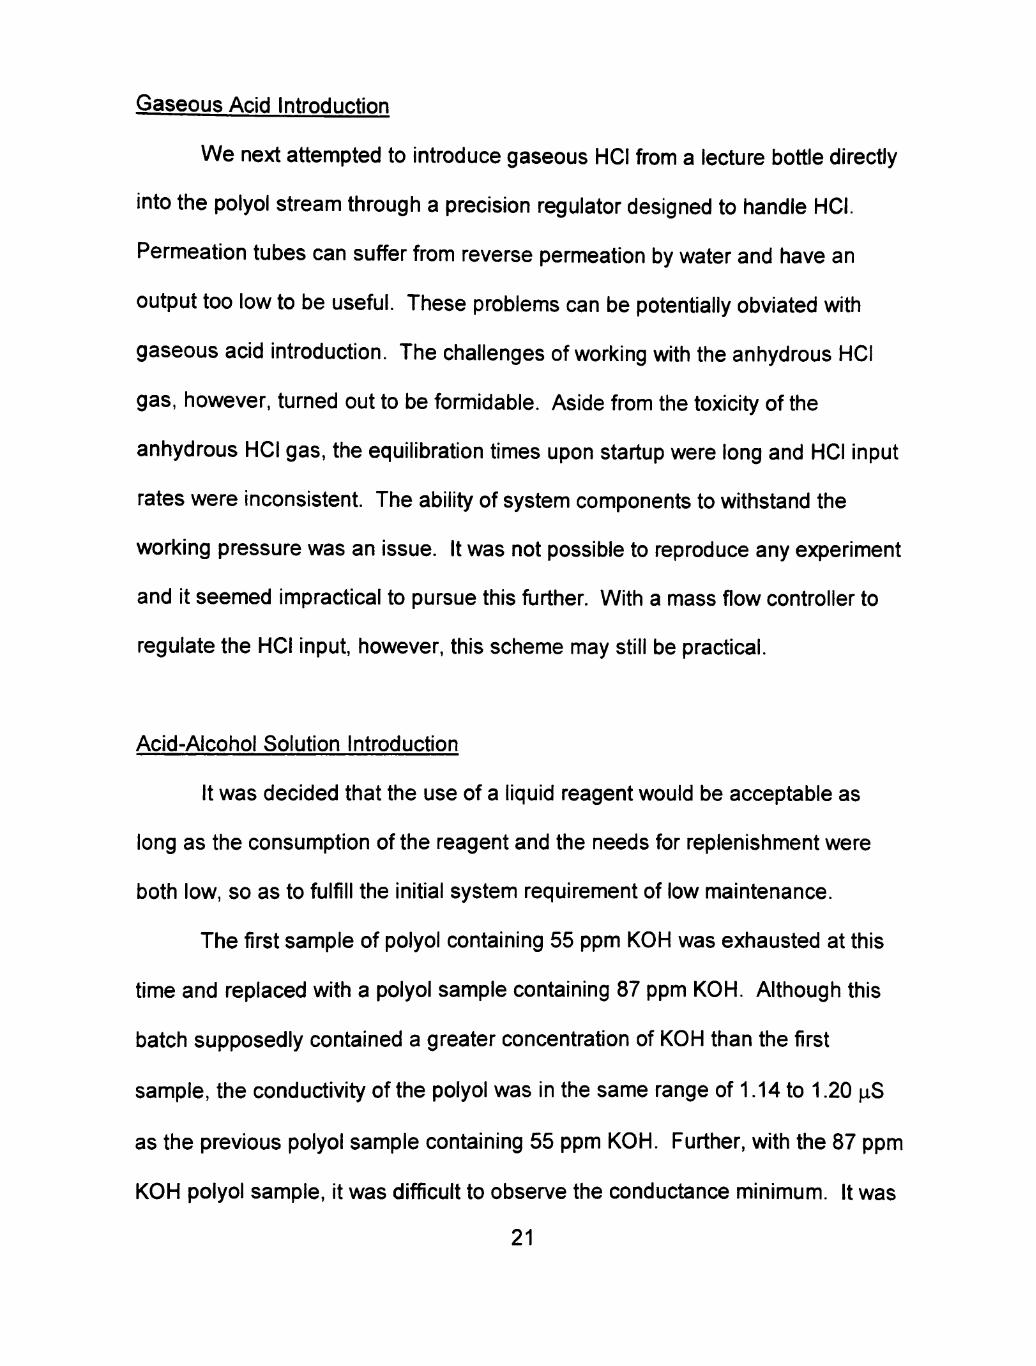
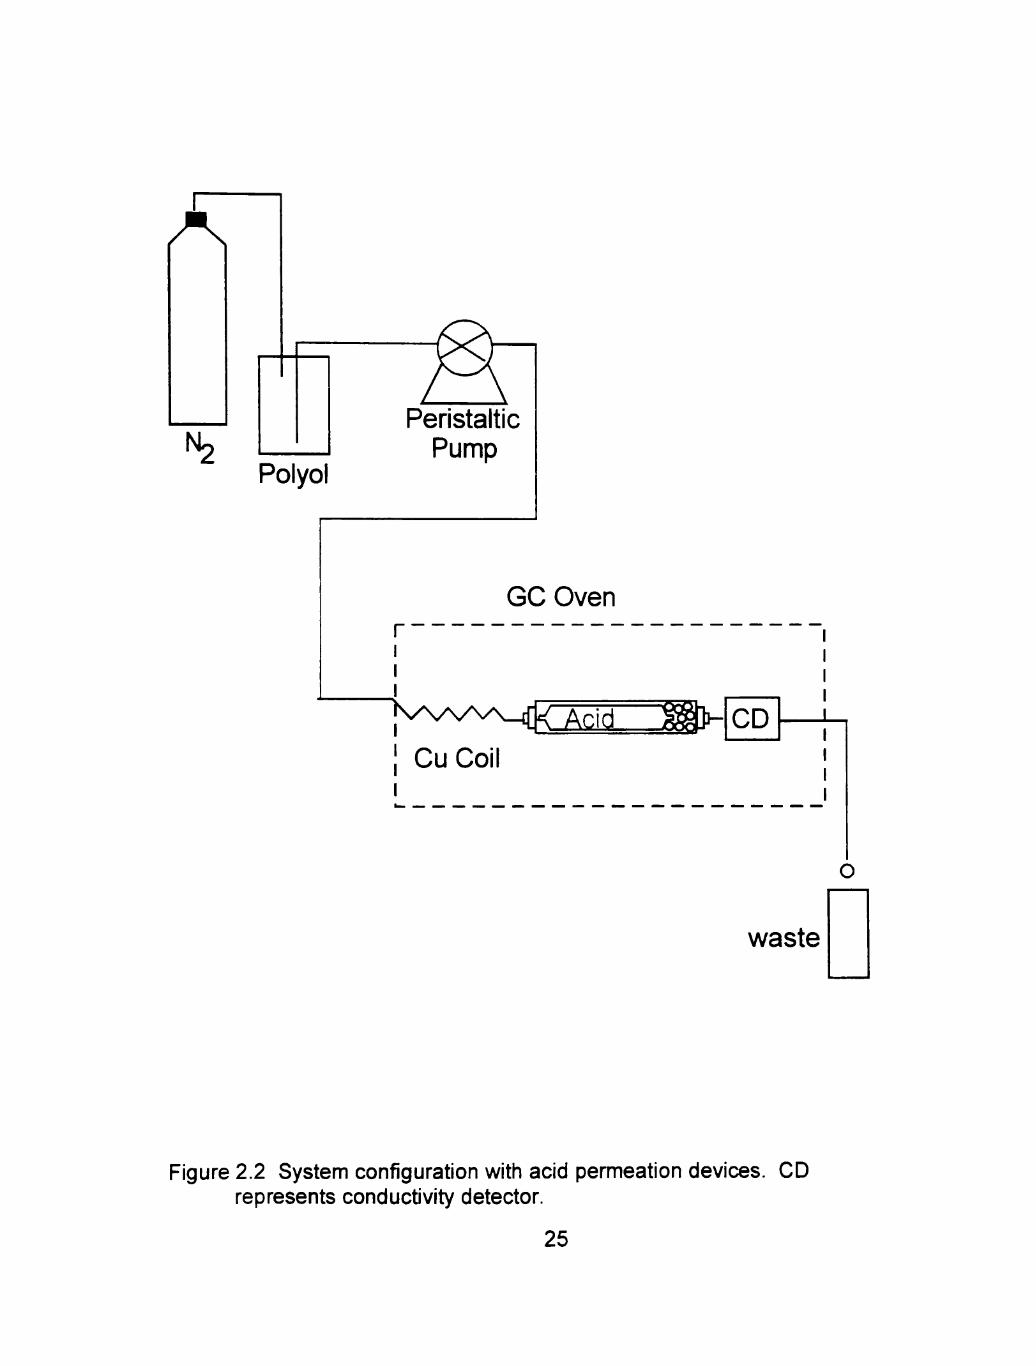
2.2 System configuration with acid permeation devices 25
2.3 Schematicof conductivity detector 26
2.4 System configuration with acid gas introduction 27
2.5 System configuration with acid alcohol solution reagent 28
2.6 Conductivity results from mixing oxalic acid in ethanol with 55 ppm KOH in polyol 29
2.7 Conductivity results from using a dihydrate oxalic (CH2C204* 2H2O) acid permeation tube on-line 30
3.1 Experimental configuration of flow-staircase experiment 56
3.2 Instrumental configuration 57
3.3 Typical flow staircase experiment results 58
3.4 Simulation of peak height in an aqueous system as a function of indicator pK 59
3.5 Typical system performance at 2.9 ppm KOH concentration 60
3.6 Typical system performance for 605 nm wavelength using 10 ^L injections of 10 mM BCG indicator with 6 minutes between injections 61
3.7 Average peak height at 605 nm vs. KOH concentration for low-end analysis using 10 ^L injections of 10 mM BCG 62
VII

3.8 Average peak height at 605 nm vs. KOH concentration for high end analysis using 30 nL injections of 15 mM BCG, 50 mM HCI 63
3.9 Response at 605 nm under the same conditions as those in Figure 3.8 for samples of different water content 64
VIII
LIST OF ABBREVIATIONS
2-PrOH
AU
CH3CO2H
ASTM
BCG
BPB
BTB
cm
CPR
cr
Cu
CI2CHCO2H
CH3CH2SO3H
EO
EOPO
FO
Fl
HCI
H"
OH-
i.d.
2-propanoi
absorbance unit
acetic acid
American Society for Testing and Materials
bromocresol green
bromophenol blue
bromothymol blue
centimeter
controlled polymerization rate
chloride ion
copper
dichloroacetic acid
ethanesulfonic acid
ethylene oxide
ethylene oxide-propylene oxide
fiber optic
flow injection
hydrochloric acid
hydrogen ion
hydroxide ion
inner diameter
IX

Kg
LED
LRA
MgSiOs
^eq
^L
mg
mL
mm
mM
mN
min
CICH2CO2H
nm
N2
N
o.d.
H2C2O4
H2C204»2H20
ppm
PEEK
kilogram
light emitting diode
log-ratio amplifier
magnesium silicate
microequivalents
microliter
microSiemens
milligram
milliliter
millimeter
millimolar
millinormality
minute
monochloroacetic acid
nanometer
nitrogen
normality (equivalents solute/liters of solution)
outer diameter
oxalic acid, anhydrous
oxalic acid, dihydrate
parts per million
polyether ether ketone
PTFE polytetrafluoroethylene
PUF polyurethane foam
K potassium ion
KOH potassium hydroxide
psi pounds per square inch
PO propylene oxide
CI3CCO2H tricholoacetic acid
s second
V volts
H2O water
X wavelength
XI
CHAPTER I
INTRODUCTION
Polyurethane foam (PUF) is found in a myriad of products in present day
living. Furniture, automotive, construction, insulation and footwear industries
consumed 70% of the 15 billion lbs. of PUF produced in 1997, and its
consumption has been growing at a rate of 4-5% annually. ' The major route in
synthesizing PUF is the reaction of a polyol with a diisocyanate. ' '* Currently,
polyether polyols provide the largest variety of possible molecular structures that
yield desired hydroxyl functionality and molecular weight in PUF. Polyether
polyol produced from propylene oxide is the dominant prepolymer for PUF.
Billions of pounds of polyether polyols are presently produced each year, with a
bulk value in excess of 1 billion US dollars.
Alkali metal hydroxides are used as a catalyst in the manufacturing of
polyether polyols. The nature and the kinetics of the reactions that follow
during PUF production to form foam of desired qualities depend on the polyol
basicity. Reserve basicity, or excess KOH content of the polyol, must be
minimized for adequate foam formation. For consistent polymer production, the
concept of net controlled polymerization rate (CPR) was established. '* Net CPR
is defined as the difference between the reserve basicity from the polyol and the
active hydrolyzable chloride of the diisocyante.
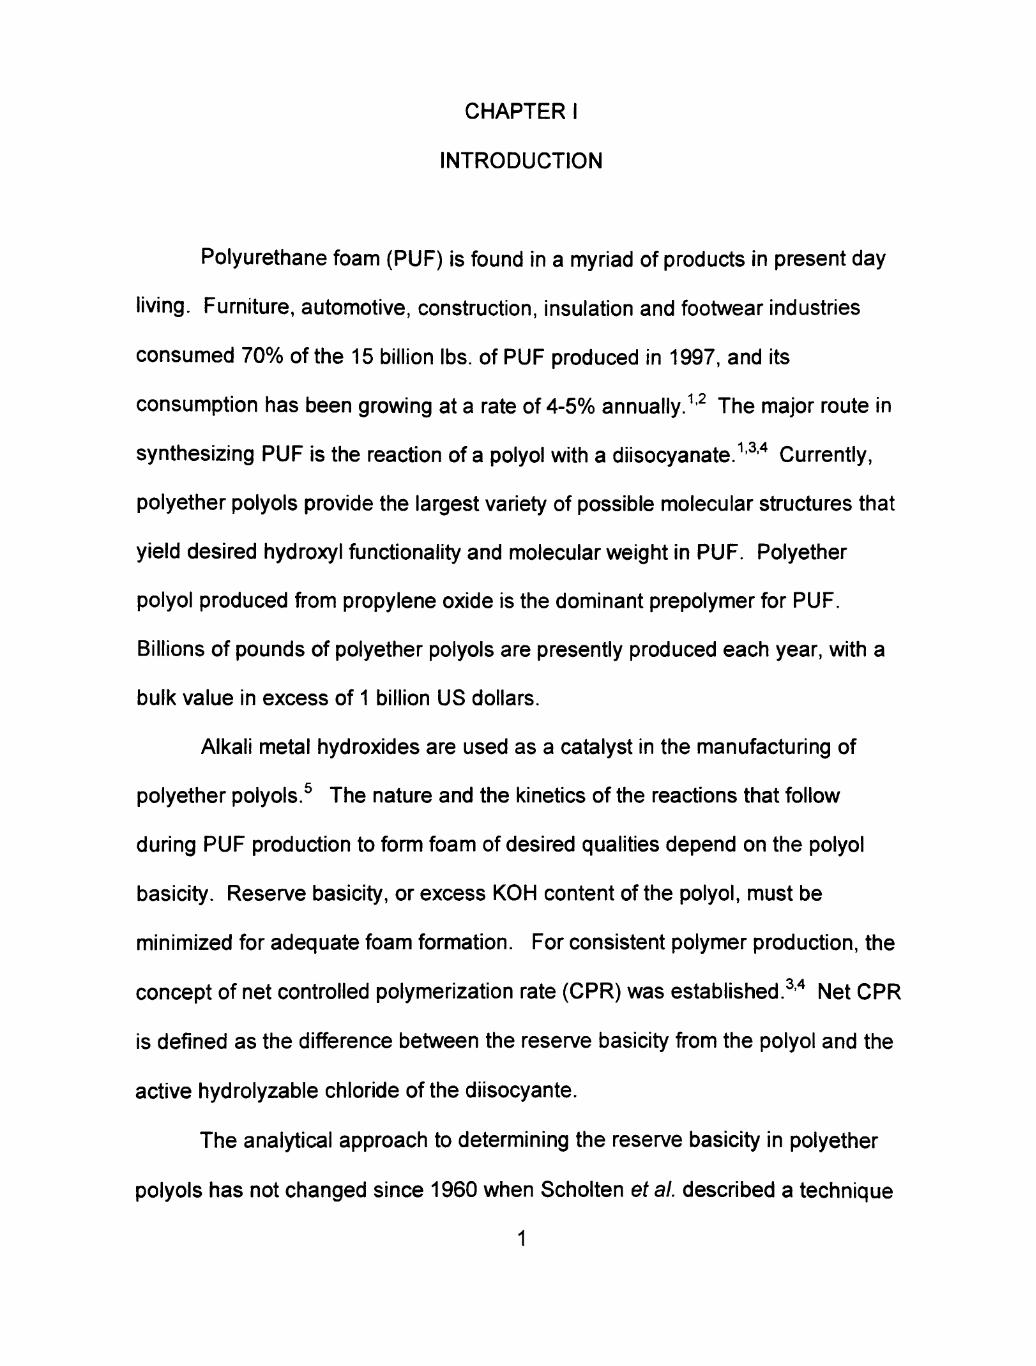
The analytical approach to determining the reserve basicity in polyether
polyols has not changed since 1960 when Scholten etat. described a technique
1
which involved the dissolution of a polyol sample in methanol and subsequent
potentiometric titration with 0.01 N HCI. ' '® The sample must be physically
collected from the process stream at desired intervals, transported to the
laboratory without exposure to atmospheric CO2 and then analyzed. The total
expenditure of time and labor and the time lag between sample collection and the
availability of the analytical result are significant
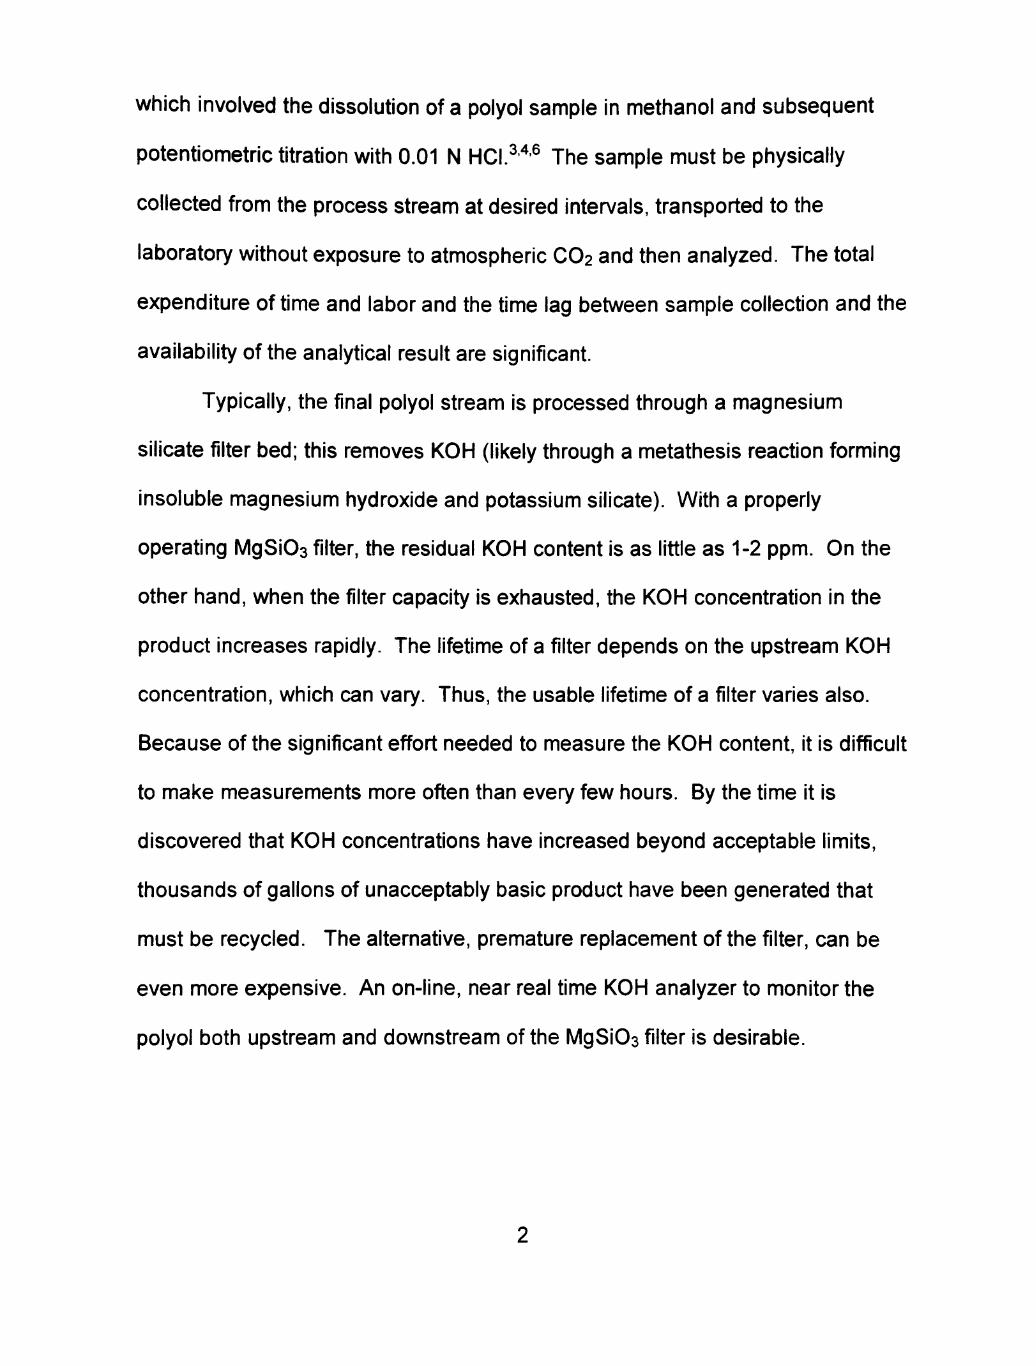
Typically, the final polyol stream is processed through a magnesium
silicate filter bed; this removes KOH (likely through a metathesis reaction forming
insoluble magnesium hydroxide and potassium silicate). With a properly
operating MgSiOs filter, the residual KOH content is as little as 1-2 ppm. On the
other hand, when the filter capacity is exhausted, the KOH concentration in the
product increases rapidly. The lifefime of a filter depends on the upstream KOH
concentration, which can vary. Thus, the usable lifefime of a filter varies also.
Because of the significant effort needed to measure the KOH content, it is difficult
to make measurements more often than every few hours. By the fime it is
discovered that KOH concentrations have increased beyond acceptable limits,
thousands of gallons of unacceptably basic product have been generated that
must be recycled. The alternafive, premature replacement of the filter, can be
even more expensive. An on-line, near real fime KOH analyzer to monitor the
polyol both upstream and downstream of the MgSiOs filter is desirable.

Polyol Production
The physical characteristics of the polyol plays a major role in the final
PUF product. Rigid PUF, such as the foam used in the industries listed
previously, requires good hydrolytic stability. Due to this desired property,
propylene oxide (PO) is the most widely used alkylene oxide used for polyol
production. Another property of polyol, viscosity, is an indicator to the rigidity of
the final PUF product (the higher the viscosity, the greater the foam rigidity
whereas the lower the viscosity, the less rigid the foam). Controlling the
conditions of product formation of the polyol prepolymer is critical for the PUF.
The chemical reaction scheme for the anionic polymerization of propylene
oxide into polyol is given by the following:
ROH + KOH - ^ ROK* + H2O vacuum
i O
/ \
CH2—CH
CH3
R0CH2CH0-K* + (CH2CHO) -^ R0(CH2CH0)n-K^
CH: CH: CH-
; H2O
R0(CH2CH0)nH + KOH (1.1)
CH-
where ROH is referred to as the starter.'

A preferred procedure for the production of polyether polyol involves
mixing the starter, the base catalyst and a small portion of the PO or an ethylene
oxide-propylene oxide (EOPO) copolymer, and heating the mixture to the
reaction temperature in a semi-batch mode in stainless steel autoclaves. ' Table
1.1 provides a list of starter compounds used for polyol formation. Once the
reaction has started, the remaining portion of PO and/or EO is fed into the
reaction chamber at the rate at which it reacts. By following this procedure, a
steady state reaction is ensured and effective temperature control is maintained.^
When the produced polymer has attained the desired hydroxide (OH) number,
the PO is no longer fed into \he reaction chamber, the reaction stops and the
catalyst is removed.
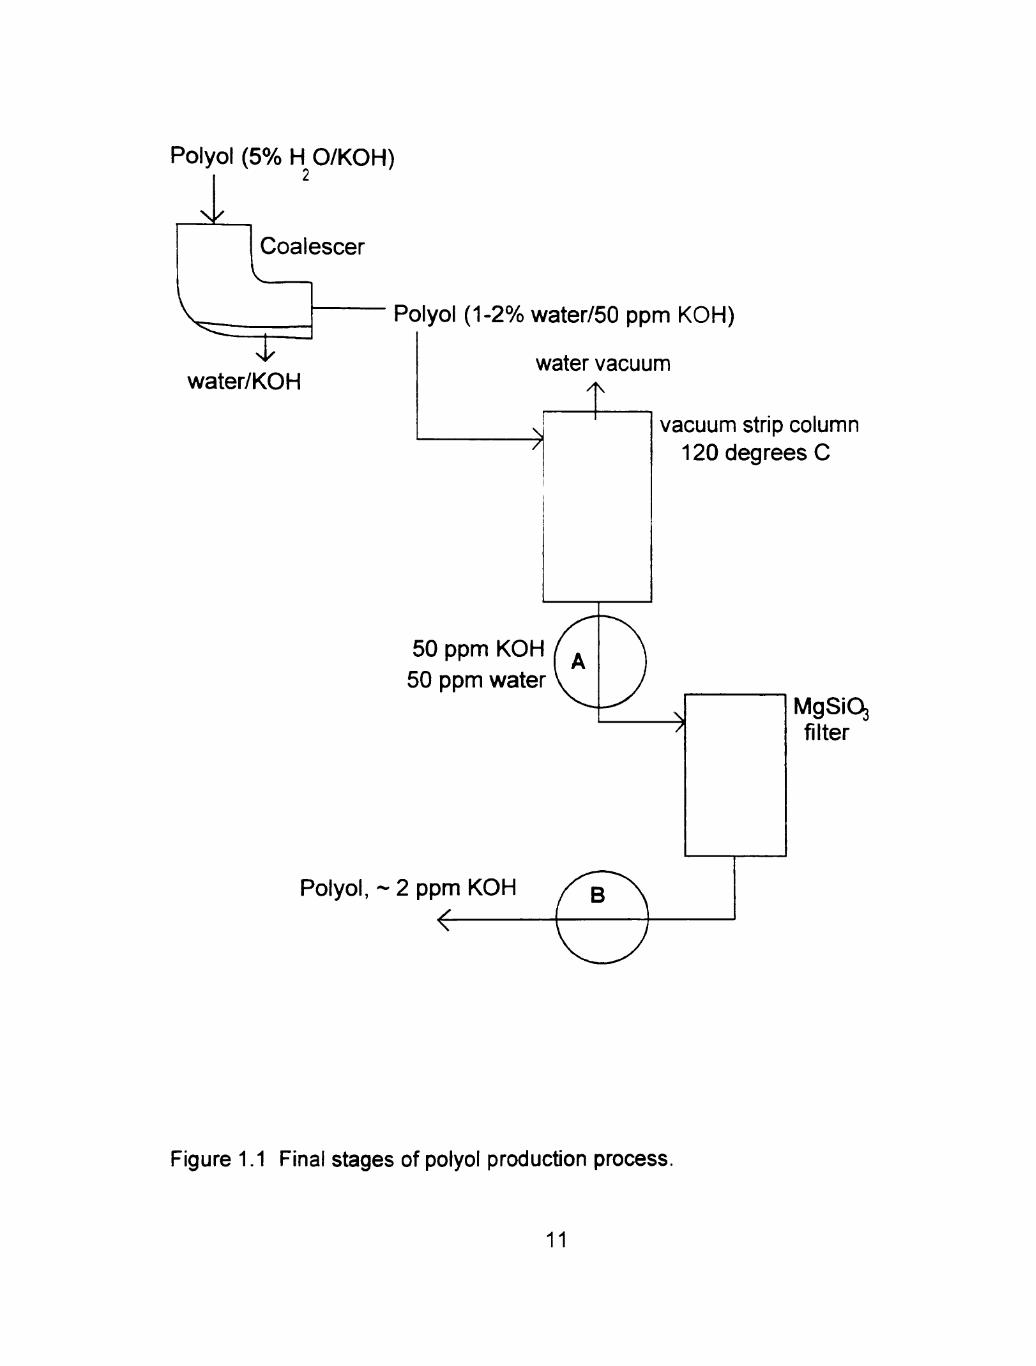
The final stages of the polyol production process can be viewed in Figure
1.1. Once the reaction has been halted, the polyol stream is fed out of the
reaction vessel and into the coalescer, which is maintained at 120° C. In the
coalescer, water containing KOH settles out fi'om the polyol. At the next step, the
polyol passes through a vacuum strip column still maintained at high
temperatures. At location A in the figure, typical KOH concentration is 55 mg
KOH/Kg polyol (ppm KOH). Potassium hydroxide in the polyol that remains after
water withdrawal passes through the MgSiOs filter. After the filter, KOH
concentration at location B is approximately 2 ppm KOH. By monitoring the KOH
content after the MgSiOs filter, it is possible to know the KOH content in the
polyol at any given time in the final product. By monitoring KOH concentration
before the MgSi03 filter, the amount of base adsorbed by the filter can be
obtained and allows for more accurate monitoring of filter loading which can
provide advance warning as to when the filter will be exhausted.
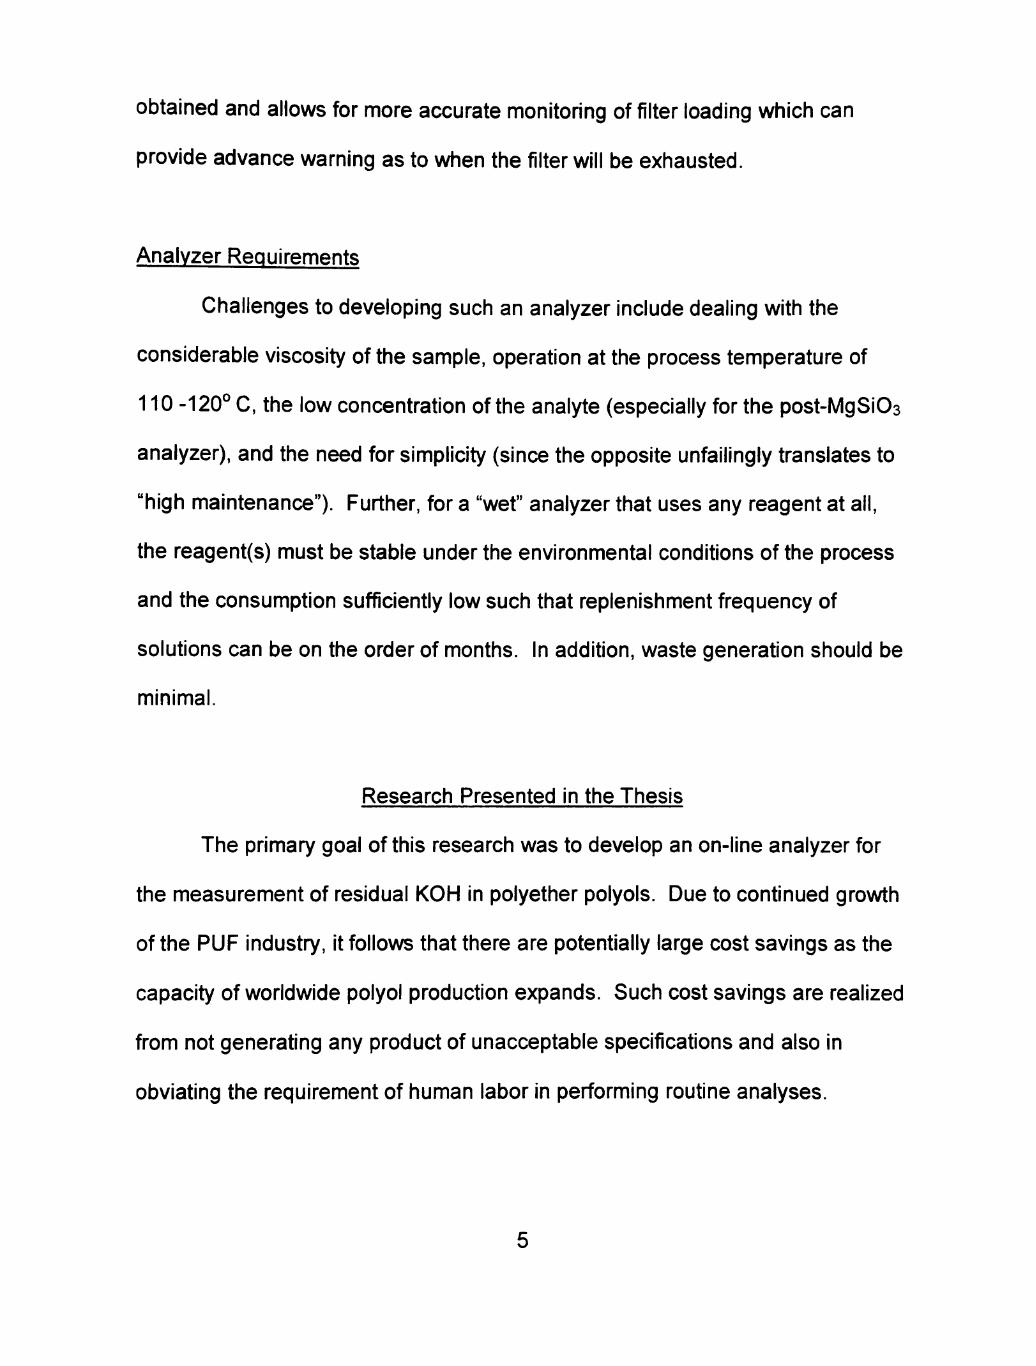
Analyzer Requirements
Challenges to developing such an analyzer include dealing with the
considerable viscosity of the sample, operation at the process temperature of
110 -120° C, the low concentration of the analyte (especially for the post-MgSiOs
analyzer), and the need for simplicity (since the opposite unfailingly translates to
"high maintenance"). Further, for a "wet" analyzer that uses any reagent at all,
the reagent(s) must be stable under the environmental conditions of the process
and the consumption sufficientiy low such that replenishment frequency of
solutions can be on the order of months. In addition, waste generation should be
minimal.
Research Presented in the Thesis
The primary goal of this research was to develop an on-line analyzer for
the measurement of residual KOH in polyether polyols. Due to continued growth
of the PUF industry, it follows that there are potentially large cost savings as the
capacity of worldwide polyol production expands. Such cost savings are realized
from not generating any product of unacceptable specifications and also in
obviating the requirement of human labor in performing routine analyses.

Flow Analvsis with Conductometric Detection
Attempts have been made in the past to develop an on-line or at-line
analyzer. Because KOH should be the sole ionic constituent in the sample,
conductometry can be attractive. However, the large viscosity and the low
dielectric constant (relative to water) of the polyol render the technique
insensitive, necessitating dilution with a compatible solvent such as methanol.
An analyzer was developed at Dow Chemical that measured the conductance
after significant dilution with methanol. More than the reliability of the scheme,
it was the large methanol consumption (and the need for very strict exclusion of
atmospheric CO2) that made this approach unacceptable. The fact that an
ASTM procedure formulated in 1999^ is still based on the original manual
titrimetric method reported in 1960^ underscores the difficulty of making
meaningful improvements to this determination.
Partly because the original attempt at process analysis was based on
conductometry, an extensive effort was initially spent on such approaches. The
central concept was to flow polyol over a permeation tube^ that is continuously
emitting an acid gas at a constant rate. The conductance of the effluent was to
be measured and the stream blended back into the process line. The amount of
acid going into the effluent stream would be minuscule and no waste would be
generated. Unlike absolute conductometry, this procedure can tolerate spectator
ions; a titration curve is generated by varying the flow rate of the polyol. If the
permeation rate of the acid is correctiy chosen, at low polyol flow rate, the
effluent will be acidic and at high flow rates the stream will be alkaline. There will

exist a flow rate at which the sfi-eam is exactly titrated and the flow rate
corresponding to the conductance minimum can be used to compute the KOH
content. The scheme was successfully tested using a constant flow of ethanolic
oxalic acid merged with a stream of the basic polyol. With permeation tubes of
typical dimensions, however, we found it difficult to meet the conflicting needs of
generating a high enough acid output and having a sufficientiy long permeation
tube lifetime. Further, the possibility arose that water from the polyol (typical
range 0.1-0.5% w/w) can permeate into the permeation tube contents and affect
the constancy of the emission rate. Both of these drawbacks were avoided by
having a constant input of HCI gas from a lecture bottle into the polyol stream
through a tee. Unfortunately, the system could not be reproducibly operated,
likely due to inconstancy of the HCI input. As the components of the instrument
evolved, which is described in Chapter II, it was determined that KOH may not
always be the primary contributor to conductivity and therefore, another detection
system was required.
Reverse Flow Injection with Optical Absorbance Detection
The challenge for process analysis was primarily accomplished using a
continuous, colorimetric reverse flow injection (Fl) technique. Design
considerations have led to the development of a bench scale trace KOH analyzer
in polyether polyol. Chapter III describes the development of a simple, one-
reagent single-line colorimetric reversed Fl technique that consumes a few
microliters of the reagent per analysis. By using an acidic indicator in alcohol,

experiments were run in which the flow of the acidic indicator solution was
lineariy ramped up and mixed with a flowing polyol stream. This led to injecting
plugs of acidic indicator Into the flowing polyol stream. The most successful
procedure involved the injection of a solution of bromocresol green (BCG) in 2-
Propanol, with or without added mineral acid, into the sample polyol stream in a
single-line Fl manifold maintained at 110 °C (dispersion factor of 50-25 for a
dilute aqueous stream at room temperature with 10 and 30 |LIL of solution
injected). The blue indicator di-anion formed upon reaction with KOH is
measured at 605 nm by a light emitting diode (LED) - fiber optic based
absorbance detector. Injections of 10 |iL of 10 mM BCG and 30 ^L of a 15 mM
BCG, 50 mM HCI solution were respectively chosen to cover desired ranges of 0-
20 and 20-120 mg KOH/Kg polyol (ppm KOH). The absorbance signal is linear
with KOH concentration (r = 0.9949 in both cases). Results were available within
four minutes. The polyol water content was deliberately altered to test the effect
on observed results. No discernible effect was observed.
In Chapter IV, conclusions and future work directions are presented. The
work reported in Chapter III is in progress of submission for patent ° and has
been submitted for publication. ^
8

References
1. McCoy, M. Ctiem Eng. News, 1998, 76(37), 19.
2. Tullo, A. Chem Eng. News, 1999, 77(47), 14.
3. Scholten, H. G.; Schuhmann, J. G.; TenHoor, R. E. J. Chem. Eng. Data 1960, 5, 395-400.
4. Scholten, H. G.; Schuhmann, J. G.; TenHoor, R. E. l/EC 1960, 52, 613.
5. Meath, A. R.; Booth, L. D. ACS Symp. Ser. 1977, 41, 257-263.
6. ASTM D 6437-99, "Standard Test Method for Polyurethane Raw Materials: Alkalinity in Low Alkalinity Polyols (Determination of CPR Values of Polyols)," West Conshohocken, PA: American Society for Testing and Materials, 1999.
7. Kirl<-Otfimer Encyclopedia of Chemical Technology, Fourth Edition. Vol. 19. J. I. Kroschwitz, Ex. Ed., M. Howe-Grant, Ed. New York, NY: John Wiley and Sons, 1996; pp 726-737.
8. Plepys, R. Dow Chemical Company, Freeport, TX. Personal communication, 1998
9. O'Keefe, A. E.; Ortman, G. C. Anal. Chem. 1966, 38, 760.
10. "Flow Injection Method for the Determination of an Acid or a Base in a Polyol." Patent in progress.
11. Galanis, S; Dasgupta, P. K. "Measurement of Parts Per Million Levels of KOH in Polyether Polyol Streams." Submitted to Analytical Chemistry.

Table 1.1 Common Starters for Polyurethane Polyols. Name Abbreviation Hydroxyl Molecular Weight
Functionality Propylene Glycol PG 2 76.1
DIpropylene Glycol DPG 2 134.2
Glycerol Gly 3 92.1
Trimethylolpropane TMP 3 134.2
Pentaerythritol PE 4 136.2
Ethylenediamine EDA 4 60.1
Toluenediamine TDA 4 122.2
Sorbitol Sorb 6 182.2
Sucrose Sue 8 342.3
10
Polyol (5% H 0/KOH)
\ /
Coalescer
T Polyol (1-2% water/50 ppm KOH)
water/KOH water vacuum
4\
^
50 ppm KOH / ^ ^ 50 ppm water V J
vacuum strip column 120 degrees C
Polyol, - 2 ppm KOH
<
MgSiO^ filter
Figure 1.1 Final stages of polyol production process.
11

CHAPTER II
FLOW ANALYSIS WITH CONDUCTOMETRIC
DETECTION
Introduction
In the eariy stages of this research, potassium hydroxide (KOH) was
assumed to be the principal ionic species in the polyether polyol streams. As the
principal electrolyte, K" and OH' ions arising from the KOH was also assumed to
be the dominant conductive species in solution. It was therefore expected that if
a solution of polyol was mixed with an acid at different ratios, the solution
conductivity would continue to decrease as the following reaction occurs:
K + OH- + HX -> K* + X-+ H2O. (2.1)
Conductivity decreases as a result of the less mobile X" (the anion of the acid
used in the process) replacing the highly mobile OH'. As is well known for
conductometric acid-base titrations, the conductivity would go through a
minimum at the neutralization point.' As more acid is added beyond the
neutralization point, the excess H^and X" appear in solution and the conductivity
in turn increases.
The results of calculations for the titration of a 50 ppm KOH polyol sample
with acetic acid can be viewed graphically in Figure 2.1. This graph cleariy
illustrates the anticipated behavior as the titration progresses. The downslope of
the graph demonstrates the neutralization of ionic species. The minimum point
indicates neutralization of the base and the upslope indicates that excess acid is
12
being added to the system. The precise value of the slope in the upslope region
of the curve also yields the acid permeation rate into the system, when
permeation devices are utilized to introduce acid. At lower KOH concentrations,
the same trend is expected, just with lower conductivity values.
By using hydrochloric acid (HCI) as the acid, Figure 2.1 can also be
explained by examining specific ionic conductance values for K", 0H-, H" and CL.
The specific ionic conductance for K"", OH', H"" and Cr are 73.5, 198.6, 349.82,
and 76.35, respectively in aqueous solution at 25° C. As OH" is neutralized with
the H* from the acid, the conductivity decreases. Once all of the OH- has been
neutralized, the remaining spectator ions present account for the remaining
conductivity. As net acid is added to the system, the conductivity begins to rise
with a steeper slope due to the higher ionic conductance of H"" as compared to
other ions.
Therefore, in the initial experimental scheme, the primary detector
requirement was to monitor the progress of a titration between KOH and a
selected acid (HX). Conductivity detectors were attractive due to properties that
were ideal for the polyol system: (1) high sensitivity, (2) universality for ionically
conducting systems, and (3) generally predictable response to concentration
changes.^ The high sensitivity aids detection of the low concentration of KOH
expected in the final polyol product. Due to the universality of the detector for
ionic species, preliminary models are possible to simulate anticipated
conductivity values a known concentration of KOH in polyol titrated by
introducing an acid at an appropriate rate. Conductivity detectors are simple to
13

operate, inexpensive to construct and maintain, and typically provide problem-
free service. Conductometric detection was chosen for the system.
Experimental
Chemicals and Reagents
Polyether polyol samples were supplied in 10 gallon capacity hermetically
sealed dmms (VoranoP, Dow Chemical Co., Freeport, TX). The KOH content in
the samples was determined at Dow by potentiometric titrimetry in aliquots drawn
in parallel. The work reported in this chapter was conducted with a 55 or 87
parts per million (ppm) KOH polyol sample. The container cap was modified to
provide for a sample exit line (that reaches to the bottom of the container) and an
aperture to provide for 2 psi Nitrogen (N2) inlet pressure.
Various acids were used in permeation tubes to test the suitability of
adding acid to the system in-situ. ACS grade hydrochloric acid (HCI) and glacial
acetic acid (CH3CO2H) were both obtained from EM Science. Permeation
devices were constructed by using 7 cm of %" o.d., 1/8" i.d. PTFE tubing or 8 cm
of PTFE tubing (1/16" o.d., 0.081" i.d.), fijrther referred to as the large and small
permeation devices, respectively. Permeation devices were constructed by
heating one end of the tubing with a heat gun and then crimping it as it was
heated. The acid was then added to the tubing and then the other side sealed in
the same manner. Polyethylene tubing (0.361" o.d., 0.261" i.d.) was also tested
as a permeation device, but was not utilized due to permeation rates that were
too high. Small permeation devices of monochloroacetic (CICH2CO2H),
14
dichloroacetic (CI2CHCO2H), trichloroacetic (CI3CCO2H), and ethanesulfonic
(CH3CH2SO3H) acids (Aldrich Chemical Company) were constructed. Small
permeation tubes of oxalic acid, dihydrate (H2C204»2H20) from Mallinckrodt and
anhydrous oxalic acid (H2C2O4) from ACROS were also made and tested.
Permeation devices of H2C2O4, were also constructed using silicone tubing
(0.357" o.d., 0.252" i.d.) and Teflon heat shrink tubing (0.306" o.d., 0.292" i.d.). A
316 grade stainless steel cylinder (8" long, 1" i.d.) was machined and anhydrous
oxalic acid allowed to permeate. The acid reached the polyol stream via 0.064"
o.d. X 0.02" i.d. stainless steel tubing in which a small piece of Teflon (PTFE)
tubing (0.089" o.d., 0.051" i.d.), sealed on one end, connected over the end of
the stainless steel tubing and served as the active permeation area in the polyol
stream.
Anhydrous HCI gas (Scott Specialty Gases) was obtained in a small
lecture bottle to introduce the acid in this form. The gas was introduced into the
flowing polyol stream through a precision regulator designed to handle HCI, a
fused silica restriction capillary (10 |im dia., 18.5 cm long). Eventually, a IN
solution of HCI was prepared with ACS grade 2-propanol (2-PrOH) as solvent.
This alcohol solution was stored in a dark container.
Instrumental Arrangement
Arrangement with Permeation Devices. The experimental configuration
using permeation devices is shown schematically in Figure 2.2. A peristaltic
pump and Lab pump Jr.(Model RHSY, Fluid Metering, Inc., Oyster Bay, New
15
York) were installed and tested for suitability. Desired flow rates varied fi'om 0.1
to 2.0 mUmin. Difficulties were encountered with peristaltic pumps due to
considerable backpressure. Standard poly(vinyl cholride) (PVC) peristaltic pump
tubing (Elkay Products, Sherwsbury, MA) was utilized with the peristaltic pumps.
The polyol stream passed into a heated enclosure maintained at 110°C (to
simulate process conditions). A gas chromatograph oven (Shimadzu GC-8A),
modified to a minor extent, was used for the purpose of simulating the process
temperature. The polyol stream then proceeded through a copper (Cu) coil (1/8"
o.d., 1/16" i.d.) to allow for thermal equilibration. The heated polyol then passed
through a tube, which contained the permeation device. After the permeation
device, some glass wool was inserted followed by 1 mm diameter glass beads
and then more glass wool to promote mixing. After mixing the polyol with the
acid introduced from the permeation device, the polyol stream was directed to a
special conductivity cell, designed and machined in-house, to measure the very
low conductivities characteristic of highly viscous polyol (Figure 2.3). Two %-28
fittings are used to connect the polyol flow through the inlet and outiet ports. The
outer diameter of the conductivity cell was 1.048"; the active Inner diameter of the
conductivity cell was 0.504" with the depth of .004". The cell was constructed by
two identical stainless steel halves, which were separated by a Teflon seal and
attached via six screws with plexiglass spacers. The cell constant was 0.00621
cm-^ The polyol flow then proceeded out of the heated enclosure and into a
waste container. Conductivity readings were collected by data acquisition
software Chroml-AT, on a 386 Clar PC.
16

Acid Gas Introduction System. The schematic of the system can be
viewed in Figure 2.4. The pumping system is the same as with that discussed in
the previous section. An anhydrous HCI lecture bottle was connected to the
system by stainless steel tubing and Swagelok fittings, followed by 18.5 cm of 10
^m diameter fused silica capillary tubing (Polymicro Technologies, Phoenix, AZ).
The polyol stream then proceeded into the heated enclosure, passed
through the Cu coil and then flowed through the conductivity detector.
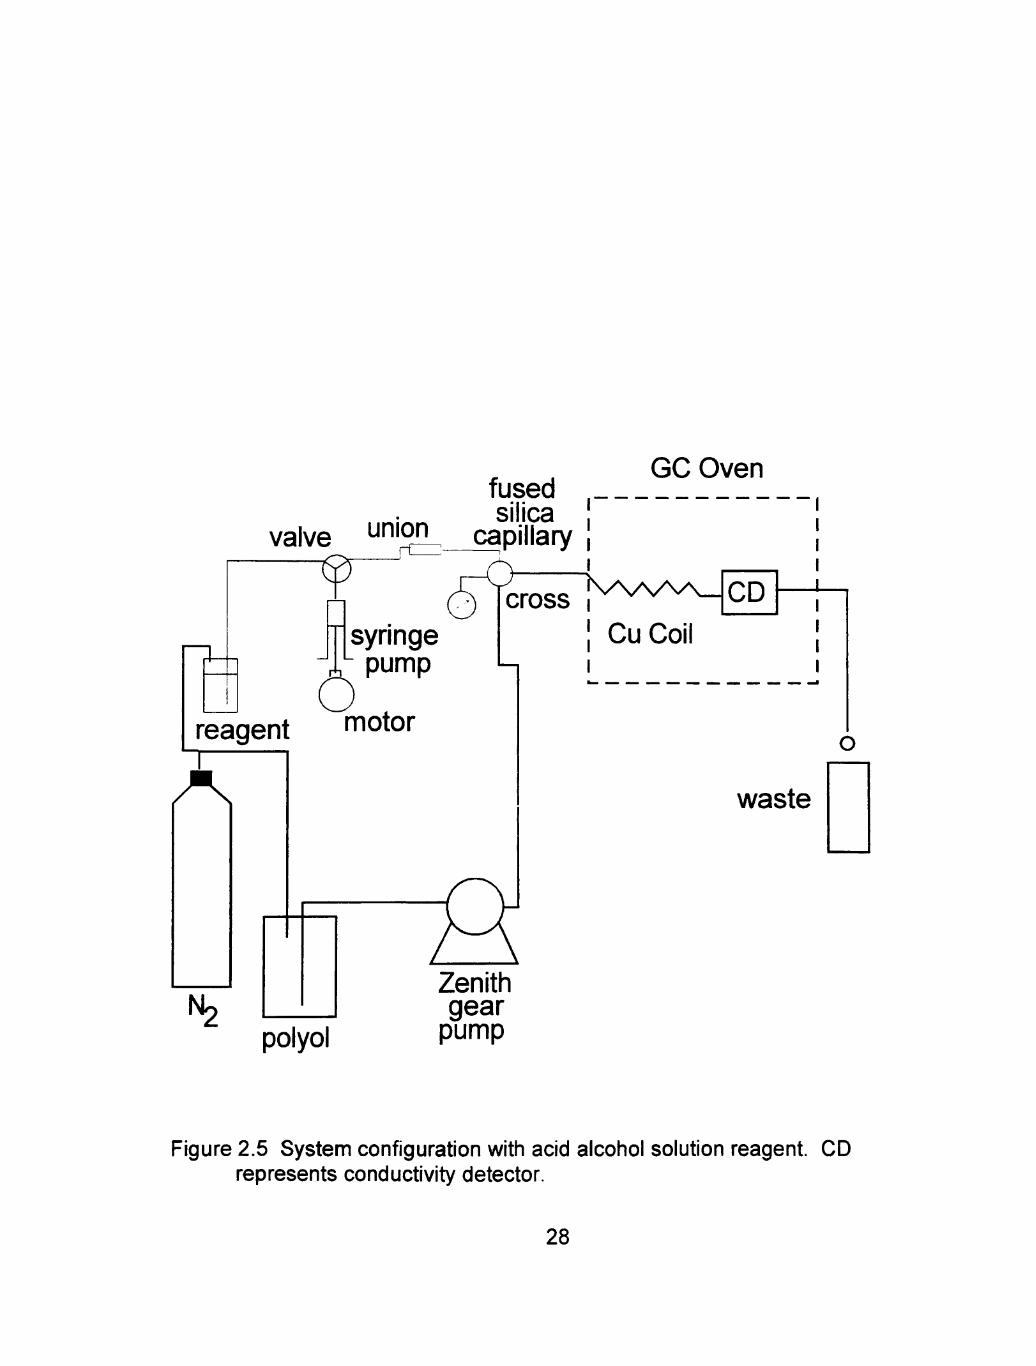
Acid-Alcohol Solution System. The instrument configuration can be
viewed in Figure 2.5. The polyol sample was maintained as previously
described. A zenith gear pump was installed for polyol pumping. Polyethylene
tubing was utilized to connect the polyol flow from the pump to a %-28 threaded
cross fitting. One port of the cross was connected to the pressure gauge, which
gave system pressure readings. Another port of the cross was connected to the
acid delivery pump. The acid delivery pump was a model 50300 syringe pump
equipped with a 48000 step stepper motor, an integral automated
aspirate/dispense 3-way valve and a 500 |xL capacity glass syringe (Kloehn Inc.,
Las Vegas, NV). The syringe pump is connected to the cross fitting by a union
fitting that connects1.5 mm o.d, 0.5 mm i.d. PEEK tubing to a fused silica
capillary (100 jim in intemal diameter, 6 cm long). The small aperture of the
capillary minimizes the diffusive bleeding of the acid solution into the flowing
polyol stream. The operation of the syringe pump is conti-olled by an IBM
ThinkPad 560 laptop PC through its RS-232 port using vendor-supplied software.
17
Once the syringe pump is programmed, the protocol resides in the pump
memory.
The last connection to the cross was the tubing that led into the oven
followed by a serpentine II style^ open tubular mixer (0.69 mm i.d, 1.8 mm o.d.
PTFE tube, 1 m long, woven on a grid spacing of 2.0 mm), and then a packed
bed mixer (4 x 50 mm, filled with 1.0 mm dia. glass beads, with a glass wool plug
as the retainer). After the mixers, the polyol flowed into the conductivity cell and
then to the waste container. Data from the conductivity cell was collected by
Chroml-AT software on a 386 Clar PC.
Results and Discussion
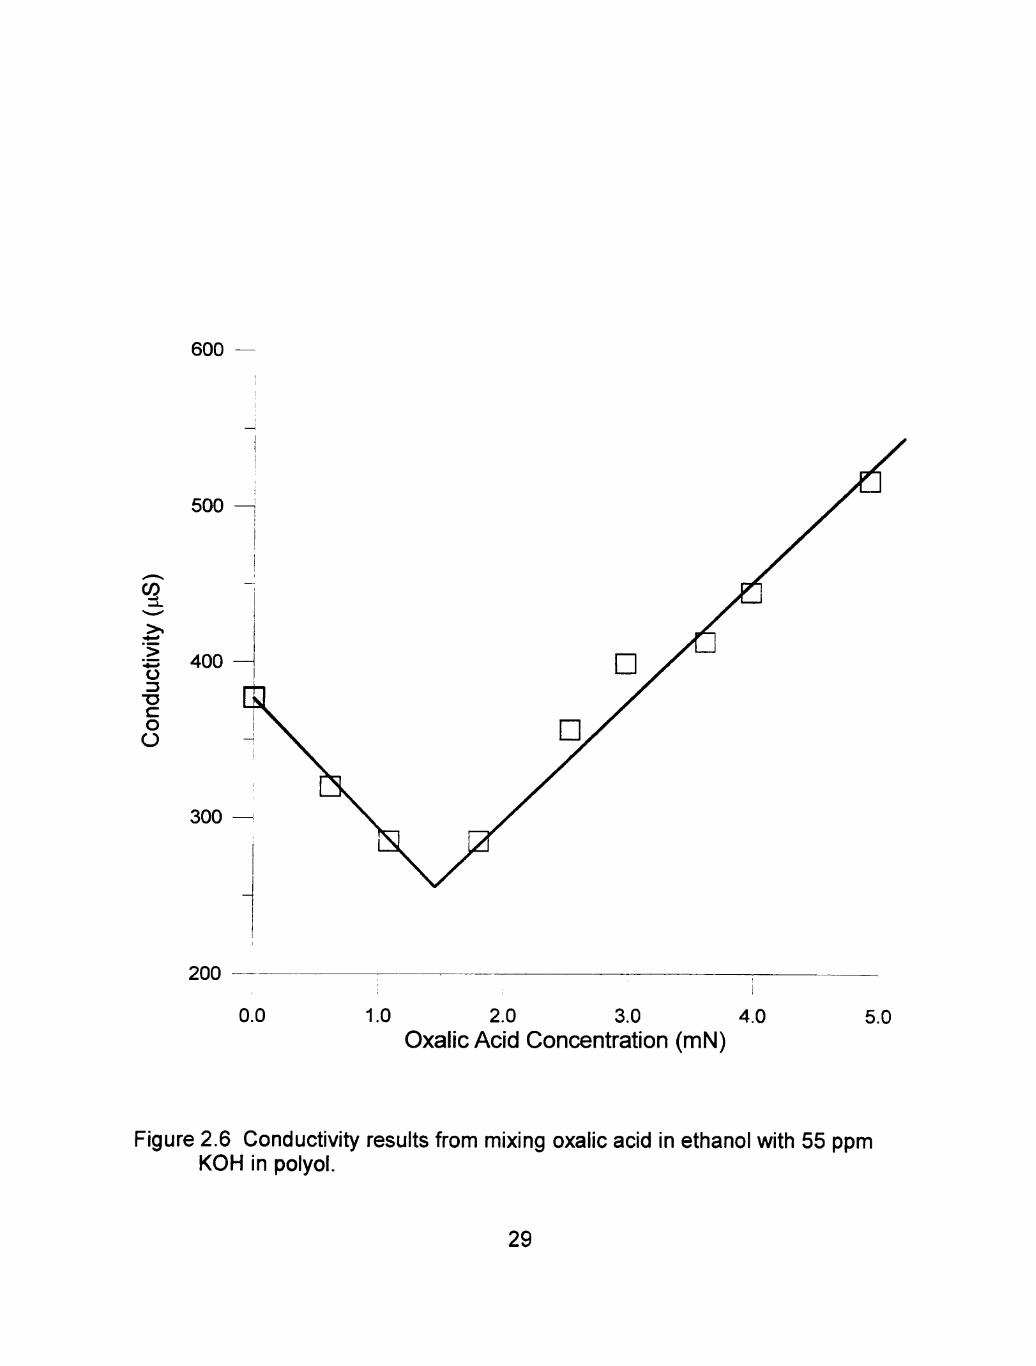
Initially, an experiment was performed with the 55 ppm KOH polyol
sample in which the polyol sample was mixed with alcohol solutions containing
oxalic acid in order to test the validity of the conceptual basis of the experiment
as applied to the polyol medium. Concentrations of 0.5 mN to 5 mN of di-hydrate
oxalic acid were prepared in ethanol. With the flow rate of polyol at 1 mL/min,
the oxalic acid titrant was added to the polyol stream and conductivity
measurements taken. The results shown in Figure 2.6 suggested that the
expected conductivity behavior in the polyol medium is indeed observed. The
line in the graph has been drawn as customary for such conductometric
titrations.^
18
Permeation Devices
Efforts were initially focused on using a "reagentiess" system. By passing
the polyol directiy over a permeation tube^ containing acid, the acid reagent was
expected to be inti-oduced into the polyol stream at a steady rate. It was critical
to select a combination of a specific acid with the dimensions of the permeation
tube. The goal was to achieve a reproducible permeation rate of the acid in the
single digit microequivalents (^eq)/min range at 110°C while maintaining the
structural integrity of the permeation tube. A further desired characteristic was
that any reverse permeation of water from the polyol to the acid within the
permeation tube should have minimum effect on the permeation rate.
Permeation tubes were calibrated at 110°C by taking periodic gravimetric
measurements.
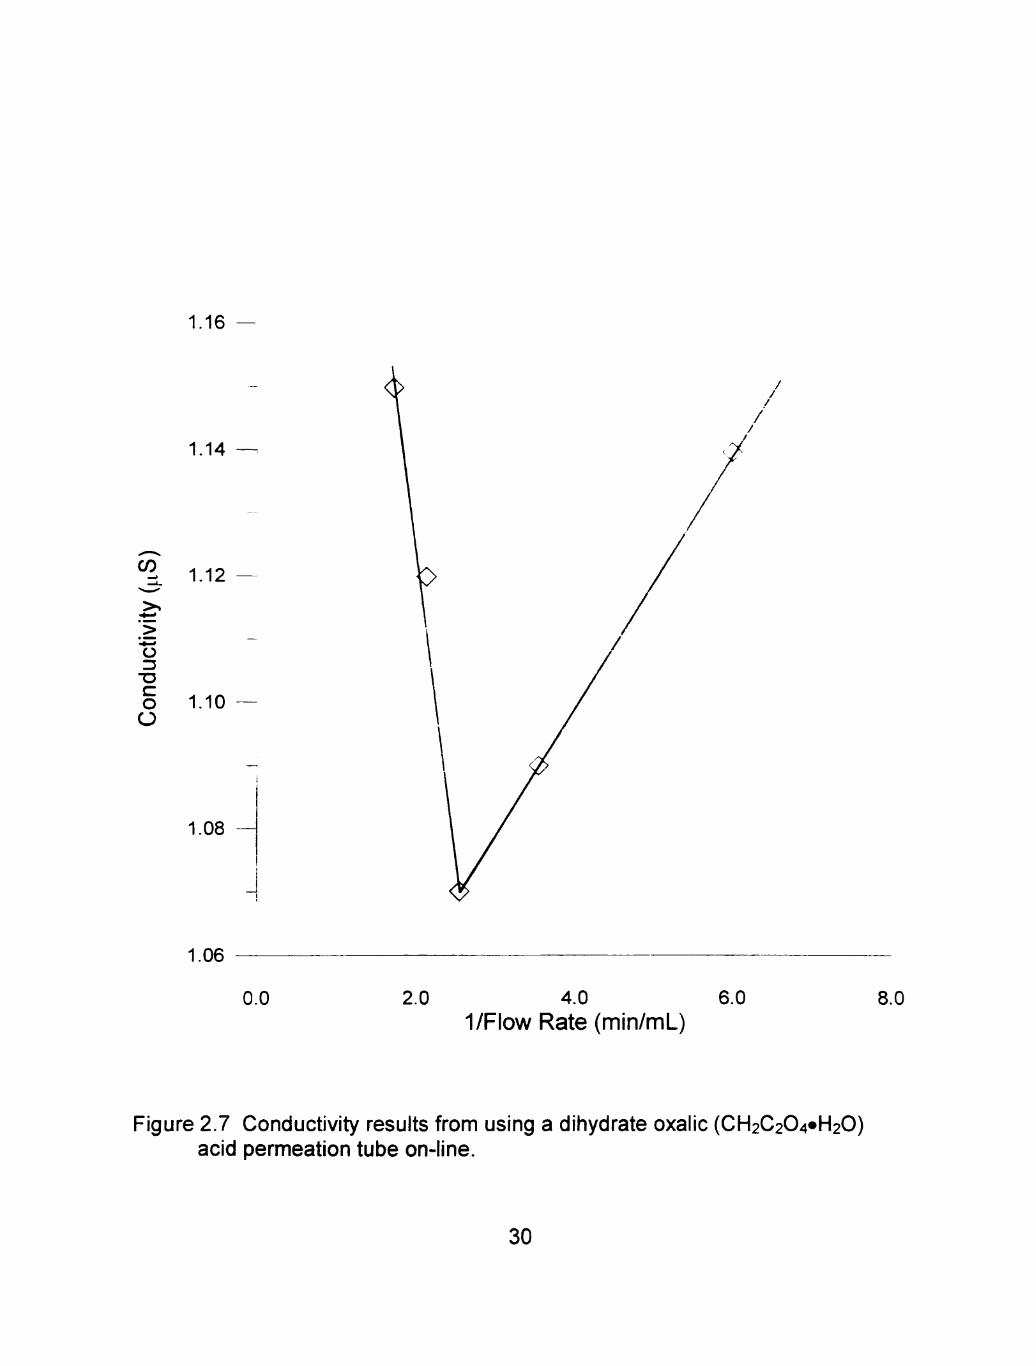
From previous results with oxalic acid, it was decided to utilize hydrated
oxalic acid in thin walled Teflon tubes to obtain desired acid permeation rate of
approximately 0.70 fimol/min. By varying the flow rate of the 55 ppm polyol
sample, the expected pattern of a conductance minimum as a function of flow
rate was indeed observed. However, the quantitative reproducibility of the
results in repeat runs was found to be poor (Figure 2.7).
New permeation devices were made with anhydrous oxalic acid. Oddly,
we found to our surprise that the system did not work at all. The permeation rate
of the anhydrous H2C2O4 was found to give very low conductivity readings and a
low permeation rate when compared to that observed for the dihydrate. At this
19

time, it was discovered that when the H2C204»2H20 was used as the filling
material, substantial internal pressure was generated at 110°C due to water
present. This led to the rupture of the permeation tube seal; this was not
perceived in the initial experiments. Thus, when H2C204»2H20 was used, the
acid vapor actually came out through a physical aperture rather than permeation
through the wall. The irreproducibility originated in the shut down and start up
process. As the system is turned off, the cooling causes a partial vacuum to
develop inside the tube and in turn causes the polyol to be drawn into the interior
of the tube. The change in composition of the internal solid causes a change in
emission rates when the system is restarted.
A stainless steel cylinder was machined and constructed to hold H2C2O4.
The system was designed to have the polyol flow over the surface of a PTFE
tube, which was connected to the cylinder and served as the permeating surface.
Every time this set-up was put into operation, the PTFE tube or Its end seal burst.
Closer examination indicated that at elevated temperatures, the H2C2O4 attacks
316 grade stainless steel. Thermodynamically driven by the stability of the
oxalate complexes of iron and nickel, the metal dissolves and hydrogen is
produced.
M(Fe, Ni) + nH2C204 -^ M(C204)n ' " + nH2 (2.2)
where n= 2 or 3. The pressure of the evolved hydrogen was too great for the
PTFE tube to contain. Due to the above mentioned difficulties, no further
experiments with permeation devices were conducted.
20
Gaseous Acid Introduction
We next attempted to introduce gaseous HCI from a lecture bottle directiy
into the polyol stream through a precision regulator designed to handle HCI.
Permeation tubes can suffer from reverse permeation by water and have an
output too low to be useful. These problems can be potentially obviated with
gaseous acid introduction. The challenges of working with the anhydrous HCI
gas, however, turned out to be formidable. Aside from the toxicity of the
anhydrous HCI gas, the equilibration times upon startup were long and HCI input
rates were inconsistent. The ability of system components to withstand the
working pressure was an issue. It was not possible to reproduce any experiment
and it seemed impractical to pursue this fijrther. With a mass flow controller to
regulate the HCI input, however, this scheme may still be practical.
Acid-Alcohol Solution Introduction
It was decided that the use of a liquid reagent would be acceptable as
long as the consumption of the reagent and the needs for replenishment were
both low, so as to fulfill the initial system requirement of low maintenance.
The first sample of polyol containing 55 ppm KOH was exhausted at this
time and replaced with a polyol sample containing 87 ppm KOH. Although this
batch supposedly contained a greater concentration of KOH than the first
sample, the conductivity of the polyol was in the same range of 1.14 to 1.20 |iS
as the previous polyol sample containing 55 ppm KOH. Further, with the 87 ppm
KOH polyol sample, it was difficult to observe the conductance minimum. It was
21

clear, then, that this technique would not be a generally applicable procedure.
Since it was difficult enough to measure the KOH concentration at this range, it
did not appear likely that low levels, 1 to 5 ppm KOH concentrations in polyol
could be measured at all.
A caveat is in order about the applicability of conductivity detection for
KOH analysis, however. Initially, we were not careful about restricting CO2
intrusion into the polyol sample. Conversion into carbonate, which may be pooriy
ionized, may have contributed to our difficulty.
22

References
1. Skoog, D. A., J. J. Leary. Principles of Instrumental Analysis, 4* ed. Fort Worth, TX: Saunders College Publishers, 1992; pp. 548-549.
2. Skoog, D. A., D. M. West, F. J. Holler. Fundamentals of Analytical Chemistry, 7^^ ed. Fort Worth,TX: Saunders College Publishers, 1996; pp 712-713.
3. Lange's Handbook of Chemistry, M^^ed. J. A. Dean, Ed. New York, NY: McGraw Hill Book Company, 1979; pp 6-34, 6-35.
4. Curtis, M. A. Shahwan, G. J. LC-GC Mag. 1988, 6, 158.
5. O'Keefe, A. E.; Ortman, G. C. Anal. Chem. 1966, 38, 760.
23
30
20 CO
• >
o O
10 —
0.0 2.0 4.0 6.0 1/Flow Rate (min/mL)
8.0 10.0
Figure 2.1 Theoretical conductivity results plot for a 50 ppm KOH polyol sample titrated with acetic acid, assuming full ionization.
24
N2 Polyol
Peristaltic Pump
GC Oven
Cu Coil CD
waste
Figure 2.2 System configuration with acid penneation devices. CD represents conductivity detector.
25

BOTTOM VIEW TOP VIEW
.504"
I 1.048" 1
SIDE VIEW
^ ^ ^
& ^ ^
Teflon seal
Figure 2.3 Schematic of conductivity detector.
26

N2 Polyol
^ -o
T
HCI
G C Oven
CD Cu Coil
waste
Figure 2.4 System configuration with acid gas introduction. CD represents conductivity detector.
27
valve union
^
rC
fused silica
capillary T^—
GC Oven
synnge pump
cross
reagent "^o^r
N2
Cu Coil
CD
waste
polyol
Zenith gear
pump
Figure 2.5 System configuration with acid alcohol solution reagent. CD represents conductivity detector.
28
600
500 H
CO
•B 400 o 3 •D C o O
300 —
200
0.0 1.0 2.0 3.0 4.0 Oxalic Acid Concentration (mN)
5.0
Figure 2.6 Conductivity results from mixing oxalic acid in ethanol with 55 ppm KOH in polyol.
29
1.16
1.14
CO 1.12
o i :
•o c o O
1.10
1.08 —
1.06
0.0 2.0 4.0 6.0 1/Flow Rate (min/mL)
8.0
Figure 2.7 Conductivity results from using a dihydrate oxalic (CH2C204«H20) acid permeation tube on-line.
30

CHAPTER III
REVERSE FLOW INJECTION WITH
COLORIMETRIC DETECTION
Introduction
A common detection method for flow analysis is optical absorbance. An
attractive alternative to conductometry is the versatility of absorbance detection
to follow the titi-ation of KOH in polyol. The availability of light emitting diodes
(LED) as inexpensive, long life, low noise, high brightness, monochromatic light
sources are well suited for use in this application. LED based flow-though,
optical absorbance detectors have been reviewed by Dasgupta etal. in 1993.
If a proton-insensitive dye (e.g., methylene blue) is mixed with the polyol, it
is apparent that the absorbance of the final mixture will increase with increasing
mixing ratio of the dye. In the system described in this chapter, all dyes are
proton sensitive, yellow in acid form and blue in basic form. In all of the flow-
staircase experiments described, acid accompanies the indicator dye. In the
injection experiments, the indicator dye is accompanied by acid for high KOH
concentration analysis only. Low concentration KOH analysis is performed with
the presence of the indicator dye alone.
In this chapter, a simple, one-reagent single-line colorimetric reversed Fl
technique that consumes a few microliters of the reagent per analysis is
presented and described. The experiments that led to the development of the
successful KOH analyzer are herein discussed.
31
Experimental
Chemicals and Reaoents
Polyether polyol samples were supplied in 1 gal. capacity hermetically
sealed drums ((Voranol®, Dow Chemical Co., Freeport, TX). The KOH content of
these samples was determined at Dow by potentiometric titrimetry in aliquots
drawn in parallel. The flow-staircase experiments were conducted with an 87
ppm KOH polyol sample. A set of six blind samples was shipped from Dow. The
concentrations of these samples were revealed by Dow after laboratory
experiments were performed. The concentrations of these blind samples (T55,
T24, T11, T23, T10 and T54) were 2.7, 2.8, 5.3, 33.1, 42.5 and 85.1 ppm KOH,
respectively. Plug injection experiments in this work were conducted with polyol
samples containing 1.5 ppm (polyol A) and 119 ppm (polyol B) KOH;
intermediate concentrations were generated from these. A neutral polyol sample
(passed through a mixed bed ion exchanger) was also used in some
experiments. Exposure of the polyol samples to atmospheric C02was avoided.
The container cap was modified to provide for a sample exit line (that goes to the
bottom of the container) and an aperture to provide for a 2 psi Nitrogen blanket
(filtered through a soda-lime cartridge). Both lines were metallic to eliminate
permeative CO2 intrusion. Polyol samples used for plug injection experiments
were opened and the operating cap installed in a glove bag under nitrogen.
Flow-staircase experiments utilized a reagent solution composed of
bromothymol blue (BTB, 120 mg) and HCI (20 mmol) in 100 mL of 2-propanol.
32
Bromothymol blue, bromocresol green (BCG), and bromophenol blue (BPB) were
all fi-om ACROS (all in tiie free acid fonn). ACS grade 2-propanol (2-PrOH) was
used as solvent. For the determination of 1.5 to 20 ppm KOH, a solution of 6.997
g of BCG per L of 2-PrOH (nominally 10 mM) was used For the detemiination of
20 -120 ppm KOH, the indicator solution contained 10.508 g BCG (nominally 15
mM) and 50 mL 1.0 M aqueous HCI per L of 2-PrOH. Indicator solutions were
kept in a dari< container provided with a liquid exit tube and provided with a soda-
lime filtered 2 psi niti-ogen blanket.
In plug injection experiments, for exact flow ratio measurements during
sample blending to obtain intermediate concenti-ations (vide infra), polyol B was
doped with Magdala Red (Pfaltz and Bauer, Stamford, CT) an intensely
fluorescent base-insensitive dye ({/^^ max 540 nm, /.em, max 570 nm). A dye
concentration of 0.41 mg per L polyol was used.
Instrumental Arrangement
Flow-staircase Experiments. The experimental configuration is shown in
Figure 3.1. A Zenith gear pump was used for pumping at 2% of its rated
maximum flow rate which was measured to be 1.04 g/min (1.0 mL/min). The
reproducibility of the pump under this situation has been found to be r 2.5%.
Most pumps do not provide optimum reproducibility and accuracy at the limits of
their operating range. Further, the reproducibility of the entire measurement
process is directiy and lineariy dependent on the reproducibility of the pump.
Nevertheless, this pump worked better and more reliably than previous pumps.
33
The pump output proceeds to a %-28 threaded cross fitting. One port of
the cross is connected to a pressure transducer to read the system pressure.
The third port of the cross is connected to the indicator delivery pump (model
50300 syringe pump equipped with a 48000 step stepper motor, an integral
automated aspirate/dispense 3-way valve and a 500 juL capacity glass syringe,
Kloehn Inc., Las Vegas, NV) via a union fitting connecting the 1.5 mm o.d. x 0.5
mm i.d. PEEK tubing from the syringe pump to a fused silica capillary (100 ^m in
internal diameter, 6 cm long). The small aperture of the capillary minimizes the
diffijsive bleeding of the Indicator into the flowing polyol stream. The operation of
the syringe pump is controlled by an IBM ThinkPad 560 laptop PC through its
RS-232 port using vendor-supplied software. Once programmed, the pump
protocol resides in the pump memory, leaving the PC free for other tasks. All
other interconnecting tubing in the system was polytetrafluoroethylene (PTFE).
The output port of the cross is connected to a 0.027" i.d., 0.069" o.d. PTFE
tube that proceeds to a heated enclosure maintained at 110°C (to simulate
process conditions). A gas chromatograph oven (Shimadzu GC-8A), modified to
a minor extent, was used for the purpose. The stream proceeds through a
serpentine II style, open tubular mixer (0.69 mm i.d., 1.8 mm o.d. PTFE tube, 1
m long, woven on a grid spacing of 2.0 mm), followed by a packed bed mixer (4 x
50 mm, filled with 1.0 mm dia. glass beads, with a glass wool plug as the
retainer). The mixers help the mixing of the streams and also helps the
attainment of thermal equilibrium. The mixed stream proceeds through a 2 x 2
mm internal cross section rectangular glass tube that constitutes the optical cell.
34

Since the performance of either LEDs or photodiodes degrade considerably with
increasing temperature, optical communication with the cell was carried out with
a pair of 1 mm core high numerical aperture Teflon clad fused silica optical fibers,
each across the cross section of the glass tube on opposite sides. The optical
fibers lead out of the oven and provide the means for optical detection. The
conduit volume from the cross to optical cell is 1.5 mL.
A 605 nm LED was put in LED holders (machined in-house) that allow for
the connection of optical fibers to the LED. A short length of optical fiber
connects the bottom of the LED to a silicon photodiode located on the detector
electronics board, this photodiode serves as the reference detector. The fiber
connecting the emitting face of each LED proceeds to the cell in the oven and the
return fiber from the cell is connected to a second silicon photodiode. The
reference and detector diode photocurrents from each detector are fed to a log-
ratio amplifier (LRA) each. This directly provides absorbance output (1V/AU)
with significant offset capabilities. The specific LRA device used was of older
design, based on hybrid monolithic integrated circuits (757N, Analog Devices)
that are considerably more noisy than devices presentiy available.^
Due to the internal volume of the Zenith pump, morning startup time
consisted of flushing the pump for one hour. A plug of indicator was injected to
prepare the syringe pump for use. Flow-staircase programs were initiated as
quickly between runs as possible.
Injection Experiments. The experimental configuration is shown
schematically in Figure 3.2. Once experiments required the blending of two
35

different samples to yield intermediate KOH concentrations, the Zenith pump was
impractical for several reasons. The pump was already being pumped at 2% of
its rated maximum and so the flow rate could not be lowered to generate the
intermediate flow rates. We attempted to use the Zenith pump as the pump to
regulate the total flow; however, the internal pump volume was so great that the
internal turnover time after any flow alteration was at least one hour. Therefore,
peristaltic pumps were used for pumping. Pump 1 (PI, Minipuls 2, Gilson
Medical Electronics) has a fixed flow rate of 1 mL/min. The input to it is partly
supplied by pump 2 (P2, Model XV, Alitea USA) pumping polyol B (flow rate < 1
mL/min) and the balance, consisting of polyol A, is drawn through a V4-28
threaded tee fitting T. The KOH content of the polyol ultimately delivered by PI
is thus increased or decreased by increasing or decreasing the flow rate of P2.
PharMed pump tubing (Norton Performance Products) was used in both
peristaltic pumps (internal-external diameters: 1/16"-3/16", 1/32"-5/32" for P1 and
P2, respectively). For all experiments, the exact ratio in which polyols A and B
were blended was determined by fluorescence measurements of the mixture
produced by PI (either at the exit of PI or more commonly at the system exit)
from a knowledge of the fluorescence intensity of sample B itself, and a
calibration curve relating the fluorescence intensity of sample B when diluted in a
known manner by undoped polyol. Fluorescence intensities were measured with
a spectrofluorometer {Xex= 540 nm, Xem= 570 nm, RF 540, Shimadzu Scientific).
The PI output proceeds to a %-28 threaded cross fitting C. Syringe
pump, pressure transducer, oven and connection components as described in
36
the previous section have remained the same. The polyol stream enters the
oven and proceeds through a stainless steel passive mixer MX consisting of
intertwined helices (Koflo®, P-04669-52, 6" long, 3/16" OD, 0.13" ID, 21
elements, Cole Parmer, Inc.).
The mixer effluent proceeds through the flow-through optical absorbance
detection arrangement (FC) to waste. The conduit volume from C to FC is 1.1
mL. Details of the detector cell arrangement are shown in the inset of Figure 3.2.
The optical cell is a square cross section glass tube of 2x2 mm internal
dimensions. The glass tube termini (especially the inlet) are flame treated to
provide a circular cross section. This reduces dispersion and improves
reproducibility. The glass tube passes through holes drilled for the purpose into
each of two %-28 threaded male-male unions made from PEEK; each constitutes
a separate detection cell. The glass tube itself is connected to entry and exit
tubing via %-28 threaded unions. 0-rings are utilized to assure a positive seal.
A machined fltting allows the placement of two pairs of 1 mm core high numerical
aperture Teflon clad fused silica optical fibers. The optical fibers are opposite
each other across the cross section of the glass tube.
In addition to the 605 nm LED previously discussed, a 436 nm LED used
to monitor the yellow, acid form of the indicator solution, was also installed. The
set-up was identical to that described for the 605 nm wavelength. The 436 nm
detection scheme was installed first on the optical cell with the 605 nm LED
immediately following. The only modification was to the detector photodiode, the
light input was filtered with colored plastic filters (#809 and #859 for the 605 nm
37

and the 436 nm LEDs, respectively, Edmund Scientific, Barrington, NJ) to
minimize cross talk between the two detection photodiodes.
At the beginning of each day, the system was allowed to equilibrate for 20
min prior to indicator injection. A minimum of 6 injections, 6 minutes apart, were
made at each P2 setting; 10 min was allowed for equilibration with every change
of P2 setting.
Data Acquisition and Processing. The detector outputs are sent to a
PCMCIA type data acquisition card (PCM-DAS16D/12, Computerboards,
Middleboro, MA) and collected and displayed by vendor-supplied software (DAS
Wizard), that runs as a subprogram in Microsoft® Excel. The same PC used to
program the syringe pump is used for data acquisition and processing.
Water Saturation Device. The water content of a polyol sample was
increased by pumping the sample through a water saturation device. Nation®
tubing (wet dimensions ~0.8 mm i.d., 1.2 mm o. d., 330 mm active length) was
housed in a tubular PTFE jacket (4.2 mm i.d., ~330 mm long) with a tee fitting at
each end. Connections to the Nation tube were made with PTFE tubes inserted
therein, with Kevlar® thread ties atop. These tubes exited through the straight
arms of each tee and provided the means of maintaining a flow of water through
the Naflon tube, pumped by an independent pump. The water flow rate Is not
critical. The polyol sample flows through the Teflon jacket, around the Nafion®.
The Nafion® tube was converted to the potassium form prior to use. When used,
the device was inserted between the output of PI and cross C. Polyol samples
38

were collected before and after the water saturation device. The water content of
these samples were determined at Dow Chemical by Kari Fisher titration.
Results and Discussion
Flow-staircase Experiments
In this system (Figure 3.1), the dye is proton sensitive (yellow in acid,
which has almost no absorbance at the 605 nm detection wavelength, and turns
blue in base). The dye solution is accompanied by an acid. As the mixing ratio
of the dye increases, the observed absorbance increases as long as the added
acid concentration remains insufficient to neutralize the base present. When the
base is fully neutralized, the dye is converted to the acidic, non-absorbing form
and the absorbance drops abruptiy, even though more dye is being added.
With the many samples provided by Dow, it was observed that in a typical
experiment, the results may be less than perfect. A representative result is
shown in Figure 3.3 for a polyol sample containing 87 ppm KOH. In the
continuous programmed run with a sample containing 87 ppm KOH that lasted
an hour and a half, the results, demonstrate all the vagaries of the setup. In this
case, the pump was programmed to run for 10 minutes at each flow rate, which
were every integer value between 1 and 9 ^L/min, and then switch abruptiy to the
next higher flow rate. During these experiments, the automated switching valve
used in the current setup had not been installed. An inlet check valve and an
outiet capillary were used to prevent the ingress of the polyol solution into the
syringe pump during the refill stroke. However, the data indicate that at low flow
39

rates, notably 1 iL/min, the inlet check valve did not seal and actually no reagent
was delivered to the system. The incorporation of the switching valve since this
time eliminated the problem.
The rest of the data, up to a flow rate of 6 iL/min, shows plateau
absorbances that bear a linear relationship with the programmed syringe flow
rate, when the small inadvertent zero shift of the detector at ca. 27 min is taken
into account. Subsequent to this, the detector was redesigned to have the
photodiodes all placed inside of the electronics box to eliminate the problem with
zero shifts caused by environmental conditions. Between the 6 and 7 iL/min
steps, the absorbance decreases. The 7 ^L/min step itself shows two different
plateaus, with a negative glitch in between. The important point is that although
the absorbance starts decreasing between 6 and 7 iL/rnin, it does not have the
abrupt absorbance drop we originally expected from an acidic solution. Even at
the flow rate of 8 {xL/min, a small residual absorbance remains. After 9 |iL/min
(data at higher flow rates not shown), there is no further decrease in absoriDance.
In other repeated experiments, the step G provided a simple plateau without the
negative glitch. The cause for the stepwise, rather than an abrupt decrease in
absorbance may be due to the formation and titration of carbonate due to CO2
intrusion into the polyol sample. Since that time, great care has been exercised
to the handling of the polyol drums in the laboratory to prevent any CO2 Intrusion.
This was accomplished by bringing the polyol sample drum on-line under a N2
40
blanket. Henceforth, the endpoint of the titration was taken to be the flow rate at
which there is no further decreases in absorbance with increasing flow rate.
A note on the graph in Figure 3.3 is that the syringe pump stops at -90
min and in the absence of the acid, the base containing polyol rapidly chases the
remaining tail of the injected dye. Thus, the absorbance increases sharply
before the dye is washed out of tiie system. It is important to note tiiat during a
routine ramped titration run, it is not necessary to run through the entire flow rate
range but rather concenti-ate on the range of interest with increased flow step
resolution.
Experiments were repeated with higher syringe pump flow resolution over
a limited range with the polyol sample containing 87 ppm KOH. Results indicate
that no further change in absorbance occurs after a titi-ant flow of 7.4 |iL/min.
This value corresponds to a KOH concentration of 86.2 ppm, after accounting for
the density of the polyol. This value is in close agreement with the nominal value
of 87 ppm supplied by Dow.
It was possible with three of the six blind samples supplied by Dow to
determine the concentration by utilizing the above mentioned ramping method.
With higher resolution reagent delivery, the flow rate at which no further
absorbance decrease for sample T54 occurred at 4.1 jiL/min of a 2 mM BTB, 200
mM HCI solution yielding a concentration of 48 ppm KOH. The other two
samples, T23 and T10, required 3.3 and 9.6 ^L/min,respectively, of a 2 mM BTB,
50 mM HCI solution, therefore, determining that samples T23 and T10 contain
9.6 and 28 ppm KOH, respectively. The concentration values supplied by Dow
41
Chemical for T54, T23 and T10 were 85.1, 33.1 and 42.5 ppm, respectively.
Though it is obvious that these values are not similar, it does yield more general
information that the concentration of T54>T10>T23.
With the last three blind samples (T11, T55 and T24), it was found that
with any BTB added (even without any acid present) the polyol remained in the
yellow acid form sample. These samples obviously contain less base than the
samples where addition of BTB to the polyol renders the indicator blue. It was
believed at this time that a possible explanation was that the effective pKa of BTB
is much higher in the polyol medium than that observed for the indicator in
aqueous solution. This would require a significant amount of base to convert
BTB into its blue di-anion form. Examination of pKa values in polyol is explored
in the next section of this chapter.
Qualitative experiments were conducted with structurally (and
spectrophotometrically) similar indicators such as bromocresol green (BCG, pKa
4.68 in water) and bromophenol blue (BPB, pKa 3.85 in water). These are
stronger acids than BTB. The results for the simple addition of the indicators into
the polyol samples are shown in Table 3.1. It is apparent that more acidic
indicators are able to sense the base in these samples and further, the order of
KOH content is T11>T55>T24.
42

Injection Experiments
Considerations on an Indicator-Based Optical Detection Method. At first, it
may seem that an indicator-based method relies on quantitative hydroxide ion
induced conversion of the yellow indicator monoanion to the blue indicator
dianion. With the indicators studied, that is what would be expected in water. To
practice such a scheme, it is necessary to have large indicator concentrations to
avoid an indicator-limited situation. Further, even in the absence of a base, the
blank response from indicator injection may be significant due to indicator self-
ionization. In addition, as in the conductometric scheme described in Chapter II,
it is desirable to avoid waste generation by directing the analytical system waste
back to the process stream. This is practical only if the total amount of indicator
introduced remains very small.
The pKa values for BTB, BCG and BPB in water are respectively 7.10,
4.68, and 3.85."* It is interesting to look at the predicted response behavior if the
medium was water and the choice of indicators extended to much weaker acids.
We assume an injected HIn concentration of 0.01 M, a dispersion factor of -30
(such that at the peak maximum the total indicator concentration [ln]T is 3.33 x
10^ M), a molar absorptivity for In' of 4x10^ and an optical path length of 2 mm.
The response behavior is solved by iteratively solving the charge balance
equation:
[Hi + [Kl - Kw/[H1 - [InT = 0 (3.1)
where
[In! = [ln]TK,n/([Hl + Km). (3.2)
43
The absorbance due to In' is then computed from Beer's law. The results are
shown in Figure 3.4. It is obvious that better results are obtained with indicators
that are relatively weak, although too weak an indicator may lead to poor
sensitivity. A compromise situation is obtained with pKm 12, there is good linear
behavior and decent sensitivity. The lower pKm indicators reach saturation too
rapidly. Note that the indicator concentration is <5% of the maximum KOH
concentration used in these simulations.
In a polyol medium, the solvent autoionization constant, as well as the
indicator dissociation constants, are bound to be much lower than in water
(although the relative order of ionization among the indicators should be
consistent). BTB, BCG and BPB have similar spectral properties. The same
detection system can be used to rapidly test which (if any) of these indicators will
provide for a feasible determination method. The availability of LEDs emitting at
wavelengths suitable for monitoring the blue indicator di-anion absorption and
their ready adaptability to construct fiber optic based absorbance detectors were
also attractive.
Mixing and Pumping Issues. Laboratory experimentation with polyol
systems under simulated process conditions raise some significant problems. It
is troublesome to maintain a large polyol storage container at an elevated
temperature; also, most pumps cannot be housed at 110°C. On the other hand,
at room temperature, the viscosity of the polyol is 50 cP, making it extremely
difficult for a reciprocating type, high-pressure liquid chromatographic pump to
44

refill property. Refilling with a viscous liquid is also a major problem with any
syringe type pump.
Achieving mixing homogeneity and the choice of a pumping method are
interrelated issues. Due to the high viscosity of the medium, the mixing element
is critical for efficient mixing and for reproducible dispersion of the injected
indicator. Initially, a modified serpentine-ll style mixer (0.69 mm i.d., 1.8 mm
o.d. PTFE tube, 1 m long, woven on a grid spacing of 2.0 mm) in series with a
packed bed mixer (4 x 50 mm, filled with 1.0 mm dia. glass beads with glass wool
plugs as retainer) was used as a mixer. Although none of the mixers could
individually achieve the desired degree of mixing, they were adequate in series.
However, the pressure drop was significant and the only usable pumps were
gear pumps. Smaller laboratory type gear pumps simply did not work reliably at
the desired flow rate regime of 1 mL/min. The Zenith gear pump (described in
the experimental section underflow-staircase experiments) could achieve a
stable flow rate of 1 mL/min and was used for generating much of the initial data.
However, it was impractical to use two such pumps to create polyol blends of
varying KOH content (as described in the experimental section) due to the
difficulty of reducing flow rates further. Moreover, even when such samples were
created by manual off-line blending, each sample change at the pump input
required extraordinarily long times for a stable output composition due to the
pooriy swept and significant pump head volume.
Search for alternatives led us to the helical mixer. This allowed adequate
mixing of the stream at the desired flow rates used in the system and with
45
negligible pressure drop (< 5 psi at 1 mL/min) that allowed in turn the use of
peristaltic pumps. Compared to poly(vinyl chloride) type pump tubing, Pharmed®
tubing exhibited longer lifetime with minimal changes in flow rate for use with the
polyol. We opted, nevertheless, to measure each blending ratio by fluorescent
dye doping as described in the experimental section, rather than relying strictiy
on the pump settings.
Detection and Detector Arrangement. Monitoring at a single wavelength
that corresponds to the absorption of the blue indicator di-anion is adequate for
the determination itself It Is simple, however, to implement measurement at
other wavelengths. Multiwavelength measurement would be of considerable
benefit in diagnosing instrument malfunction such as fouling of optical windows,
proper injection of the indicator etc. Given the current cost and ease of
implementation of PC card based photodiode arrays, the optimum choice for an
actual process instrument will likely involve such a detector, in conjunction with a
stable broadband light source (e.g., a flash lamp or a white LED). Monitoring at a
second wavelength can provide the flowing information:
a. An indication of cell fouling (when both, rather than just one detector,
shows decreased light throughput); this may not, however, represent a
particular problem with polyols - in more than year-long experiments
with such systems we have not experienced an occurrence of cell
fouling;
b. Positive evidence that the indicator has been injected and in the right
amount.
46

The choice of the two individual wavelengths is, of course, important. BTB,
BPB and BCG have similar (albeit not identical) spectra. The pH-dependent
spectra of BCG exhibit a broad absorption maximum around 615 nm for the blue
di-anion, an absorption maximum around 440 nm for the yellow monoanion, and
an isosbestic wavelength ( i) around 510 nm. An orange LED emitting at 605
nm serves adequately to monitor the di-anion. The choice of the second
wavelength is made complicated by the fact that blue form of the indicator also
absorbs in the yellow, this absorption having a maximum at 400 nm. Monitoring
at X\ will be the most straightforward. When the same amount of indicator is
injected (and the hydrodynamic properties, including flow rate that controls
dispersion remains constant), this signal remains constant, irrespective of the
[KOH]. However, at the time we undertook this study, an LED at this wavelength
was unavailable (more recentiy, green superiuminescent GaN LEDs emitting in
this desired region have become available' ). We chose instead a SIC based
emitter^ with a measured center wavelength at 436 nm. With a relatively wide
half bandwidth of -65 nm, the response firom this source was a combination of
responses due to the monoanion and di-anion forms of the dye. Thus, unlike the
605 nm detector, with this detector, indicator injection produces a response
regardless of the base content of the polyol. Monitoring the constancy of
indicator injection is admittedly less straightfon/vard at 436 nm than monitoring at
X\. However, for any given value of the 605 nm detector response, the value for
the 436 nm detector response is unique at a constant amount of indicator
injected and can thus be used for diagnostic purposes. The S/N was slightiy
47

worse for the 436 nm vs. the 605 nm detector at equivalent absorbances. The
former was therefore chosen to be placed first in the series so that it is subject to
less dispersion. The two detectors were separated by only 1.0 cm but with a
relatively large bore square tube, this led to a surprisingly large amount of
dispersion in the second detector as seen in Figure 3.5. While an inspection of
these data will indicate that injections can be made in this system every 4 min
without the second detector being affected by the previous injection, it is of
course possible to use the same cell for multiwavelengtii detection and thus to
make injections at more frequent intervals if desired.
It is also of interest to note in Figure 3.5 that the 605 nm signal, which
monitors the blue basic form of the indicator, shows two peaks for every injection.
A small and very sharp peak, similar in width to the peak in the 436 nm detector,
appears immediately prior to the larger absorbance signal. We initially
hypothesized that this smaller peak may be the result of the 436 nm LED light
finding its way to the 605 nm detector. As a result, when the 436 nm light is
attenuated by the colored polyol passing through the first detector, less total light
also reaches the 605 nm detector resulting in the observed first signal. However,
if this were really the case, this peak height should be lineariy related to the 436
nm absorbance peak height. In actuality this relationship is not at all linear. We
are unable to explain at this time the origin of the 605 nm satellite peak.
System Performance at Low KOH Concentrations. Using the
experimental system described, the response to indicator injections of different
compositions were studied for polyol sti-eams containing 0-20 ppm KOH. the
48
lowest nonzero value being 1.5 ppm. Water has limited solubility in the polyol;
aqueous indicator solutions are unsuitable for injection into polyol streams.
Initially ethanol was tried as the indicator solvent. However, due to bubble
formation problems in the hot matrix (only a limited amount of backpressure can
be tolerated with peristaltic pumps), all subsequent experiments were carried out
with 2-PrOH as the indicator solvent. Ten microliters of 2 mM solutions of each
of the three indicators were initially tried and did not produce satisfactory results.
Using a 10 mM solution of BPB (10 fiL injected at 8.33 ^Us), the most easily
ionized of the three, as the indicator, very low levels of KOH could be easily
detected but indicator saturation occurred by 10 ppm KOH level. With, BTB, the
least acidic of the three, KOH concentrations below 15 ppm could not be
measured. BCG allowed for a usable measurement range of 1.5-20 ppm KOH.
Figure 3.6 shows typical system performance at 605 nm for 1.5 to 20 ppm
KOH. Figure 3.7 shows the data from two disparate runs (with ± 1 sd error bars
on each measurement, n=6) taken 2.5 months apart.
For a theoretical prediction of the above response, we invoke here the
Franklin-Marshall solvent system theory of acids and bases and assume that
both the proton and hydroxide are solvated by polyol (POH) to produce the
characteristic cation (P0H2^) and anion (PC) of the solvent. The charge balance
equation for a system containing the acid form of the indicator HIn, KOH and the
polyol can be written:
[POH2I + [KT = [POT + [In-] 3.3
49

where it is understood that K* and In'are likely also solvated by polyol. It is also
reasonable to assume that [P0H21 is going to be substantially smaller than [K^
at KOH concentrations of interest to us and can therefore be neglected. The
proton transfer reaction with the indicator itself can be written:
Hln + PO' = In'+ POH. 3.4
We define an equilibrium constant Kp
[lnl/([Hln][P01) = Kp 3.5
where Kp will be the analog of Km/Kw in water. Recognizing that the total
indicator concentration Cm is given by
Cm = [In-] + [HIn]. 3.6
We obtain
[PO'] = [ln1/(Kp(Cm - [Inl). 3.7
Putting eq. 37 into eq. 3 ^ (with [P0H21 neglected) results in the equality
[Kl - [lnl(l + 1/(Kp(Cm[lnl)) = 0. 3.8
Based on the best fit of all the data in Figure 3.7 and invoking a least squares
minimization routine, we compute the best fit value of Kp for BCG in polyol to be
-650. In water, this would correspond to an effective pKm of 11.2, suggesting
that the ionization of BCG is depressed by -7 orders of magnitude in polyol. The
corresponding predicted absorbance response is plotted in the form of the solid
curve.
50

System Performance at High KOH Concentration. An increase in the
injected indicator volume was attempted to cover the higher range. A linear
range of 15-85 ppm could be obtained with an injection of 30 ^L 10 mM BCG
(injected at a rate of 10.4 ^L/s). Since it was desirable to extend the upper linear
range to higher values, two alternatives were investigated. The first involved the
injection of an indicator solution both greater in volume and concentration than
those used in previous trials and the second involved the addition of a mineral
acid to the indicator solution. The second alternative was found to be superior. It
may be intuitive that when a mineral acid is added to the indicator reagent, the
base in the polyol will first react with the mineral acid before reacting with the
indicator. The response behavior of such a system is thus expected to be such
that there will be a littie or no response until a threshold KOH concentration is
reached and then a significant linear response region will be observed before the
indicator is saturated. In principle, such a system can be easily modeled
assuming homogeneous conditions. However, the experimental data indicate
that while a free acid and the indicator may be injected together, the effective
dispersion factors of the acid and the indicator are quite different. The proton
can probably move by charge tunneling in a hydroxylic solvent like polyol, similar
to what it does in water. Thus the proton will exhibit much more rapid dilution
(much greater dispersion factor) than a large indicator molecule. While a
quantitative model based on experimental conditions alone thus becomes more
difficult to establish, the results (open circles) in Figure 3.8 cleariy exhibit the
expected pattem. The range of KOH concentrations studied extends over the
51
entire range possible with the polyol samples available to us. In the low KOH
concentration range, the 605 nm response data form essentially a horizontal line.
However, the response assumes a non-zero slope at higher concentrations, and
a linear r value of 0.9949 is observed over the KOH concentration range of
interest, 19-119 ppm. Attainment of a plateau was not observed in these
experiments, this will require even greater KOH concentrations. (Note that it is
not simple to artificially dope the polyol with significant amounts of KOH because
if a small amount of high concentration KOH is added, the polyol begins to react
or oxidize in the immediate vicinity and the problem is exacerbated by the
considerable mixing time in this highly viscous matrix.) It appears likely that the
linear response range at 605 nm will likely extend well beyond the maximum
concentration reported here. The 436 nm detector response (shown magnified
by a factor of three for clarity) that appear in this figure as triangles, are fi-om
absorption by both the blue and the yellow forms. It is not flat at the low
concentrations and bears essentially a constant slope ratio with the 605 nm
response at higher concentrations. In conjunction with the 605 nm response, the
436 nm response can thus be used as a diagnostic tool for proper indicator
injection, etc.
Variation in Water Content. The water content of process polyol streams
vary in different parts of the process and can range from -0 .1% to -0.5%. If
variation within this range can affect the overall capacity of the solvent to support
protic ionization, the scheme may end up being affected severely by the water
52

content because the effective pK of the indicator will vary. This was therefore an
important factor.
Aside from the control run with a sample containing 0.13% water, water
was introduced into the flowing polyol stream with the water saturation device to
the extent of 0.33% and 0.39%. The presence of increased water content was
readily apparent experimentally. In the absence of any backpressure on the
detector cell exit, the samples of high water content had fi-equent bubble
problems due presumably to ebullition. The results are presented in Figure 3.9
and indicate that water content variation within the limits actually encountered
should not affect the reliability of the analyzer.
53

References
1. Dasgupta, P. K.; Bellamy, H. S.; Hanghui, L.; Lopez, J. L.; Loree, E. L.; Morris, K.; Petersen,K.; Mir, K. A. Talanta 1993, 40, 53.
2. Curtis, M. A. Shahwan, G. J. LC-GC Mag. 1988, 6, 158.
3. Jambunathan, S.; Dasgupta, P. K.; Wolcott. D. K.; Marshall, G. D.; Olson, D. C. Ta/anfa1999, 50, 481.
4. Dean, J. A., Ed., Langes's Handbook of Chemistry. New York, NY: McGraw-Hill, New York, 1986. 5-86.
5. Vithanage, R. S.; Dasgupta, P. K. Anal. Chem. 1986, 58, 326.
6. NSPG series, http://www.nichia.com/
7. http://www.cree.conn/products/led/led.htm
54
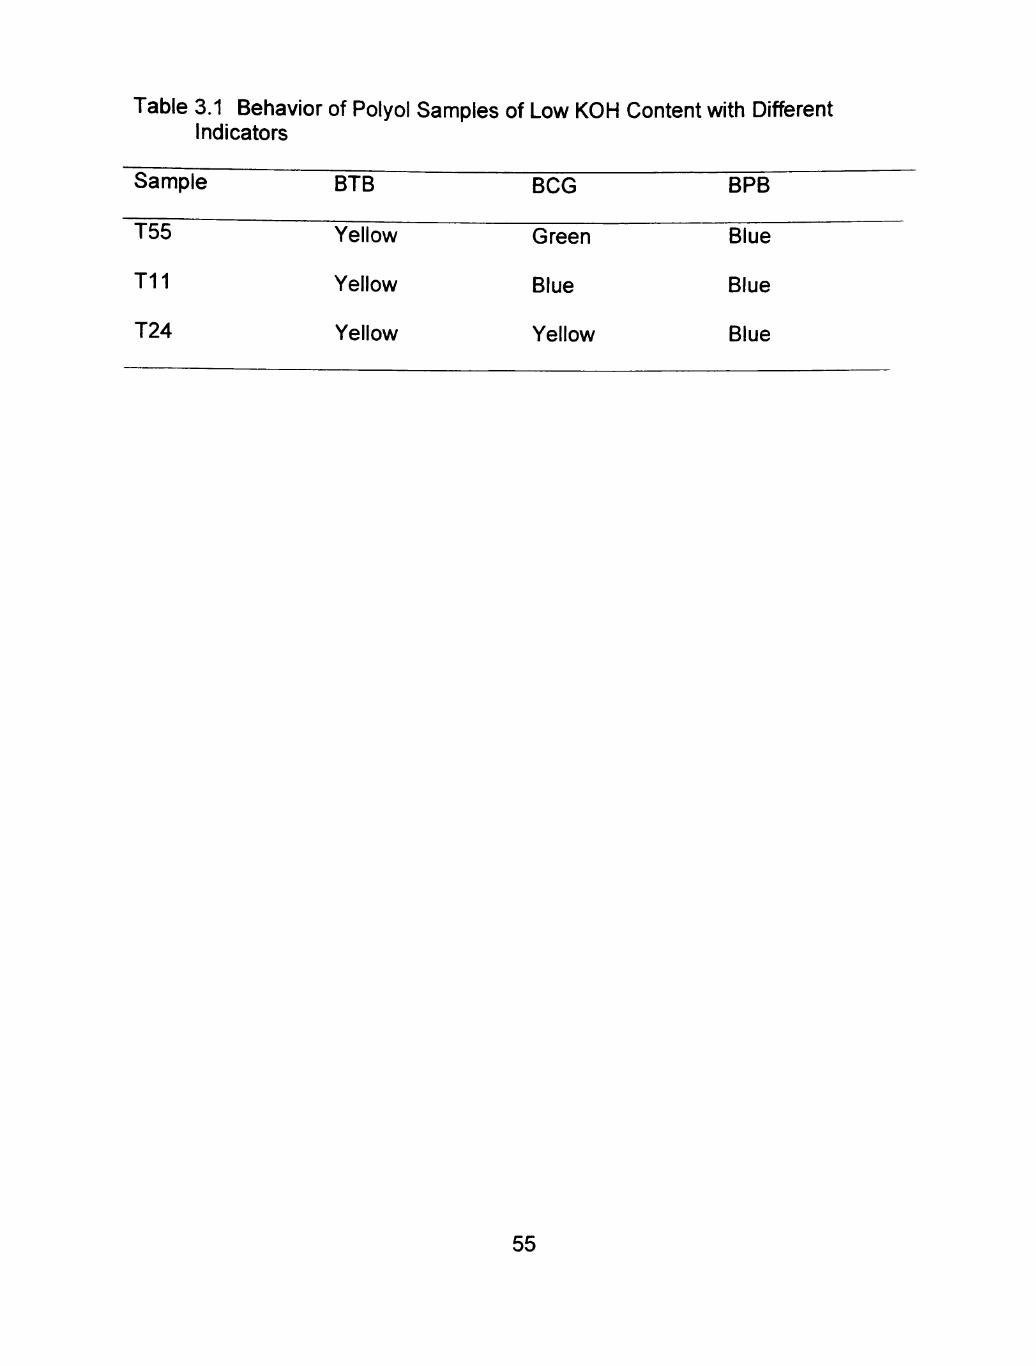
Table 3.1 Behavior of Polyol Samples of Low KOH Content with Different Indicators
Sample BTB BCG BPB
T55 Yellow Green Blue
T i l Yellow Blue Blue
T24 Yellow Yellow Blue
55

valve union fused silica
^piliary
GC Oven
r-^^
n syringe
pump
cross
reagent "^otor
N2
SM
PBM
OC FO
FO ^
waste
polyol
zenith gear
pump
Figure 3.1 Experimental configuration of flow-staircase experiments. FO = fiber optic, OC = optical cell, SM = serpentine II mixer, PBM = packed bed mixer, GC = gas chromatograph.
56

0
05
LU E
a> .Q 3
CO
O
O o U_ CD ^ ,
v ^ ^ ^
D LU
a I P s
O CO Ll_ - ^
UJ
Q E c
Ll_ - ^
(T
^ H
^ ^
o
o <
I-_J
o "o E a>
Q- 0
to c
c - 0)
Q. CO 0 = "O
Q-.2 •E " o (O O >:
0 C3)
CO-D-2
0 0 O CO ^ a»
-£ .OUJ
E - -~ <0 Q CD o LU o " c (o • • E . . O o
J - - ^ CO CL-S
§ = ° g ^ 0
' ^ ^ lU
i 16 C Q.LI-<U . . _ -
3 >-»- o
"co 0)" ^ C ^ O
— to « =
CO > u.
L L
57
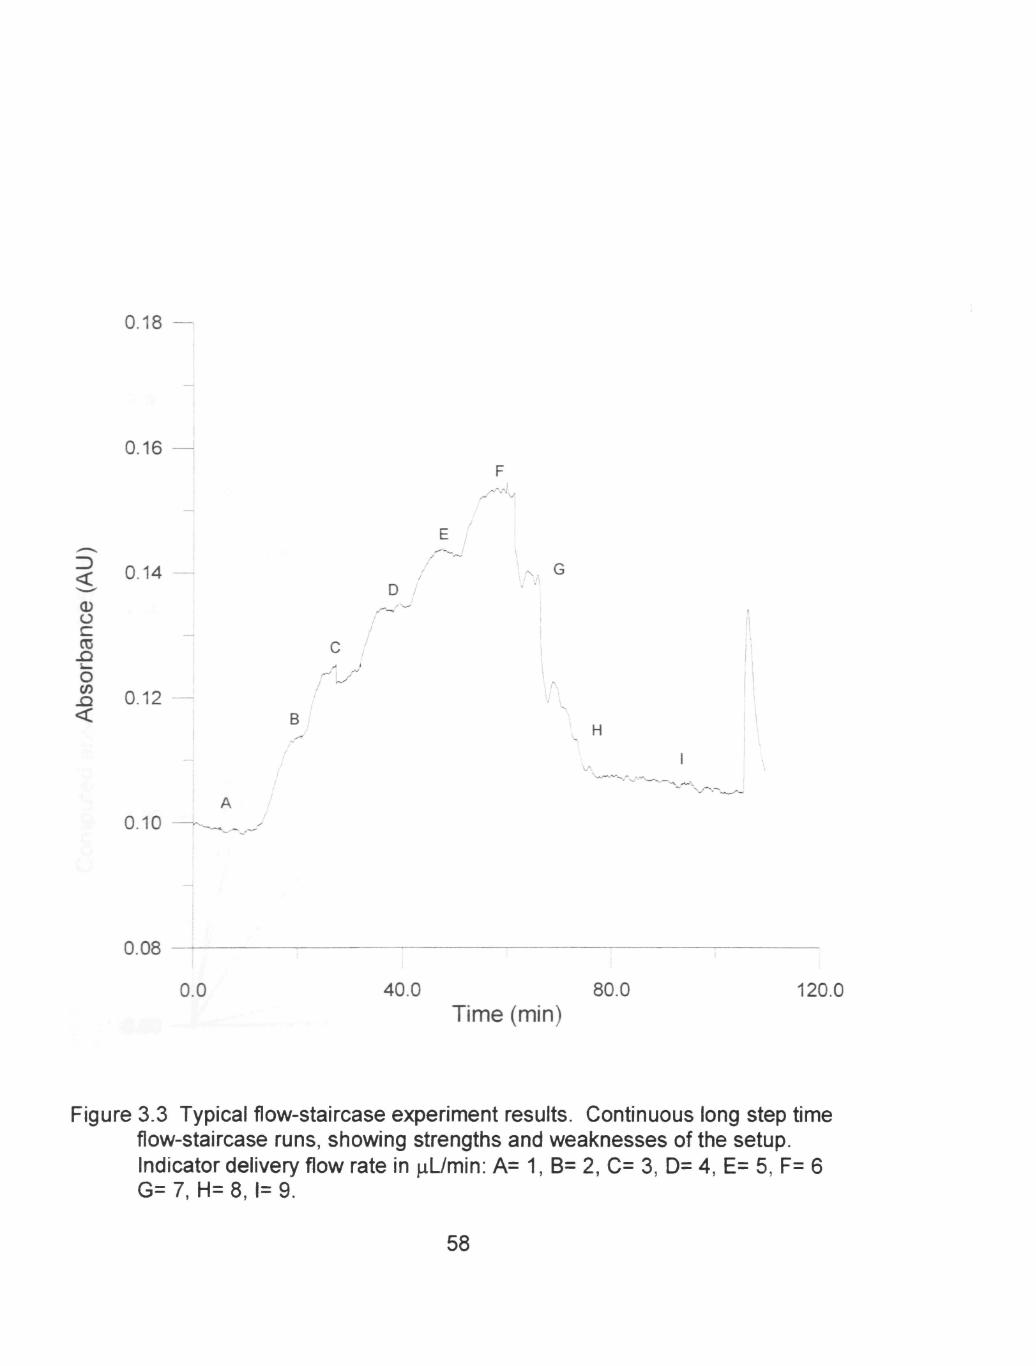
3 <
0) o c: (0
o
<
0.18
^
0.16
0.14
0.12
/ D /
/
/
y (
'l^'-'
,^ ' '
/ /
f\ K
H
0.10
0.08
0.0 40.0 80.0 Time (min)
120.0
Figure 3.3 Typical flow-staircase experiment results. Continuous long step time flow-staircase runs, showing strengths and weaknesses of the setup. Indicator delivery flow rate in iL/min: A= 1, B= 2, C= 3, D= 4, E= 5, F= 6 G= 7, H= 8, 1= 9.
58
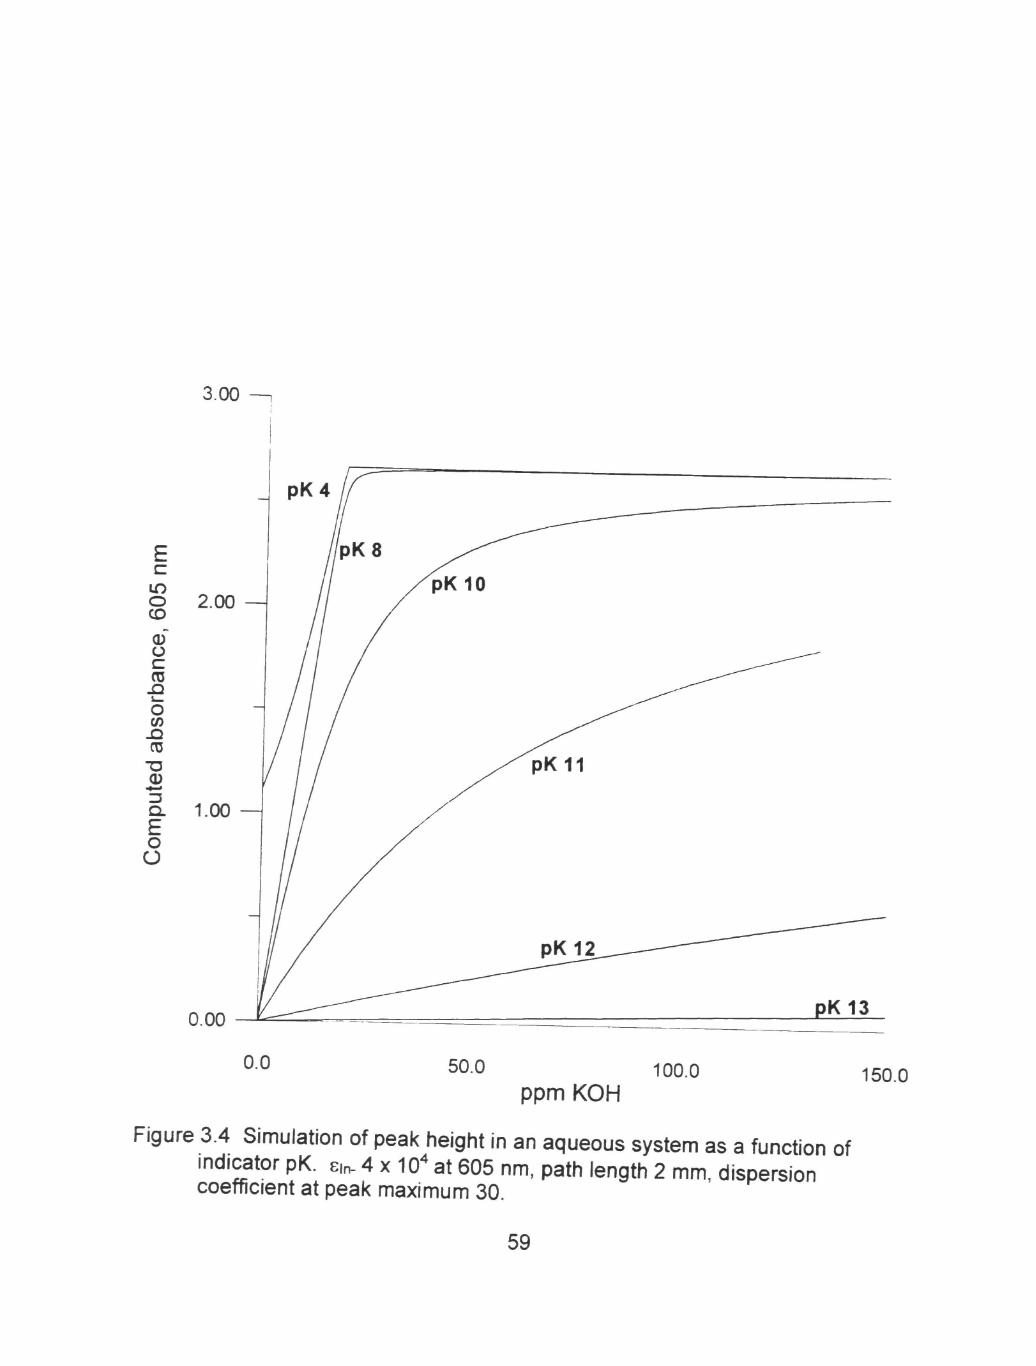
3.00
E c in o CD
(D
o c o CO (TJ
Q . E o O
2.00 —
1.00 —
0.00
0.0 50.0
ppm KOH 100.0 150.0
Figure 3.4 Simulation of peak height in an aqueous system as a function of indicator pK. e.n- 4 x 10^ at 605 nm, path length 2 mm, dispersion coefficient at peak maximum 30.
59

Figure 3.5 Typical system performance at 2.9 ppm KOH concentration.
60

20 min
H
.i II
! i ' 1 1 s ' H 1 1 ' i : ; i M • {••• B . ' • M i l I h '' i' U ' 1 ' ' '
Figure 3.6 Typical system performance for 605 nm wavelength using 10 [iL Injections of 10 mM BCG indicator with 6 minutes between injections. KOH concentration in ppm are A= 1.5, B= 1.9, C= 2.9, D= 3.8, E= 13.4, F= 15.9, G= 19.0, H= 21.2.
61

0.80
0.60
E c in o CD
<D O C (0 .a o CO
<
0.40
0.20
0.00
0.0 10.0 20.0 30.0 ppm KOH
Figure 3.7 Average peak height at 605 nm vs. KOH concentration for low-end analysis using 10 JLIL injections of 10 mM BCG. The two sets of data were taken 2.5 months apart. The error bars connote +/-1 standard deviation (n=6). The solid line constitutes a best fit to the model represented by equations 3.3-3.8.
62

(O c o
o
oS CO c D ) . 0
TO ^
c -o
TO C
0) r -
o "o **- c c c o cc
•^ o
" s O 1-c o o t
X 0)
o CM
o 00
o CD
o o
CO >
E c LD O CD
O X
o
aoueqjosqv
Q. ' ^
O) ^ ^ 2 CO
> zl. <rt OD CD CO ^ CD 3 O)
63

E
in o CD
<D
o c (D
-Q _
o CO
<
1.00
0.80 -^
0.60
0.40
0.20
0.00
0.0
3260 ppm water
1330 ppm water
A 3940 ppm water
# ^
( I y )
^5IF
40.0 80.0 ppm KOH in polyol
120.0
Figure 3.9 Response at the 605 nm under the same conditions as those in Figure 3.8 for samples of different water content.
64

CHAPTER IV
SUMMARY AND CONCLUSIONS
The current technique for analyzing potassium hydroxide (KOH) in
polyether polyol involves a laborious wet chemical method, in which a significant
time lag exists between sample collection and availability of the analytical result.
In Chapter III a simple and robust continuous KOH analyzer, which is applicable
for on-line analysis under process conditions in the desired ranges, is presented.
A solution of bromocresol green (BCG) in 2-Propanol, with or without
added mineral acid, is injected into the sample polyol stream in a single-line Fl
manifold maintained at 110 °C (dispersion factor of 50-25 for a dilute aqueous
stream at room temperature with 10 and 30 |iL of solution injected) and the blue
indicator di-anion formed upon reaction with KOH is measured at 605 nm by a
light emitting diode (LED) - fiber optic based absorbance detector. Injections of
10 iL of 10 mM BCG and 30 iL of 15 mM BCG, 50 mM HCI were respectively
chosen to cover desired ranges of 0-20 and 20-120 mg KOH/Kg polyol (ppm
KOH). Measurements could be made in the present system every 4 min.
Deliberate alteration of water content of the polyol stream in the range of interest
was found to have no discemible effect on the measurement and therefore
analysis remains consistent during variations in process conditions.
The waste generated is small enough to be reintroduced into the process
stream, the amount of indicator will in fact be undetectable at typical process fiow
65

rates. If indicator injection (30 |iL) is conducted every 5 min, 1-L of reagent will
last nearly 3 months. However, a more intelligent approach may involve setting
lower and higher limits on the injection/measurement frequency and program it to
increase as the measured KOH value increases (which necessitates the need for
more frequent monitoring). In actual implementation, the process stream is
under pressure and the desired flow rate of the analytical stream can be
achieved with a mass flow controller in lieu of a pump, which alleviates viscosity
imposed difficulties. Therefore, the analyzer presented is compliant with the
process requirements.
66

PERMISSION TO COPY
In presenting this thesis in partial fulfillment of the requirements for a
master's cjegree at Texas Tech University or Texas Tech University Health Sciences
Center, I agree that the Library and my major department shall make it freely
avaUable for research purposes. Permission to copy this thesis for scholarly
purposes may be granted by the Director of the Library or my major professor.
It is understood that any copying or publication of this thesis for financial gain
shall not be allowed without my further written permission and that any user
may be liable for copyright infringement.
Agree (Permission is granted.)
Studeifit']^ Signatul'e Dap
Disagree (Permission is not granted.)
Student's Signature Date