Embed Size (px)
Citation preview
Flow Analysis on Products of Agriculture, Forestry, Fisheries Industry using Structural
Path Analysis
*Yuko OSHITA1), Yasunori Kikuchi2)
1) Kobe University, 2) The University of Tokyo
*Corresponding author:
Yuko OSHITA
Address for correspondence: Faculty of Maritime Sciences, Kobe University, 5-1-1
Fukaeminami-machi, Higashinada-ku, Kobe, 658-0022, Japan
Phone: +81-78-431-6342
E-mail: [email protected]

ABSTRACT
Agriculture, forestry, fisheries industry of Japan is facing many critical problems seeking
solutions for them, e.g., aging of workers and free trade of the products. To build robust
domestic-supply chains, we need innovation in consideration of process of agriculture, system
of using by-products, social system and supply and demand structure. This paper analyze flows
of products of agriculture, forestry, fisheries industry and characterize present structure of them,
then we propose to design robust supply chains by introduction of biomass conversion
technology etc.
We apply technique of structural path analysis (Defourny and Thorbecke, 1984; Lenzen,
2002; Oshita, 2012, etc.) to extract the flows of them. In this study, we analyze the flows of 6
products, rice, potatoes, vegetables, fruits, sugar crops, logs, and they cover 90% of their
domestic total output.
From the results, it became clear that the most part of rice, potatoes and sweet potatoes,
vegetables and fruits are supplied to final consumers directly (without processing) or via one
step (sector). On the other hand, sugar crops and logs are supplied to final consumers via many
steps and sectors. Flow diagrams of rice, vegetables and fruits are relatively simple, because
transit points (sectors) of their supply chain are a few. However it is a noteworthy that rice
supplied to livestock sector and vegetables. It is thought that by-product of rice, rice straw and
chaff, are used by such sectors as fermentation feed and compost. Sugar crops has also relatively
complex flow. The ratio of sugar which is supplied to household directly is 9.5% of total output
of sugar crops and unexpectedly small. The most of them are supplied to eating and drinking
place and food industry. By-products of sugar crops, bagasse and filter cake etc., also supplied
to livestock sector and vegetables. Potatoes and sweet potatoes is used for not only food, but
also industrial starch. Therefore the flow diagram is relatively complex and has many industrial
sectors. Flow of logs is most complex, and their by-products are used by many agriculture and
livestock sectors and power generation. Logs are supplied to final consumers via many transit

points (sectors).
For building the robust and comprehensive supply chains, as well as main products or high
value-added products, by-products and transit sectors in flow diagrams which became clear in
this study are important as consideration factor of system design.
1. Introduction
Agriculture, forestry, fisheries industry of Japan is facing many critical problems seeking
solutions for them, e.g., aging of workers, decrease of new workers, climate change, using
biomass resources, food safety, Stabilization of income and free trade of the products. As well
as main products (foods and wood material etc.), by-products (e.g., bagasse, chaff and timber
offcuts) have become important products as biomass renewable resources, regarding agriculture
industry. To build robust domestic-supply chains, we need innovation in consideration of
process of agriculture, system of using by-products, social system and supply and demand
structure. However the flows from agriculture to final consumers through other industries are
still unclear.
This paper analyze flows of products of agriculture, forestry, fisheries industry and characterize
present structure of them, then we propose to design robust supply chains by introduction of
biomass conversion technology etc. We apply technique of structural path analysis (Defourny
and Thorbecke, 1984; Treloar, 1997; Lenzen, 2002, 2003, 2007a; Suh, 2004; Strømman et al.,
2009; Oshita, 2012, etc.) to extract the flows of them.

2. Methodology
Using input-output model, the domestic output of each industry can be estimated with the
following equation (1):
yAIx 1 , (1)
where ifxx is a matrix representing the domestic output of commodity i induced by final
demand f, I is an identity matrix, ijaA is an input coefficient matrix containing the ratios
of the amount of input of commodity i directly required to produce one unit of a commodity j,
and y is a matrix representing the final demand f for commodity i. 1 AI is the Leontief
inverse matrix (L), where the elements of the matrix ijlL represent the demand for
commodity i input directly and indirectly to produce one unit of commodity j. In other words,
equation (1) represents the direct and indirect production of each commodity induced by each
final demand.
The Leontief inverse matrix L can now be converted into a series expansion as follows:
321 AAAIAIL , (2)
I is the direct effect, or direct unit production amount demanded by the final consumer. A is an
indirect secondary effect indicating the amount of production required to produce of products
demanded by direct effect.
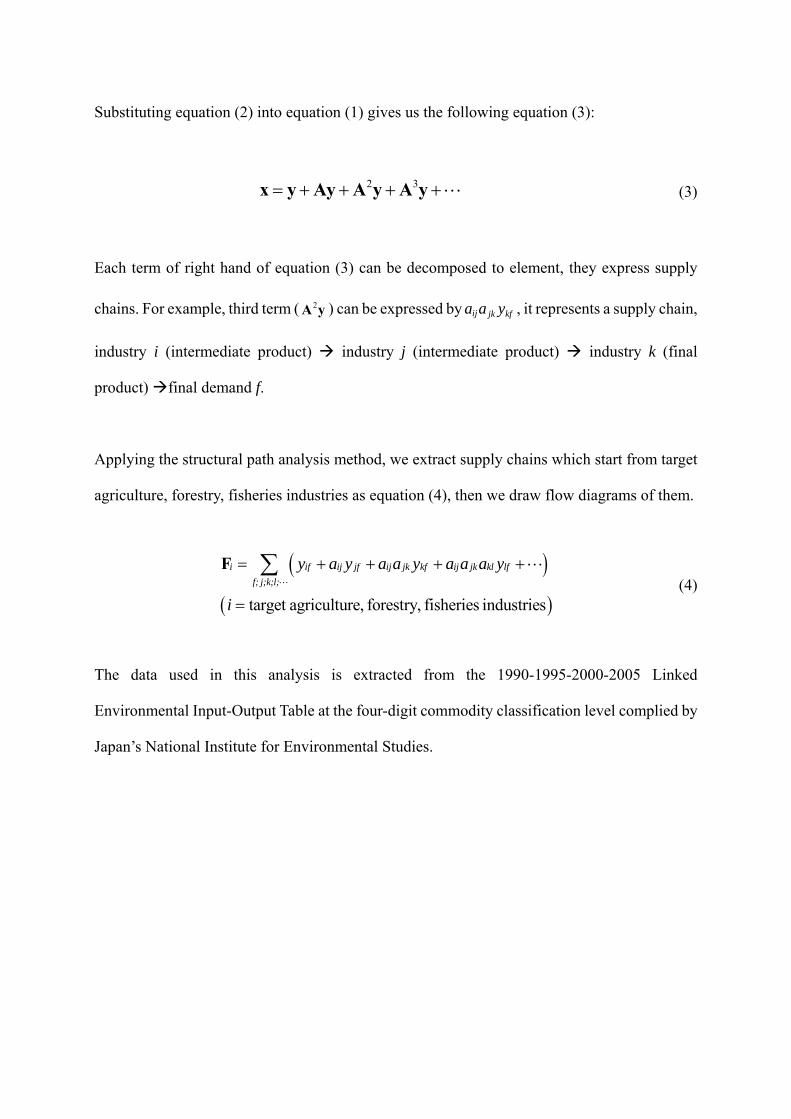
Substituting equation (2) into equation (1) gives us the following equation (3):
2 3x y Ay A y A y (3)
Each term of right hand of equation (3) can be decomposed to element, they express supply
chains. For example, third term ( 2A y ) can be expressed by ij jk kfa a y , it represents a supply chain,
industry i (intermediate product) industry j (intermediate product) industry k (final
product) final demand f.
Applying the structural path analysis method, we extract supply chains which start from target
agriculture, forestry, fisheries industries as equation (4), then we draw flow diagrams of them.
target agriculture, forestry, fisheries industries
i if ij jf ij jk kf ij jk kl lf
f; j;k;l;
y a y a a y a a a y
i
F
(4)
The data used in this analysis is extracted from the 1990-1995-2000-2005 Linked
Environmental Input-Output Table at the four-digit commodity classification level complied by
Japan’s National Institute for Environmental Studies.

3. Result and discussion
In this study, we analyze the flows of 6 products, rice, potatoes, vegetables, fruits, sugar crops,
logs, and they cover 90% of their domestic total output.
Table 1 shows cover rate for their domestic output of each target products on each supply step.
“Order” in Table 1 means length of supply chain (the number of industries between start and
end point of supply chain). Order 1 means ratio that a target product is demanded directly by
final demand, i.e. first term in equation (3). Order 2 means amount of first term and second
term in equation (3), i.e. summation of direct final demand and indirect final demand through
only 1 industry. From the table 1, it became clear that the most part of rice, potatoes, vegetables
and fruits are supplied to final consumers directly (without processing, rice: 1.3%, potatoes:
42%, vegetables: 67%, fruits:65%) or via only one step (sector) (rice: 65%, potatoes: 83%,
vegetables: 97%, fruits:95%). On the other hand, sugar crops and logs are hardly demanded
directly by final demand (sugar crops: 0%, logs: 0.075%), they are supplied to final consumers
via many steps and sectors. Especially, logs reach at 90% with more than order 5, it goes to
final consumers through particularly many industries.
Table 1. Cover rate for their domestic output
Order 1 Order 2 Order 3 Order 4 Order 5
Rice 1.3% 65% 94%
Potatoes 42% 83% 91%
Vegetables 67% 97%
Fruits 65% 95%
Sugar crops 0% 9.8% 73% 93%
Logs 0.075% 4.9% 70% 85% 90%
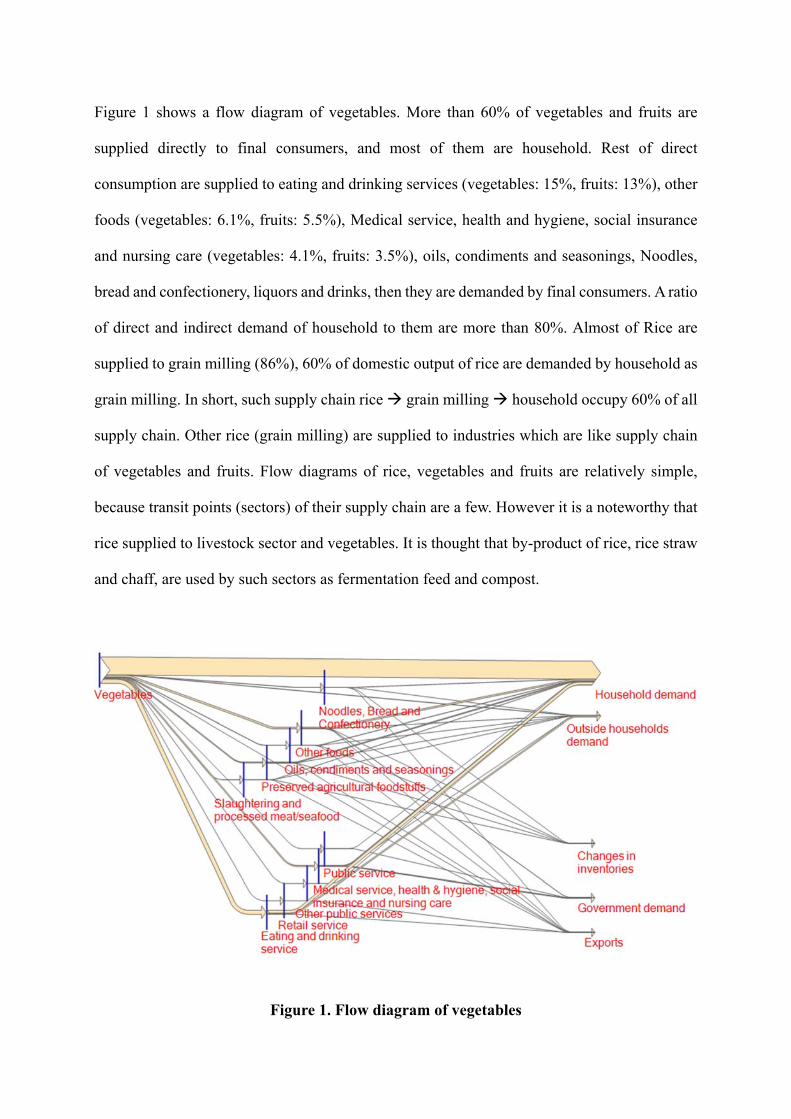
Figure 1 shows a flow diagram of vegetables. More than 60% of vegetables and fruits are
supplied directly to final consumers, and most of them are household. Rest of direct
consumption are supplied to eating and drinking services (vegetables: 15%, fruits: 13%), other
foods (vegetables: 6.1%, fruits: 5.5%), Medical service, health and hygiene, social insurance
and nursing care (vegetables: 4.1%, fruits: 3.5%), oils, condiments and seasonings, Noodles,
bread and confectionery, liquors and drinks, then they are demanded by final consumers. A ratio
of direct and indirect demand of household to them are more than 80%. Almost of Rice are
supplied to grain milling (86%), 60% of domestic output of rice are demanded by household as
grain milling. In short, such supply chain rice grain milling household occupy 60% of all
supply chain. Other rice (grain milling) are supplied to industries which are like supply chain
of vegetables and fruits. Flow diagrams of rice, vegetables and fruits are relatively simple,
because transit points (sectors) of their supply chain are a few. However it is a noteworthy that
rice supplied to livestock sector and vegetables. It is thought that by-product of rice, rice straw
and chaff, are used by such sectors as fermentation feed and compost.
Figure 1. Flow diagram of vegetables

Table 2 shows a flow diagram of sugar crops. Sugar crops has also relatively complex flow.
Almost 100% of sugar crops are supplied (processed) to sugar, but the ratio of sugar which is
supplied to household directly is 9.5% of total output of sugar crops and unexpectedly small.
The most of them are supplied to Noodles, bread and confectionery (30%), liquors and drinks
(18%), eating and drinking service (9.8%) and so on. It is a characteristic of sugar crops that
primary products or secondary products are not so demanded by final consumer directly. It is
noteworthy that many by-products of sugar crops, bagasse and filter cake etc., also supplied to
livestock, feed and organic fertilizers, vegetables and fruits and so on.
Figure 2. Flow diagram of sugar crops
Figure 3 shows flow diagram of potatoes. 45% of potatoes are demand by household directly,
and 18% of potatoes are supplied to eating and drinking services. However the two consumers
do not occupy such large percentage in physical data. According to Ministry of Agriculture,

Forestry and Fisheries (2008), physical percentage of potatoes for omophagia is Bareisho:
15.1%, Kansho: 5.9%. A reason of the difference is difference of price between potatoes for
omophagia and for processing. In this study, we target the monetary flows, therefore volume of
flows are decided according to monetary volume, not physically volume. Potatoes is used for
not only food, but also industrial starch. Therefore the flow diagram is relatively complex and
has many industrial sectors. Prices of starch for eating are also largely different for industrial
use.
Figure 3. Flow diagram of potatoes
Flow of logs is most complex. Most of logs are not demanded by final consumers directly, 68%
of logs are supplied to timber, 14% go to plywood, 5% go to other wooden products. 80% of
logs which are supplied to timber (53% of all) supplied to residential construction and repair,

then most of them are demanded by private capital. Wooden chips, plywood and feed and
organic fertilizers are made from by-products of logs, and they are used by many agriculture
and livestock sectors and power generation. Logs are supplied to final consumers via many
transit points (sectors).
4. Conclusions
In this study, we analyzed monetary flows for 6 products of agriculture, forestry, fisheries.
However analysis for physical flow using price table are needed, we found that there is
difference between monetary flows and physical flows. On the other hand, it is necessary for
sustainable utilization of domestic plant resources that we produce main products (food and
logs) which have high value-added even in small quantities, and construct flows of by-products
(on the diagrams in this study) as economically feasible.
For building the robust and comprehensive supply chains, as well as main products or high
value-added products, by-products and transit sectors in flow diagrams which became clear in
this study are important as consideration factor of system design.
Reference
Defourny, J. and Thorbecke, E. (1984), Structural path analysis and multiplier decomposition
within a social accounting matrix framework, Economic Journal, vol.94, no.373, pp.111-
136.
Lenzen, M. (2002), A guide for compiling inventories in hybrid Life-cyccle assesments: some
Australian result, Journal of Cleaner Production, vol.10, no.6, pp.545-572.
Lenzen, M. (2003), Environmentally important paths, linkages and key sectors in the Australian
economy, Structural Change and Economic Dynamics, vol.14, no.1, pp.1–34.
Lenzen, M. (2007a), Structural path analysis of ecosystem networks, Ecological Modelling,
vol.200, no.3-4, pp.334-342.
Ministry of Agriculture, Forestry and Fisheries (2008),
http://www.maff.go.jp/j/study/denpun/h200714/pdf/data3.pdf (in Japanese)
Oshita, Y. (2012), Identifying Critical Supply-Chain Paths that Drive the Change in CO2
Emission, Energy Economics, vol.34, no.4, pp.1041-1050.
Strømman, A.H., Peters, G.P. and Hertwich, E.G. (2009), Approaches to correct for double
counting in tiered hybrid life cycle inventories, Journal of Cleaner Production, vol.17,
no.2, pp.248-254.
Suh, S. (2004), Functions, commodities and environmental impacts in an ecological. economic
model, Ecological Economics, vol.48, no.4, pp.451-467.
Treloar, G. (1997), Extracting embodied energy paths from input-output tables: towards an
input-output-based hybrid energy analysis method, Economic Systems Research, vol.9,
no.4, pp.375-391.