Embed Size (px)
Citation preview
www.flotekind.com
Flotek Industries, Inc.A Technology-Driven Growth Company
Jerry Dumas, Chairman & CEO Jempy Neyman, Sr. VP & CFO
222
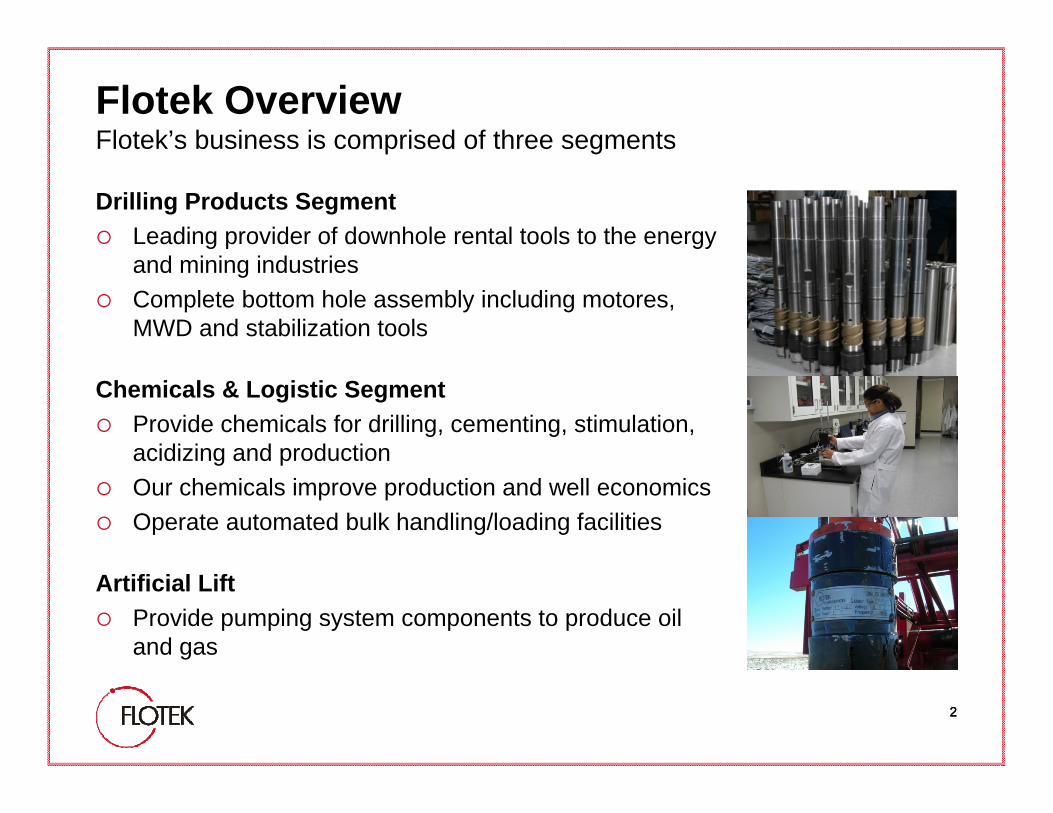
Flotek OverviewFlotek’s business is comprised of three segments
Drilling Products SegmentLeading provider of downhole rental tools to the energy and mining industriesComplete bottom hole assembly including motores, MWD and stabilization tools
Chemicals & Logistic SegmentProvide chemicals for drilling, cementing, stimulation, acidizing and productionOur chemicals improve production and well economicsOperate automated bulk handling/loading facilities
Artificial LiftProvide pumping system components to produce oil and gas
333
Flotek Growth EnginesSustainable Earnings Growth
Growth Strategy:Diversified revenue base with low capital requirementsAttractive acquisitions in strategic marketsOrganic growth through R&DAggressive focus thru Flotek International
Focus on Fundamentals:Employee recruiting and retentionManagement team growthField operating profit target of 25%
Core Business Growth:Specialized products for unconventional oil & gasArtificial lift—a $6.6B market *Stimulation chemicals—a $4.1B, high-margin market *Drilling tools—a $1.8B market*
*Spears Oilfield Market Report, Oct. 2008
444
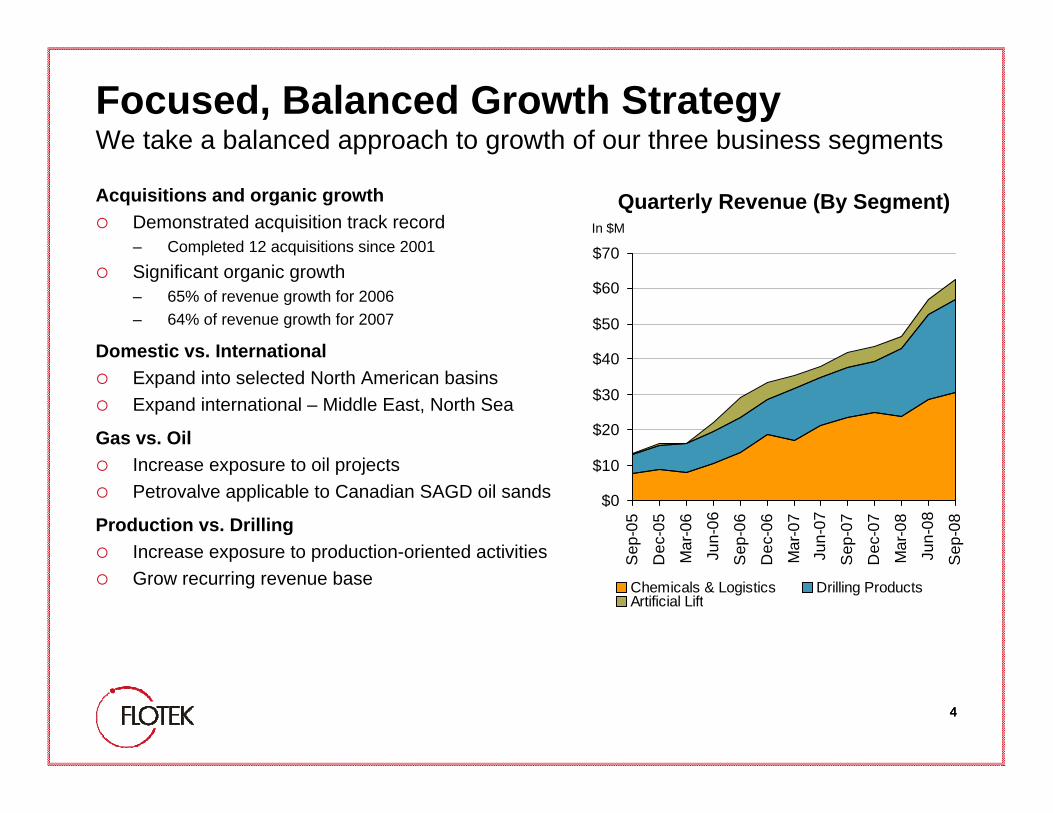
Focused, Balanced Growth StrategyWe take a balanced approach to growth of our three business segments
Acquisitions and organic growthDemonstrated acquisition track record– Completed 12 acquisitions since 2001Significant organic growth– 65% of revenue growth for 2006 – 64% of revenue growth for 2007
Domestic vs. InternationalExpand into selected North American basinsExpand international – Middle East, North Sea
Gas vs. OilIncrease exposure to oil projectsPetrovalve applicable to Canadian SAGD oil sands
Production vs. DrillingIncrease exposure to production-oriented activitiesGrow recurring revenue base
Quarterly Revenue (By Segment)
$0
$10
$20
$30
$40
$50
$60
$70
Sep
-05
Dec
-05
Mar
-06
Jun-
06
Sep
-06
Dec
-06
Mar
-07
Jun-
07
Sep
-07
Dec
-07
Mar
-08
Jun-
08
Sep
-08
Chemicals & Logistics Drilling ProductsArtificial Lift
In $M
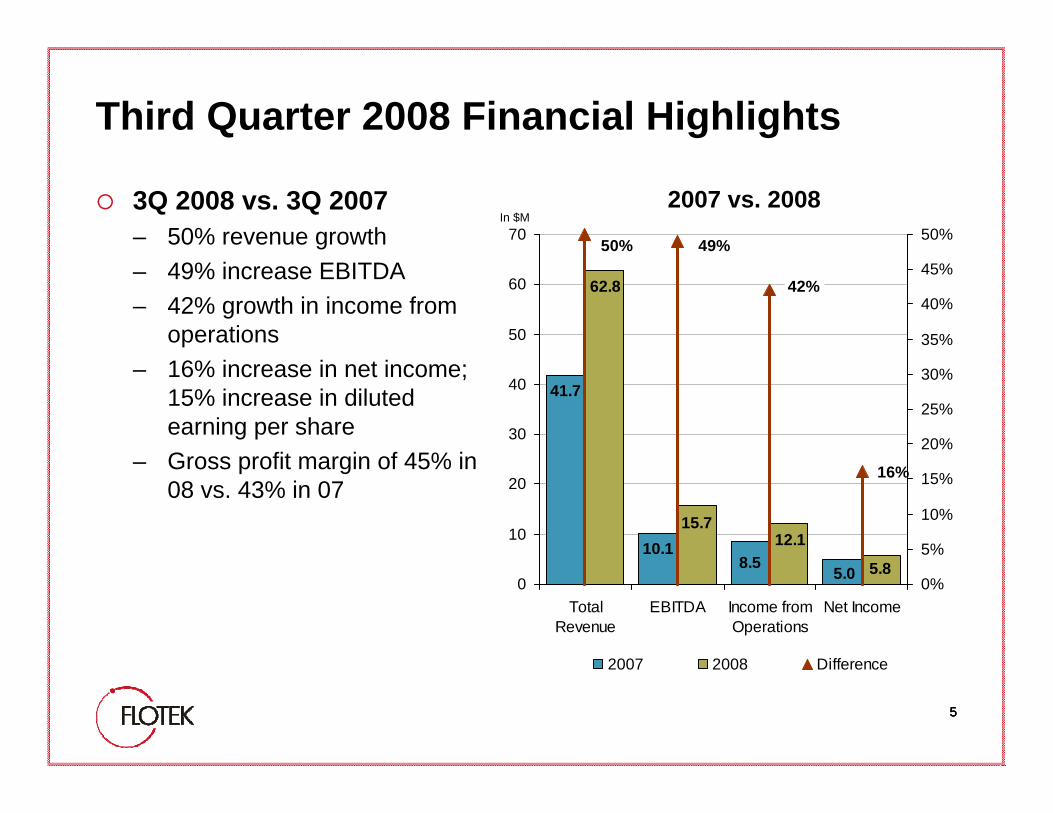
Third Quarter 2008 Financial Highlights
3Q 2008 vs. 3Q 2007– 50% revenue growth– 49% increase EBITDA– 42% growth in income from
operations– 16% increase in net income;
15% increase in diluted earning per share
– Gross profit margin of 45% in 08 vs. 43% in 07
555
8.5 5.0
41.7
10.15.8
62.8
15.712.1
16%
49%50%
42%
0
10
20
30
40
50
60
70
TotalRevenue
EBITDA Income fromOperations
Net Income0%
5%
10%
15%
20%
25%
30%
35%
40%
45%
50%
2007 2008 Difference
2007 vs. 2008In $M
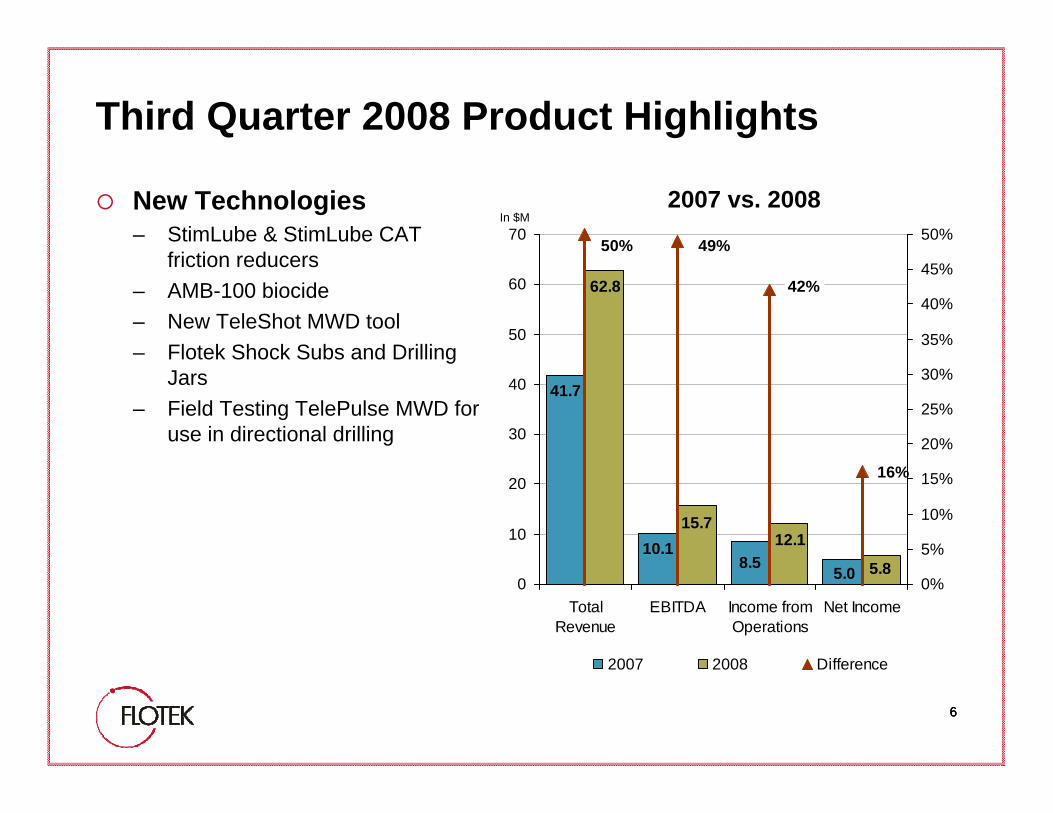
Third Quarter 2008 Product Highlights
New Technologies– StimLube & StimLube CAT
friction reducers– AMB-100 biocide – New TeleShot MWD tool– Flotek Shock Subs and Drilling
Jars– Field Testing TelePulse MWD for
use in directional drilling
666
8.5 5.0
41.7
10.15.8
62.8
15.712.1
16%
49%50%
42%
0
10
20
30
40
50
60
70
TotalRevenue
EBITDA Income fromOperations
Net Income0%
5%
10%
15%
20%
25%
30%
35%
40%
45%
50%
2007 2008 Difference
2007 vs. 2008In $M
777
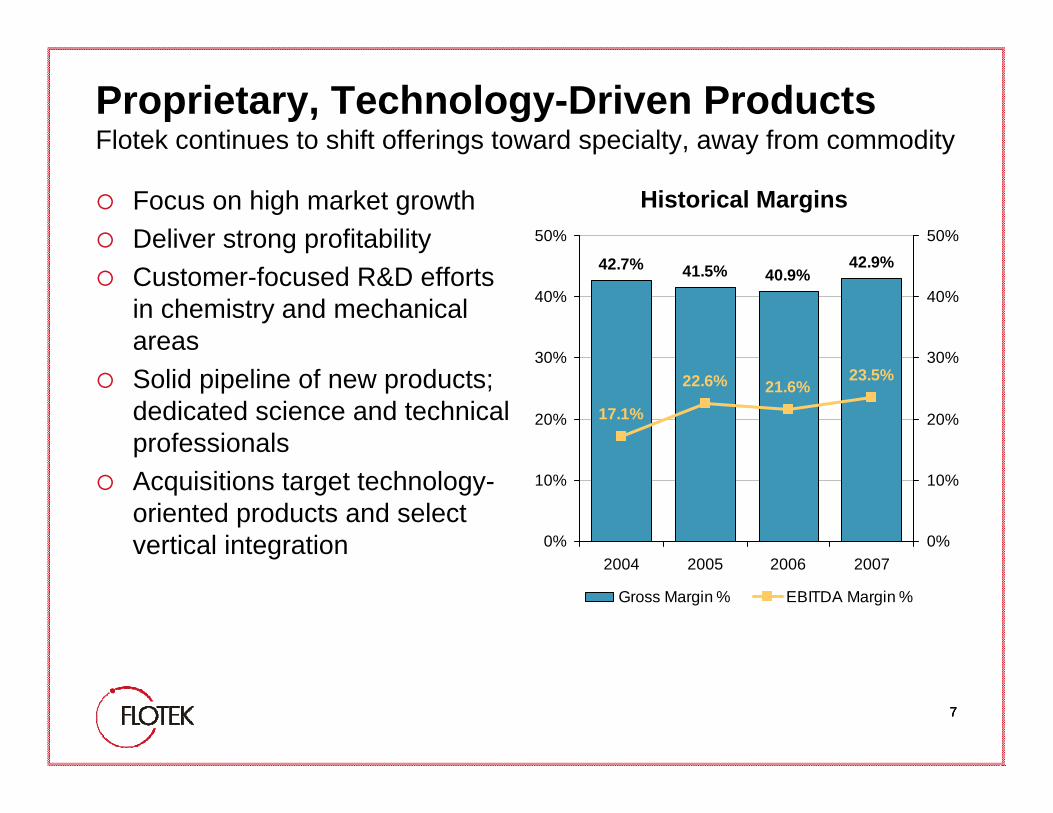
Proprietary, Technology-Driven ProductsFlotek continues to shift offerings toward specialty, away from commodity
Focus on high market growth Deliver strong profitabilityCustomer-focused R&D efforts in chemistry and mechanical areasSolid pipeline of new products; dedicated science and technical professionalsAcquisitions target technology-oriented products and select vertical integration
41.5% 40.9%42.7% 42.9%
22.6% 21.6%23.5%
17.1%
0%
10%
20%
30%
40%
50%
2004 2005 2006 20070%
10%
20%
30%
40%
50%
Gross Margin % EBITDA Margin %
Historical Margins
888
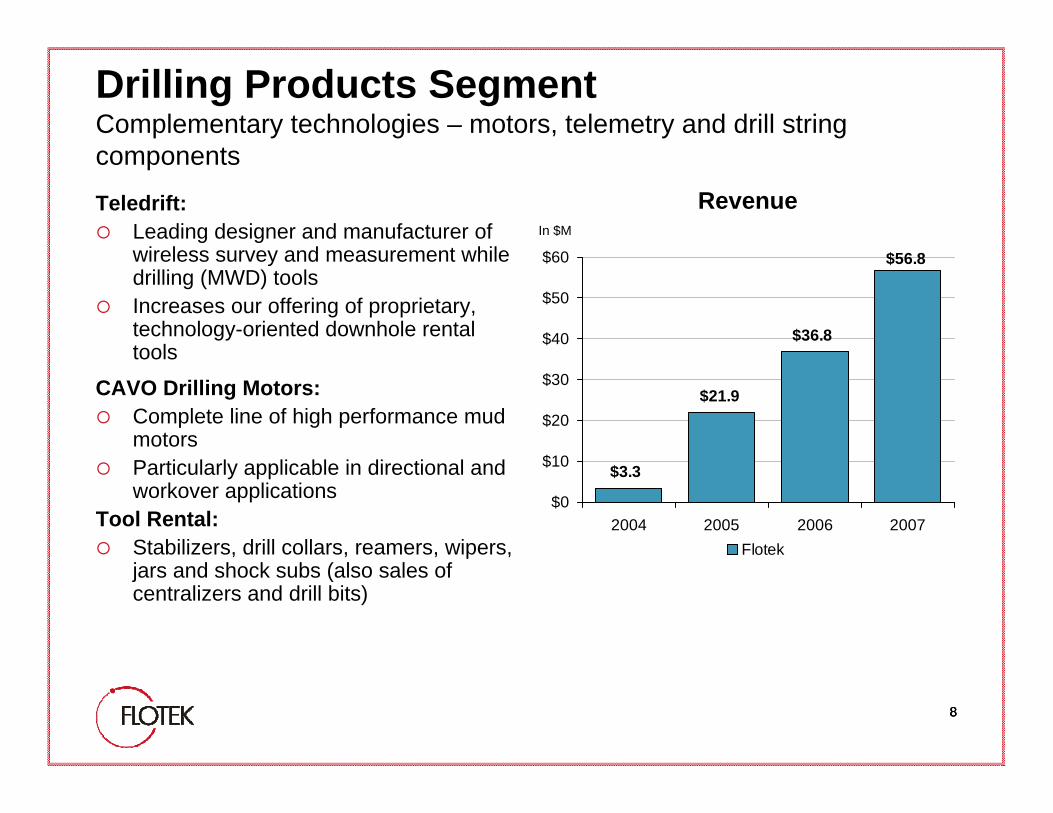
Drilling Products SegmentComplementary technologies – motors, telemetry and drill string components
Teledrift:Leading designer and manufacturer of wireless survey and measurement while drilling (MWD) toolsIncreases our offering of proprietary, technology-oriented downhole rental tools
CAVO Drilling Motors:Complete line of high performance mud motorsParticularly applicable in directional and workover applications
Tool Rental:Stabilizers, drill collars, reamers, wipers, jars and shock subs (also sales of centralizers and drill bits)
$21.9
$56.8
$3.3
$36.8
$0
$10
$20
$30
$40
$50
$60
2004 2005 2006 2007Flotek
RevenueIn $M
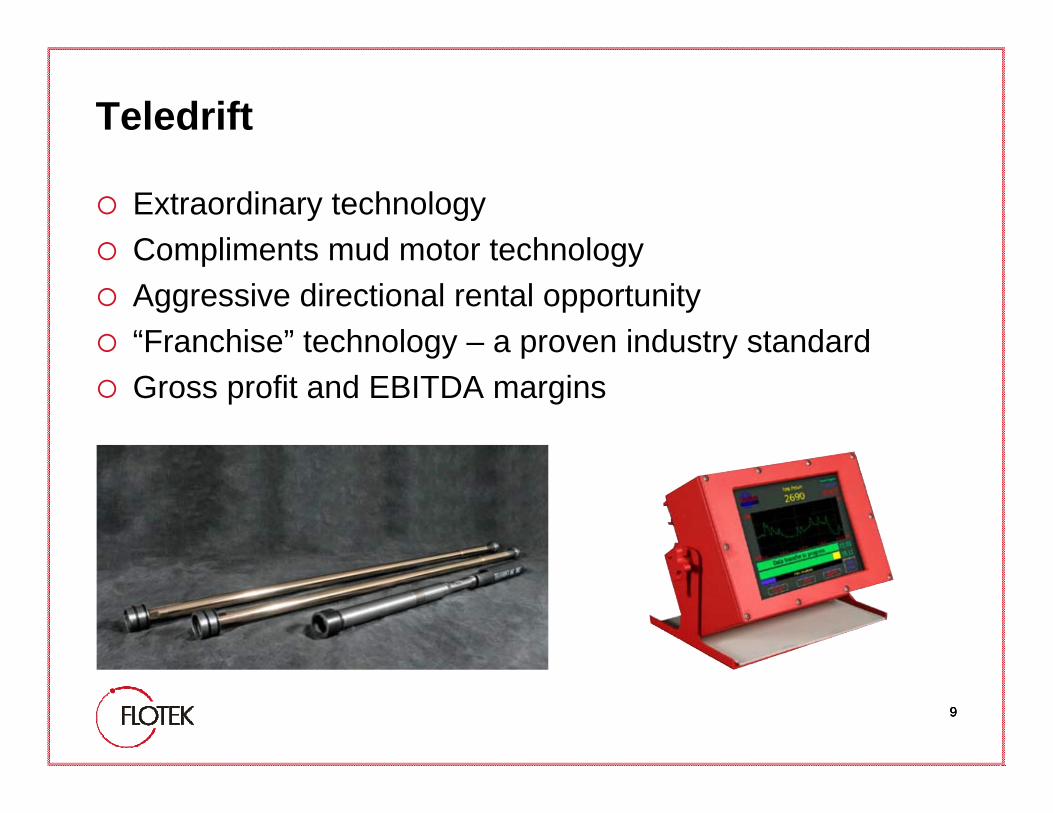
Teledrift
Extraordinary technologyCompliments mud motor technologyAggressive directional rental opportunity “Franchise” technology – a proven industry standardGross profit and EBITDA margins
999
101010
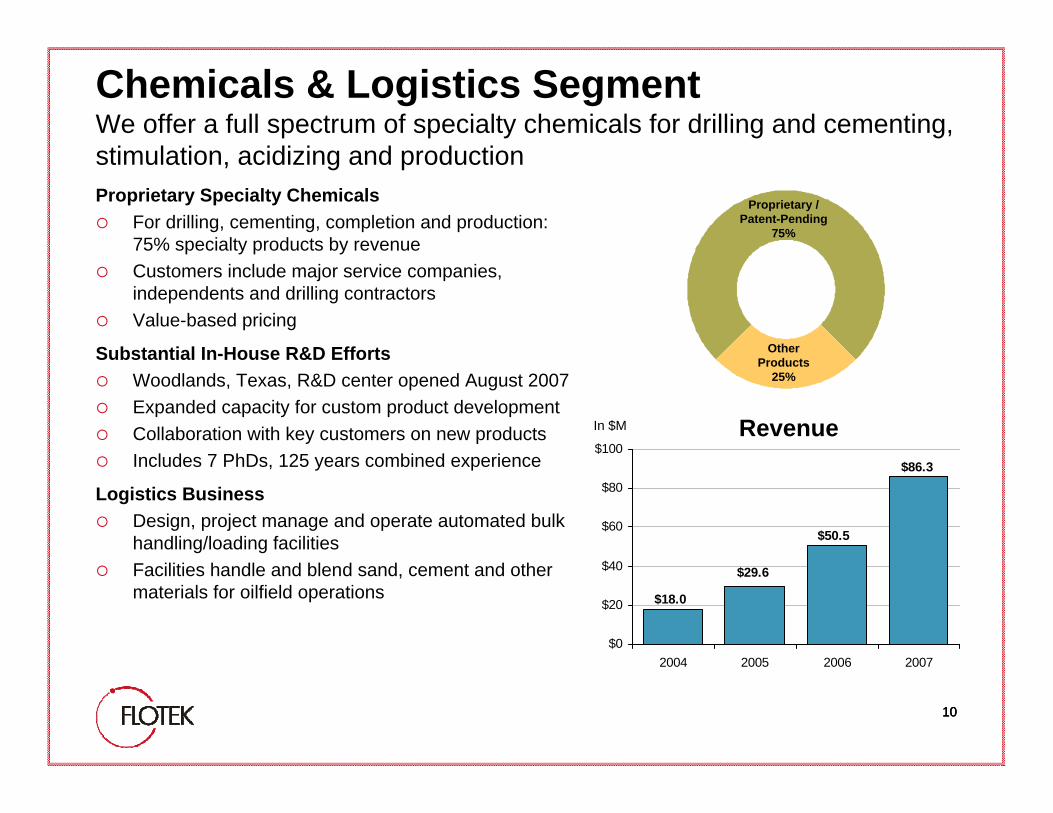
Chemicals & Logistics SegmentWe offer a full spectrum of specialty chemicals for drilling and cementing, stimulation, acidizing and productionProprietary Specialty Chemicals
For drilling, cementing, completion and production: 75% specialty products by revenueCustomers include major service companies, independents and drilling contractorsValue-based pricing
Substantial In-House R&D EffortsWoodlands, Texas, R&D center opened August 2007Expanded capacity for custom product developmentCollaboration with key customers on new productsIncludes 7 PhDs, 125 years combined experience
Logistics BusinessDesign, project manage and operate automated bulk handling/loading facilitiesFacilities handle and blend sand, cement and other materials for oilfield operations
$29.6
$50.5
$18.0
$86.3
$0
$20
$40
$60
$80
$100
2004 2005 2006 2007
Other Products
25%
Proprietary / Patent-Pending
75%
RevenueIn $M
111111
Chemicals Group
Growing global demand for oilfield chemicals*5.9% yearly demand increase for oilfield chemicals– $14.5B market by 2010
Largest market is North America– Nearly 60% of total demand in 2010
North Sea demand for high value, environmental products – Biodegradable capillary foamer– Micro-emulsion (ME) offshore approval pending– Manufacturing capability established in The Netherlands
* The Freedonia Group, Inc.-World Oilfield Chemicals # 2162
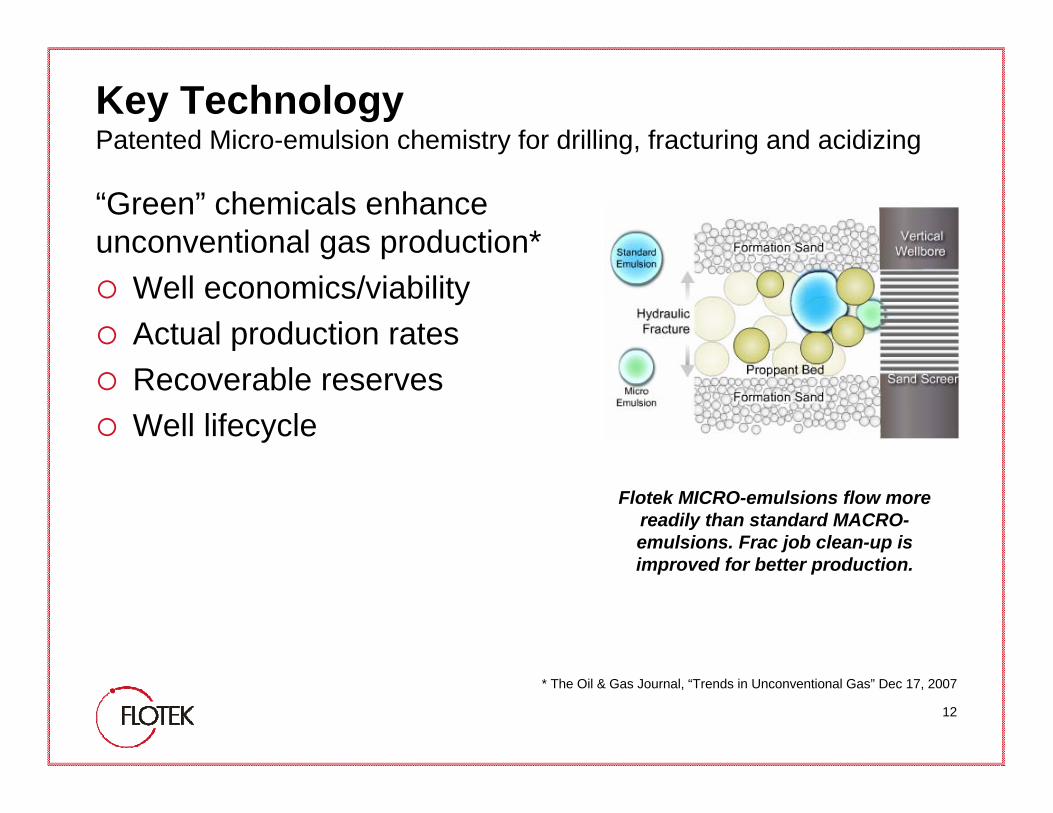
Key TechnologyPatented Micro-emulsion chemistry for drilling, fracturing and acidizing
“Green” chemicals enhance unconventional gas production*
Well economics/viabilityActual production ratesRecoverable reserves Well lifecycle
12
Flotek MICRO-emulsions flow more readily than standard MACRO-emulsions. Frac job clean-up is improved for better production.
* The Oil & Gas Journal, “Trends in Unconventional Gas” Dec 17, 2007
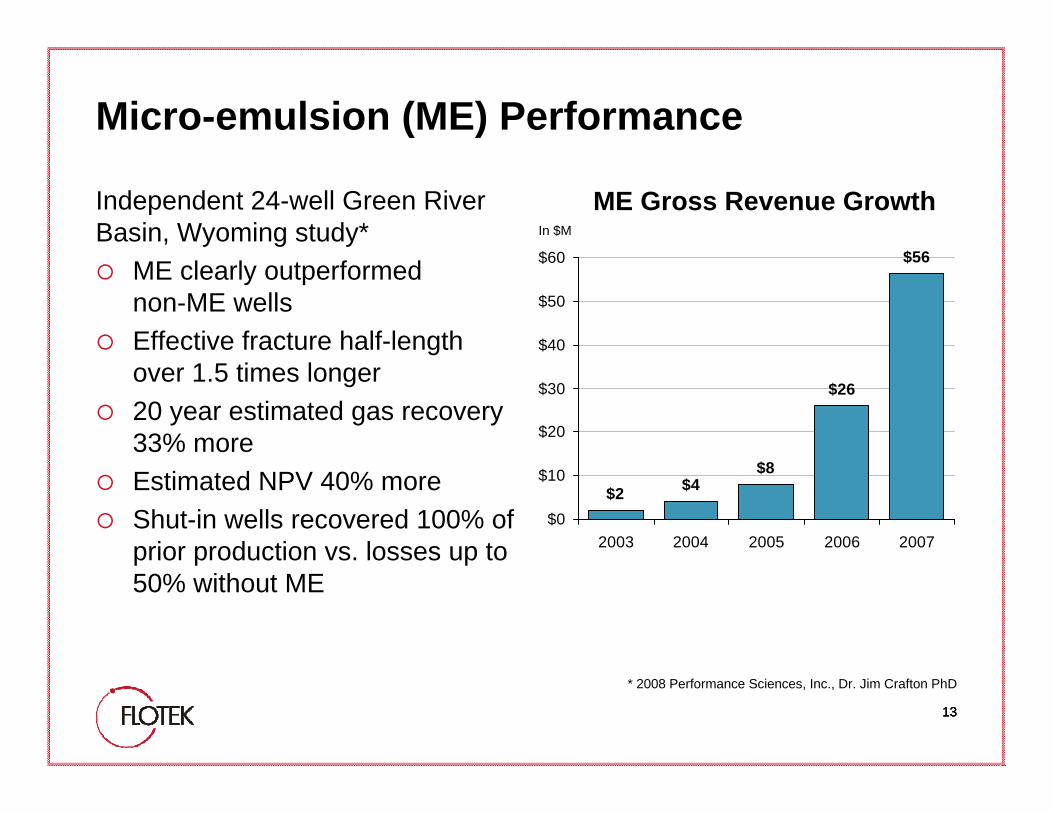
Micro-emulsion (ME) Performance
Independent 24-well Green River Basin, Wyoming study*
ME clearly outperformed non-ME wellsEffective fracture half-length over 1.5 times longer20 year estimated gas recovery 33% moreEstimated NPV 40% moreShut-in wells recovered 100% of prior production vs. losses up to 50% without ME
131313
$2 $4$8
$26
$56
$0
$10
$20
$30
$40
$50
$60
2003 2004 2005 2006 2007
* 2008 Performance Sciences, Inc., Dr. Jim Crafton PhD
ME Gross Revenue GrowthIn $M
141414
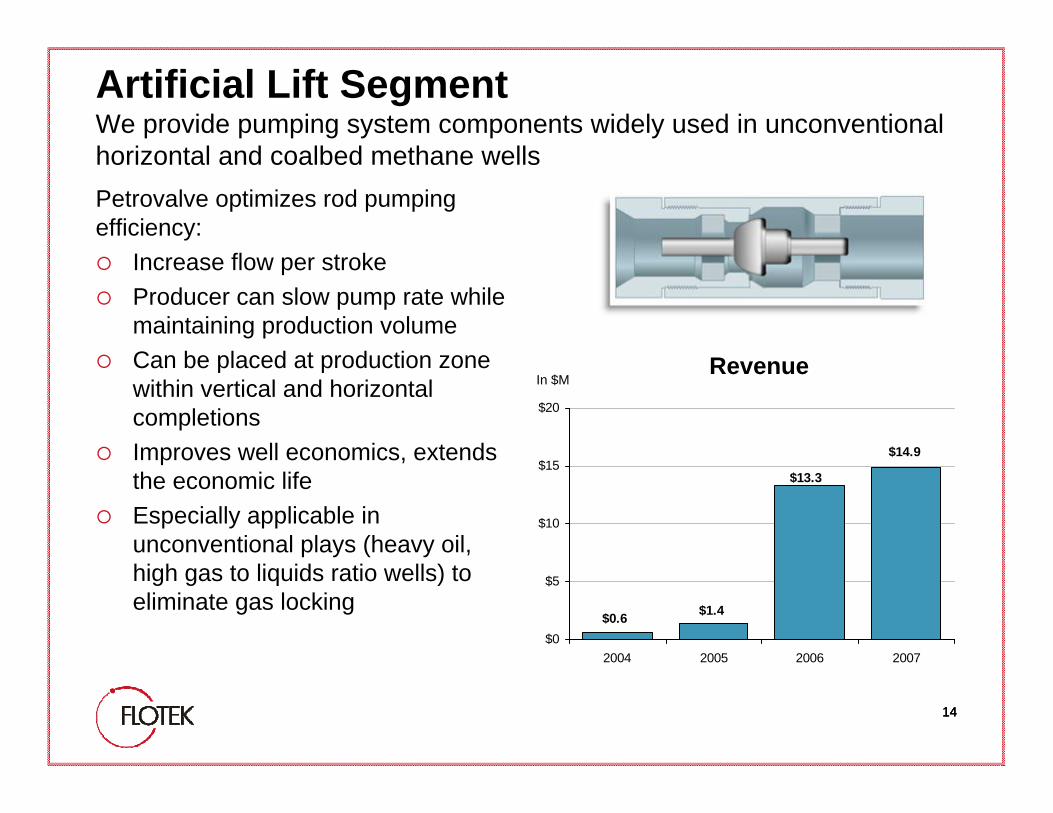
Artificial Lift SegmentWe provide pumping system components widely used in unconventional horizontal and coalbed methane wellsPetrovalve optimizes rod pumping efficiency:
Increase flow per stroke Producer can slow pump rate while maintaining production volumeCan be placed at production zone within vertical and horizontal completionsImproves well economics, extends the economic lifeEspecially applicable in unconventional plays (heavy oil, high gas to liquids ratio wells) to eliminate gas locking $1.4
$14.9
$0.6
$13.3
$0
$5
$10
$15
$20
2004 2005 2006 2007
RevenueIn $M
151515
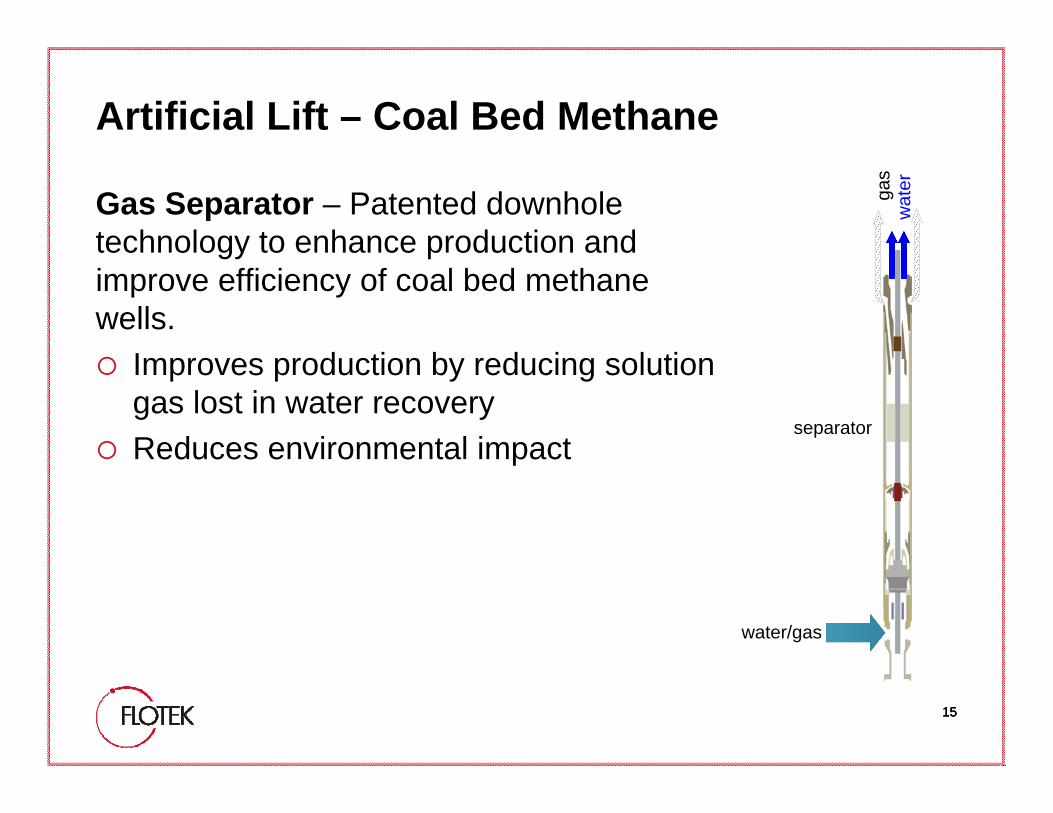
Artificial Lift – Coal Bed Methane
Gas Separator – Patented downhole technology to enhance production and improve efficiency of coal bed methane wells.
Improves production by reducing solution gas lost in water recoveryReduces environmental impact
water/gas
separator
gas
wat
er
161616
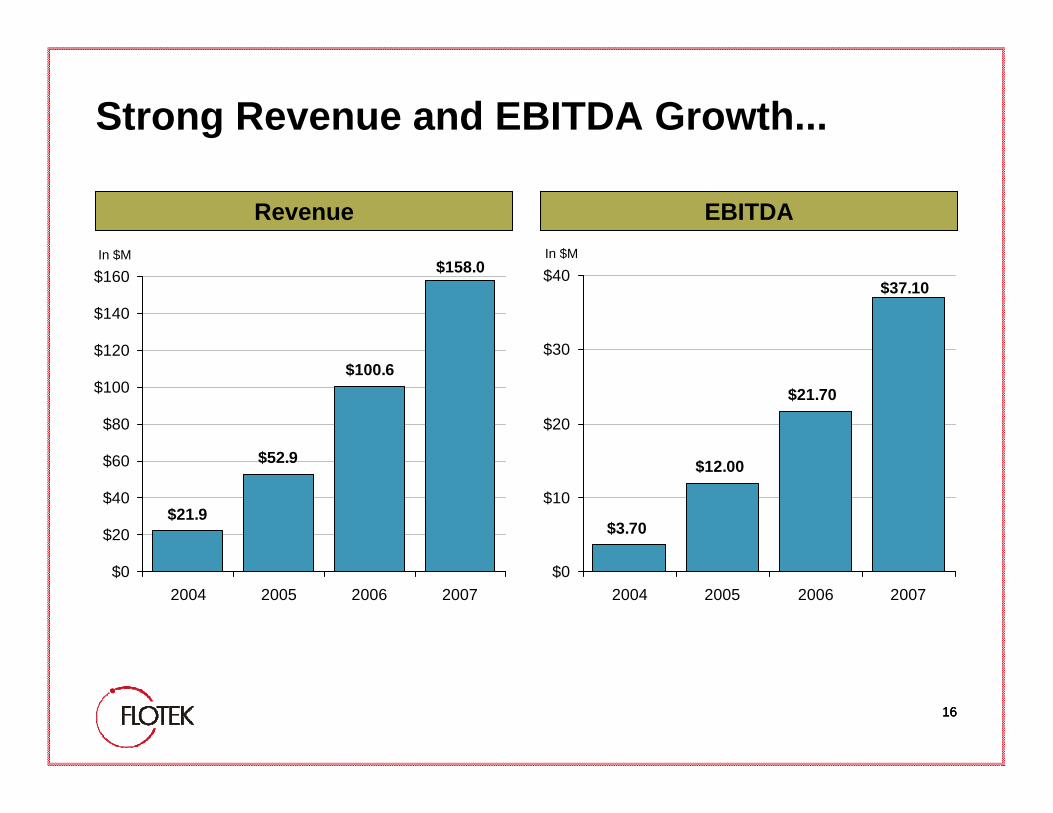
$3.70
$12.00
$21.70
$37.10
$0
$10
$20
$30
$40
2004 2005 2006 2007
Strong Revenue and EBITDA Growth...
Revenue EBITDA
$158.0
$100.6
$52.9
$21.9
$0
$20
$40
$60
$80
$100
$120
$140
$160
2004 2005 2006 2007
In $M In $M
171717
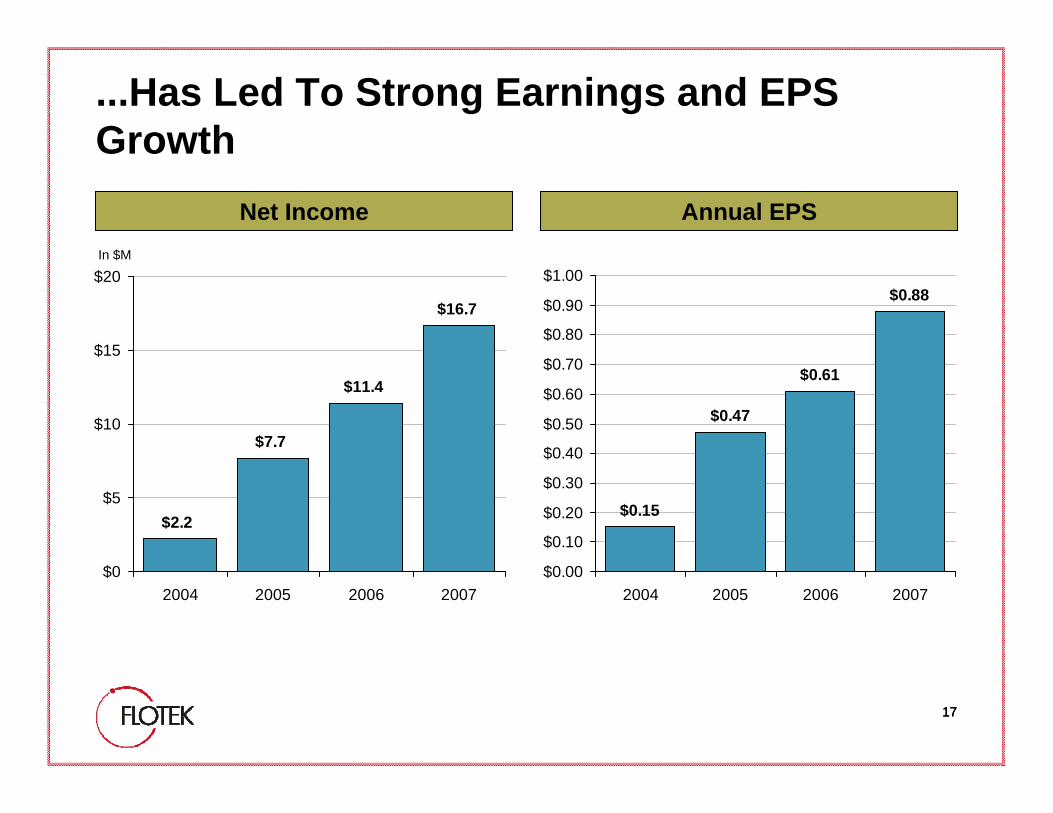
...Has Led To Strong Earnings and EPS Growth
$0.88
$0.61
$0.47
$0.15
$0.00
$0.10
$0.20
$0.30
$0.40
$0.50
$0.60
$0.70
$0.80
$0.90
$1.00
2004 2005 2006 2007
$2.2
$7.7
$11.4
$16.7
$0
$5
$10
$15
$20
2004 2005 2006 2007
In $M
Annual EPSNet Income
181818
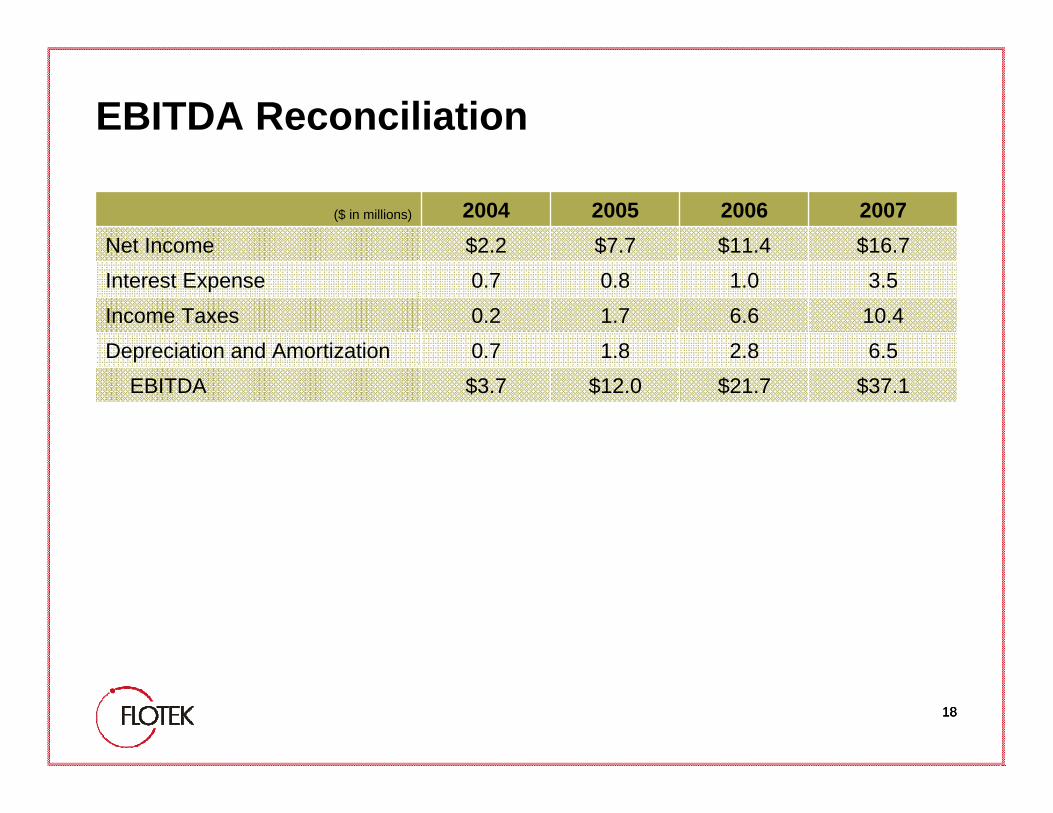
EBITDA Reconciliation
($ in millions) 2004 2005 2006 2007Net Income $2.2 $7.7 $11.4 $16.7Interest Expense 0.7 0.8 1.0 3.5Income Taxes 0.2 1.7 6.6 10.4Depreciation and Amortization 0.7 1.8 2.8 6.5
EBITDA $3.7 $12.0 $21.7 $37.1
191919
Forward Looking Statements and Non-GAAP DisclosuresCertain statements and information included in this presentation constitute “forward–looking statements”within the meaning of the Private Securities Litigation Reform Act of 1995. These statements are based on certain assumptions and analyses made by the Company’s management in light of its experience and its perception of historical trends, current conditions, expected future developments and other factors it believes are appropriate under the circumstances. These statements involve known and unknown risks and uncertainties, some of which are outlined in the Company’s 10-K, which may cause the actual performance of Flotek to be materially different from any future results expressed or implied in this presentation and the forward-looking statements. Flotek undertakes no obligation to update any of its forward-looking statements for any reason.
Flotek has used the non-GAAP financial measure of earnings before interest, taxes, depreciation and amortization (EBITDA) in this presentation. We have used this because we believe that EBITDA provides useful information to investors as it represents the measure of pre-tax cash flow of Flotek, prior to any debt service requirements. A non-GAAP financial measure is a numerical measure of financial performance, financial position, or cash flows that either 1) excludes amounts, or is subject to adjustments that have the effect of excluding amounts, that are included in the most directly comparable measure calculated and presented in accordance with GAAP in the statement of income, balance sheet or statement of cash flows, or 2) includes amounts, or is subject to adjustments that have the effect of including amounts, that are excluded from the most directly comparable measure so calculated and presented.
202020
Contact Us
Flotek Industries, Inc.2930 W. Sam Houston Parkway N. Suite 300Houston, Texas 77043713-849-9911www.flotekind.com
Brian Shannon, Investor Relations ManagerAt Flotek Industries, our mission is to provide the customers we serve with the best value to enhance their performance. This will be done with the utmost dignity, integrity, and character. Character of the organization and its people matters greatly at Flotek where values will not be compromised. We will strive daily to achieve the highest standards of quality, loyalty, and service to be, with God’s grace, the best in our industry. This is our commitment to our customers, stockholders and ourselves.