Embed Size (px)
DESCRIPTION
New Facilities, Expansions and Upgrages
Citation preview


Editor’s Office and Advertiser Information:Florida Water Resources Journal
1402 Emerald Lakes DriveClermont, FL 34711
Phone: 352-241-6006 • Fax: 352-241-6007Email: Editorial, [email protected]
Display and Classified Advertising, [email protected] Office:
P.O. Box 745, Windermere, FL 34786-0745Web: http://www.fwrj.com
General Manager: Michael DelaneyEditor: Rick HarmonGraphic Design Manager: Patrick DelaneyMailing Coordinator: Buena Vista Publishing
Published byBUENA VISTA PUBLISHING for
Florida Water Resources Journal, Inc.
President: Patrick Lehman, P.E. (FSAWWA)Peace River/Manasota Regional Water Supply Authority
Vice President: Howard Wegis, P.E. (FWEA)Lee County Utilities
Treasurer: Rim Bishop (FWPCOA)Seacoast Utility Authority
Secretary: Holly Hanson (At Large)ILEX Services Inc., Orlando
Moving?The Post Office will not forward your magazine. Do notcount on getting the Journal unless you notify us directly ofaddress changes by the 15th of the month preceding themonth of issue. Please do not telephone address changes.Email changes to [email protected], fax to 352-241-6007, ormail to Florida Water Resources Journal, 1402 Emerald LakesDrive, Clermont, FL 34711
Membership QuestionsFSAWWA: Casey Cumiskey – 407-957-8447 or
[email protected]: Karen Wallace, Executive Manager – 407-574-3318FWPCOA: Darin Bishop – 561-840-0340
Training QuestionsFSAWWA: Donna Metherall – 407-957-8443 or
[email protected]: Shirley Reaves – 321-383-9690
For Other InformationDEP Operator Certification: Ron McCulley – 850-245-7500FSAWWA: Peggy Guingona – 407-957-8448Florida Water Resources Conference: 888-328-8448FWPCOA Operators Helping Operators:
John Lang – 772-559-0722, e-mail – [email protected]: Karen Wallace, Executive Manager – 407-574-3318
WebsitesFlorida Water Resources Journal: www.fwrj.comFWPCOA: www.fwpcoa.orgFSAWWA: www.fsawwa.orgFWEA: www.fwea.org and www.fweauc.orgFlorida Water Resources Conference: www.fwrc.org
Throughout this issue trademark names are used. Rather than place a trade-mark symbol in every occurrence of a trademarked name, we state we are usingthe names only in an editorial fashion, and to the benefit of the trademark owner,with no intention of infringement of the trademark. None of the material in thispublication necessarily reflects the opinions of the sponsoring organizations.All correspondence received is the property of the Florida Water Resources Jour-nal and is subject to editing. Names are withheld in published letters only for ex-traordinary reasons.
Authors agree to indemnify, defend and hold harmless the Florida Water Re-sources Journal Inc. (FWRJ), its officers, affiliates, directors, advisors, members,representatives, and agents from any and all losses, expenses, third-party claims, li-ability, damages and costs (including, but not limited to, attorneys’ fees) arising fromauthors’ infringement of any intellectual property, copyright or trademark, or otherright of any person, as applicable under the laws of the State of Florida.
Florida Water Resources Journal, USPS 069-770, ISSN 0896-1794, is published monthly by Florida Water Resources Journal, Inc., 1402 Emerald Lakes Drive, Clermont, FL 34711, on behalf of the Florida Water & Pollution Control Operator’s Association, Inc.; Florida Section, American Water Works Association; andthe Florida Water Environment Association. Members of all three associations receive the publication as a service of their association; $6 of membership duessupport the Journal. Subscriptions are otherwise available within the U.S. for $24 per year. Periodicals postage paid at Clermont, FL and additional offices.
POSTMASTER: send address changes to Florida Water Resources Journal, 1402 Emerald Lakes Drive, Clermont, FL 34711
Volume 65 October 2013 Number 10
Florida Water Resources Journal • October 2013 3
NEWS AND FEATURES4 Assessing the Environmental Impact: Are Stormwater Ponds More
Effective Than Presumed?—David A. Tomasko, Emily H. Keenan, Shayne Paynter,
and Megan Arasteh
12 FWPCOA Awards49 Florida Water Festival 56 Utilities Rally in Clearwater—Laura Davis
TECHNICAL ARTICLES14 Applicability of National Emissions Standards to Rehabilitate Asbestos-
Cement Pipelines—Bill Thomas and Edward Alan Ambler
28 Rx for Aging Infrastructure: Orange County Utilities Renewal andReplacement Program—Randy Krizmanich and Jim Broome
39 Ozonation of Reverse Osmosis Permeate For Sulfide Control: Clearwater’sNew Water Treatment Plant Approach—Timothy English II, Robert Maue,
Robert Fahey, Janice C. Bennett, Greg Turman, Glenn Daniel, and C. Robert Reiss
46 New Path to Permitting Aquifer Storage and Recovery Systems inFlorida—Mike Coates, Patrick Lehman, Craig Varn, and Douglas Manson
EDUCATION AND TRAINING23 CEU Challenge24 FSAWWA Fall Conference47 Florida Water Resources Conference
Call for Papers55 FWPCOA Training Calendar38 TREEO Environmental Training
COLUMNS11 Certification Boulevard—Roy Pelletier
36 FWEA Focus—Greg Chomic
38 C Factor—Jeff Poteet
44 Spotlight on Safety—Doug Prentiss Sr.
52 FSAWWA Speaking Out—Jason Parrillo
DEPARTMENTS51 New Products57 Service Directories60 Classifieds62 Display Advertiser Index
ON THE COVER: A 300-ton crane settlesreverse osmosis skids prior to a metalbuilding being erected around them.(photo: Garney Construction)

David A. Tomasko, Emily H. Keenan,Shayne Paynter, and Megan Arasteh
Stormwater detention is a serious concernfor communities in Florida. On average, thestate receives between 50 and 65 in. of rainfallevery year, from about 120 storms. The drink-ing water for more than 90 percent of Florid-ians comes from groundwater, so pollutantloads from runoff (which commonly includesuch chemical nutrients as nitrogen and phos-phorus) must be managed to prevent themfrom entering the water supply.
A key element in stormwater managementis the design and construction of wet detentionponds, which have been found to be an afford-able and viable system for pollutant removal. Butexactly what quantity of pollutants can wet de-tention ponds remove? Are wet detention pondsany more effective than is currently believed? Willnew nutrient-removal requirements proposed bythe Florida Department of Environmental Pro-tection (FDEP) be too stringent or too costly forwet detention ponds to comply?
The study described here attempts to an-swer these questions.
Regulatory Background
The FDEP has developed draft rules that,if implemented, would require many currentstormwater treatment systems to be modified(FDEP, 2010). To avoid water quality violations,these same rules may require more stringentnutrient (nitrogen and phosphorus) removal,particularly in areas where downstream watershave been “verified impaired” due to nutrient-related water quality concerns.
Under the modified rule, a minimumlevel of stormwater treatment would be re-quired to meet the new performance stan-dards. One of the following two options wouldbe required:1. An 85 percent reduction of the postdevel-
opment average annual loading of nutrientsfrom a site.
2. A reduction in nutrient loads such that thepostdevelopment average annual nutrientloading would not exceed the amount ex-pected from the site’s former natural land-scape.
Currently, wet detention systems forstormwater treatment are designed and per-mitted under the assumption that the volumeof water they receive during storm events canbe held on site for enough time to reduce in-coming loads of total nitrogen (TN) by ap-proximately 30 percent. But, based onconventional assumptions, the proposed newstormwater rules would make it nearly impos-sible for wet detention ponds—an affordableand widely used stormwater treatment systemin Florida—to comply.
In addition, the current regulatory guide-lines for “impaired water” require nutrientloading calculations to demonstrate no addi-tional impairment by any proposed construc-tion project, which can require larger, moreexpensive, ponds. In some cases, the requiredpollution reduction is greater than a wet pondcan provide, which can require the constructionof a dry pond or other more costly options.
A study was conducted in an attempt todetermine if wet detention ponds, as currentlydesigned, are:� More effective in pollutant removal than is
commonly assumed.� Able to comply with the intent of FDEP’s
proposed new performance criteria.
Nutrients and Water Quality Impacts
All water bodies in Florida are evaluatedby either the U.S. Environmental ProtectionAgency (EPA) or FDEP to assess their waterquality status. An excess of nitrogen and/orphosphorus can result in the overproductionof phytoplankton (algae), which is measuredin units of chlorophyll-a (a pigment found inall plants).
With the adoption of numeric nutrientconcentration criteria (NNC) by both FDEPand EPA, water bodies are now characterizedbased on chlorophyll-a and nutrient concen-trations combined. In estuarine systems, nitro-
4 October 2013 • Florida Water Resources Journal
Assessing the Environmental Impact: Are Stormwater Ponds
More Effective Than Presumed?
Continued on page 6
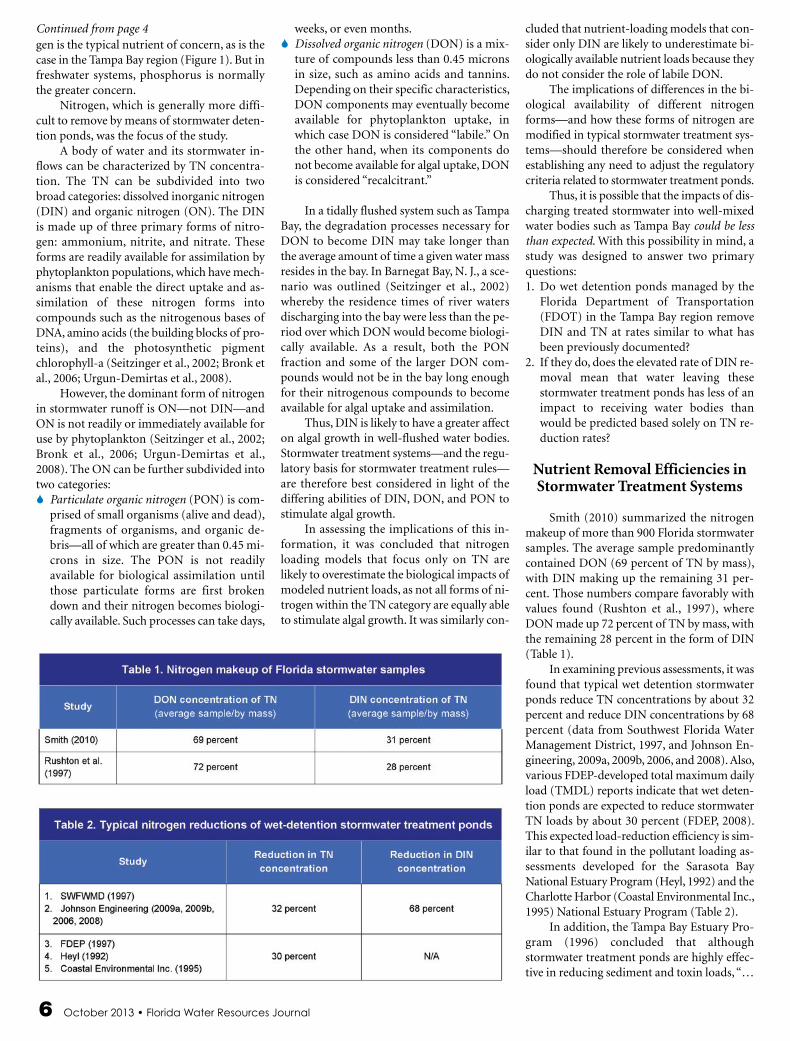
Figure 1. Tampa Bay Region ofFlorida Showing HillsboroughBay and Tampa Bay.

6 October 2013 • Florida Water Resources Journal
gen is the typical nutrient of concern, as is thecase in the Tampa Bay region (Figure 1). But infreshwater systems, phosphorus is normallythe greater concern.
Nitrogen, which is generally more diffi-cult to remove by means of stormwater deten-tion ponds, was the focus of the study.
A body of water and its stormwater in-flows can be characterized by TN concentra-tion. The TN can be subdivided into twobroad categories: dissolved inorganic nitrogen(DIN) and organic nitrogen (ON). The DINis made up of three primary forms of nitro-gen: ammonium, nitrite, and nitrate. Theseforms are readily available for assimilation byphytoplankton populations, which have mech-anisms that enable the direct uptake and as-similation of these nitrogen forms intocompounds such as the nitrogenous bases ofDNA, amino acids (the building blocks of pro-teins), and the photosynthetic pigmentchlorophyll-a (Seitzinger et al., 2002; Bronk etal., 2006; Urgun-Demirtas et al., 2008).
However, the dominant form of nitrogenin stormwater runoff is ON—not DIN—andON is not readily or immediately available foruse by phytoplankton (Seitzinger et al., 2002;Bronk et al., 2006; Urgun-Demirtas et al.,2008). The ON can be further subdivided intotwo categories: � Particulate organic nitrogen (PON) is com-
prised of small organisms (alive and dead),fragments of organisms, and organic de-bris—all of which are greater than 0.45 mi-crons in size. The PON is not readilyavailable for biological assimilation untilthose particulate forms are first brokendown and their nitrogen becomes biologi-cally available. Such processes can take days,
weeks, or even months.� Dissolved organic nitrogen (DON) is a mix-
ture of compounds less than 0.45 micronsin size, such as amino acids and tannins.Depending on their specific characteristics,DON components may eventually becomeavailable for phytoplankton uptake, inwhich case DON is considered “labile.” Onthe other hand, when its components donot become available for algal uptake, DONis considered “recalcitrant.”
In a tidally flushed system such as TampaBay, the degradation processes necessary forDON to become DIN may take longer thanthe average amount of time a given water massresides in the bay. In Barnegat Bay, N. J., a sce-nario was outlined (Seitzinger et al., 2002)whereby the residence times of river watersdischarging into the bay were less than the pe-riod over which DON would become biologi-cally available. As a result, both the PONfraction and some of the larger DON com-pounds would not be in the bay long enoughfor their nitrogenous compounds to becomeavailable for algal uptake and assimilation.
Thus, DIN is likely to have a greater affecton algal growth in well-flushed water bodies.Stormwater treatment systems—and the regu-latory basis for stormwater treatment rules—are therefore best considered in light of thediffering abilities of DIN, DON, and PON tostimulate algal growth.
In assessing the implications of this in-formation, it was concluded that nitrogenloading models that focus only on TN arelikely to overestimate the biological impacts ofmodeled nutrient loads, as not all forms of ni-trogen within the TN category are equally ableto stimulate algal growth. It was similarly con-
cluded that nutrient-loading models that con-sider only DIN are likely to underestimate bi-ologically available nutrient loads because theydo not consider the role of labile DON.
The implications of differences in the bi-ological availability of different nitrogenforms—and how these forms of nitrogen aremodified in typical stormwater treatment sys-tems—should therefore be considered whenestablishing any need to adjust the regulatorycriteria related to stormwater treatment ponds.
Thus, it is possible that the impacts of dis-charging treated stormwater into well-mixedwater bodies such as Tampa Bay could be lessthan expected. With this possibility in mind, astudy was designed to answer two primaryquestions:1. Do wet detention ponds managed by the
Florida Department of Transportation(FDOT) in the Tampa Bay region removeDIN and TN at rates similar to what hasbeen previously documented?
2. If they do, does the elevated rate of DIN re-moval mean that water leaving thesestormwater treatment ponds has less of animpact to receiving water bodies thanwould be predicted based solely on TN re-duction rates?
Nutrient Removal Efficiencies inStormwater Treatment Systems
Smith (2010) summarized the nitrogenmakeup of more than 900 Florida stormwatersamples. The average sample predominantlycontained DON (69 percent of TN by mass),with DIN making up the remaining 31 per-cent. Those numbers compare favorably withvalues found (Rushton et al., 1997), whereDON made up 72 percent of TN by mass, withthe remaining 28 percent in the form of DIN(Table 1).
In examining previous assessments, it wasfound that typical wet detention stormwaterponds reduce TN concentrations by about 32percent and reduce DIN concentrations by 68percent (data from Southwest Florida WaterManagement District, 1997, and Johnson En-gineering, 2009a, 2009b, 2006, and 2008). Also,various FDEP-developed total maximum dailyload (TMDL) reports indicate that wet deten-tion ponds are expected to reduce stormwaterTN loads by about 30 percent (FDEP, 2008).This expected load-reduction efficiency is sim-ilar to that found in the pollutant loading as-sessments developed for the Sarasota BayNational Estuary Program (Heyl, 1992) and theCharlotte Harbor (Coastal Environmental Inc.,1995) National Estuary Program (Table 2).
In addition, the Tampa Bay Estuary Pro-gram (1996) concluded that althoughstormwater treatment ponds are highly effec-tive in reducing sediment and toxin loads, “…
Continued from page 4

Florida Water Resources Journal • October 2013 7
wetland retention/detention is not as effectivefor reducing nitrogen.”
While these conclusions are accurate, theform of nitrogen in stormwater ponds is justas important as the total amount of nitrogen,if not more so, which renders such conclusionsincomplete.
Current evaluations of the effectivenessof stormwater treatment ponds focus only onTN removal. However, DIN and labile DONare the nitrogen forms that are more biologi-cally relevant to phytoplankton production.
Stormwater Treatment Pond Efficiencies: Biologically
Relevant Versus Total Loads
As an example of the potential differencein presumed efficiencies, consider a hypothet-ical scenario in which 100 metric tons (MT)of nitrogen enter a stormwater treatmentpond. As noted in Table 2, the widely acceptedexpectation is that about 30 percent of thatload would be reduced through in-pondprocesses such as burial, uptake by littoral veg-etation, denitrification, and so forth. There-fore, an estimated 70 MT of nitrogen wouldbe left in the pond (100 - 30 = 70).
Of the 70 MT of TN leaving the pond inoutflows, studies show that about 10 percent(7 MT) would be expected to be in the formof DIN, with the remaining 63 MT in the formof DON (Rushton et al., 1997). Of the 63 MTof DON, the amount of DON that would ul-timately be considered biologically availablefor phytoplankton uptake would be 30 per-cent, on average (Wiegner et al., 2006). There-fore, the amount of labile DON would beabout 19 MT (0.3 x 63 = 18.9, rounded to 19).
The result is that 26 MT of TN would po-tentially be biologically available for phyto-plankton assimilation, or 19 MT of labileDON plus 7 MT of DIN (Figure 2). Consider-ing that 100 MT of total nitrogen entered thepond in this hypothetical example, a typicalstormwater treatment pond could convert 100MT of TN into 26 MT of potentially availablenitrogen in its discharge, which yields an nu-trient-reduction efficiency of 74 percent, notthe widely accepted value of 30 percent that isused in loading models and other guidancedocuments.
Therefore, existing and planned stormwa-ter treatment ponds may be more efficient atreducing nutrients than their presumed effi-ciencies would suggest, which means that theimpact of treated stormwater on algal popula-tions in a well-mixed water body (such asTampa Bay) could be minimal.
This hypothesis is based on the followinglogic:� Water discharging from stormwater treatment
ponds has much lower levels of inorganic nu-
trients than water entering such ponds.� The organic forms of nutrients that charac-
terize the majority of nutrients dischargedfrom these ponds are much more refractorythan inorganic forms of nutrients.
A Study of Wet Detention Ponds inFlorida’s Tampa Bay Region
In 2011, the FDOT District 7 funded astudy in Florida’s Tampa Bay region to test thereal-world nutrient-removal efficiency ofstormwater detention ponds.
One of the study objectives was to quan-tify the biologically relevant nutrient-removalefficiency of typical wet detention ponds; themethod used was to measure phytoplanktonresponses to nutrient additions from both di-rect and treated stormwater runoff.
Three stormwater ponds where selectedfor the source of incubation waters from bothinflows and outflows (ponds referred to hereinas D, 3S, and 1). The drainage basin for eachpond was comprised solely of transportationinfrastructure. Each stormwater pond is lo-cated in Tampa and discharges to a portion ofTampa Bay (Figure 1). Samples from Hillsbor-ough Bay (a subsection of nitrogen-limitedTampa Bay) were used to represent receivingwater and potential phytoplankton responsesto treated and untreated stormwater runoff,and the study itself was comprised of severalproject phases.
Phase I: Determining MethodologyPhase I of the study consisted of evaluat-
ing methodologies (using data from only PondD) and refining techniques, one of which wasused for the remainder of the study. Pond D
stormwater inflows were collected during arain event on March 2, 2011. A fixed volumeof Hillsborough Bay water (365 mL) was in-oculated with various quantities of water (1 to50 ml) from Pond D inflow and incubated forvarious periods of time (8 to 24 hours) whilesuspended in the water column of Hillsbor-ough Bay (Figure 3).
Both the initial and final chlorophyll-aconcentrations from each inoculation/incuba-tion scenario were evaluated to identify thebest methodology to use for the rest of thestudy. Based upon that initial evaluation, 15ml of stormwater inflow or outflow to inocu-late 365 ml of Hillsborough Bay water wereused, with an incubation period of 24 hours(Figure 4).
Phase II: Ensuring the Methodology Ad-dresses the Hypothesis
In Phase II, the ability of the preferredtechnique to address the proposed hypothesiswas assessed, namely, that stormwater pondstreat water in such a way that biologically rele-vant nutrient-load reductions exceed presumedefficiencies. Phase II used stormwater inflowand outflow collected on March 29, 2011(again, using data from only Pond D).
Phase III: Testing Stormwater Inflow/Out-flow From Three Ponds
Phase III determined the DIN, DON, andchlorophyll-a concentrations in stormwaterinflow and outflow from three ponds (PondsD, 3S, and 1) using samples collected on Aug.29, 2011 (during Florida’s “wet” season) andOct. 9, 2011 (the beginning of Florida’s “dry”season).
Figure 2. Pathway of Potential
Nitrogen Removalin a Typical
Stormwater Pond.
Continued on page 8

8 October 2013 • Florida Water Resources Journal
Phase IIIM: Testing Filtered and UnfilteredStormwater From Two Ponds
Finally, a modified version of Phase-IIItesting—called Phase IIIM—was conductedusing filtered and unfiltered stormwater inflowand outflow from only two ponds (1 and D);the samples were collected on Jan. 11, 2012 (inthe middle of Florida’s dry season).
For Phases III and IIIM, the initial nutrientand chlorophyll-a concentration of sample bot-
tles were quantified and the bottles were thensuspended in the water column of HillsboroughBay for the 24-hour incubation period. After in-cubation, the final nutrient and chlorophyll-aconcentrations of each bottle were measured.
Results and Discussion
Nutrient concentrations of the stormwa-ter pond inflow and outflow were measuredduring Phases II, III, and IIIM (Table 4). Thesemeasurements reveal that:
1. Inflows were dominated by DON, not DIN.This suggests that TN loads from roadrunoff are mostly comprised of nitrogenforms that are not as biologically availablefor algal assimilation as nutrient loads withhigher DIN contents.
2. Pond outflows became even more domi-nated by DON as DIN was removed fromthe water column.
3. The FDOT ponds reduced DIN concentra-tions at rates consistent with existing liter-ature.
The DIN concentrations were greatest inthe inflow when compared to the outflow ofthe ponds for all sampling events (Table 4). Inpond inflows, DIN comprised from 13 to 46percent of TN. On average, DIN comprised 29percent of the TN load.
Outflow DIN represented between 1 and8 percent of the TN load, with an average of 3percent. Water discharging from the pondscontained a much smaller percentage of TN,in the form of the more biologically availableDIN fraction.
Phytoplankton Response to StormwaterInput
Initial and final chlorophyll-a concentra-tions were measured during every phase of thestormwater inoculation study. The results sug-gest that neither inflows nor outflows toand/or from the ponds tested were consistentlycapable of stimulating phytoplankton growthin bottles filled with ambient water from Hills-borough Bay (Table 5).
For the seven events where pond inflowswere tested, chlorophyll-a concentrations in-creased three times. But, for two of thosetimes, the increase was 2 µg/L or less—a valuenot much greater than the detection limit it-self.
Continued from page 7
Figure 3. Study Apparatus With Bottles Used to Suspend Stormwater Samples in Water Column (left). Apparatus With SamplesIncubating in Hillsborough Bay (right).
Table 3. Chlorophyll-a Results From Phytoplankton Response Evaluation Experiment[“DI Blank” refers to “laboratory blank” samples containing no runoff or bay wa-ters; “HB Blank” refers to “experimental blank” samples from Hillsborough Bay con-taining no added runoff].

Florida Water Resources Journal • October 2013 9
For the seven events where pond outflowswere tested, chlorophyll-a concentrations alsoincreased three times, but for only one of thosetimes was the increase 2 µg/L or less. A phyto-plankton response as a result of bay-water in-oculation using pond outflow was observedduring the Phase-III sampling event in Octo-ber 2011, which is what led to the Phase-IIIMportion of the study.
Evaluating the Role of Pond Phytoplanktonon Incubation Bottles
It was thought that the unexpected phy-toplankton response observed using stormwa-ter pond outflows in October 2011 could becaused by the presence of saline-tolerant phy-toplankton from the ponds that continued togrow in the estuarine waters within the incu-bation bottles. Commonly, phytoplanktonsfound in stormwater ponds are from the classCyanophyceae, specifically in the genera Micro-cystis and Oscillatoria (Wanielista et al., 2006;Drescher, 2011), which have been reported tosurvive in both freshwater and marine envi-ronments, with some species being able to tol-erate salinity ranges as broad as 0 to 30 ppt(Liu, 2006; Dube et al., 2010; Mur et al., 1999;Tonk et al., 2007).
An evaluation of nitrogen concentrationsfrom Hillsborough Bay during the August andOctober 2011 experiments indicates signifi-cantly more inorganic nitrogen in the bay inOctober, when a chlorophyll-a increase wasobserved in the incubation bottles; DIN val-ues of 0.06 mg/L were measured in August, butthe value rose to 0.40 mg/L in October. It wassurmised that the phytoplankton response ob-served in October was likely related to saline-tolerant phytoplankton from the stormwaterpond assimilating the abundant supply of in-organic nitrogen in Hillsborough Bay.
To determine if their assumption couldexplain the October 2011 results, the authorsperformed a modified version of their Phase-III experiment (Phase IIIM). Before incuba-tion, inflow and outflow samples were filteredusing a syringe and 0.45 micron filter to re-move phytoplankton.
The final chlorophyll-a concentrationsmeasured during Phase IIIM showed a lack ofphytoplankton response when using filteredpond outflow samples (Table 6). Specifically,outflow from Pond 1, which exhibited elevatedinitial chlorophyll-a concentrations (75 µg/L)during Phase III, showed a decrease in chloro-phyll-a concentration when compared to un-filtered inoculation. This was expected, and isconsistent with the hypothesis that phyto-plankton from the stormwater ponds hadgrown in incubation bottles during the Octo-ber 2011 experiment. These results support thecontention that stormwater pond dischargesdid not cause the growth of phytoplanktonwithin Hillsborough Bay during the October
2011 experiment. Rather, pond algae grew inOctober as a result of elevated DIN levels inHillsborough Bay.
Conclusion
Taken together, the study results suggestthat:� The findings complement existing litera-
ture, confirming that wet stormwater de-tention ponds reduce TN concentrations byapproximately 30 percent—but they alsoreduce DIN concentrations by more than80 percent.
� In most cases, stormwater runoff fromtransportation land use was not able tostimulate algal growth in Hillsborough Bay.
� Also, in most cases, water discharging fromFDOT stormwater ponds was not able tostimulate algal growth in Hillsborough Bay.However, there is evidence that algal popu-lations in these ponds include genera withfairly wide salinity tolerance levels, and it ispossible for these algae to survive in thehigher-salinity waters of HillsboroughBay—at least over a 24-hour period.
Continued on page 10

10 October 2013 • Florida Water Resources Journal
The results indicate that the three FDOTponds studied may be more efficient at reduc-ing downstream environmental impacts thantheir presumed TN load-reduction efficiencyof 30 percent. It appears that additional mod-ifications to wet stormwater detention ponddesigns may not be needed—at least for FDOTprojects—because the ponds may be better atremoving biologically relevant forms of nutri-ents (average of 86 percent) than is currentlyassumed.
Most importantly for FDOT, wet deten-tion ponds appear to provide sufficient envi-ronmental benefits when taking into accountthe biologically relevant forms of nitrogen instormwater runoff that are found in well-flushed and nitrogen-limited water bodies.Given the hydraulic grade-line limitationsfaced by many FDOT projects, the ability to usewet detention ponds offers substantial cost sav-ings over other stormwater detention solutions.
Proposed statewide stormwater rules couldrequire detention solutions to remove 85 percentof nitrogen loads. The good news is that wet de-tention ponds appear to be able to comply withthe intent of Florida’s proposed new rules—if theconversion of nitrogen into biologically lessavailable forms is considered. That, in turn, mayeliminate the need to build larger, more costlydry retention ponds or dry-wet treatment trainsin many (if not most) situations.
Literature Cited
• Bronk D., J. See, P. Bradley, and L. Killberg,2006. DON as a source of bioavailable ni-trogen for phytoplankton. BiogeosciencesDiscuss 3: 1247-1277.
• Coastal Environmental Inc., 1995. Estimatesof Total Nitrogen, Total Phosphorus, andTotal Suspended Solids Loadings to Char-lotte Harbor, Florida. Final Report to South-west Florida Water Management District,Tampa, Fla.
• FDEP, 2008. Total Maximum Daily Load forNutrients for the Lower St. Johns River. FinalReport. 146 pp.
• FDEP, 2008. Stormwater Management: AGuide for Floridians. 72 pp.
• FDEP, 2010. Environmental Resource Per-mit Stormwater Quality Applicant’s Hand-book: Design Requirements for StormwaterTreatment Systems in Florida.
• Heyl, M. G., 1992. Point and nonpointsource pollutant loading assessment, p. 12.1–12.9. P. Roat, C.
• Ciccolella, H. Smith, and D. Tomasko (eds.),Sarasota Bay Framework for Action. Sara-sota Bay National Estuary Program, Sara-sota, Fla.
• Johnson Engineering, 2006. FDOT DistrictOne: Richard Road Wet Detention PondWater Quality Monitoring Report. Final Re-port submitted to FDT District One.
• Johnson Engineering, 2009a. FDOT DistrictOne: Hendry County Wet/Dry DetentionPond Water Quality Monitoring Report.Final Report submitted to FDT District One.
• Johnson Engineering, 2009b. FDOT DistrictOne: Flamingo Drive Wet Detention PondWater Quality Monitoring Report. Final Re-port submitted to FDT District One.
• Johnson Engineering, 2008. FDOT DistrictOne: US41 Wet/Dry Detention Pond WaterQuality Monitoring Report. Final Reportsubmitted to FDT District One.
• Montgomery, R. T., McPherson, B.F., and E.E. Emmons, 1991. Effects of Nitrogen andPhosphorus
• Additions on Phytoplankton Productivityand Chlorophyll a in a Subtropical Estuary:Charlotte Harbor, Florida. U.S. GeologicalSurvey, Water Resources Investigations Re-port 91-4077. Tampa, Fla.
• Petrone, K., Unknown date. Organic Car-bon and Nitrogen Composition andBioavailability: New Tools to Assess AquaticEcosystem Condition, Inform Water Qual-ity Targets, and Guide Restoration Activities.CSIRO. Presentation.
• Rushton, B., Miller, C., Hull, C., and J. Cun-ningham, 1997. Three Design Alternativesfor Stormwater Detention. Final Report forSouthwest Florida Water Management Dis-trict. 284 pp.
• Seitzinger, S., Sanders, R. And R. Styles, 2002.Bioavailability of DON from natural and an-thropogenic sources to estuarine plankton.Limnology and Oceanography 47(2): 353-366.
• Smith, D.P., 2010. Advanced Processes to In-crease Stormwater Nitrogen Reduction.Presentation to Florida Stormwater Associa-tion Annual Conference, Sanibel, Fla.
• Tampa Bay Estuary Program, 1996. Chart-ing the Course – The Comprehensive Con-servation and Management Plan for TampaBay. Tampa Bay National Estuary Program,St. Petersburg, Fla., 263 pp.
• Urgun-Demirtas, M., C. Sattayatewa, and K.Pagilla, 2008. Bioavailability of DissolvedOrganic Nitrogen in Treated Effluents. WaterEnvironment Research 80 (5): 398-406.
• Wiegner, T., S. Seitzinger, P. Gilbert, and D.Bronk, 2006. Bioavailability of DissolvedOrganic Nitrogen and Carbon From NineRivers in the Eastern United States. AquaticMicrobial Ecology 43:277-287.
David A. Tomasko, Ph.D., is a principaltechnical professional, Emily H. Keenan, is a sen-ior scientist, and Shayne Paynter Ph.D., P.E.,P.G., is drainage group manager with Atkins inTampa. Megan Arasteh, P.E., is the Florida De-partment of Transportation District 7 drainageengineer in Tampa. ��
Continued from page 9

1. Given the following data, what is the solidsloading rate on this secondary clarifier?• Plant influent flow is 5.5 mgd• The return activated sludge (RAS) rate
is 50 percent of Q• There is one 100-ft diameter secondary
clarifier• The aeration mixed liquor suspended
solids (MLSS) is 2,200 mg/L
a. 19.3 lbs/day/ft2 b. 8.6 lbs/day/ft2
c. 28.9 lbs/day/ft2 d. 15.5 lbs/day/ft2
2. Which is the highest life form in the acti-vated sludge process: a free swimming cil-iate, a stalked ciliate, or a rotifer?
a. Free swimming ciliateb. Stalked ciliatec. Rotiferd. They are all the same.
3. What is the best definition of a shock load?
a. An unexpected bump.b. A strong influent waste strength.c. A high concentration of total sus-
pended solids (TSS).d. A heavy truck load entering the plant.
4. Which condition may produce the worstdenitrification efficiency in an aerationtank?
a. Low air supplyb. High aeration dissolved oxygen c. Low aeration dissolved oxygend. Low solids retention time (SRT)
5. Which activated sludge growth phase isconsidered to have the lowest food-to-microorganism (F/M) ratio, the highestSRT, the lowest sludge yield, and the worstoxygen utilization efficiency?
a. High rate aerationb. Extended aerationc. Conventional aerationd. Declining growth
6. Which group of bacteria is responsible forconversion of inorganic ammonia in waste-water?
a. Carbon eaters b. Methanogensc. Autotrophic d. Heterotrophic
7. Which two age parameters are most similarto each other?
a. Gould sludge age (GSA) and F/M ratiob. SRT and mean cell residence time
(MCRT)c. SRT and GSAd. GSA and MCRT
8. Which group of bacteria is most responsi-ble for removal of phosphorus in the bio-logical nutrient removal (BNR) activatedsludge process?
a. Sludge volume index (SVI)b. GSAc. Autotrophicd. Phosphorus-accumulating organism
(PAO)
9. How much alkalinity is required to con-vert 1 lb of ammonia-nitrogen during thenitrification process?
a. 7.14 lbsb. 8.34 lbsc. 7.48 lbsd. 4.57 lbs
10. What will organic material do in a mufflefurnace?
a. It will burn.b. It will not burn.c. It will change to inorganic material.d. It will convert to dissolved solids.
Answers on page 62
Readers are welcome to submitquestions or exercises on water or wastewater treatment plantoperations for publication inCertification Boulevard. Send your question (with the answer) or your exercise (with the solution) by email [email protected], or by mail to:
Roy PelletierWastewater Project Consultant
City of Orlando Public Works DepartmentEnvironmental Services
Wastewater Division5100 L.B. McLeod Road
Orlando, FL 32811407-716-2971
LOOKING FOR ANSWERS? Check the Archives
Certification Boulevard
Roy Pelletier
SEND US YOURQUEST IONS
Test Your Knowledge of VariousWastewater Treatment Topics
Are you new to the water andwastewater field? Want to boostyour knowledge about topics youʼllface each day as a water/waste-water professional?
All past editions of CertificationBoulevard through the year 2000 are
available on the Florida Water Envi-ronment Associationʼs website atwww.fwea.org. Click the “Site Map”button on the home page, then scrolldown to the Certification BoulevardArchives, located below the Opera-tions Research Committee.
Florida Water Resources Journal • October 2013 11

12 October 2013 • Florida Water Resources Journal
FWPCOA AWARDS
Awardees Honored at Fall State Short SchoolThe Florida Water & Pollution Control Operators Association recognized several outstanding water/wastewater professionals, utilities, and
facilities during its Fall State Short School for operational excellence, service to the Association, and outstanding safety records. The school washeld in August at the Indian River State College in Fort Pierce.
Dr. A.P. Black Award—Water Plant OperatorAward of Excellence
Johnnie C. Jones, Seminole Tribe Public Works
Dr. A.P. Black Award—Wastewater Plant Oper-ator Award of Excellence
Albert Bock, Bay County Utility Services
Robert Hellman Award—Industrial Pretreat-ment Award of Excellence
Gary Thrift, Bay County Utility Services
Nathan Pope Award—Stormwater SystemsOperator Award of Excellence
Duncan Bethel, City of Pompano Beach
Joseph V. Towry Award—Reclaimed WaterService Award of Excellence
Leigh Ann McDonald
Outstanding Website AwardCity of North Port
Accepted by Jessica Lawrence.
Above: Attendees networking atlunch.
At right: Tim McVeigh, executivedirector; Jeff Poteet, president;
and Renee Moticker, AwardsCommittee chair, all with
FWPCOA, discuss the awardspresentation at the luncheon.
At left: Instructor leadsa discussion with thestudents.
Below:Attendees inclass review their educational materials.
SHORT SCHOOL ACTIVITIES

Florida Water Resources Journal • October 2013 13
City of Pompano Beach Utilities DepartmentAccepted by Jerry Criscito.
City of Stuart Water Treatment FacilityAccepted by Mike Woodside.
City of Lake Wales Water DepartmentAccepted by Holly Britt.
Island Water Association Reverse OsmosisTreatment Plant
Accepted by Gustave Dowd and Bryan Nespoli.
Burnt Store Water Reclamation FacilityAccepted by John Thompson.
Woodard & Curran—Water Conserv II Distri-bution
Accepted by Glenn Burden.
Gateway Wastewater Treatment FacilityFt. Myers Beach Wastewater Treatment Plant
Accepted by Ben Wright.
Marco Island Reclaimed Water FacilityAccepted by Jake Hepokoski.
City of Oakland Park Stormwater SystemAccepted by Art Saey.
Gainesville Wastewater Collection SystemAccepted by Charles Mann.
Gainesville Water Distribution SystemAccepted by Tim Lowe.
Hillsborough County Distribution Collection Division
Accepted by John Appenzeller.
SAFETY AWARDS

14 October 2013 • Florida Water Resources Journal
The United States is currently facing sig-nificant deficits in drinking water andclean water infrastructure operation,
maintenance, and capital costs. A significantamount of the existing infrastructure is as-bestos-cement (A-C) pipe, and rehabilitationof the pipe is restricted by regulations that arealmost 30 years old and do not account for ad-vancement in new technology. The A-C pipeis considered to be a Category II nonfriable as-bestos-containing material, according to theNational Emissions Standards for HazardousAir Pollutants (NESHAP). Rehabilitatingburied A-C pipelines is subject to NESHAPand according to regulators, if the pipe iscrumbled, pulverized, or reduced to powder,and the length is at least 260 lineal ft, it fallsunder NESHAP guidelines. However, NE-SHAP does not address pipe bursting or anyother rehabilitation method other than directremoval and does not include clear require-ments for rehabilitating buried A-C pipelinesin public right-of-ways.
There have been great strides made intechnological advancement since NESHAPwas issued. Killebrew Inc. arranged for indus-try members to travel to Washington, D.C., inorder to meet with U.S. Environmental Pro-tection Agency (EPA) staff for the purpose ofdiscussing NESHAP and its applicability to re-habilitating buried A-C pipelines using pipebursting technology. This article presents: (1)the technological advancements in industrypractices and NESHAP requirements for re-habilitating buried A-C pipelines; (2) recentcommunications with EPA and industry rep-
resentatives; and (3) plans for the developmentof an EPA administrator-approved alternate,as provided for in NESHAP, that specificallyaddresses rehabilitating buried A-C pipelinesvia pipe bursting.
Origins of Asbestos Pipe
Asbestos, a naturally occurring mineralfiber, was used extensively in many buildingmaterials prior to the adoption of NESHAP. Itsproperties, such as fire and chemical resist-ance, flexibility, high strength, and long andthin fibrous shape, made it a desirable com-ponent for the manufacturing of many con-struction materials, including insulation,roofing shingles, floor and ceiling tiles, paperproducts, brake pads, gaskets, and pipe. Orig-inally, A-C pipe was manufactured using Port-land cement, water, silica or silica-containingmaterials, and asbestos fibers. The A-C pipewas well suited for utility systems and waswidely used for drinking water, wastewater,and stormwater pipelines from the 1940sthrough the 1960s. This time frame corre-sponded with a significant investment in util-ity infrastructure in the U.S. Figures 1 and 2highlight the EPA “Clean Water and DrinkingWater Gap Analysis,” which was published in2002 and illustrates key infrastructure growthperiods associated with increased popularityof installing A-C pipe.
Under the Clean Air Act, EPA developedthe NESHAP regulations. Asbestos, considereda hazardous air pollutant, became federallyregulated in 1973 when NESHAP (40 CFR 61,
Subpart M) was promulgated. The NESHAPaddresses milling, manufacturing and fabri-cating operations, demolition and renovationactivities, waste disposal issues, active and in-active waste disposal sites, and asbestos con-version processes. After adoption of NESHAP,asbestos fiber content in pipe was reducedfrom a maximum of 20 percent down to lessthan 0.2 percent (Von Aspern, 2009). Manu-facturing and installation of A-C pipe in theU.S. ceased shortly thereafter.
Asbestos Pipe in North America
In 2002, EPA estimated the total amountof potable water distribution pipe in the U.S.to be 863,000 mi, with an annual rate of newinstallation at 11,900 mi (EPA, “Costs forWater Distribution System Rehabilitation,”2002). The EPA estimated the total amount offorce main system as 60,000 mi in 2010, (EPA,“State of Technology of Force Main Rehabili-tation,” 2010). In 2002, an American WaterWorks Association survey of 337 large utilitiesserving nearly 60 million customers foundthat 15.2 percent of distribution systems werecomposed of A-C pipe. An informal survey
Applicability of National Emissions Standardsto Rehabilitate Asbestos-Cement Pipelines
Bill Thomas and Edward Alan Ambler
Bill Thomas, Ph.D., P.E., is president withKillebrew Inc. Edward Alan Ambler, P.E.,LEED, AP, is water resources manager withCity of Casselberry.
F W R J
Continued on page 16
Figure 1. Age Distribution of Current Inventory of Pipe for 20Cities Evaluated in EPA Gap Analysis.
Figure 2. Miles of Sanitary Sewer Pipe installed perDecade as Shown in EPA Gap Analysis.

Florida Water Resources Journal • October 2013 15

16 October 2013 • Florida Water Resources Journal
using public information sources on the In-ternet revealed that much of the A-C pipe wasinstalled in the Western U.S. (Table 1). Sub-stantial portions have been in use for 40 to 60years, the typical life expectancy of A-C pipe.
Many efforts have been made to quantifythe amount of A-C pipe installed in the U.S.,and the perceived amount varies. While it isdifficult to accurately measure how much A-Cpipe remains in the ground, and its condition,there is currently an estimated 630,000 mi ofA-C pipe in the U.S. and Canada (Von Aspern,2009). However, it is clear that much of thispipe is reaching the end of its service life andrequires immediate maintenance, replace-ment, and/or rehabilitation.
For the current planning period of 2000to 2019, the EPA gap report indicates severedeficits in operation and maintenance (O&M)and capital investments in both clean waterand drinking water infrastructure. The annualO&M deficit for clean water totals up to $229billion, while the capital deficit is up to $177billion. The annual O&M deficit for drinking
water totals up to $495 billion, while the capi-tal deficit is projected to top $267 billion. Thetotal 20-year deficit of clean water and drink-ing water O&M and capital costs could be ashigh as $1.168 trillion (EPA, “Clean Water andDrinking Water Gap Analysis,” 2002). Reha-bilitation of the estimated A-C pipe in the U.S.and Canada potentially could cost both coun-tries upwards of $332 billion, assuming amoderately conservative price of $100 per linft. A signficant amount of the funding gap canbe attributed to maintenance and replacementof A-C pipe. Life cycle cost analysis illustratesthat maintenance costs rise as the A-C pipeages, and there is an optimal replacement time,as shown in Figure 3 (Frangopol, 2001).
In 2010, EPA published a document onaging water infrastructure research, which re-flected a focus to utilize science and innova-tion to breach the funding gap for clean waterand drinking water. Industry members whoare knowledgeable of pipe bursting under-stand that this newer technology could be avery effective tool for replacement of the in-frastructure. However, pipe bursting has beenseverely limited by widely varying interpreta-tions of NESHAP when utilized to replace A-C pipe across the U.S.
It appears that EPA has delegated admin-istration and enforcement of asbestos regula-tions to many of the individual states. Programadministration often falls to a statewide de-partment that enforces many environmentalpolicies (Brahler, 2011). Interpretation and ap-plication of NESHAP by regulators and the in-dustry for replacing or rehabilitating theseaging A-C pipelines are varied and have beencontroversial for more than two decades. In-terpretations have ranged from requiring theremoval and disposal of A-C pipelines and ex-tensive recordkeeping, to allowing any replace-
ment, abandonment,or rehabilitation tech-nique, and no record-keeping. The states ofNevada, Arizona, NewMexico, and Floridaallow pipe bursting ofA-C pipelines. Oregonrequires all A-C pipesto be removed if ex-posed for any reasonand requires speciallylicensed contractorsfor any work on A-Cpipelines. Californiadoes not allow pipebursting or any activ-ity that will break theA-C pipeline.
Pipe Bursting
Pipe bursting is an industry-proven tech-nology for trenchless replacement of existingunderground conduit systems, such as water,sewer, and gas. The existing pipe is replacedwith a new pipe of the same size or larger. Thistechnology has become cost-effective in manyapplications and varying project settings, andis most cost-effective in urban areas or wherethe existing pipe is structurally deteriorated oradditional capacity is needed (Simicevic,2001).
Pipe bursting is typically performed usingone of two methods: pneumatic or static pull.In either case, the existing pipe is fractured anddisplaced outward, while the new pipe ispulled into place along the existing pipe align-ment. Fracturing the existing pipe is accom-plished by pulling a conical-shaped head, alsocalled a bursting head, through the existingpipe that has a slightly larger outside diameterthan the inside diameter of the existing pipe.The new pipe is attached to the back of thebursting head so that it is simultaneously in-stalled as the bursting head is pulled throughthe existing pipe (American Society of CivilEngineers, 2006).
While pipe bursting is trenchless, it doesrequire some excavation work. Excavationstypically include a pipe insertion pit, machinepit, and service connection pits. The pipe in-sertion pit is constructed to allow the new pipeto transition from above ground to belowground at the same elevation and alignmentas the existing pipe to be pipe-burst. The ma-chine pit is constructed for the pipe burstingmachine to be placed and/or for retrieval ofthe bursting head. Service connection pits areconstructed to reinstate service laterals to themain after pipe bursting the main is com-pleted.
A pneumatic pipe bursting system uses aconstant tension winch and a cable to pull onthe nose of the bursting head, and an air-op-erated hammer inside the bursting head. Theair-operated hammer provides forward force(much like driving a nail with a hammer) andthe constant tension winch keeps the burstinghead against the existing pipe and maintainsthe path of the bursting operation. Air is de-livered to the air-operated hammer by way ofan air line that is placed inside the new pipe,and also to an air compressor that is aboveground near the pipe insertion pit. Figure 4depicts a typical pneumatic pipe bursting op-eration (ASCE, 2006).
A static pull pipe bursting system uses arod string to connect to the nose of the burst-ing head and a hydraulically operated machine(bursting machine) to pull the rod string,Figure 3. Life cycle cost graph.
Continued from page 14
Table 1. Percentage of installed AC pipeper type of pipe system.

Florida Water Resources Journal • October 2013 17
bursting head, and new pipe through the ex-isting pipe alignment. Forward force is pro-vided by the bursting machine. There is no aircompressor or air line passing through thenew pipe. Figure 5 depicts a typical static pullpipe bursting operation (ASCE, 2006).
Pipe bursting is typically accomplishedon existing pipe systems that range in sizefrom 2 in. to 36 in. in diameter. Althoughlarger diameter pipe bursting has been com-pleted, it is less common. Lengths that aremost common for a pipe burst run are typi-cally 200 to 400 ft; however, longer and shorterlengths can be performed without problemswhen properly planned. Actual lengths ofbursts are determined when planning and es-timating a pipe bursting project. Pits arestrategically planned to be located at or nearmanholes in gravity systems and fittings,valves, or service connections for pressure sys-tems.
Almost any underground pipe system canbe a candidate for pipe bursting, includingpotable water, reclaimed water, sanitary sewer,stormwater, gas, or telecommunications. Ex-isting pipe materials that are best suited forpipe bursting include vitrified clay, A-C, castiron, and nonreinforced concrete. Other ma-terials that can be burst, but are less common,include polyvinyl chloride (PVC), ductile iron,or high density polyethylene (HDPE). Themore brittle a material is, the easier it can bepipe-burst. Pliable materials like PVC, HDPE,and ductile iron are cut or sliced rather thanfractured. Pipes that are not recommended forpipe bursting include any corrugated material,such as corrugated metal and corrugated plas-tic. Corrugated pipes tend to collapse or tele-scope down on themselves due to not havingthe longitudinal strength to withstand theforces acting upon them during the pipebursting operation (Simicevic, 2001).
Jobsite conditions most cost-effective forpipe bursting are urban settings that contain
roadways, drainage systems, and other exist-ing utilities that would prevent or inhibit con-ventional open-cut installation of a new pipesystem. Pipe bursting requires substantiallyless excavation than conventional open-cutand does not require a new route for the pro-posed pipe system. Because pipe bursting min-imizes the amount of excavation on arehabilitation project versus traditional open-cut construction, impacts to developed neigh-borhoods and commercial areas withestablished landscaping are often minimized(Picture 1). This environmental benefit isoften overlooked but is one of the benefitsmost recognized by the residents and cus-tomers.
When planning a pipe bursting project,bypassing of flow and service interruptionmust be considered because the existing pipesystem must be taken out of service for thepipe bursting operation. In gravity systems,bypass pumping can be accomplished frommanhole to manhole. In pressure systems,valves or other isolation methods (line stops
or squeeze-offs) can be utilized to interruptthe flow long enough to isolate a segment ofexisting pipe for pipe bursting. With properplanning, the pipe bursting contractor canoften reduce out-of-service time of the utilityto a six-hour time frame, which can be ac-commodated during normal working hoursfrom 8 a.m. to 5 p.m. This is particularly con-venient for utilities where the majority of theircustomer base is working during this time pe-riod. However, bypass systems can be installedwhen pipe bursting in done in commercial orindustrial areas.
A very attractive attribute of pipe burst-ing is that it requires minimal engineering de-sign work to be done. Record drawings orgeographical information system (GIS) data-base drawings are the best information for de-signing and planning a pipe bursting projectbecause the existing pipe route is utilized forconstructing the new system. If no recorddrawing or GIS drawing is available, pipebursting is still a valid rehabilitation method.
Continued on page 18
Figure 4. Typical pneumatic pipe bursting operation.
Figure 5. Typical static pull pipe bursting operation.
Picture 1. Pipe bursting serviceconnection pit with minimized impactto existing landscaping.

18 October 2013 • Florida Water Resources Journal
The project will have to be planned throughother maps, such as aerials or field drawings.There are various methods of locating the newpipe, which can be the basis of new recorddrawings or GIS information. This is also amajor benefit in urban areas that suffer fromoverutilized right-of-ways. Because the re-placement pipe is inserted into the exact loca-tion of the existing utility, no additionalright-of-way is necessary and there is no im-pact to other existing utilities, as could occurthrough new utility installations.
Other benefits of pipe bursting includehealth, air, economic, utility customer, and so-cial (Rehan, 2007). Health and air benefits arederived from the minimal use of excavationsand less equipment requirements in compari-son to conventional open-cut (Ariaratnam,2009). Pipe bursting generates significantlyless dust, nitrous oxide emissions, and erosionand sediment runoff. Economic and utilitycustomer benefits are derived from less cost forpipe bursting in comparison to open-cut con-struction. Social benefits are derived fromquicker, less invasive construction than open-cut (Matthews, 2010).
The use of pipe bursting to replace agingA-C potable water distribution pipe was re-cently approved by the Drinking Water StateRevolving Fund Program (DWSRF) as a qual-ified Green Project Reserve program at theCity of Casselberry. The program was pro-vided grant funding through the AmericanRecovery and Reinvestment Act (ARRA) andhas successfully rehabilitated A-C pipe usingpipe bursting while meeting all NESHAP cri-teria. Industry representatives worked veryclosely with the Florida Department of Envi-ronmental Protection (FDEP) and EPA repre-sentatives to determine how NESHAP appliesto pipe bursting of A-C pipe and how to com-ply with these requirements. Much of the dif-
ficulty with applying NESHAP requirementsto pipe bursting was its focus on above groundconstruction; pipe bursting is a new technol-ogy that was not available for consideration atthe time NESHAP was written.
NESHAP Defined
The NESHAP provides for the distinctionof asbestos-containing material (ACM), usingterms such as friable, nonfriable, Category I,Category II, and regulated asbestos-contain-ing material (RACM). Friable ACM is definedas any material containing more than 1 per-cent asbestos as determined using the methodspecified in Appendix A, Subpart F, 40 CFRPart 763, Section 1, Polarized Light Mi-croscopy, (PLM), that, when dry, can be crum-bled, pulverized or reduced to powder by handpressure (Picture 2). In contrast, nonfriableACM is any material containing more than 1percent asbestos as determined using themethod specified in Appendix A, Subpart F, 40CFR Part 763, Section 1, PLM, that, when dry,cannot be crumbled, pulverized, or reduced topowder by hand pressure.
The EPA defines two categories of non-friable ACM: Category I and Category II non-friable ACM. Category I nonfriable ACM isany asbestos-containing packing, gasket, re-silient floor covering or asphalt roofing prod-uct that contains more than 1 percent asbestosas determined using PLM, according to themethod specified in Appendix A, Subpart F, 40CFR Part 763 (Sec. 61.141). Category II non-friable ACM is any material, excluding Cate-gory I nonfriable ACM, containing more than1 percent asbestos as determined using PLM,according to the methods specified in Appen-dix A, Subpart F, 40 CFR Part 763 that, whendry, cannot be crumbled, pulverized, or re-duced to powder by hand pressure (Sec.61.141) as shown in Picture 3.
The EPA defines RACM to be: (A) friableasbestos material; (B) Category I nonfriableACM that has become friable; (C) Category Inonfriable ACM that will be or has been sub-jected to sanding, grinding, cutting or abrading;or (D) Category II nonfriable ACM that has ahigh probability of becoming or has becomecrumbled, pulverized, or reduced to powder bythe forces expected to act on the material in thecourse of demolition or renovation operations.
According to an EPA 2011 guidance doc-ument prepared by Alliance TechnologiesInc., if Category II nonfriable ACM has notcrumbled, been pulverized, or reduced topowder and will not become so during thecourse of demolition/renovation operations,it is considered nonfriable and therefore isnot subject to NESHAP. However, if duringthe demolition or renovation activity it be-comes crumbled, pulverized, or reduced topowder, it becomes RACM and is subject toNESHAP. This guidance document was pre-pared based on discussions with a workgroup from EPA, which consisted of the fol-lowing regional asbestos NESHAP coordina-tors: Ron Shafer, Scott Throwe, and OmayraSalgado of the Stationary Source ComplianceDivision; Charles Garlow and Elise Hoerathof the Air Enforcement Division; and SimsRoy of the Standards Development Branch(Alliance Technologies, 2011). The A-C pipeis a Category II nonfriable ACM, accordingto EPA’s guidance document, and is poten-tially subject to NESHAP requirements, de-pending upon what type of activity isplanned for the A-C pipe and how much(length) of A-C pipe will be affected.
The NESHAP provides exemptions fromits regulations based on the quantity of ACM.For A-C pipe, the quantity threshold is 260 lin-eal ft, regardless of diameter, in one calendaryear. Other exemptions from NESHAP or clar-
Continued from page 17
Picture 2. Friable asbestos insulation.Picture 3. Fractured AC pipe resulting from pipe bursting as itwill remain in the ground.
Continued on page 20


20 October 2013 • Florida Water Resources Journal
ifications of its requirements for A-C pipe havebeen provided by interpretive letters in re-sponse to questions posed to EPA (EPA, 1990).Examples of issues clarified or interpretedthrough such letters include the following:1. Buried A-C pipe is potentially subject to
NESHAP because it is considered a “facil-ity” or “facility component.”
2. Buried A-C pipe removed from the groundintact and disposed in a waste disposal siteis exempt from NESHAP.
3. Buried A-C pipe that is capped and aban-doned in-place is exempt from NESHAP.
4. Buried A-C pipe that is grout-filled and aban-doned in-place is exempt from NESHAP.
5. Crushing buried A-C pipe with mechanicalequipment causes the AC pipe to be subjectto NESHAP requirements.
6. Pipe bursting buried A-C pipe causes A-Cpipe to be subject to NESHAP require-ments.
7. Pipe reaming buried A-C pipe causes A-Cpipe to be subject to NESHAP require-ments.
8. Sliplining buried A-C pipe is exempt fromNESHAP requirements.
9. Work on buried A-C pipe that is subject toNESHAP requirements is considered reno-vation work, not demolition work.
These exemptions and clarifications arerepresentative of EPA’s opinion of the applica-bility of NESHAP to various types of work onburied A-C pipelines.
Minimized Future Exposure
Industry representatives maintain thatthe A-C pipe fragments that remain after apipe bursting project are not RACM. It ishighly unlikely that these A-C fragmentswould become friable over time. If future ex-cavations uncover the A-C fragments, theyare typically caked in moist soil and the fibersare not likely to go airborne. The rehabili-tated pipe alignments are typically understreets and/or in public right-of-ways and arenot typically disturbed except by authorizedpersonnel working in the vicinity (Phillips,2009).
There has been much debate as to thepipe bursting process turning the existingnonfriable Type I AC pipe into friable Type IIRACM. All of the rehabilitation activities, ex-cept the portions of pipe that are exposed atpits, occur underground. The segments offragmented A-C pipe remain within a fewinches of the soil material surrounding thenew pipe. Future exposure of the general pub-lic to the burst A-C pipe for lengths greater
than the 260 lin ft already stated in NESHAPwill be solely limited to rehabilitation workalong new pipeline. Homeowners that wish toinstall new landscaping or work above the newpipeline will have minimal exposure to theburst A-C pipe because they are not likely tophysically expose over 260 lin ft of the pipe.Homeowners will also not likely be digging asdeep as the typical 3 ft of cover over the pipe-burst A-C pipe. Other utilities that will per-form work in this area will likely exposelimited areas associated with only crossing thenew pipe and will not expose over 260 lin ft ofthe pipe.
The only agency that will have to dealwith potential future exposure over the 260-lin-ft threshold will be the one that performedthe pipe bursting rehabilitation. This agencyshould have ample records indicating the lo-cation of these A-C fragments. The agencyshould also clearly understand the mitigationrequired if this material is removed in the fu-ture before starting any A-C pipe burstingproject.
Current NESHAP Compliance Procedures
While debate continues as to the applica-bility of NESHAP to pipe bursting buried A-Cpipelines, a working procedure has been de-veloped in Florida that regulators and industrymembers (municipalities, engineers, and con-tractors) are utilizing. This procedure com-plies with each element of NESHAP, 40 CFRpart 61, subpart M (61.140-61.157), and isbriefly described.
File a Notice to EPA or Its Designee, 61.145(b)The NESHAP specifies salient informa-
tion that must be included on the notice; theFDEP has available form 62-257.900(1) thatrequires this information. The one-page formhas to be signed only by the utility owner.
Provide for Emission Control during Renovation and Disposal, 61.145(c)/61.150
There can be no visible emissions fromthe work (pipe bursting) per 61.150(a). Withpipe bursting, this can be easily accom-plished because the A-C pipe is wettedwithin any excavation; cutting is accom-plished using nonpower saw tools (chaincutter, handsaw). Segments of A-C pipe thatare removed from an excavation are wrappedin plastic, sealed leak-tight, taped, and placedinto a dumpster for shipment by an asbestostransporter.
A negative exposure assessment (NEA)was performed for the City of Casselberry proj-ect and approved by the DWSRF program for
ARRA grant funding. American ComplianceTechnologies determined the observed time-weighted averages for the sampled employeesthat performed representative work activitiesfor pipe bursting operations along BenedictWay in Casselberry from March 21-23, 2011,were below the Occupational Safety and HealthAdministration (OSHA) permissible exposurelimit (PEL) of 0.1 f/cc (ACT, 2011). Numerouscontractors and municipalities have conductedNEAs on A-C pipe bursting projects. To date,none of these assessments have shown any as-bestos fiber release within a work site. The pipebursting process minimizes risk of exposure toworkers that are rehabilitating the pipe becausethe majority of the rehabilitation occurs un-derground.
Comply with Inactive/Active Waste Disposal Site Requirements, 61.151/61.154
The NESHAP provides for disposing ofRACM on the site of the demolition or ren-ovation work, or the RACM can be disposedof at a waste disposal site. Currently, forpipe bursting projects, regulators interpretNESHAP such that the work site is consid-ered a waste disposal site. Numerous op-tions are provided in NESHAP to preventasbestos exposure. These options include:no visible emissions from the site; fencingand posting signs around the site; have anatural barrier (cliffs, lakes or other largebodies of water, deep and wide ravines, andmountains) around the site; or cover theRACM with 2 ft of compacted nonasbestos-containing material. With pipe bursting, the2 ft of cover is virtually always provided be-cause the pipe bursting is performed on aburied A-C pipeline. Also, no emissionsfrom the work have been detected on pipebursting projects.
Comply with Inactive Waste Disposal SiteDeed Notation and Alternative, 61.151(e)
The NESHAP requires that a notation tothe deed of a facility property be recordedwithin 60 days of a waste disposal site becom-ing inactive. A site is deemed inactive whendisposal of RACM is completed. Applying thisto pipe bursting projects, a site is deemed in-active when the project is completed. The no-tation is to contain the following information:1. The land has been used for the disposal of
asbestos-containing waste material.2. The survey plot and record of the location
and quantity of asbestos-containing wastedisposed of within the disposal site requiredin Sec. 61.154(f) have been filed with theadministrator.
3. The site is subject to 40 CFR part 61, sub-part M.
Continued from page 18

Conflict Between Deed Notation Requirement
and Public Right-Of-Way
It appears possible that the drafters ofNESHAP made the presumption that the fa-cility property will have a single deed associ-ated with the site, that the property would bedeeded, and that the property is transferable.In contrast, a public land right-of-way doesnot have a deed, can transect public and pri-vate properties, and the municipality orcounty is not the fee title owner of the right-of-way and cannot record notices directly on afee title of right-of-way. Utility providers haveinstalled a significant amount of A-C pipewithin the public right-of-way to provide util-ity services to the public. The deed notationand general compliance requirements havebeen a significant deterrent to many utilityproviders that would have been rehabilitatingA-C pipe.
This is the only requirement of NESHAPthat is not explicitly met as it is written. Giventhe previously described presumptions of thedrafters, and realizing that pipelines typicallyrun in public right-of-ways, this issue had tobe discussed with EPA regulators to develop asolution. Industry representatives have sug-gested a potential solution to the deed nota-tion requirement for the locations of A-C pipethat have been pipe-burst.
Administrator-Approved Alternate
The meeting with industry representa-tives (including members of Killebrew Inc.)and EPA staff took place in November 2010 todiscuss the applicability of NESHAP to pipebursting A-C pipelines and to develop a rea-sonable, practical solution to the deed nota-tion issue. The EPA staff acknowledgedpotential difficulty in applying NESHAP deednotation requirements to A-C pipe burstingwithin public right-of-ways. However, whenpresented with a video of several physicaldemonstrations of pipe bursting that clearlydisplayed the minimal environmental impactsof pipe bursting over traditional open-cut re-placement methods, EPA staff expressed a pos-itive attitude towards pipe bursting. Themeeting concluded with EPA suggesting thatthe industry develop an “administrator-ap-proved alternate” for all to follow.
The alternate is intended to allow the EPAadministrator and staff to approve alternatetechnology or practices without having tomodify NESHAP, which is federally codified.Industry members who have been followingthe pipe bursting of A-C pipe issue are pleased
Florida Water Resources Journal • October 2013 21Continued on page 22

22 October 2013 • Florida Water Resources Journal
with the opportunity to pursue an alternateand are working toward this objective. How-ever, at this time, there are not any guidancedocuments or previous examples of an EPAadministrator-approved alternate to reference,and according to EPA, the alternate has notbeen developed for any technology or practiceto date. An A-C pipe bursting task force hasbeen assembled to develop this document.
The alternate is intended to provide pro-cedures for working with buried A-Cpipelines. The exemptions and clarificationslisted early will be included so that one, com-prehensive document, specific to buried A-Cpipelines, will be available for use nationwide,and that any type of work on buried A-Cpipelines will be uniformly practiced and reg-ulated, regardless of the state in which thework may be located.
Collaborative efforts among industrymembers have been ongoing since November2010 to draft the administrator-approved al-ternate. Once the first draft is prepared, it willbe submitted to EPA’s Washington, D.C., officefor review and consideration. In the mean-time, to satisfy the deed notation requirement,a notice is being sent to public records thatcontains all required information for ongoingprojects in Florida.
The EPA Office of Research and Develop-ment (ORD) has set a goal to generate the sci-ence and engineering needed to improve andevaluate promising innovative technologiesand techniques that will reduce the cost andimprove the effectiveness of operation, main-tenance, and replacement of aging and failingdrinking water and wastewater treatment andconveyance systems. Existing technologiesneed to be applied in unconventional ways.Emerging technologies and innovative think-ing will be at the forefront of creating a pow-erful, secure, cost-effective, and reliable waterinfrastructure (EPA, “Addressing the Challengethrough Science and Innovation,” 2010). Theindustry believes application of pipe burstingfor A-C pipe is a prime example of an emerg-ing technology that should be approved andutilized to mitigate the accelerating costs of A-C pipe replacement.
Florida Department of Environmental Protection Supports
Pipe Bursting A-C Pipelines
The FDEP has provided support of thepipe bursting process and believes it is environ-mentally and economically superior to remov-ing existing A-C pipe, and that pipe bursting ismore economically feasible than the traditionalmethod of removing and landfilling old A-C
pipes. On April 27, 2011, Herschel T. VinyardJr., secretary of FDEP, sent a letter to the EPARegion 4 office in Atlanta requesting assistanceto finalize EPA’s position and interpretation ofpipe bursting A-C pipelines.
Conclusions
Over 630,000 mi of buried A-C pipelinesremain in use across the U.S. and Canada. All ofthis underground piping has reached, or isquickly approaching, the end of its useful life.Replacement or rehabilitation is imminent. Pipebursting is a proven technology that is environ-mentally, socially, and economically beneficialand is approved by numerous states, includingFlorida. Utility providers need to be able to uti-lize a wide array of technologies, including pipebursting, to be able to recapitalize their assets.
Application of pipe bursting for rehabili-tation of existing A-C pipe meets the goals setforth by EPA’s ORD to reduce the cost of re-habilitation and replacement of existing infra-structure through new and innovativetechnology. Unfortunately, application of thisnew and innovative technology is severely lim-ited through rules and regulations that are al-most 30 years old. It is clear that these rulesand regulations require updating to properlyaccount for technology that has developedsince the promulgation of the rule. Contro-versy still exists regarding the applicability andinterpretation of NESHAP for buried under-ground A-C pipelines. Efforts to develop theadministrator-approved alternate will rectifythese matters and develop uniform proceduresfor use nationwide by industry and regulators.Every effort needs to be made, from industryrepresentatives, utility operators, and EPA reg-ulators, to close the clean water and drinkingwater infrastructure funding gap.
References
• Alliance Technologies Inc. (2011). As-bestos/NESHAP Regulated Asbestos-Contain-ing Materials Guidance. Retrieved February10, 2012, from http://www.epa.gov/re-gion4/air/asbestos/asbmatl.htm.
• Ariaratnam, S.T. & Sihabuddin, S.S. (2009).“Comparison of Emitted Emissions BetweenTrenchless Pipe Replacement and Open-CutUtility Construction,” Journal of GreenBuilding, College Publishing, Vol. 4, No. 2,pp. 126-140 (Emissions Comparison Table 6displayed on next slide).
• ASCE. (2006). ASCE Manual of Practice forPipe Bursting Projects. American Society ofCivil Engineers.
• EPA. (1990). 40 CFR Part 61 Subpart M. Re-trieved February 10, 2012, from
http://www.epa.gov/asbestos/pubs/asbreg.html.• EPA. (2002) The Clean Water and Drink-
ing Water Gap Analysis. • EPA. (2002) Costs for Water Supply Dis-
tribution System Rehabilitation.• EPA. (2010) State of Technology Report
for Force Main Rehabilitation. • EPA. (2010) Addressing the Challenge
through Science and Innovation. • Expert’s Report for the Determination and
Assessment of Asbestos Fibres in WorkplaceAir, Dr. Wessling Laboratories GmbH, Re-port No. 1B9715, Dec. 11, 2001; Report No.2B7640, April 23, 2002; Report No. 2B8367,Aug. 27, 2002.
• Managing the Risks Presented by Pipeburst,Redundant and Live Asbestos Cement WaterDistribution Mains: Risk Assessment of As-bestos Fibre Release During Rehabilitationof Asbestos Cement Water Mains, UK WaterIndustry Research, 2005 (UKWIR Ref:04/WM/03/17).
• Matthews, J.C. and Allouche, E.N. (2010). “ASocial Cost Calculator for Utility Construc-tion Projects,” North American Society forTrenchless Technology No-Dig Show, 2010,Paper F-403.
• Rehan, R., & Knight, M. (2007). “Do Trench-less Pipeline Construction Methods ReduceGreenhouse Gas Emission?” Center for theAdvancement of Trenchless Technology,Dept. of Civil and Environmental Engineer-ing, University of Waterloo, Waterloo On-tario for the National Association ofTrenchless Technology. (Three case studiesfound emission reductions of 90%, 78% andnearly 100%.).
• Simicevic, J., & Sterling, R. L. (2001). Guide-lines for Pipe Bursting TTC Technical Report#2001.02.
• Kent Von Aspern (2009). “End of the Line: Re-place Asbestos-Cement Pipe Without Turningthe Jobsite Into a Hazardous-Waste Site.”
• Chris Brahler (2011). “Regulations that ArcKilling Jobs and Wasting Funds. Replace-ment of Aging Asbestos Cement Pipe Infra-structure.”
• Vern Phillips (2009) “Environmental Issuesregarding Pipe Bursting Buried Asbestos Ce-ment Pipe.”
• Asbestos Insulation Photograph – www.as-bestosinsulationpictures.com
• Eric Jonsson, American Compliance Tech-nologies (2011) “Documentation of Nega-tive Exposure Assessment for Work PracticesInvolved in Pipe Bursting Operations atBenedict Way, Casselberry, Florida, March21-23, 2011.”
• Dr. M. Frangopol, (2001) “Life Cycle CostAnalysis and Design of Civil InfrastructureSystems.” ��
Continued from page 21

Florida Water Resources Journal • October 2013 23
Earn CEUs by answering questions from previous Journal issues!
Contact FWPCOA at [email protected] or at 561-840-0340. Articles from past issues can be viewed on the Journal website, www.fwrj.com.
Members of the Florida Water &Pollution Control Association (FWPCOA) mayearn continuing education units through theCEU Challenge! Answer the questionspublished on this page, based on thetechnical articles in this month’s issue. Circlethe letter of each correct answer. There isonly one correct answer to each question!Answer 80 percent of the questions on anyarticle correctly to earn 0.1 CEU for yourlicense. Retests are available.
This month’s editorial theme is NewFacilities, Expansions, and Upgrades.
Look above each set of questions to see ifit is for water operators (DW),distribution system operators (DS), orwastewater operators (WW). Mail thecompleted page (or a photocopy) to:Florida Environmental ProfessionalsTraining, P.O. Box 33119, Palm BeachGardens, FL 33420-3119. Enclose $15for each set of questions you choose toanswer (make checks payable toFWPCOA). You MUST be an FWPCOAmember before you can submit youranswers!
Operators: Take the CEU Challenge!
1. According to regulators, the National Emissions Standards forHazardous Air Pollutants (NESHAP) do not apply to asbestos-cementpipe, which isa. crumbled.b. pulverized.c. used as sewage force main only.d. less than 260 lineal ft in length.
2. _____________ has provided support of the asbestos-cement pipebursting process, believing that it is environmentally superior toremoving existing pipe.a. The U. S. Environmental Protection Agencyb. The Florida Department of Environmental Protectionc. The National Resources Defense Councild. The Occupational Safety and Health Administration
3. A 2011 EPA guidance document indicates that Category II, non-friableasbestos containing material is not subject to NESHAP unlessa. it is crumbled, pulverized, or reduced to powder during demolition.b. the pipe is greater than 2 in. nominal diameter.c. a snap cutter is used to cut it.d. it is within 15 ft of an occupied building.
4. The pipe bursting method in which the bursting hammer providesforward force isa. hydraulic bursting. b. sonic bursting.c. pneumatic bursting. d. static bursting.
5. Which of the following states does not allow pipe bursting?a. Florida b. Californiac. New Mexico d. Nevada
Applicability of NESHAP to Rehabilitating Asbestos-Cement Pipelines
Bill Thomas and Edward Alan Ambler(Article 2: CEU = 0.1 DW/DS}
___________________________________________SUBSCRIBER NAME (please print)
Article 1 ________________________________________LICENSE NUMBER for Which CEUs Should Be Awarded
Article 2 ________________________________________LICENSE NUMBER for Which CEUs Should Be Awarded
If paying by credit card, fax to (561) 625-4858
providing the following information:
___________________________________________(Credit Card Number)
___________________________________________(Expiration Date)
1. The contaminant of concern in water stored in theAuthority’s aquifer storage and recovery system isa. arsenic. b. barium.c. calcium. d. lead.
2. The design storage capacity of the aquifer storageand recovery (ASR) system discussed in this article a. is limited by total contaminant loading.b. matches the treatment facility’s annual design
capacity.c. equals 21 mil gal per day.d. is 6.3 bil gal.
3. The type of water stored in this ASR system is a. fully-treated drinking water.b. groundwater from a nearby wellfield.c. raw water from the Peace River.d. reclaimed water.
4. In Florida, how many ASR systems have been issuedoperation permits?a. Four b. Sixteenc. Twenty-eight d. Forty
5. The contaminant discussed in question no. 1 above isreleased when ________ water is introduced(injected) into the limestone ASR system formation.a. chlorinated b. low pHc. untreated d. oxygenated
New Path to Permitting Aquifer Storage and Recovery
Systems in Florida
Mike J. Coates, Patrick J. Lehman, Craig Varn, and Douglas Manson
(Article 1: CEU = 0.1 DW/DS)

24 October 2013 • Florida Water Resources Journal

Florida Water Resources Journal • October 2013 25

26 October 2013 • Florida Water Resources Journal

search: slb drilling
© 0© 20© 20© 20© 20© 20© 20© 20© 20©©© © 20© 20© 20© 2020© 202© 2013 S13 S13 S3 S13 S13 S1313 S13 S3 S13 S113 S113 S3 SSchluchluchluchluchluchluchluchluuchluchluchluchluchluchluluuchlchluchluhchlucc mbermbermbermbermbermbermbermbermbmberbbmbembermbermbmbermbermbermbermberbbbb gerger.gergegergergergergergergereg 13-W13-W13-W13-W13-W13-W3 W3 WW-W13-W13-W313-WW13 WWWS-00S-00S-00S-00S-00S-00S-000000S 0000S 0SS 00S 00101010101000010101101
search: slb drillingwater.slb.com
Ensure the Sustainability of Your Groundwater SupplyDeveloping a sustainable and cost-effective groundwater supply depends on an accurate understanding of the aquifer’s behavior.
With decades of leadership in subsurface analysis and unmatched evaluation technologies, Schlumberger delivers accurate characterization data to help you better understand your resource—for the long term.
Groundwater
Resource EvaluationACCURATE AND COST EFFECTIVE
AQUIFER CHARACTERIZATION

28 October 2013 • Florida Water Resources Journal
Once you reach 40 it is important toreceive regular physicals to check forpotential problems. Most people who
have high blood pressure don't even know it;the only way to find out is to have your bloodpressure checked regularly. Likewise, highblood sugar and cholesterol levels often donot produce any symptoms until the diseasesbecome advanced. To ensure the health of itsinfrastructure, a relatively young and healthyOrange County Utilities is taking proactivemeasures in preparation for an upcomingwave of renewal and replacement (R/R)needs.
Utility Background
The Utility owns and maintains approxi-mately 1,221 mi of gravity sewer, 563 mi offorce main, over 30,000 manholes, and 715pump stations. The R/R capital improvementprogram (CIP) was initiated to prepare Or-ange County for the inevitable wave of needsas infrastructure assets age and deteriorate.
The R/R program is ensuring that systemswill be evaluated, pipes will be fixed, pumpswill be refurbished or replaced, and effectivestandards will be put in place to guide futureinfrastructure assessment, management, andoperation. It established an appropriate strat-egy for the County to make key decisionsabout which assets to address and when, toapply available funding to system needs in thebest and most appropriate manner, and tokeep program priorities current and in focus.
The R/R program is expediting projects so thatthe real work of condition assessment, engi-neering, and construction of needed improve-ments occurs in a logical, timely, andcost-effective way.
Today, through the basic prescription ofsystem knowledge, effective planning, andteamwork, the Utility has a clear view of itscapital R/R program needs to address theaging system assets. More importantly, it hasan organization to support the program, stan-dards, and procedures to ensure consistencyand efficiency, tools to manage data and en-sure data quality, and confidence in knowingthe conditions of its infrastructure assets andthe R/R needs. At the same time, the County isself-performing work more effectively, allow-ing it to maintain control over quality, man-age expenditures, provide stewardship of thepublic’s assets, and provide good careers forthe next generation of public servants. This ar-ticle presents how this path to successfullymanaging infrastructure health was createdand how it will produce benefits well into thefuture.
Strategic Plan
The first step in establishing the OrangeCounty Utilities capital R/R program was toexamine, diagnose, and write a prescriptiveplan. Current funding, organization, processes,and procedures were assessed, and an overallprogram strategy was developed. The strategicplan, delivered approximately six months into
the project, identified preliminary fundingneeds, potential improvement opportunities,and the framework for follow-up tasks to beaddressed in the program.
In the absence of comprehensive condi-tion data, one way to examine potential R/Rfunding needs is to view the age of assets ascompared to expected useful life. The programconsultant assembled available data to developage distribution curves for Orange CountyUtilities’ wastewater infrastructure compo-nents.
The age profiles indicated that a numberof assets had exceeded or are approaching theend of an assumed useful life. Further, the rateof deterioration typically accelerates towardthe end of asset life, potentially increasing op-erations and maintenance (O&M) costs andincreasing the likelihood of failure. Conditionassessment is the only way to validate infra-structure asset condition and make the bestlife-cycle decisions for maintenance and R/Rpurposes. Based on data provided by OrangeCounty Utilities, Operations staff spent signif-icantly more of their time on responsive andcorrective work in comparison to preventivemaintenance for the gravity system and pumpstations. Such data was an indicator of poten-tial R/R backlog in the system.
Orange County Utilities’ annual R/R CIPexpenditures between the years 2000 and 2008averaged $11.7 million. Initial projections de-veloped during the strategic plan indicatedthat annual spending on R/R could be signifi-cantly higher.
Orange County has grown substantiallyover the past 30 years. In keeping up with thatgrowth, Orange County Utilities has focusedsignificant effort on extension of service andmeeting capacity demand. As a result, the ex-isting processes around new project executionare well developed and considered effective.R/R activities often occurred as part of othercapital projects and were not ideally coordi-
Rx for Aging Infrastructure: Orange CountyUtilities Renewal and Replacement Program
Randy Krizmanich and Jim Broome
Randy Krizmanich is a program directorwith Brown and Caldwell, and Jim Broome,is chief—infrastructure renewal withOrange County Utilities.
F W R J

Florida Water Resources Journal • October 2013 29
nated, validated, and communicated. Since ob-jective criteria for project prioritization werenot fully developed or consistently used, proj-ect priorities often changed. Scope changesand delays in execution often resulted.
The strategic planning effort determinedthat R/R processes within Orange CountyUtilities were in varying stages of developmentand effectiveness. In general, a systematic ap-proach was not always followed for all R/R ac-tivities.
Program Vision, Expectations, and Strategies
To guide the development of the R/R CIP,the program consultant and Orange CountyUtilities staff developed a vision statement andinitial strategic objectives for the initial imple-mentation of the program. In workshops, keyquestions were framed for four perspectives,also termed a “Balanced Scorecard”: BusinessProcesses, Financial, Learning and Growth,and Customers and Stakeholders:� Business Processes: What business processes
must we excel at?� Financial: How should we allocate funds
and control costs?� Learning and Growth: How will we continue
to enhance knowledge, skills, and abilitiesfor an effective R/R program?
� Customers and Stakeholders: What benefitsdo we need to provide? How do we createvalue?
The resulting strategic framework in-cluded nine initial strategies for meeting pro-gram expectations from these fourperspectives. These nine strategies form thefoundation and initial focus for establishingan effective R/R program and for evaluatingthe initial objectives and program activities.
Strategic Plan Recommendations
Months of meetings and evaluation iden-tified a number of potential improvementareas that provided the framework for the pro-gram.
Condition AssessmentCondition assessment is a vital part of an
R/R program. On a broad, strategic level,knowledge of asset condition allows effort andfunds to be allocated to the most appropriateassets and provides confidence that the exist-ing infrastructure is being managed effectively.On a narrower, tactical level, condition assess-ment is what determines the appropriate scopeof work for a particular rehabilitation/re-placement project.
Condition assessment was being per-
formed by Orange County Utilities, but not ona system-wide basis. More formal proceduresfor performing the inspection/condition as-sessment were recommended to promote con-sistency in a process that involves multipleparties (engineering, operations, constructioninspections, and various consultants).
The strategic plan led Orange CountyUtilities to incorporate criticality-based plan-ning, establish a program of assessing the con-dition of priority areas, develop processes toexpedite the timing from problem identifica-tion to remedial action, forecast expected ex-penditures, and update and manage changingpriorities as work gets completed.
OrganizationThe previous organization within Utili-
ties Engineering supported the capacitygrowth and service extension projects as a pri-ority, with a focus on projects identified aspart of the master plan. To more effectivelyhandle R/R projects identified by Operationsand spurred on by development and trans-portation projects, the Infrastructure RenewalSection was established. Orange County Util-ities supplements its existing forces through itsR/R program consultant and continuing con-sultants.
As an outcome of the strategic plan, thisgroup oversees the R/R program project deliv-ery (design and construction), as well as the“planning” necessary to develop priorities,manage decisions regarding necessary work,and maintain the ongoing activities of inspec-tion, condition assessment, priority manage-ment, and budget development/refinement.
The organizational structure providesclearly defined responsibilities, functional clar-ity, and adequate staffing to support the R/Rwork performed as part of the program and
R/R work done by others, which was an iden-tified improvement opportunity.
Communication /CoordinationR/R work occurs as part of many different
projects, as well as under the capital budgetand operation and maintenance budget. Es-sential to the success of a program was the de-velopment of R/R teams that regularly metand communicated issues, progress, and im-provement opportunities. Specific teams wererecommended for gravity, force mains, andpump stations. Monthly meetings are themain communication avenue between Engi-neering and Operations and are where mostR/R program-related decisions are made.
Proactive R/R Planning ProcessOrange County Utilities desired to im-
prove R/R by developing a program to iden-tify and execute R/R CIP work in a proactiveand structured fashion. The goal of a proac-tive R/R program is to confirm R/R needsbased on actual condition in time to imple-ment a cost-effective solution at an appropri-ate interval before the asset reaches the end ofits useful life.
Major changes to the R/R CIP planningprocesses and R/R CIP workflow strategies in-cluded:� Perform project validation and scope defi-
nition earlier in the planning process.� Perform condition assessment at the project
identification phase.� Standardize program procedures, prioriti-
zation criteria, data collection, and man-agement to support decision making.
� Improve communication of R/R prioritiesand activities between Engineering and Op-erations.
Continued on page 30

30 October 2013 • Florida Water Resources Journal
� Expedite the timing of rehabilitation/re-placement work and plan more effectively.
� Centralize responsibility for maintenanceof the R/R priorities and planning.
� Create backlog of R/R biddable projects toprovide flexibility in CIP budget spending.
� Improve understanding of priorities andmake more effective use of R/R dollars.
In addition, the program consultant andOrange County Utilities staff from multipledivisions were integrated as a cohesive unit,while providing flexibility to adjust staff andannual activities to meet the County’s goalsand business requirements.
The next sections describe the status ofprograms for each component.
R/R Program Implementation
The R/R planning and preliminary engi-neering activities vary based on asset type be-cause gravity mains, pump stations, and forcemains are fundamentally different types of as-sets with unique deterioration rates, failurecauses, and life cycles.
During the evaluation of CIP and R/Rprocesses described previously, opportunitiesto improve R/R activity and work flow effi-ciency were identified for each type of asset.Using the program consultant to performsome of the R/R responsibilities acceleratedwork flow efficiencies. A reorganization andshift in staff responsibilities as the program de-velops will eventually lead to all program ac-tivities being transitioned to Orange CountyUtilities staff entirely. The following sectionsdescribe the implementation of the R/R pro-grams for:� Gravity System R/R CIP Implementation� Pump Station R/R CIP Implementation� Force Main R/R CIP Implementation Strategy
1. Gravity System R/R CIP Implementation The gravity program was initiated first
because it would take the most effort as it isthe most complex. Orange County Utilities al-ready had a robust inspection program, in-house Closed Circuit Televising (CCTV)crews, staff dedicated to vendor contract man-agement of CCTV work, quality assurancemeasures, and experienced condition assess-ment staff. Because of this experience, OrangeCounty Utilities has stringent inspection re-quirements and quality control procedures.Specifications already existed with strict exe-cution requirements but were lacking in an ex-tremely important element–consistent datasubmittals. Robust data standards were not de-fined, inspection data was in file drawers, and
recommendations were included on individ-ual Excel spreadsheets. To support the newprogram, more direct interaction was neededbetween Operations staff reviewing the in-spections and Engineering. While miles of thesystem had been inspected and assessed, datawas not widely accessible and was inconsistent.Defined roles and responsibilities and monthlyteam meetings have greatly improved the in-teraction and coordination.
Standards and Data RequirementsInitial work focused on establishing the
data requirements, beginning with requiringNational Association of Sewer Service Com-panies (NASSCO) Pipeline Assessment andCertification Program (PACP)-compliantdatabases and naming files in accordance withOrange County Utilities’ newly defined stan-dards. This one simple step ensured that thedata from any vendor or in-house crew couldbe validated, loaded into a master database,and disseminated throughout the organizationthrough Orange County Utilities’ robust geo-graphic information system (GIS).
Master CIP specifications for inspectionswere updated to include the new submittal re-quirements, followed by rehabilitation and re-placement-related specifications reviews andupdates. Work continued to develop a stan-dard bid item schedule that could be used onany gravity R/R project and an associatedmeasurement and payment specification. Inaddition, computer-aided design (CAD) stan-dards were defined and documented, anddrawing templates were established for grav-ity R/R projects.
Software ToolsWith the basics established for the gravity
program, a software tool was needed toprocess, store, and provide access to the data,support the condition assessment process, andhelp Orange County Utilities manage the R/Rprogram. A search commenced for softwaresolutions that could manage all the inspectiondata, score pipes based on a set of decision al-gorithms, provide the mechanism for condi-tion assessment review and tracking ofrecommendations, and automate creation ofcontract drawings. A couple of options hadpotential; however, inevitably each software-handled criticality, system inventory, and in-spection/R&R planning went well (what toinspect and planning-level cost projections)but didn’t support the detailed process of in-spection data management, pipe scoring, con-dition assessment, and getting R/R work doneafter a recommendation is made.
Without an off-the-shelf software solu-tion available that met all the County’s re-
quirements, the project team developed a cus-tom solution with an Access database on thefront end that integrated with the existing GIS.Tables were created in Orange County Utili-ties’ Oracle GIS database to house the PACPinspection data and R/R recommendation in-formation. Scripts were prepared to validateinspection data (from vendors and in-housecrews) prior to loading the data into the GISdatabase. Data validation included checks forvalid pipe ID numbers, size, material, lengths,valid defect codes, and data format, to name afew.
As much as possible, Orange CountyUtilities wanted a system that could automatethe R/R recommendations based on the in-spection data. The program consultant devel-oped decision trees that would derive specificR/R recommendations based on defect datacontained in the database. Orange CountyUtilities’ Engineering and Operations staffwere involved in development of the decisionlogic, basing the outcomes on their experi-ences and preferences. The decision algo-rithms were coded and imported into theAccess database. Field data is run through thealgorithms, and the database generates pre-liminary recommendations which can then beused to screen pipes for detailed review andfinal R/R recommendations.
No scoring system is perfect, nor can it berelied upon to make final decisions withoutsome human interaction. However, becausethe majority of Orange County Utilities’ grav-ity system is small-diameter pipe, the decisionapproach does lend itself more to “automated”decisions than, say, a system comprising large-diameter sewers where a multitude of R/R op-tions may exist. For the small-diameter system,point repairs, lining, and replacement are themain options.
After data validation, loading, and pre-liminary scoring, the database provided a sin-gle point of access for the conditionassessment reviewer to view preliminary rec-ommendations, inspection data, inspectionforms, and inspection videos that were ware-housed on a dedicated R/R server. The re-viewer inputs specific R/R recommendationsand provides comments using the databaseform. The database then sends the recom-mendations into the GIS database.
In-House Design Orange County Utilities’ collection sys-
tem, like systems throughout Florida, is almostentirely small-diameter gravity mains dis-charging to a pump station and pumped intoa manifold force main system. Cured-in-placelining of small-diameter sewers is very cost ef-fective, and the specifications of the liner can
Continued from page 29

be the same for all liners provided the mostconservative conditions are used in the linerdesign. Since the liner is installed through ex-isting manholes, the only information a con-tractor needs represented on a contractdrawing is a map of the area depicting whatpipes are to be lined, information on the man-hole access (where it is, diameter, depth),number of laterals, and information as to theground type.
With data standards, updated specifica-tions, consistent bid items, drawing templates,and GIS, Orange County Utilities was posi-tioned to prepare the lining contract drawingsin-house. By managing inspections, perform-ing condition assessment, and using standardspecifications, drawing templates, and bidschedules, Orange County Utilities has greatlyreduced the magnitude of consultant R/R de-sign contracts as well as expedited the deliveryof the projects.
ResultsTo date, over 250 mi of gravity inspection
data has been loaded into the R/R database and150 mi of pipelines have been assessed. Ap-proximately 30 percent of the priority-vitrifiedclay pipe has been recommended for lining, andOrange County Utilities is preparing R/R lin-ing packages in-house while utilizing consult-ants to provide design services for thereplacement of gravity mains with defects thatcannot be lined and water mains that have in-adequate capacity for fire flow, bidding, andconstruction administration services.
The program is expected to address thepriority-vitrified clay systems over the next fiveto seven years. Prior to the R/R program, muchof the pipe now recommended for lining wouldhave been recommended for replacement byconsultants. This shift means that much of thatdesign work will be done in-house, and OrangeCounty Utilities will realize tens of millions ofdollars in construction cost savings.
2. Pump Station R/R CIP Implementation Orange County Utilities uses life-cycle
projections of approximately 15 years for largemaster pump stations and 25 years for duplexand triplex stations. Initial age data reviewedduring the strategic plan indicated that 165pump stations were already at or beyond 25years, creating an immediate potential back-log. However, many of those stations that wereconceivably past their useful life were not thestations giving Operations staff problems.
Pump station rehabilitation prior to theprogram was driven mainly by Operationsstaff selecting problem pump stations. Engi-neering would initiate a project to essentiallyreplace the pump station, a process that was
time consuming, and often led Operations toaddress the failing component(s) prior to theproject design being completed. No prioritylist of pump stations had been developed thatwas based on actual conditions. It was obviousthat the program needed to shift to condition-based prioritization of pump stations to de-termine R/R needs.
Pump Station InspectionsTo determine the R/R needs for pump
stations and prioritize the stations, a coordi-nated, standardized inspection and condition
assessment program was initiated. All 650 du-plex and triplex stations were inspected andassessed based on five functional areas: struc-tural, electrical, mechanical, site, and healthand safety. During the inspection, individualcomponents within each functional area wererated by a field engineer and pump station op-erator. The data was entered into a pump sta-tion database, and photographs were copiedonto the Orange County Utilities R/R server.
After the inspections, an Orange CountyUtilities engineer performed an assessment on
Florida Water Resources Journal • October 2013 31
Continued on page 32
32 October 2013 • Florida Water Resources Journal
each station. The assessment included a ratingfor each functional area and specific recom-mendations for each area. Based on the func-tional area ratings, an overall pump stationpriority (1 low – 4 high) was assigned. Aftercompleting the assessment, the engineer metwith the Operations staff to review the results,get final input related to the condition or op-eration of the pump stations and the recom-mendations, and finalize pump stationpriorities.
Thus, defined priorities based on actualconditions are determined jointly between En-gineering and Operations. Once established,the priorities define which pump stations arepackaged into CIP pump station R/R projectsand which would have work orders created tobe addressed by Operations repair crews. Thisapproach establishes a clear CIP pump stationR/R program and also provides Operations in-house repair crews with clear direction as towhere to focus their time and efforts. In addi-tion to specific recommendations for R/R, theassessment process also identified real estateneeds for all the pump stations.
Real EstateHistorically, many of the most problem-
atic pump stations were ones where real estateacquisition was needed for either a site expan-sion or relocation. In the past, real estate ac-quisition was a long, involved process and alow priority. Over the years, those pump sta-tions that had real estate needs continued todeteriorate without being addressed.
Orange County Utilities has committed areal estate “point person” within Engineeringwhose responsibility it is to investigate real es-tate options; initiate the process; coordinatethe surveys, appraisals, approvals, and prop-erty owner communications; and act as a liai-son with Real Estate Management. If thecondition assessment of a pump station iden-tifies real estate needs, studies are conductedby Engineering to determine if the stationcould potentially be removed from service andwhat other options exist. If options existed, acapacity evaluation of the station where flowswere to be routed was performed by OrangeCounty Utilities modeling staff to determineif upgrades were necessary at the other station.If eliminating the station is not an option, thereal estate team is engaged to begin searchingfor available properties that meet the criteriaestablished by Engineering. Having a real es-tate point person ensures that progress doesnot stop on real estate acquisition, while al-lowing the Engineering project managers tostay focused on the other stations ready forR/R.
In-House DesignOrange County Utilities’ duplex pump
stations are essentially very similar and designstandards exist for new stations. Under the R/Rprogram, specifications have been updated,bid items standardized, and standard drawingtemplates created to streamline the designprocess. Engineering has had an in-house de-sign team for pump station R/R, but with aformal program in place, Engineering is nowpositioned for increased productivity in ad-dressing stations in need of R/R.
It is now the responsibility of the in-house team to evaluate pump station condi-tion, evaluate elimination and alternatives,evaluate capacity, determine real estate needsand acquire real estate, and perform design in-house. Design support, bidding, and con-struction administration continue to beprovided by consultants. The pump stationprogram currently has a goal to address 25 pri-ority pump stations each year, to prolong thelife of stations in reasonably good condition,and to address the stations that will inevitablydeteriorate from a current lower priority to ahigher priority in the next inspection cycle.
Pump Station Program ResultsThe results of the pump station inspec-
tions and condition assessments are as follows:� 180 pump stations need full rehabilitation. � 79 pump stations need relocations .� 32 pump stations may require property ac-
quisition.� 240 pump stations need minor R/R to be
performed by Operations repair crews. � Real estate needs are defined, and the ac-
quisition of real estate for each pump sta-tion will be completed before final design.
The Pump Station R/R program will po-tentially comprise a large percentage of the an-nual R/R expenditures, possibly in the tens ofmillions per year for the foreseeable future. Bas-ing the R/R decisions on actual conditions willfocus efforts on the areas of greatest need, whileoptimizing the life cycle of existing stations.
3. Force Main R/R CIP ImplementationStrategy
The goals of the force main R/R programare to address force main pipes with knownproblems, develop analysis support tools to as-sist in determining the appropriate extent ofreplacement of problem pipes, and to developa longer-range plan for proactively identifyingand addressing force main replacement needs.
Fortunately, the reality of the current situ-ation for Orange County Utilities is that therehave not been too many force main failures thathave resulted in sanitary sewer overflows. How-
ever, that is no indication that the status quowill continue. The challenge is how to move to-ward a proactive force main program. The fol-lowing sections describe the current state of theprogram, which is still in development.
Initial Priorities – Known ProblemsUnder the R/R program, the initial prior-
ities were determined to be the pipes that havealready had breaks, excluding those caused bythird parties. Maintenance records were re-viewed and a series of meetings with Opera-tions were held to document all the knownproblems in the system. These problem pipeswere packaged into projects where preliminaryengineering would be performed to determinethe need for and extent of replacement. Thoseprojects are currently underway or planned.The engineering evaluation will include adesktop analysis to determine potential prob-lem areas based on material, operating condi-tions, surrounding utilities, and previousbreaks. Once identified, an inspection plan willbe developed, and the cost of inspection andexpected effectiveness of the inspection will becompared to replacement costs. If inspection iscost-effective and can be done with minimalrisk, inspection and condition assessment willproceed. If not, a determination of extent ofreplacement will be made based on the poten-tial problem areas and critical locations.
Force Main System DelineationThe force main system comprises over
6,200 individual pipe segments totaling nearly600 mi of pipe. Force mains originate at pumpstations and extend to discharge points intothe gravity system or tie into larger force mainmanifold systems. To assist in tracking forcemain projects, as well as provide an opportu-nity to evaluate force main “systems” duringpreliminary engineering, the force main sys-tem has been divided into 49 “force mainareas.” The force main areas are associatedwith larger repump stations and the three re-gional Orange County Utilities water reclama-tion facilities.
Force Main CategorizationForce main segments were initially cate-
gorized using information within the GISdatabase. The force main segments in eachforce main areas were initially grouped intoone of three categories:� Run-to-Fail� Proactive Replacement� Desktop Evaluation - Inspection Plan
Initial criteria categorized approximatelyone-third of the system as run-to-fail and two-
Continued on page 34
Continued from page 31

Florida Water Resources Journal • October 2013 33

34 October 2013 • Florida Water Resources Journal
thirds as desktop evaluation/inspection plan.Very few segments fell into proactive replace-ment as those were based on the policy of re-placing asbestos-cement pipe. The list of pipescategorized for desktop evaluation is beingfurther honed based on more refined critical-ity criteria.
Force Main Desktop EvaluationThe force main segments slated for a
desktop evaluation are being considered forinclusion in a force main inspection plan thatwill be developed for each force main area.
Due to the cost and limits of effectivenessof the current inspection technologies, OrangeCounty Utilities does not have the desire or re-sources to conduct inspections on the entiresystem. Inspections will be limited to thoseforce main segments that will provide mean-ingful data in a cost-effective manner.
In addition to determining which forcemain segments should be inspected, the in-spection plan will outline recommended in-spection technologies that will be utilized foreach type and size of force main to be in-spected, if any. In general, each force main in-spection plan will include the following items:� List of force main segments to be inspected,
including size and material� Planned method of inspection (technology)� Identification of access points, if needed� Method of operational control (rerouting,
bypassing, or tankers)� Estimated inspection costs
It is important to note that the inspectionplan is not intended to require inspections offorce mains but rather identify the force mainsegments appropriate for inspection and out-line the methods to be utilized. By creatingsuch inspection plans, Orange County Utili-ties will have the capability to implement forcemain inspection programs of varying magni-tudes, ranging from as-needed inspections ofparticular force main segments to a system-wide force main inspection program.
Force Main Area Evaluation ProjectsThe R/R program evaluates force main
areas on a systematic level. The scope of workfor the area evaluations includes a risk evalu-ation, identification of potential force mainelimination and re-routing options, and a ca-pacity and flow analysis. Planned road projectsthat could impact force mains will be identi-fied. Desktop evaluations will result in identi-fication of potential problem areas anddetermine if inspection plans should be devel-oped. If pipes are categorized for potential in-spection, a force main inspection plan will be
developed for affected pipes, including cost es-timates.
The result of the force main area evalua-tion will be a detailed categorization of allforce mains within the force main manifoldarea, a list of potential capacity/operational-related improvement projects, rerouting andforce main elimination opportunities, a sum-mary of recommended inspections and in-spection plans, and an updated list ofproactive replacement force mains to be con-sidered for inclusion in upcoming preliminarydesign/design projects. As new force mainprojects are identified through force main areaevaluations, those projects will be added to thepriority list.
Force Main Inspection ProjectsThe force main area evaluations will es-
tablish the scope for inspection projects. Forcemain inspection is very specialized and in-cludes many different technologies. The de-tailed inspection plans developed duringpreliminary engineering or force main areaevaluation will determine the appropriatetechnologies and all ancillary work needed toperform the inspections. Based on the resultsof force main inspections, additional forcemain projects will be identified and priori-tized.
Force Main Project PrioritizationForce main projects will be prioritized
twice: once as they are put on the force mainpreliminary design priority list and once againas the project transitions to the force mainfinal design/construction project list. As sys-tem needs and available resources will changeover time, the initial prioritization performedbefore preliminary design will not necessarilycarry through to the final design/constructionlist priorities. In addition, the method of pri-oritization is different between the two lists.
The initial priorities are known problemforce mains; additional projects will be identi-fied through ongoing force main team meet-ing discussions, force main area evaluations,and an eventual force main inspection pro-gram. Priorities for these projects will be as-signed based on results and ongoing trackingof O&M work orders related to force mains.
The force main preliminary design prior-ity list will be prioritized at the force main arealevel instead of by individual projects. Histor-ically, force main projects have only includedforce main segments. However, in order to in-troduce proactive activities into the force mainR/R program, a force main area system evalu-ation should be included with any new forcemain preliminary designs. This approach al-lows the R/R program to address imminent
problems, while also including proactive carefor the system.
Force Main Program ResultsThe initial strategy for force main R/R has
been established and is being refined. Initial pri-ority projects are underway to perform detailedevaluation of the known problem force mainsso that the extent of replacement can be deter-mined. Orange County Utilities is also puttinginto place more defined forensic evaluationprocedures, in particular, requirements for cap-turing data related to breaks and pipe condi-tions any time a pipe is accessed or tapped.
Better projections of needed force mainexpenditures will be made as the preliminaryengineering of known problems are com-pleted, area evaluations are performed, and aninspection program is better defined.
Conclusion
Orange County Utilities’ prescription foraging infrastructure is a proactive approachthat combines strategic planning to identifyimprovement opportunities, organizationalrestructuring to accommodate R/R activitiesmore efficiently, and robust implementationthat adapts the R/R approach and resources tothe specific needs of each type of infrastruc-ture managed by the utility.
As a result of the program, it is expectedthat Orange County Utilities’ design costs will be reduced by as much as 30 percent frompreprogram days due to in-house design of lin-ing drawings. More importantly, the programwill result in tens of millions of dollars in con-struction cost savings due to more lining ofgravity pipes in lieu of replacement and moreappropriate rehabilitation of pump stationsbased on the actual condition assessments. Inaddition to the direct cost savings, OrangeCounty Utilities has peace of mind about theconditions of the public’s important infra-structure assets and confidence that well-de-fined plans are in place to address the R/R needsand sustain the system’s health in the years tocome. Additional benefits to Orange County asa result of the R/R program include:� Streamlined processes and defined roles
and responsibilities.� An organization that understands the im-
portance of R/R and is committed to theprogram.
� Standards (proposal templates, bid itemschedules, master specifications, drawingdetails, etc.) to streamline design and con-tract procurement.
� Robust tools to support planning, datamanagement, condition assessment, anddesign. ��
Continued from page 32
Florida Water Resources Journal • October 2013 35

36 October 2013 • Florida Water Resources Journal
Although you arereading this in theOctober issue of the
magazine, I am writing this column on LaborDay, September 2. As our nation celebrates apublic holiday in honor of working people, itis fitting that I am writing this column todayto tell you about the great work that FWEAvolunteer members have been doing on behalfof our industry.
Since the Florida Water Resources Con-ference this past spring, and even before,FWEA volunteers have been busy planning ac-tivities and events that provide value to ourmembership and that promote our industryto the public, whom we depend on for sup-port. Now that the summer vacation season isover, WEF and FWEA begin a schedule of con-ferences, seminars, and events that offer out-
standing opportunities for your professionaldevelopment and personal enrichment. To as-sist you in prioritizing your schedule, this col-umn highlights a few of the major events thatare coming up in the next couple of months.
WEFTEC
This year, the Water Environment Feder-ation Technical Exhibition and Conference(WEFTEC) will be held October 5-9 inChicago at McCormick Place South. The con-ference is the premier event in the water qual-ity industry in North America. Everyoneshould try to attend at least one WEFTEC as itis truly an amazing educational and network-ing event. This year, Florida will be well repre-sented, with two teams competing in theOperations Challenge Competition and twoteams competing in the Student Design Com-petition.
Operations Challenge CompetitionAt the WEFTEC Operations Challenge
Competition, FWEA will be represented by theCity of Gainesville’s “Team GRU,” which in-cludes Coach Don Eplee, Captain Levi Lee, Je-remy Gagnon, Derrick Sapp, and Brent Loper;and by the City of St. Cloud’s “Methane Mad-ness,” which includes Captain Paul Spencer,Jeff Hewitt, Chris Henderson, Marcus Full-wood, and Tom Clark. I want to give a bigthank you to both GRU and to the City of St.Cloud Utilities for allowing the members ofthese teams the time to plan and practice forthis competition. I would also like to thankChris Fasnacht of the City of St. Cloud andBrad Hayes of the City of Tavares for theirhard work promoting the event and fundrais-ing in support of our teams.
The competition takes place over twodays at the rear of the WEFTEC exhibit hall inbooth 1685, near the Innovation Pavilion. OnMonday, October 7, at 10 a.m., both teamstake the process control exam, which is notmuch of a spectator event. Later that day, how-ever, “Methane Madness” and “Team GRU”will compete, at 1:30 p.m. and 3:30 p.m., re-spectively, in the laboratory event, which is abiochemical oxygen demand (BOD) analysisof a wastewater sample, including determina-tion of pH, preparation of blank and seed cor-rection series, and calibration of dissolvedoxygen meter using YSI instrumentation.
The real action for spectators starts onTuesday when “Methane Madness” is sched-
uled for the safety event at 10:15 a.m., the col-lection system event at 2:15 p.m., and the Wilopump maintenance event at 3:15 p.m. “TeamGRU” is scheduled for the Wilo maintenanceevent at 9:15 a.m., the safety event at 11:45a.m., and the collection system event at 1:45p.m. Our Ops Challenge teams put in a lot ofpractice to compete in these events. So, if youwill be at WEFTEC this year, please plan tospend time at the challenge to cheer on thebest professional operators in the state ofFlorida!
Student Design CompetitionThe Student Design Competition will
take place on Sunday, October 6, from 8 a.m.to 3 p.m., at McCormick Place, South Build-ing, Level 1, in Rooms S105 B and C. For thesecond year in a row, the University of SouthFlorida (USF) will be representing FWEA inboth the wastewater design and environmen-tal design categories. Congratulations to thestudent design teams, the USF Student Chap-ter, and to their faculty advisor, Dr. SarinaErgas!
The USF wastewater design team includesNicole Smith (project manager) MatthewWoodham, Melissa Butcher, George Dick, andMargaret Cone, and will present at 10:30 a.m.The USF environmental design team includesErin Morrison (project manager), BrettFrench, Caitlin Hoch, Miki Skinner, andJoshua Becker, and will present at 2 p.m.
The awards presentation will be at 3 p.m.,where the top four teams in each category willbe awarded cash prizes ranging from $750 to$2500. Please plan to attend one or both ofthese presentations in support of our studentteams, and stick around for the awards cere-mony. This is a great opportunity to seeFlorida’s brightest environmental engineeringstudents compete under a national spotlight.Perhaps you can be the first to offer one ofthese high-achieving students an interviewwith your company or utility. I hope to see youthere.
Florida Water Festival
The Florida Water Festival is fast becom-ing our premier public education event of theyear. The 3rd annual festival will be held onOctober 26th at Cranes Roost Park at UptownAltamonte in Altamonte Springs from 9 a.m.to 3 p.m. It is a day-long celebration of our
FWEA FOCUS
Greg ChomicPresident, FWEA
FWEA and WEF Gear Up for a Busy Fall

Florida Water Resources Journal • October 2013 37
most precious yet underappreciated re-source—water. Although it is geared towardsthe education of our youth, it is also a greateducational experience for adults. Activitiesinclude a “Walk for Water,” water animal facepainting, water quality sampling/testing/sys-tem demonstrations, student poster and de-sign competitions, music, and prizes.
Many of central Florida’s utilities, theFlorida Department of Environmental Protec-tion, the St. John’s Water Management Dis-trict, and private environmental companieshave exhibited at the festival in the past and weexpect their involvement again this year. If youare a member of the Central Florida Chapter,please support this event by volunteering tohelp, being a corporate sponsor, or by attend-ing with your family and friends. You can learnmore by going to www.fwea.org and clickingon the “Conferences and Events” tab, or bycontacting festival chair, Stacy Smich, [email protected].
Wastewater Process Seminar
The FWEA Wastewater Process Commit-tee will be hosting its first regional seminar,entitled “Wastewater Process from Stem toStern: Righting the Process Ship,” on Novem-ber 5 at the Polk County Utilities office inWinter Haven. This will be the first of three re-gional seminars that the committee will behosting between November 2013 and Septem-ber 2014. The seminar surveys the latest waste-water process design concepts andtechnologies, from preliminary treatment toeffluent disinfection. It features local and na-tional experts, including Ron Trygar of theUniversity of Florida TREEO Center; JoseJimenez, Ph.D., P.E., of Brown & Caldwell;Joshua Boltz, Ph.D., P.E., of CH2M Hill; MariePellegrin, Ph.D., P.E., of HDR; and DaveHagen, P.E., of Greeley and Hansen. Attendeeswill be awarded CEUs and PDHs. Please visitwww.fwea.org and click on the “Conferencesand Events” tab for the complete agenda, andregistration and sponsorship information.
As you can see FWEA volunteers havebeen working hard for you and for our indus-try. Please accept this invitation to supporttheir efforts by sponsoring and attending oneor more of these events. At FWEA, we are en-gaged, and we can’t succeed without you! ��
38 October 2013 • Florida Water Resources Journal
Board Meeting Events
The August board of director’s (BOD)meeting was held at the Indian River State Col-lege in Ft. Pierce, which is the same locationwhere our fall state short school was held. Iwould like to thank Vitoria Stalls and the col-lege for their hospitality and their continuedsupport of our association. I would also like tothe thank Brad Hayes (representing FWEA)and Jason Parrillo (representing FSAWWA) fortaking the time out of their busy schedules toattend our board meeting.
There are a couple of notable items fromthe August meeting that I would like to sharewith you. The FWPCOA nominating commit-tee has nominated the current slate of officersto continue in their rolls in 2014. Nominationsare encouraged from the floor and will betaken at the November meeting prior to theelection. Those wishing to present a floornomination should review the relevant bylawsections carefully, as they need to be meticu-lously followed. The state bylaws can be foundonline at www.fwpcoa.org.
The FWPCOA industry certification pro-gram policies and procedures were presentedto the BOD for approval. Work Force Florida
(WFF) has determined that it will not spon-sor, administer, or fund this program. The de-cision by WFF to not fund the program wasattributable in part to job title confusion in itsneeds survey. The BOD unanimously ap-proved the industry certification policy andprocedure that provides a guideline for theFWPCOA to follow when granting industrycertification to high school students. Pleasefeel free to contact Tim McVeigh at [email protected] for more information if youwould like to get involved with this programin your area.
The Benefits of Membership
The FWPCOA membership drive contin-ues to move forward. Approximately 4,000Florida operators have received complimen-tary copies of the Florida Water Resources Jour-nal as a membership benefit. The magazinehas a wealth of information and it keeps itssubscriber's abreast of current events withFlorida’s water and wastewater professions.
Membership in the association also givesyou discounts on all FWPCOA training op-portunities. Another driver to becoming amember is networking opportunities. Net-
working will help you learn how others havesolved issues you may be facing, give you thechance to visit other utilities, and make newfriends in the profession. If you work in thisindustry, it simply makes sense to be a mem-ber of the Florida Water & Pollution ControlOperators Association!
Acknowledging Members and the Industry
The FWPCOA annual awards banquetwas held at the short school on August 13 andthere were a plethora of awards given out.Rene Moticker, the FWPCOA awards chair,presented several awards for outstanding per-formance to some extremely worthy recipients(their pictures are in this month’s magazine).Pete Tyson, our Safety Committee chair, rec-ognized several utilities for outstanding safetyprograms. I was able to recognize several peo-ple that have 30-50 years of service to the as-sociation. It did not come as a surprise to methat those longtime members are extremelyactive in the organization. Thank you, Reneand Pete, for your continued efforts, and con-gratulations to all!
I would also like to thank past presidentPhil Donovan for helping us celebrate Water& Wastewater Professionals Week at the ban-quet. The FWPCOA initiated this recognitionin 2007 as a means to acknowledge all waterutility industry employees for their dedicationand hard work to provide safe drinking waterto Florida's citizens, and for their efforts toprotect our state's environment and naturalresources. Each year the association celebratesthe event during a week in August and invitescounty and municipal leaders to issue aproclamation recognizing the event to showtheir appreciation to the industry. Phil has al-ways advocated for those in our industry andwas the right man for the job.
Please keep in mind that this is your as-sociation. If you’re not involved in the organ-ization, we would love for you to becomeengaged. Your involvement will directly bene-fit the industry and will help you in your pro-fessional endeavors. The next BOD meetingwill be held in Daytona Beach on November16. I hope to see you there! ��
Jeff PoteetPresident, FWPCOA
Board Takes Action; Membership Celebrated
C FACTOR

Florida Water Resources Journal • October 2013 39
The City of Clearwater (City) is currentlyexpanding its Water Treatment Plant #2(WTP #2) treatment capabilities through
the addition of a reverse osmosis (RO) system.The upgraded plant will produce 6.25 mil gal perday (mgd) of finished water by blending 1 mgd offiltered fresh groundwater with 5.25 mgd of ROtreated brackish water. The RO WTP #2 site is lo-cated on U.S. Highway 19 in a well-developedarea of central Clearwater. It is a long and narrowsite, bordered to the north and east by residentialcomplexes and to the south by light commercialbuildings. Figure 1 shows a rendering of the WTP#2 site after the expansion efforts.
The brackish raw water that will supply theRO system will be provided by 12 new wells.Overall, these wells will produce 6.56 mgd andhave varying water quality. The water from thewells is expected to have an average total sulfideconcentration of 1.4 mg/L; however, when theeight highest sulfide concentration wells (the ex-pected number of wells required to provide thenecessary amount of water) are averaged, the totalsulfide concentration is 2.5 mg/L. Table 1 sum-marizes the average, minimum, and maximumconcentrations for key constituents in the ROpermeate water from pilot testing.
A portion of the total sulfides in the newwellfield will be present as hydrogen sulfide(H2S), a naturally occurring gas found in Floridagroundwater. The H2S has a pungent odor atvery low concentrations and can oxidize to formturbidity and color that further affects the aes-thetics of drinking water; it can also corrode anddamage copper pipes (Chastain, 2008; Du-ranceau, 2010). The City has water quality goals
Ozonation of Reverse Osmosis PermeateFor Sulfide Control: Clearwater’s
New Water Treatment Plant ApproachTimothy English II, Robert Maue, Robert Fahey, Janice C. Bennett,
Greg Turman, Glenn Daniel, and C. Robert Reiss
Timothy English II, E.I., isproject engineer and C. RobertReiss, P.E., is president withReiss Engineering Inc. RobertMaue, P.E., is seniorprofessional engineer, RobertFahey, P.E., is utilitiesengineering manager, JaniceC. Bennett, P.E., is publicutilities assistant director, GregTurman is public utilitiescoordinator –water production,and Glenn Daniel is water,reclaim, and wastewatercollections manager with Cityof Clearwater.
F W R J
Figure 1. Rendering of the WTP #2 Site After Expansion
Table 1. Anticipated RO Permeate Water Quality
Table 2. FDEP Potential Sulfide Treatment Options
Continued on page 40

40 October 2013 • Florida Water Resources Journal
that limit the concentration of total sulfides inits potable water system to 0.1 mg/L, and theFlorida Department of Environmental Protec-tion (FDEP) Rule 62-555.315(5)(a) sets removalrequirements for wells used for public watersupply. When the total sulfide of a water supplyexceeds 0.3 mg/L, the FDEP requires treatmentand provides a listing of potential treatment op-tions, as shown in Table 2. Many of the potentialwater treatment options presented by the FDEPrule use aeration techniques to remove sulfides;however, these are recommendations and otherappropriate sulfide removal processes are ac-ceptable for satisfaction of the rule.
While the expansion of WTP #2 will in-clude the use of RO, which is very effective at re-moving dissolved solids such as chlorides, it isineffective for removal of gases, such as H2S, asthey pass readily through RO membranes. Thismeans that even after RO treatment, the totalsulfide concentration in the RO permeate is ex-pected to fall between 0.6 mg/L and 2.5 mg/L;thus, the FDEP requires sulfide posttreatmentand states that the potential for impacts on thedistribution system without treatment is signif-icant. With this in mind, two sulfide treatmentoptions were analyzed for their feasibility, capi-tal cost, and operating cost: packed tower aera-tion with pH adjustment versus ozonation via
sidestream injection. The latter option would bethe first large-scale municipal system in Floridato treat H2S in RO permeate using ozone.
Packed Tower Aerators
A common method to remove sulfides fromRO permeate is to use packed tower aerators. Thistechnology transfers H2S from the dissolved liq-uid phase to the gas phase through a mass trans-fer process (Crittenden, 2005; Chastain, 2008). Atypical packed tower aerator, shown in Figure 2,consists of a column filled with plastic packingmaterial used to increase the air-to-water inter-face. Blowers force air from the bottom of thetower, while water enters from the top.
For this alternative, the design would requiretwo packed towers, each capable of treating 5.25mgd, and two chemical scrubbers to treat the re-sulting off-gas of the degasifiers. A redundant sys-tem was chosen to ensure that the RO systemwould not need to be taken offline in the situa-tion when a packed tower or a scrubber is takenout of service for repair, maintenance, or clean-ing. During normal operation, the towers wouldbe rotated in and out of service on a regular basis.
Sulfide is normally found in three differ-ent forms: H2S, hydrogen sulfide ion (HS-),and sulfide ion (S2-). Depending on the pH,and with only H2S removed through masstransfer to air, it is important for the water en-tering aerator systems to be slightly acidic(Crittenden, 2005; Chastain, 2008; Duranceau,2010). As shown in Figure 3, in order toachieve the desired 95+ percent removal oftotal sulfide with an average permeate pH of6.3, acid treatment is required to lower the pH
Figure 2.TypicalPackedTower
Aerator
Figure 3. Hydrogen Sulfide Speciation versus pH
Table 3. Packed Tower Aerator/Scrubber System Capital Cost Estimate for RO WTP #2
Continued from page 39

Florida Water Resources Journal • October 2013 41
and increase the total sulfide partition of H2Sprior to aeration.
The resulting off-gas from a packed toweris laden with H2S, and to prevent odor issues, achemical wet scrubber was chosen. Approxi-mately 20,000 to 40,000 gal per day (gpd) ofpotable water would be mixed with sodium hy-droxide and sodium hypochlorite, and recircu-lated through the scrubber several times totransfer the sulfide from the gas phase back intoa liquid phase; it also oxidizes the H2S to sulfur orsulfate. The resulting blowdown water is treatedwith sodium bisulfite to removed excess freechlorine and sulfuric acid to lower the pH beforebeing disposed to the sanitary sewer. A wetscrubber was selected to treat the aerator off-gasover other options, such as a biological scrubber,to ensure reliable operation and minimize odorcomplaints from the nearby residents.
The construction cost for anaeration/scrubber system for WTP #2 was esti-mated to be approximately $1.53 million and ispresented in Table 3. The operational costs wereexpected to be approximately $300,000 per year,and are shown in Table 4. The operation andmaintenance (O&M) costs have been calculatedfor the average annual daily flow expected to beproduced when the expansion is complete (~4.2mgd of permeate).
The primary advantages for an aeration sys-tem are that it is a proven technology with manyapplications throughout the state, and it has alower capital cost than an ozone system. How-ever, disadvantages include: frequent cleaningsof the aerators and scrubbers, which is necessaryto prevent excessive biogrowth and to removeprecipitated sulfur; disposal of blowdown water;the visual aesthetics of the system, as the 28-ft.tall aerator towers and 26-ft. tall scrubbers wouldvery noticeable to the neighboring residents andare often associated with undesirable industrialfacilities; and the need to store and feed addi-tional chemicals. The proximity of the odor con-trol system to the residences and offices alsomakes routine maintenance of the system morecritical to avoid odor issues.
Ozone
Ozone is another technology that has beenproven to be effective at removing H2S fromFlorida groundwater supplies. Toho Water Au-thority, in central Florida, has used ozone foryears, and the utilities of Orange County andSeminole County have recently installed, or arein the process of installing, ozone generators forthe treatment of sulfide (Vanlandingham,2012). Ozone is a powerful oxidant, and when itcomes in contact with H2S or HS- the resultingproducts are oxygen gas and sulfate ion (SO4
2-),thus effectively removing the objectionable H2S
gas and replacing it with benign levels of sulfate(Duranceau, 2010).
Ozone for municipal water treatment istypically produced by passing oxygen through ahigh-voltage dielectric. Liquid oxygen (LOX) isoften used as an oxygen source and typical waterutility ozone generators can produce 10 percentor greater ozone concentrations. In order to ox-idize the average 1.4 mg/L of sulfide expected tobe found in the 5.25 mgd of permeate flow and
maintain an ozone residual of 0.2 mg/L, the de-sign requires 214 lbs of ozone per day (ppd) witha ozone-to-sulfide ratio of 3.1:1. Two 220 ppdgenerators were selected to provide redundancyand would be housed in a separate structure toshelter the units from weather.
Depending on the efficiency of the par-ticular generators, one lb of ozone requires be-tween eight and 12 lbs of LOX; therefore,
Table 4. Packed Tower Aerator/Scrubber System Operation Cost Estimate for RO WTP #2
Continued on page 42

under normal conditions, one 9,000-gal(85,600-lb) LOX tank would provide morethan 30 days of storage. Redundant vaporizerswould be operationally rotated to allow for ad-
equate defrosting. The building and otherareas near the ozone equipment will be mon-itored by ambient ozone monitors, and analarm will sound if ambient ozone concentra-tions approach the regulated limits set by the
Occupational Safety and Health Administra-tion.
After the ozone is produced, it will be in-troduced to the permeate water by venturi in-jection into two 525-gpm sidestreams of theprocess water. The ozone-laden sidestreampasses through a degas separator that removesundissolved ozone and oxygen, after which thesidestream flow is reintroduced to the mainwater stream through a flash reactor. Theozone and water mixture is transferred to adissipation chamber, where any remaining sul-fides are oxidized and the ozone is off-gassed.The ozone collected by the dissipation cham-ber and degas separator is processed by a re-dundant set of catalytic ozone destruct units.Figure 4 diagrams the ozone generation andsidestream injection process flow.
An important aspect to consider when de-termining the feasibility of an ozone system forpotable water treatment is the potential forma-tion of regulated byproducts, such as bromate,aldehyde, and ketones; waters that are low in or-ganic matter and bromide produce far less ofthese regulated compounds. Since RO removesalmost all organic matter, the formation poten-tial of aldehyde and ketones is very low. Depend-ing on the membrane used, some bromide maypass through into the permeate. Pilot testing ofrepresentative RO membranes found that thepermeate bromide concentration can be expectedto be approximately 0.1 mg/L, which is not ex-pected to result in significant bromate formationduring ozonation (Crittenden, 2005).
The construction cost for an ozonationsystem for RO WTP #2 was estimated to be ap-proximately $2.52 million and is presented inTable 5. The operational costs were expected tobe approximately $128,000 per year and areshown in Table 6. The O&M costs have beencalculated for the average annual daily flow ex-pected to be produced when the expansion iscomplete (~4.2 mgd of permeate).
Advantages of the ozonation system in-clude the absence of an additional wastestream, ozonation used to obtain the 4-logcredit for virus inactivation as long as a resid-ual is maintained, and lower O&M costs thana packed tower aeration system. Disadvantagesfor ozonation include higher capital cost thanaeration, additional safety requirements, anda more complex treatment system.
Conclusion
The City of Clearwater’s new WTP #2 willrequire a sulfide treatment system to meet Cityand FDEP water quality criteria. Aeration andozone were both evaluated as potential options.Table 7 summarizes these options with their as-sociated advantages, disadvantages, and costs.
Figure 4. Ozone Treatment Process Flow Diagram
Table 5. Ozonation System Capital Cost Estimate for RO WTP #2
Table 6. Ozonation System Operation Cost Estimate for RO WTP #2
Continued from page 41
42 October 2013 • Florida Water Resources Journal

Based on the estimated capital and O&M costdifferences, the additional capital spent onozone will be recovered (relative to aeration) inapproximately five to seven years (a 3 percentannual increase in O&M costs and a 3 percentinterest rate for capital investment were as-sumed). Taking this into account with otherconcerns, such as visual aesthetics and poten-tial odor concerns, ozone was selected for sul-fide removal for the City of Clearwater’s reverseosmosis expansion of WTP #2. The project iscurrently expected to be completed in 2015.
References
• Chastain, J.R. “Hydrogen Sulfide in Water Sys-tems: What’s That Smell?” Consultant Update.2008.
• Crittenden, J.C., Trussell, R.R., et al. Water Treat-ment – Principles and Design (2nd Edition).2005.
• Duranceau, S.J., Trupiano, V.M., et al. “Innova-tive Hydrogen Sulfide Treatment Methods:Moving Beyond Packed Tower Aeration.”Florida Water Resources Journal, July 2010.
• Florida Department of Environmental Protec-tion (FDEP). “62-555.315 Public Water SystemWells – Security; Number; Capacity; Under theDirect Influence of Surface Water; Control of
Copper Pipe Corrosion and Black Water; andDisinfection and Bacteriological Surveys andEvaluations.” 2003.
• Vanlandingham, B., Kunihiro, K., et al. “Balanc-
ing Ozone, Sulfide, Oxygen, and Cost: The NewSouthern Regional Water Supply Facility in Or-ange County.” Florida Water Resources Journal,November 2012. ��
Table 7. Ozonation and Aeration Advantages and Disadvantages for Sulfide Removal
Florida Water Resources Journal • October 2013 43

Doug Prentiss Sr.
As the FWEA SafetyCommittee chair Iget involved in some
interesting projects and thismonth I wanted to share
one, since it may be interesting to many of you. In June of this year, the fire chief of a local
city contacted the Florida Department of En-vironmental Protection (FDEP) with ques-tions about the training levels or standards forwater plant technicians. He was trying to findout what level of training or certification op-erators are required to have when handlingcompressed chlorine gas that is used to purifythe water system. In the current plan, the citywater department had the repair kits to handleemergencies, but needed additional training tobe able to use the emergency equipment safely.
As I move around the state, I have seenthis exact story repeat itself many times. Al-most every new plant using gas chlorine getsan emergency response kit and some air packs,
but rarely any training. Since most new plantstoday use bleach rather than gas, the problemis getting smaller, but it still exists, especiallywhere 150-lb. cylinders are being used at re-mote locations. So, if your staff is using 150-lb. cylinders at water wells, read the rest of thesuggestions to the fire chief.
He was looking for the right training toallow him to protect his citizens, but while try-ing to come up with a cooperative responseplan for chlorine emergencies, the fire depart-ment determined it could not currently miti-gate chlorine leaks because the employees werenot trained at the hazmat-technician level.
So, surrounded by utility workers need-ing training, and his staff also not allowed torespond because of a lack of training, our firechief used incident command techniques andmutual aid to resolve his immediate problem.In fact, the mutual aid he received was fromthe Tallahassee Fire Department HazardousMaterials Team using a 150-lb. cylinder coffinprovided by the City of Tallahassee UtilitiesDivision. Since Tallahassee does use this disin-
fection at its water wells, its also trains andequips its workers to respond to emergencies.This training also includes mutual aid betweenthe treatment plant workers and the fire de-partment.
In this application, the plant obtained twocylinder coffins and placed one near the stor-age sites and one with the hazardous materialsunit of the fire department. It was this fire de-partment using the utility coffin that re-sponded to the smaller city that is stillstruggling to get its hazardous materials act to-gether. There are many utilities, like Tallahas-see, Destin, Orange County, Clermont, andGRU, that do elemental chlorine correctly andactually promote training in their own areasfor other agencies. So, what our fire chiefwants to know is, “What do the managers at allof these utilities already know?”
The final question in his letter to FDEPfrom the fire chief was, “Is there a difference inthe level of hazmat training between fire de-partment and civilians? If you could point mein the right direction for guidance on this Iwould appreciate it.“
Fortunately for everyone, his email wentto Jennifer Paris, the emergency responsemanager for FDEP in Tallahassee, and shereached out to a few friends for answers.
One of those who had already providedthe fire chief with answers about operatortraining was Ron McCulley, who is the certifi-cation and restoration program administrator.Ron provided the following expectations forchlorine gas training for operators and main-tenance staff at plants:
Education for Introduction Levela. Identify types of hazards common to gas
chlorineb. Recognize unsafe conditions and prescribe
corrective measuresc. Identify and safely handle cylinders or con-
tainers used at the facilityd. Recognize hazards conditionse. Recognize fire hazards related to gas chlo-
rine
Education for Licensed Operatorsa. Operation and control of a treatment plant
disinfection process b. Troubleshooting treatment disinfection
Chlorine First ResponderTraining Clarification
SPOTLIGHT ON SAFETY
Tarpons Springs Emergency Operations Center provided the training facility, Tarpons Springs Utilityhosted the event, the local emergency planning committee paid for the instruction, and several local util-ities and the fire department received training at no cost.
44 October 2013 • Florida Water Resources Journal

processesc. Health and safety (associated with waste-
water/drinking water/water distributionsystems)
d. Employment and community right-to-know notification procedures
e. Toxic and hazardous materials handlingprocedures
f. Supervision and management of disinfec-tion chemicals
g. Basic chemistry and biologyh. Government rules and procedures i. Security (applicable to water/wastewater
treatment or water distribution systems)j. Emergency response
Jennifer also contacted me with questionsfrom the fire chief and I wanted to respond tothe ones concerning the level of training re-quired to be a first responder for chlorine, sincethis is the key he needs to resolve his problem.This question is widely misunderstood and Ihope that by working with FDEP that more op-erators and fire services personnel will gain abetter understanding of what really is a prettystraight forward set of requirements.
To start with, the training is driven by thematerials in use. Since this article is about gaschorine, the information concerning hazardsassociated with the use of this chemical comesfrom the material safety data sheet. The per-missible exposure level for eight hours is .5parts per mil (ppm), the short-term exposureis 1.0 ppm for fifteen minutes, and the imme-diately dangerous level to life and health levelis 10 ppm. The Chlorine Institute manual forelemental chlorine lists one or two breaths ofchlorine gas at 1000 ppm as potentially lethal.If you use this chemical, you are obligated totrain your workers to understand these haz-ards and document that training. The chemi-cal is the same whether it is in a 150-lb.cylinder or a 1-ton container, so understand-ing the chemical safety issues is the same.
When the U.S. Environmental ProtectionAgency (EPA) and the Occupational Safetyand Health Administration (OSHA) devel-oped the risk management plan and theprocess safety requirements, they laid out abasic framework for emergency response. Inessence, it said if you use hazardous chemicalsthat workers may be exposed to, you musttrain them at one of three levels.
The first is the “awareness level,” where theworkers know enough to recognize the chemi-cal, know its dangers, and know how to begin thenotification of an emergency response. Aware-ness-level training for gas chlorine is well docu-ment by Chlorine Institute manuals and trainingguides. The Chlorine Institute actually has a verygood video and pamphlet just for water and
wastewater operators that cover all of this.The next level of training is the “opera-
tions level,” which requires a much higher levelof training that will allow defensive responsesto the release of hazardous chemicals. Opera-tors could, for instance, shut off a leakingvalve, if they could do so safely. For gas chlo-rine emergency response, eight hours of train-ing is required each year to maintain a firstresponder at the operations-level status.
The “technician-level” chlorine first re-sponse is much more detailed, but still only re-quires 24 hours of training every 24 months.This may also expand if Class A suits are in-cluded, but once the initial training is com-plete, 24 hours keeps chlorine first respondersat the technician level fully-trained and readyto respond to and mitigate elemental chlorineleaks.
The part of this I hope you are all gettingis that a chlorine first responder at the techni-cian level can only work on chlorine leaks, butonly has to have 24 hours of training everyother year. The Chlorine Institute, EPA,and OSHA worked on this specificissue to enable all of us to use ahighly effective disinfection chemi-cal without going overboard ontraining.
The exciting part of this for firefighters is they can do the same thing.I have been doing this training for over 20years, spending three days at fire departments
and local emergency planning committee sitesproviding standard fire fighters with 24 hoursof training so they can perform as chlorinefirst responders at the technician level apply-ing “A” kits and emergency response coffins tomitigate elemental chlorine leaks.
Perhaps the most exciting part of thistype of training for fire fighters and utilityworkers is that it can be free, paid for by thevery tax dollars contributed by industries thatuse the chemicals. Each area local emergencyplanning committee (LEPC) sponsors thistype of training. Tarpons Springs hosted aclass like this by arranging with its local LEPCto fund the instructor and the local fire de-partment to provide the training building, andthen both sent workers to the class and all re-ceived continuing education units. More im-portantly, however, they also received thedesignation of a chlorine first responder at thetechnician level.
If you need any more information on thisissue, please do not hesitate to drop me a
line at [email protected].
(photos: Doug Prentiss Jr.)
Doug Prentiss ispresident of DPI, provid-
ing a wide range of safetyservices throughout Florida.
He also serves as chair of theFlorida Water Environment Asso-
ciation Safety Committee. ��
At the Tarpons Springs Fire Department equipment bay, students learn how to apply emergency devicesusing Class B personal protective equipment and self-contained breathing apparatus.
Florida Water Resources Journal • October 2013 45

46 October 2013 • Florida Water Resources Journal
For years, regulatory issues surroundingmobilization of arsenic in groundwaterhave stymied development of new
aquifer storage and recovery (ASR) systems inFlorida. Introduction of oxygenated waterduring the ASR recharge cycle can dissolvesmall amounts of arsenic and mobilize it ingroundwater within the storage zone aroundthe production wells causing exceedance of thedrinking water standard for arsenic in ground-water. Monitoring data show that arsenic mo-bilization tends to be limited to short distancesfrom the ASR production well, making it a
New Path to Permitting Aquifer Storageand Recovery Systems in Florida
Mike Coates, Patrick Lehman, Craig Varn, and Douglas Manson
Mike Coates, P.G., is the deputy directorand Patrick Lehman, P.E., is the executivedirector at Peace River Manasota RegionalWater Supply Authority in Lakewood Ranch.Craig Varn is an attorney with the MansonBolves law firm in Tallahassee. DouglasManson is an attorney and president of theManson Bolves law firm in Tampa.
F W R J
Figure 1. AuthorityService Area
Figure 2. Aquifer Storage and Recovery Wellfield 2 Production Well Configuration

manageable situation where the ASR entity hasownership or control of surrounding land.These data provide support for the track pur-sued by the Peace River Manasota RegionalWater Supply Authority (Authority) for thepermitting of its ASR system, and a potentialremedy to the regulatory barrier to future ASRdevelopment in Florida.
In August 2012, the Authority submittedan application to the Florida Department ofEnvironmental Protection (FDEP) for a UICClass V, Group 7 injection well operation per-mit to combine its two ASR wellfields underone permit at the Peace River Facility (Facil-ity) site. The application was accompanied bya petition for water quality criteria exemption(WQCE) pursuant to Rule 62-550.500, F.A.C.The WQCE petition requested that arsenicconcentrations be allowed to exceed the drink-ing water standard (10 ug/L) within the ASRstorage zone on property owned or controlledby the Authority, as long as the arsenic stan-dard is met at the property boundary. Issuanceof the WQCE required demonstration of pub-lic interest, protection of public health, safety,and welfare, and a number of other require-ments, including noninterference with use ofthe groundwater resources and adequate mon-itoring and protection of water resources.
Aquifer Storage and Recovery Defined
In this article, ASR involves the use of wellsto inject water into a storage zone in the upperFloridan aquifer, and recovery of the stored sup-ply when needed. Successful development of al-ternative water supplies using surface water inFlorida depends on the availability of large vol-ume storage such as ASR, which can be filledquickly when surface water resources are in abun-dance, allowing use of the stored water to meetwater supply needs during the state’s extendeddry season when surface water resources arescarce.
In Florida, ASR systems are permitted underChapter 62-528, Florida Administrative Code(F.A.C.), where they are designated as eitherGroup 3 (reclaimed water) or Group 7 (potableor non-potable) injection wells. A review of FDEPrecords in 2011 indicated that of 88 ASR systempermits issued in Florida, 38 percent store surfacewater, 34 percent store groundwater, and 28 per-cent store reclaimed water. Surprisingly, only fourof the ASR systems in the state have been issuedoperation permits to allow the system to be usedas needed to meet demand. Forty systems operateunder a construction permit or a “letter of au-thorization to use,” which typically requires a de-
fined storage and recovery of water each year (i.e.,cycle testing). Permits for 28 of the systems areexpired and another 16 were under review byFDEP.
The very low percentage of operation per-mits, high percentage of ASR systems that con-tinue, sometimes for decades, under constructionpermits, and the large number of inactive systems(expired permits), is the product of an uncertainregulatory climate surrounding ASR; specifically,the issue is mobilization of arsenic in groundwa-ter. Arsenic, a naturally occurring element in thesubsurface often associated with the mineralpyrite, is found in small quantities in the matrixof the limestone aquifers most often used inFlorida for ASR. Introduction of oxygenatedwater during the ASR recharge cycle can dissolveand mobilize the arsenic, thereby degradinggroundwater quality.
Arsenic mobilization gained a great deal ofsignificance as an issue for ASR systems in Jan-uary 2006 when the U.S. Environmental Protec-tion Agency (EPA) changed the primarydrinking water standard for arsenic from 50ug/L (parts per bil) to 10 ug/L. Many ASR sys-tems met the 50 ug/L arsenic standard after asmall number of recharge and recovery cycles;however, the 10 ug/L standard essentially cur-
Florida Water Resources Journal • October 2013 47
Continued on page 48

48 October 2013 • Florida Water Resources Journal
tailed ASR development in Florida. Monitoringdata at the Authority’s ASR system shows thatmobilized arsenic tends to migrate only shortdistances within the storage zone from the ASRproduction (injection/recovery) wells and usu-ally attenuates further and further with eachcycle period. As such, where the ASR entity hasownership or control of surrounding land, orsome other form of institutional controls on useof the aquifer within the zone of influence, thearsenic issue becomes a manageable condition.
The ability to control the extent of dis-solved arsenic migration and the use of ground-water resources by others within the area wherearsenic standards may be exceeded provided thebasis for a new track to permitting an ASR sys-tem by the Authority in southwest Florida. Thishas the potential to expand ASR developmentin Florida, improving opportunities for alter-native water supply development and support-ing the environment in the process.
Peace River Manasota RegionalWater Supply Authority
The Authority is an interlocal govern-mental agency created in 1982 to supplydrinking water to Charlotte, DeSoto, Mana-tee, and Sarasota counties, and the City ofNorth Port in southwest Florida (Figure 1).The Authority's water production and storagefacilities in DeSoto County include a 120-mil-gal-per-day (mgd) water intake on the PeaceRiver, a 48-mgd conventional surface watertreatment plant, 6.5 bil gal in off-stream rawwater storage, and 6.3 bil gal in finished waterASR storage capacity. The facilities currentlyserve an average demand of 25 mgd.
Peace River Aquifer Storage and Recovery System
The Authority owns and operates twoASR wellfields at the Facility. ASR Wellfield 1includes nine production wells installed incre-mentally between 1984 and 1995. Eight of thewells utilize the Suwannee Limestone in theupper Floridan aquifer at depths of 600 to 900ft below land surface as the storage zone, whileone of the wells utilizes the Tampa Member ofthe Arcadia Formation at a depth of about 400to 500 ft below land surface. Wellfield 2 in-cludes 12 production wells completed in 2002,all of which utilize the Suwannee Limestone asthe storage zone. Figure 2 (CH2M Hill, 2012)shows ASR production well characteristics andgeologic sequence for the area. Figure 3 showsthe ASR wellfield locations relative to the PeaceRiver water treatment and reservoir storage fa-cilities.
In addition to the production wells, theAuthority’s ASR system also includes 24 mon-itoring wells (16 Suwannee zone, four Tampazone, and four shallow Arcadia and PeaceRiver formation). Native water quality in theSuwannee storage zone generally meets drink-ing water standards, with the exception of totaldissolved solids and sulfate, which averageabout 900 mg/L and 300 mg/L, respectively.
Both ASR wellfields store fully-treateddrinking water. The ASR system is generallyrecharged during the summer wet season whenraw water reservoir storage is high, excess water isavailable from the Peace River, and water demandfrom Authority customers is relatively low. To ad-dress increased arsenic concentrations, water re-covered from the ASR system is discharged andmixed into the raw water reservoir system andthereafter is fully retreated, removing arsenic be-fore delivery to customers.
The ASR Wellfield 1 has operated since 1985under a “letter of authorization to use” before itwas issued a UIC Class V, Group 7 operation per-mit in 2008, along with an administrative order toaddress any exceedance of arsenic. While recov-ered water from wells in Wellfield 1 is generallybelow the 10 ug/L arsenic standard, after morethan 20 years of operation, infrequent exceedanceof the standard continues. Wellfield 1 is operatedas-needed to aid in meeting regional water de-mand.
The ASR Wellfield 2 has operated under aUIC Class V, Group 7 construction permit since1999, with a recent renewal in 2011. The con-struction permit requires cycle testing, which in-volves specified recharge quantities, storagetimeframe, and recovery quantities on each cycle,whether those quantities are needed to meet de-mand or not. The wellfield is currently on cycle13, and while arsenic concentrations in recoveredwater are declining, the wellfield average remainsbetween 15 and 20 ug/L.
Arsenic Mobilization at PeaceRiver Aquifer Storage and
Recovery Facilities
Data collected from production and mon-itoring wells at the Authority’s ASR facilities in-dicates that while arsenic concentrationsperiodically exceed drinking water standards inindividual ASR production wells, dissolved ar-senic concentrations attenuate within short dis-tances from the production wells. This suggeststhat arsenic is reprecipitated in the aquifer.Maximum arsenic concentrations recorded in2012 from ASR Wellfield 2 production andmonitor wells are shown in Figure 4 (CH2MHill, 2012). The short migration distances forarsenic make this a condition that can be man-aged within Authority-controlled property. Mi-gration is expected to be influenced by thevolume of water in storage and, potentially, theASR recharge rate. Storage in Wellfield 2 dur-ing 2012 peaked at about 1.5 bil gal.
New Permitting Strategy
The 2013 expiration date for the Wellfield 1operating permit, continuation of costly cycletesting at Wellfield 2 under the existing con-struction permit, and the general plight of ASRin Florida, led the Authority to consider a dif-ferent permitting track for these facilities. Dis-cussions with the FDEP staff indicated that theagency was interested in developing a mecha-nism to improve opportunities for ASR in thestate, while ensuring resource protection. In2010 the FDEP issued a white paper proposinguse of a zone-of-discharge concept to addressthe regulatory issues associated with arsenic mi-gration (FDEP, 2010). That concept providedthe basis for a new ASR permitting strategy.
Figure 3. Peace River Facilities and Aquifer Storage and Recovery Wellfield Locations
Continued on page 50
Continued from page 47

Florida Water Resources Journal • October 2013 49
The Florida Water Environment Association (FWEA) will pres-ent the third annual Florida Water Festival on October 26 at CranesRoost Park at Uptown Altamonte in Altamonte Springs from 9 a.m.to 3 p.m. Designed to educate the public about the importance ofprotecting the state’s water resources, this event offers fun and ed-ucational events for those in the water industry and their familiesand friends. Last year’s festival had over 300 visitors and there is nocost to attend!
See what it’s like to carry water for a long distance, as many inthe developing world still must do every day, by participating in theone-mile Walk for Water. Participants will also learn facts aboutwater around the world as they walk. Enjoy music, interactivedemonstrations on water quality sampling and testing, and learn
how waterrec lama-tion sys-tems work.Chi ldrenwill enjoythe poster contest, water animal face painting, and a water filtrationtest. There will be exhibits from area companies and agencies, andprize drawings throughout the day.
For more information, contact Stacey Smith [email protected] or (407) 650-2189. You can also visitwww.fwea.org/water_festival.php and “Like” the Facebook page atwww.facebook.com/FloridaWaterFestival.
FWEA Announces3rd Annual Florida
Water Festival
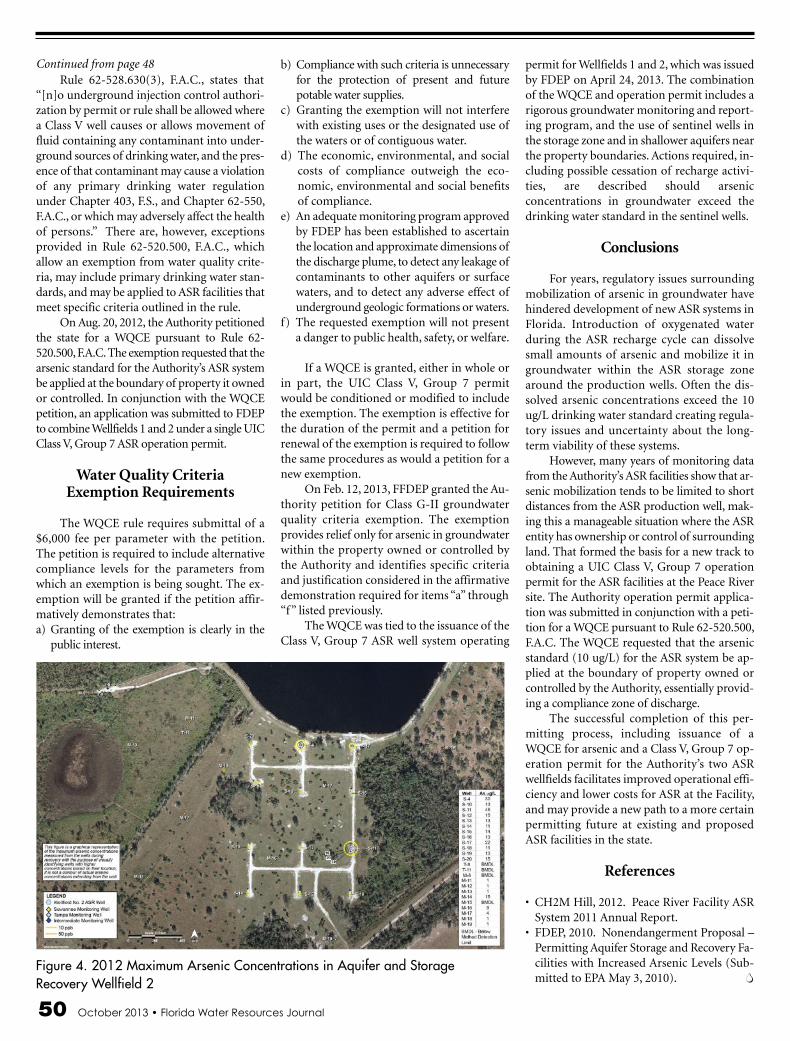
50 October 2013 • Florida Water Resources Journal
Rule 62-528.630(3), F.A.C., states that“[n]o underground injection control authori-zation by permit or rule shall be allowed wherea Class V well causes or allows movement offluid containing any contaminant into under-ground sources of drinking water, and the pres-ence of that contaminant may cause a violationof any primary drinking water regulationunder Chapter 403, F.S., and Chapter 62-550,F.A.C., or which may adversely affect the healthof persons.” There are, however, exceptionsprovided in Rule 62-520.500, F.A.C., whichallow an exemption from water quality crite-ria, may include primary drinking water stan-dards, and may be applied to ASR facilities thatmeet specific criteria outlined in the rule.
On Aug. 20, 2012, the Authority petitionedthe state for a WQCE pursuant to Rule 62-520.500, F.A.C. The exemption requested that thearsenic standard for the Authority’s ASR systembe applied at the boundary of property it ownedor controlled. In conjunction with the WQCEpetition, an application was submitted to FDEPto combine Wellfields 1 and 2 under a single UICClass V, Group 7 ASR operation permit.
Water Quality Criteria Exemption Requirements
The WQCE rule requires submittal of a$6,000 fee per parameter with the petition.The petition is required to include alternativecompliance levels for the parameters fromwhich an exemption is being sought. The ex-emption will be granted if the petition affir-matively demonstrates that:a) Granting of the exemption is clearly in the
public interest.
b) Compliance with such criteria is unnecessaryfor the protection of present and futurepotable water supplies.
c) Granting the exemption will not interferewith existing uses or the designated use ofthe waters or of contiguous water.
d) The economic, environmental, and socialcosts of compliance outweigh the eco-nomic, environmental and social benefitsof compliance.
e) An adequate monitoring program approvedby FDEP has been established to ascertainthe location and approximate dimensions ofthe discharge plume, to detect any leakage ofcontaminants to other aquifers or surfacewaters, and to detect any adverse effect ofunderground geologic formations or waters.
f) The requested exemption will not presenta danger to public health, safety, or welfare.
If a WQCE is granted, either in whole orin part, the UIC Class V, Group 7 permitwould be conditioned or modified to includethe exemption. The exemption is effective forthe duration of the permit and a petition forrenewal of the exemption is required to followthe same procedures as would a petition for anew exemption.
On Feb. 12, 2013, FFDEP granted the Au-thority petition for Class G-II groundwaterquality criteria exemption. The exemptionprovides relief only for arsenic in groundwaterwithin the property owned or controlled bythe Authority and identifies specific criteriaand justification considered in the affirmativedemonstration required for items “a” through“f” listed previously.
The WQCE was tied to the issuance of theClass V, Group 7 ASR well system operating
permit for Wellfields 1 and 2, which was issuedby FDEP on April 24, 2013. The combinationof the WQCE and operation permit includes arigorous groundwater monitoring and report-ing program, and the use of sentinel wells inthe storage zone and in shallower aquifers nearthe property boundaries. Actions required, in-cluding possible cessation of recharge activi-ties, are described should arsenicconcentrations in groundwater exceed thedrinking water standard in the sentinel wells.
Conclusions
For years, regulatory issues surroundingmobilization of arsenic in groundwater havehindered development of new ASR systems inFlorida. Introduction of oxygenated waterduring the ASR recharge cycle can dissolvesmall amounts of arsenic and mobilize it ingroundwater within the ASR storage zonearound the production wells. Often the dis-solved arsenic concentrations exceed the 10ug/L drinking water standard creating regula-tory issues and uncertainty about the long-term viability of these systems.
However, many years of monitoring datafrom the Authority’s ASR facilities show that ar-senic mobilization tends to be limited to shortdistances from the ASR production well, mak-ing this a manageable situation where the ASRentity has ownership or control of surroundingland. That formed the basis for a new track toobtaining a UIC Class V, Group 7 operationpermit for the ASR facilities at the Peace Riversite. The Authority operation permit applica-tion was submitted in conjunction with a peti-tion for a WQCE pursuant to Rule 62-520.500,F.A.C. The WQCE requested that the arsenicstandard (10 ug/L) for the ASR system be ap-plied at the boundary of property owned orcontrolled by the Authority, essentially provid-ing a compliance zone of discharge.
The successful completion of this per-mitting process, including issuance of aWQCE for arsenic and a Class V, Group 7 op-eration permit for the Authority’s two ASRwellfields facilitates improved operational effi-ciency and lower costs for ASR at the Facility,and may provide a new path to a more certainpermitting future at existing and proposedASR facilities in the state.
References
• CH2M Hill, 2012. Peace River Facility ASRSystem 2011 Annual Report.
• FDEP, 2010. Nonendangerment Proposal –Permitting Aquifer Storage and Recovery Fa-cilities with Increased Arsenic Levels (Sub-mitted to EPA May 3, 2010). ��
Continued from page 48
Figure 4. 2012 Maximum Arsenic Concentrations in Aquifer and Storage Recovery Wellfield 2

New Products
Florida Water Resources Journal • October 2013 51
Innovyze introduces IWLive, a compre-hensive solution for real-time water distribu-tion hydraulic and water quality modeling,monitoring, forecasting, and SCADA inte-gration. Fully optimized for the controlroom, IWLive equips operators with ad-vanced analytics and decision-support toolsthat are both reactive and predictive, enablingthem to improve system performance and re-liability, enhance service, save money, safe-guard critical infrastructures, and protectpublic health.
More information can be found atwww.innovyze.com.
�The FPI Mag from McCrometer is a
high-performance hot tap flow meter for in-dustrial or municipal water applications. Theunique streamlined water flow sensor fea-tures multiple electrodes across the entire fulldiameter. Electrode pairs are positioned sothat each measures a cross-sectional area.Multi-electrode sensing provides accuratemeasurement without long upstream anddownstream pipe runs, providing a smallerfootprint for greater accuracy.
Go to www.mccrometer.com to learnmore.
�The Solar Sync ET sensor from Hunter
Industries is an advanced weather sensorthat calculates evapotranspiration and dailyadjusts the sensor controls based on localweather conditions. Solar Sync measures sun-light and temperature and uses evapotran-spiration to determine the correct seasonaladjustment percentage value to send to thecontroller. The controller then uses its pro-grammed run time and adjusts to SolarSync’s seasonal adjustment value to modifythe actual irrigation run time for that day.The Solar Sync evapotranspiration sensor in-tegrates Hunter’s Rain-Clik and Freeze-Cliksensors, providing quick response in shuttingdown an irrigation system during rain orfreezing conditions. The Solar Sync is com-patible with most Hunter controllers and canbe used by residences, businesses, and mu-nicipalities.
Visit www.hunterindustries.com formore details.
�The Amacan P submersible motor
pump from KSB Inc., originally designed for
stormwater and wastewater applications, hasa current capacity of up to 110,000 gal/minand a power range up to 550 hp. The pumpcan be installed horizontally or vertically.Built for stormy conditions, the system in-cludes a sealed shaft and motor and double-sealed cables. This design protects the cablesat entry to the pump motor and preventsmovement inside the tube, stabilizing the ca-bles and helping to prevent damage. The dif-fuser casing and motor housing are made ofcast iron, and the shaft, casing wear ring,screws, bolts, and nuts are stainless steel. Analuminum-bronze/duplex stainless steel pro-peller completes the pump.
More about the product is available atwww.ksb.com.
�The XD 3.0 grinder from JWC Envi-
ronmental is 13 ft tall, weighs 9300 lbs, andproduces 7 tons of cutting force at peak loads.The grinder combines rotating screen drumsand a Muffin Monster® grinder to shredsolids while processing up to 59 mgd. Thiscombination is ideal for pump stations sincethe grinder shreds rags, plastics, wood, andtrash so particulates flow easily throughpumps and pipelines. This new design fea-tures larger cutters, shafts, and housings,which enables the grinder to process heavydebris and first-flush storm loading.
To find out more, visit www.jwce.com.
�Blue-White Industries has a redesigned
Chem-Pro® C2 diaphragm metering pumpwith a broad range of capabilities, includinga larger pump cover, which enables engineersto increase the size of the control pad andmake it more intuitive. The pump also has asnap-on cover for the control pad. Other fea-tures include a remote start/stop, 4—20-mAoutput, upgradable firmware, a larger single-piece junction box (40 percent larger thanprevious models, and terminal-block con-nectors.
Log onto www.bluwhite.com for moreinformation.
�The Emerson 6888 combustion fuel an-
alyzer measures the oxygen remaining in fluegases from such combustion processes asboilers, incinerators, kilns, process heaters,and industrial heating furnaces. By main-taining the ideal level of oxygen in the flue
gases, optimal efficiency is achieved and thelowest levels of NOX, CO and CO2 are pro-duced.
The in situ design places a zirconiumoxide sensing element at the end of a probe,which inserts directly into a flue-gas stream.Probe lengths are available from 18 in. to 12ft, and a slip-mounting option provides theability to mount a long probe at any inser-tion depth. The product is fully field-re-pairable. All active components can bereplaced, including the diffuser/filter, sens-ing cell, heater and thermocouple, and allelectronics cards. A dual-channel operatorinterface unit provides an easy-to-usemethod of setup, calibration, and failure di-agnostics.
Go to www.emersonprocess.com forfurther details.
�Anue Water Technologies Inc. presents
the FORSe 5™ series of high-efficiency odor-and corrosion-control systems for wastewatercollection systems. The series uses sustainablemeans to eliminate the source and produc-tion of odor and corrosion. The systems in-tegrate on-site oxygen and ozone generationusing a proprietary “hydrodynamic” infusionprocess and microprocessor controls in aquiet and compact package. The systems treatforce mains, lift stations, or a combination ofthe two. The different models range in ca-pacity to accommodate various flows andloads. They are designed for ease of use andrequire limited maintenance.
For more information, visit www.anue-water.com.
�The PATROL Series PAX 5 generation of
105-dB(A) industrial flashing sounders fromPfannenberg Group are designed to warnof hazardous situations or production prob-lems in water and wastewater treatment fa-cilities, factories, commercial offices, sportsarenas, hotels, and other buildings, as well asaboard ships. Applications include evacua-tion signals for fires, toxic gas leaks, andchemical spills.
The company website, www.pfannen-bergusa.com, has more details. ��

52 October 2013 • Florida Water Resources Journal
Our Regions At Work: A Year in Pictures
As much as the board of governors andexecutive committee contribute to theFlorida Section, the active volunteers
by far contribute more. This is no more evi-dent than in our twelve regions. Without ourregional chairs and the active volunteer basewithin each region, the Florida Section wouldnot be able to accomplish what it does eveyyear.
They say a picture is worth a thousandwords, so instead of me writing about the re-gional contributions, I want to show you theircontributions. This article is devoted to show-casing the wonderful work our volunteers andmembers do locally, within their regionsthroughout the year, for the Florida Sectionand for our industry.
Please make sure to visit the website atwww.fsawwa.org to see what other activitiesyour region is hosting for the remainder of year.Don’t forget to mark your calendars for the An-nual Fall Conference to be held December 1-5at the Omni Hotel Resort at ChampionsGate.Please take the opportunity to visit the confer-ence website and register early before the con-ference rates go up on November 2. This is theone event you don’t want to miss! ��
FSAWWA SPEAKING OUT
Jason Parrillo, P.E.Chair, FSAWWA
Region IIIvolunteers spentthe day looking for trash at the St. Johns Riverannual cleanup.
Region VIII participated in the City of Stuart's “Saturday in the Park” Water Fest on April 6 inMemorial Park.
Region IV andFSAWWA WUEDDemystifying theCodes Workshopheld on June 28at the SWFWMDTampa office.There were 28people in atten-dance at theworkshop.
Region II's TenthAnnual Day ofFishing held in
June held inMayport..

Florida Water Resources Journal • October 2013 53
Region VI third annual Model Water Tower Com-petition held in Boca Raton. Melissa Velez check-ing in the students.
Region II held its Annual Best Taste Drinking WaterContest on April 11 at the Guana TolomatoMatanzas National Estuarine Research Reserve(GTM NERR) in Ponte Verde Beach. The St. JohnsCounty Utility Department water from the CR214Water Treatment plant was selected as the winner.
Judging atRegion IX'sBest TastingDrinkingWaterContest heldat DestinWater UsersFacility.
Region XI hosted the Ed Singley Golf Classic on Saturday, May 18, in Gainesville.

54 October 2013 • Florida Water Resources Journal

FWPCOA TRAINING CALENDARSCHEDULE YOUR CLASS TODAY!
* Backflow recertification is also available the last day of BackflowTester or Backflow Repair Classes with the exception of Deltona
** Evening classes
*** any retest given also
OCTOBER11 ......Backflow Tester Recert*** ....................Deltona ..............$85/115
21-24 ......Backflow Tester ....................................Pensacola ..........$375/405
NOVEMBER5 ......Backflow Recert ....................................Lady Lake ..........$85/115
4-7 ......Backflow Tester ....................................St. Petersburg ....$375/405
4-8 ......Reclaimed Water Field Site Inspector ..Orlando ............$350/380
8 ......Backflow Tester Recert*** ....................Deltona ..............$85/115
DECEMBER2-5 ......Backflow Tester ....................................Deltona ..............$375/405
13 ......Backflow Tester Recert*** ....................Deltona ..............$85/115
16-18 ......Backflow Repair ....................................St. Petersburg ....$275/305
You are required to have your own calculator at state short schools
and most other courses.
Course registration forms are available at http://www.fwpcoa.org/forms.asp. For additional information on these courses or other training programs offered by the FWPCOA, please
contact the FW&PCOA Training Office at (321) 383-9690 or [email protected].
Florida Water Resources Journal • October 2013 55

56 October 2013 • Florida Water Resources Journal

Florida Water Resources Journal • October 2013 57
ENGINEERING DIRECTORY
Tank Engineering And ManagementConsultants, Inc.
Engineering • Inspection
Aboveground Storage Tank SpecialistsMulberry, Florida • Since 1983
863-354-9010www.tankteam.com

58 October 2013 • Florida Water Resources Journal
ENGINEERING DIRECTORY
Showcase Your Company in the Engineering or Equipment & Services Directory
EQUIPMENT & SERVICES DIRECTORY
Contact Mike Delaney at 352-241-6006
Fort Lauderdale954.351.9256
Gainseville352.335.7991
West Palm Beach561.904.7400
Jacksonville904.733.9119
Key West305.294.1645
Miami305.443.6401
Navarro850.939.8300
Orlando407.423.0030
Tampa813.874.0777 813.386.1990
Naples239.596.1715

Florida Water Resources Journal • October 2013 59
EQUIPMENT & SERVICES DIRECTORY
CentralFloridaControls,Inc.
Instrumentation Calibration
Troubleshooting and Repair Services
On-Site Water Meter Calibrations
Preventive Maintenance Contracts
Emergency and On Call Services
Installation and System Start-up
Lift Station Controls Service and Repair
Instrumentation,Controls Specialists
Florida Certified in water meter testing and repair
P.O. Box 6121 • Ocala, FL 34432Phone: 352-347-6075 • Fax: 352-347-0933
www.centra l f lor idacontrols .com
CEC Motor & Utility Services, LLC1751 12th Street EastPalmetto, FL. 34221
Phone - 941-845-1030Fax – 941-845-1049
• Motor & Pump Services Test Loaded up to 4000HP, 4160-Volts
• Premier Distributor for Worldwide Hyundai Motors up to 35,000HP
• Specialists in rebuilding motors, pumps, blowers, & drives
• UL 508A Panel Shop, engineer/design/build/install/commission
• Lift Station Rehabilitation Services, GC License # CGC1520078
• Predictive Maintenance Services, vibration, IR, oil sampling
• Authorized Sales & Service for Aurora Vertical Hollow Shaft Motors
Motor & Utility Services, LLC

60 October 2013 • Florida Water Resources Journal
EQUIPMENT & SERVICES DIRECTORYShowcase Your Company inthe Engineering or Equipment
& Services Directory
Contact Mike Delaney at 352-241-6006
Posi t ions Avai lable
Utilities Storm Water Supervisor$51,494-$72,457/yr. Plans/directs the maintenance, construction,repair and tracking of stormwater infrastructure. AS in Management,Environmental studies, or related req. Min. five years’ exp. instormwater operations or systems. FWPCOA “A” Cert. req. Apply: HRDept., 100 W. Atlantic Blvd., Pompano Beach, FL 33060. Open untilfilled. E/O/E. Visit www.mypompanobeach.org for details.
SCADA Network TechnicianUtilities Department - Town of Jupiter, FL: Experience administeringa SCADA Network required. Knowledge of the water treatmentprocess preferred. For more information, seehttp://www.jupiter.fl.us/Jobs.aspx
City of St. Petersburg – Water Resources Engineer IRC26821
$56,426 - $86,968 DOQ – Deadline 06-21-2013;Technical, supervisoryengineering work in design, operation, maintenance ofwater/wastewater facilities; requirements: four-year degree inEnvironmental Engineering or related, valid State of Florida Driver’sLicense, State of Florida Registered Professional Engineer - Seedetailed requirements, apply online at www.stpete.org/jobs or mailresume to Employment Office, PO Box 2842, St Petersburg FL 33731EOE/DFWP/Vets.' Pref.
Purchase Private Utilities and Operating RoutesFlorida Corporation is interested in expanding it’s market in Florida.We would like you and your company to join us. We will buy orpartner for your utility or operations business. Call Carl Smith at 727-835-9522. E-mail: [email protected]
We are currently accepting employment applications for the following positions:
Water & Wastewater Licensed Operator’s – positions are available inthe following counties: Pasco, Polk, Highlands, Lee
Instrumentation Technician – Pasco
Maintenance Technicians – positions are available in the followinglocations: Jacksonville, Lake, Marion, Ocala and Palatka
Employment is available for F/T, P/T and Subcontract opportunitiesPlease visit our website at www.uswatercorp.com
(Employment application is available in our website)4939 Cross Bayou Blvd.
New Port Richey, FL 34652Toll Free: 1-866-753-8292
Fax: (727) 848-7701E-Mail: [email protected]
Water and Wastewater Utility Operations, Maintenance,Engineering, Management
City of MargateCHIEF UTILITY MECHANIC
Applicant must possess a High School diploma or GED;supplemented by completion of trade school, supplemented by five(5) years work experience in the maintenance and repair ofmechanical equipment, structures and installation and repair ofwater/wastewater utility systems, three (3) years of which shall be in asupervisory capacity, or an equivalent combination of training andexperience. Must have valid CDL class "B" Florida Driver's Licenseupon application. Annual salary range - $43,709 - $61,324, DOQ.Applications are available in Human Resources, Margate City Hall,5790 Margate Blvd., Margate, FL 33063 or may be down loaded fromthe web site at www.margatefl.com. This position is open until filled.The City of Margate is a participant in the Florida Retirement Systemand is an Equal Opportunity Employer.
C L A S S I F I E D S
Florida Water Resources Journal • October 2013 61
Water Plant SuperintendentThe City of Miramar Utility Department is seeking qualifiedcandidates for a Water Plant Superintendent. This position isresponsible for supervising day to day operations of a potable watertreatment plant in the City of Miramar. It requires Florida State Class“A” Operators license and 10 years progressive supervisory experiencein water system operations. Starting salary is $48,426 annually. Formore information and to apply for this position, please go to the Cityof Miramar’s employment website at http://www.miramarjobs.us.
CITY OF WINTER GARDEN – POSITIONS AVAILABLE
The City of Winter Garden is currently accepting applications for thefollowing positions:
- Wastewater Plant Operator Class C- Water Plant Operator Class C- Wastewater Treatment Manager - Collection Field Tech - I- Collection Field Tech II- Utilities Operator II- Customer Service Technician I
Please visit our website at www.cwgdn.com for complete jobdescriptions and employment application. Applications may besubmitted online, emailed to [email protected] or faxed to 407-877-2795.
WATER PLANT OPERATORCITY OF TEMPLE TERRACE
Technical work in the operation of a watertreatment plant and auxiliary facilities on anassigned shift. Performs quality control labtests and other analyses, monthly regulatoryreports, and minor adjustments and repairs toplant equipment. Applicant must have State ofFlorida D.E.P. Class “A”, “B”, or “C’ DrinkingWater Certification at time of application.Salary Ranges – “A”-$17.33 – 26.01; “B”-$15.76-23.65; “C”-$14.33-21.50. Excellentbenefits package. To apply and/or obtain moredetails contact City of Temple Terrace, Florida,Human Resources at (813) 506-6430 or visitwww.templeterrace.com. EOE/DFWP
WASTEWATER PLANT SUPERVISORThe City of Lakeland is seeking a Wastewater Plant Supervisor. TheSalary is $42,993.60 - $66,684.80/yr. This is skilled and technical workin the operation and maintenance of the City’s wastewater treatmentplants. Requires a high school diploma from an accredited school or aG.E.D. and three (3) years of wastewater plant operations experience.Must possess and maintain a state of Florida Class “B” wastewater plantoperator certification. Continuous – Position may close at anytimewithout notice. Applicants must complete an online application at:http://www.lakelandgov.net/employmentservices/EmploymentServices/JobOpportunities.aspx.EOE/DFWP
CHIEF WATER PLANT OPERATORBonita Springs Utilities located in Bonita Springs, FL is seekingqualified candidates for a CHIEF WATER PLANT OPERATOR forboth RO and Lime plant facilities. This position is responsible forsupervising the day to day operations of (2) potable water treatmentplants along with overseeing the maintenance. This position requiresa Florida Class A License and at least 5 years of supervisory experience.Must be knowledgeable about treatment processes. The annual salaryrange is 51,065 to $76,595. For more information and to apply for thisposition, please go to www.bsu.us.
CLASSIFIED ADVERTISING RATES -
Classified ads are $18 per line for a 60character line (including spaces andpunctuation), $54 minimum. The priceincludes publication in both the magazineand our Web site. Short positions wantedads are run one time for no charge andare subject to [email protected]

City of St. Petersburg –Water Maintenance Manager IRC27324
$64,987 - $97,435 DOQ – Open Until Filled; Supervisory, technicalwork in construction, installation, maintenance and repair of potableand reclaimed water systems; requirements: high schooldiploma/GED equivalency; State of Florida Drivers License; State ofFlorida Class "A", "B" or "C" license in Water Distribution and FW &PCOA certificates in Cross Connection Control and/or ReclaimedWater - See detailed requirements, apply online atwww.stpete.org/jobs or mail resume to Employment Office, PO Box2842, St Petersburg FL 33731 EOE/DFWP/Vets.' Pref.
Posi t ions WantedJACK BECK – Has completed the Florida C Wastewater course and is seekinga trainee position to aquire plant hours to obtain his license. Prefers thesouthwest Florida area but is willing to relocate. Contact at 121 Sinclair Street,SW. Port Charlotte, Fl. 33952. 941-276-6650
B’ANTERIO “Anthony” JOHNSON – Passed the C Water course with 1,900hours credit. Seeking a trainee position to complete required plant hours. Alsocompleted and tested for C Wastewater course, results pending. Willing torelocate. Contact at 1419 E. Green St. Perry, Fl. 32347. 850-838-7376
“B” WASTEWATER OPERATOR – Five plus years experience seeking aposition in West Palm or Broward County but will consider other areas.Contact at 321-266-3065
COREY McCOY – Holds a Florida Double C license with 10 years experienceand has passed the B Wastewater test. Experienced in Maintenance, HeavyEquipment and is OSHA Certified. Prefers Lake, Orange or Polk Counties but iswilling to relocate. Contact at PO Box 501, Groveland, Fl. 34736. 352-346-1017
From page 11
1. A) 19.3 lbs/day/ft2
FormulaSolids loading rate, lbs/day/ft2
= Total lbs/day entering the secondary clarifier ÷clarifier surface area, ft2
Total lbs/day entering the secondary clarifier = Total flow entering the clarifier, mgd x MLSS,
mg/L x 8.34 lbs/gal= (5.5 mgd x 1.5) x 2,200 mg/L x 8.34 lbs/gal= 8.25 mgd x 2,200 mg/L x 8.34 lbs/gal = 151,371 lbs/day
Clarifier surface area = πr2
3.14 x (50 ft x 50 ft) = 7,850 ft2
151,371 lbs/day ÷ 7,850 ft2
= 19.28 lbs/day/ft2
2. C) RotiferBeginning with the lowest life form, themicroorganism indicators are amoebas, smallflagellates, large flagellates, free swimmingciliates, stalk ciliates, rotifers, nematodes(worms), and water bears. So, of the threeindicators listed in the question, the rotifer is thehighest life form in the activated sludge process.
3. B) A strong influent waste strength.The term “loading” refers to the demand foroxygen placed on the activated sludge process fromthe flow being treated. A shock load is a high
demand for oxygen from carbonaceousbiochemical oxygen demand (CBOD5), chemicaloxygen demand (COD), or nitrogen placed on theactivated sludge process in a short period of time.
4. B) High aeration dissolved oxygen.Because denitrification is an anoxic reaction,high dissolved oxygen levels in the aeration tankwill typically reduce denitrification efficiency.
5. B) Extended aerationIn regard to the growth curve of microorganisms,the far right side of the curve has low foodavailability, slow bug growth, low yield of new cells,high solids inventory, and poor oxygen utilizationtransfer efficiency. This translates to low F/M ratio,high SRT, low sludge yield, and increased lbs ofoxygen required per lb of CBOD5 destroyed. Thisextended aeration growth rate is also called“endogenous respiration.”
6. C) AutotrophicThere are two main groups of autotrophic bacteriathat are responsible for the conversion of inorganicammonia to nitrate. The first group, nitrosomonas,known as ammonia-oxidizing bacteria, convertammonia to nitrite. The second group, nitrobacter,known as nitrite-oxidizing bacteria, convert nitriteto nitrate. The process of nitrification does notnecessarily remove nitrogen from the wastewater; itonly converts it to a more stable form.
7. B) SRT and MCRTThe SRT and MCRT have similar concepts: lbs ofsolids in the activated sludge system divided by the
lbs per day of solids LEAVING the process. Typically,SRT is based on total solids, and MCRT is based onvolatile solids. The GSA, however, is the lbs of solidsin the activated sludge process divided by the lbs perday of solids ENTERING the aeration system.
8. D) Phosphorus accumulatingorganism (PAO)A PAO, or phosphorus accumulating organism, isresponsible for the uptake and removal ofphosphorus from the wastewater in a biologicalnutrient removal (BNR) activated sludge process.
9. A) 7.14 lbsNitrification consumes alkalinity at the rate of about7.1 to 7.2 lbs of alkalinity for each lb of ammoniaoxidized. Because this action causes the mixedliquor pH to drop, biological denitrification isdesirable, which replenishes the alkalinity at a rate ofabout 3.6 lbs of alkalinity for each lb of nitrate thatis consumed as a source of oxygen. The action ofdenitrification helps to stabilize the MLSS pH in arange acceptable to the nitrifying bacteria.
10. A) It will burn.Organic material, and other volatile matter, willtypically burn in a muffle furnace attemperatures of about 550ºC. However, justbecause something burns in a muffle furnace doesnot necessarily mean that it is biological innature. For example, a polyvinyl chloride (PVC)pipe shaved into a sample will burn in a mufflefurnace; the PVC, however, is neither biology, norfood for the biology.
Certification Boulevard Answer Key
62 October 2013 • Florida Water Resources Journal
Display Advertiser Index
Aqua Aerobics ............................19Auto-Meg....................................41CEU Challange ............................23Crane Pumps ..............................54CROM ........................................21Data Flow ..................................33FSAWWA Conference ............24-26FSAWWA Sections ......................53FWPCOA Training ........................55FWRC Call for Papers ..................47Hudson Pump ............................35
Gerber ........................................10Integrity Systems ........................15Pat’s Pump..................................31Rangeline....................................63Regional Engineerinig..................43Reiss ............................................5Schlumberger ............................27Stacon ..........................................2Treeo ..........................................38US Water ....................................37Xylem ........................................64
Looking For a Job? The FWPCOA Job Placement Committee Can Help!
Contact Joan E. Stokes at 407-293-9465 or fax 407-293-9943 for more information.