Embed Size (px)
Citation preview
Report on Review of the 2010 Sinkhole Data Call
November 8, 2010
Florida Office of Insurance Regulation
Table of Contents
I. Introduction and Scope………………………….…………...........................……..…..……..………….1 II. Data and Findings………………………………….………………..……………..……...……….……..2
1. Statewide Results……………………….………………………………….………....………..…….5 2. Types of Claims……………………………………………………………………………………...7 3. Resolution of Closed Claims………………………………………………………………………...9 4. Testing Procedures………………………………………………………….…..….………..………10 5. Region Level Analysis…………..………………………………...………..……….…………..…..11 6. Fraud Reporting……………………………………………………………………………………..14 7. Additional Data……………………………………………………………………………………...15
III. Supplements……….………………………………………………………………….....…….………...16
Appendix A – Sinkhole Data Call Template and Affidavit.……….……………………..…………17 Appendix B – Types/Dispositions of Claims…………………………………………..…….……..22 Appendix C – Payment of Closed Claims……………………………………………………..……23 Appendix D – Testing Procedures Employed………………………..…………….………….……24 Appendix E – Testing Procedures Employed -Regionally………………………….………………25 Appendix F – Significant Florida Residential Property Writers Report as of June 30, 2010.…...…26
1
I. Introduction and Scope
Pursuant to Section 624.316 Florida Statutes, the Florida Office of Insurance Regulation (Office) gathered data from insurers writing property lines of business in Florida. The requested data focused on the sinkhole claims of the insurers reporting active residential property policies to the Office.
According to the Florida Department of Environmental Protection, “Sinkholes are a common feature of Florida's landscape. They are only one of many kinds of karst landforms, which include caves, disappearing streams, springs, and underground drainage systems, all of which occur in Florida. Karst is a generic term which refers to the characteristic terrain produced by erosional processes associated with the chemical weathering and dissolution of limestone or dolomite, the two most common carbonate rocks in Florida. Dissolution of carbonate rocks begins when they are exposed to acidic water”.1
Section 627.706 F.S. is the controlling legislation for sinkhole coverage in our state.
627.706 Sinkhole insurance; catastrophic ground cover collapse; definitions.
(1) Every insurer authorized to transact property insurance in this state shall provide coverage for a catastrophic ground cover collapse and shall make available, for an appropriate additional premium, coverage for sinkhole losses on any structure, including contents of personal property contained therein, to the extent provided in the form to which the coverage attaches. A policy for residential property insurance may include a deductible amount applicable to sinkhole losses equal to 1 percent, 2 percent, 5 percent, or 10 percent of the policy dwelling limits, with appropriate premium discounts offered with each deductible amount.
(2) As used in ss. 627.706-627.7074, and as used in connection with any policy providing coverage for a catastrophic ground cover collapse or for sinkhole losses:
(a) “Catastrophic ground cover collapse” means geological activity that results in all the following:
1. The abrupt collapse of the ground cover; 2. A depression in the ground cover clearly visible to the naked eye; 3. Structural damage to the building, including the foundation; and 4. The insured structure being condemned and ordered to be vacated by the governmental agency authorized by law to issue such an order for that structure. Contents coverage applies if there is a loss resulting from a catastrophic ground cover collapse. Structural damage consisting merely of the settling or cracking of a foundation, structure, or building does not constitute a loss resulting from a catastrophic ground cover collapse.
(b) “Sinkhole” means a landform created by subsidence of soil, sediment, or rock as underlying strata are dissolved by groundwater. A sinkhole may form by collapse into subterranean voids created by dissolution of limestone or dolostone or by subsidence as these strata are dissolved.
(c) “Sinkhole loss” means structural damage to the building, including the foundation, caused by sinkhole activity. Contents coverage shall apply only if there is structural damage to the building caused by sinkhole activity.
(d) “Sinkhole activity” means settlement or systematic weakening of the earth supporting such property only when such settlement or systematic weakening results from movement or raveling of soils, sediments, or rock materials into subterranean voids created by the effect of water on a limestone or similar rock formation.
1 FGS, Sinkholes in Florida, Florida Department of Environmental Protection http://www.dep.state.fl.us/geology/geologictopics/sinkhole.htm
2
(e) “Professional engineer” means a person, as defined in s. 471.005, who has a bachelor’s degree or higher in engineering with a specialty in the geotechnical engineering field. A professional engineer must have geotechnical experience and expertise in the identification of sinkhole activity as well as other potential causes of damage to the structure.
(f) “Professional geologist” means a person, as defined by s. 492.102, who has a bachelor’s degree or higher in geology or related earth science with expertise in the geology of Florida. A professional geologist must have geological experience and expertise in the identification of sinkhole activity as well as other potential geologic causes of damage to the structure.
(3) On or before June 1, 2007, every insurer authorized to transact property insurance in this state shall make a proper filing with the office for the purpose of extending the appropriate forms of property insurance to include coverage for catastrophic ground cover collapse or for sinkhole losses. Coverage for catastrophic ground cover collapse may not go into effect until the effective date provided for in the filing approved by the office.
(4) Insurers offering policies that exclude coverage for sinkhole losses shall inform policyholders in bold type of not less than 14 points as follows: “YOUR POLICY PROVIDES COVERAGE FOR A CATASTROPHIC GROUND COVER COLLAPSE THAT RESULTS IN THE PROPERTY BEING CONDEMNED AND UNINHABITABLE. OTHERWISE, YOUR POLICY DOES NOT PROVIDE COVERAGE FOR SINKHOLE LOSSES. YOU MAY PURCHASE ADDITIONAL COVERAGE FOR SINKHOLE LOSSES FOR AN ADDITIONAL PREMIUM.”
(5) An insurer offering sinkhole coverage to policyholders before or after the adoption of s. 30, chapter 2007-1, Laws of Florida, may nonrenew the policies of policyholders maintaining sinkhole coverage in Pasco County or Hernando County, at the option of the insurer, and provide an offer of coverage to such policyholders which includes catastrophic ground cover collapse and excludes sinkhole coverage. Insurers acting in accordance with this subsection are subject to the following requirements:
(a) Policyholders must be notified that a nonrenewal is for purposes of removing sinkhole coverage, and that the policyholder is still being offered a policy that provides coverage for catastrophic ground cover collapse.
(b) Policyholders must be provided an actuarially reasonable premium credit or discount for the removal of sinkhole coverage and provision of only catastrophic ground cover collapse.
(c) Subject to the provisions of this subsection and the insurer’s approved underwriting or insurability guidelines, the insurer shall provide each policyholder with the opportunity to purchase an endorsement to his or her policy providing sinkhole coverage and may require an inspection of the property before issuance of a sinkhole coverage endorsement.
(d) Section 624.4305 does not apply to nonrenewal notices issued pursuant to this subsection.
The principal objective of the Office Sinkhole Data Call was to collect specific information about sinkhole claims on a claim by claim basis in order to analyze claim payment trends and related data. The Office sent the data call to insurers reporting residential policies in force. Two-hundred and eleven insurers responded to the data call and submitted data including those reporting no sinkhole claims.
Insurers were asked to provide information on the location of the claim by county, the date the loss was reported, and if the claim was open or closed. In addition, specific questions were asked regarding the type of sinkhole, the testing procedures employed, and if the repair option was initiated or not. For claims that were paid, the amount paid was requested for the structure, land, other damage, and allocated loss adjustment expense (A copy of the data call questionnaire can be found in Appendix A). Participating companies were not asked for policy count or premiums for policies that cover sinkhole
3
claims. In addition, the analyses in this report have excluded all claims where no claims data was reported. The data submitted was checked for data integrity, however, the information in this report is based upon the information as received and no audit of the data has been performed. Companies submitted an affidavit to the Office along with the Data Call attesting the accuracy of the information submitted (A copy of the affidavit can be found in Appendix A).
4
II. Data and Findings
An electronic data call was prepared in 2010 to examine closed sinkhole claims in Florida. The results of the 2010 data call indicated that the problem of sinkholes in Florida had increased in both frequency and total cost during the period examined (2006-2010). Specifically, the results showed: (1) an increase in the occurrence and costs of sinkhole claims; and (2) that there is an increase in reported sinkholes in the parts of South Florida where sinkholes traditionally have not been an issue.
SUMMARY OF 2010 DATA AND FINDINGS The electronic data call requested information on all sinkhole claims occurring in Florida between 2006 and 2010. The Office received data on 8,959 open claims and 15,712 closed claims, totaling 24,671. Insurers were asked to provide general information on the location of the claim by county, the date the loss was reported, and if the claim was open or closed. The data were first examined and compared across years. Then, regional and county level analyses were conducted. The purpose of these analyses was to determine if the number of claims, the claims expenses, and testing procedures for sinkholes varied by year or region. A summary of the major findings of the data call follows.
5
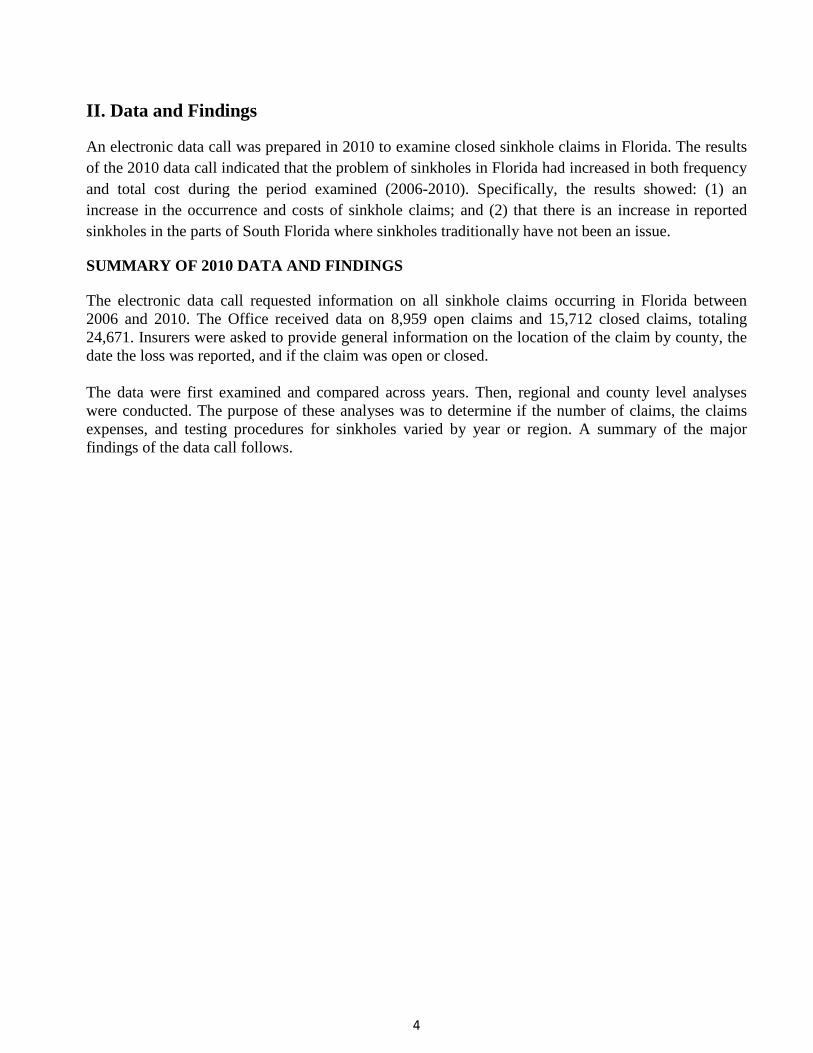
1. Statewide Results Total sinkhole costs over the sample period amounted to approximately $1.4 billion and increased from $209 million in 2006 to $406 million in 2009. The largest share of the total expense over the sample period was for the Structure Loss (54%). It was followed by Land Loss (27%) and Engineering Expense (12%).
In 2006, the total of expenses paid for closed sinkhole claims amounted to $28,347,486 and the total indemnity paid in 2006 was $163,876,153. In contrast, for the year 2009, the total of expenses paid on closed claims spiked to $41,870,403 while the total indemnity paid had increased to $220,270,928. The aggregate total of expenses during the period 2006-2010 is $161,972,893, while the aggregate of total indemnity paid is $907,147,000 during the same period.
Closed Claims Total Expense Expense Per Claim Total Indemnity Indemnity Per Claim 2006 2,254 $ 28,347,486 $ 12,577 $ 163,876,153 $ 72,705 2007 3,334 $ 42,190,576 $ 12,655 $ 263,003,683 $ 78,885 2008 3,577 $ 37,784,992 $ 10,563 $ 225,229,165 $ 62,966 2009 4,671 $ 41,870,403 $ 8,964 $ 220,270,928 $ 47,157 2010 1,876 $ 11,779,436 $ 6,279 $ 34,767,071 $ 18,533 Total 15,712 $ 161,972,893 $ 907,147,000
Open Claims Total Expense Expense Per Claim Total Indemnity Indemnity Per Claim 2006 106 $ 3,312,887 $ 31,254 $ 13,650,675 $ 128,780 2007 508 $ 11,372,170 $ 22,386 $ 52,279,347 $ 102,912 2008 954 $ 17,862,248 $ 18,724 $ 72,474,973 $ 75,970 2009 2,574 $ 29,525,972 $ 11,471 $ 114,626,167 $ 44,532 2010 4,817 $ 21,093,635 $ 4,379 $ 49,386,061 $ 10,252 Total 8,959 $ 83,166,912 $ 302,417,223
Grand Total 24,671 $ 245,139,805 $ 1,209,564,223
$-
$50
$100
$150
$200
$250
$300
$350
$400
$450
2006 2007 2008 2009
Mill
ions
Total Sinkhole Loss
6
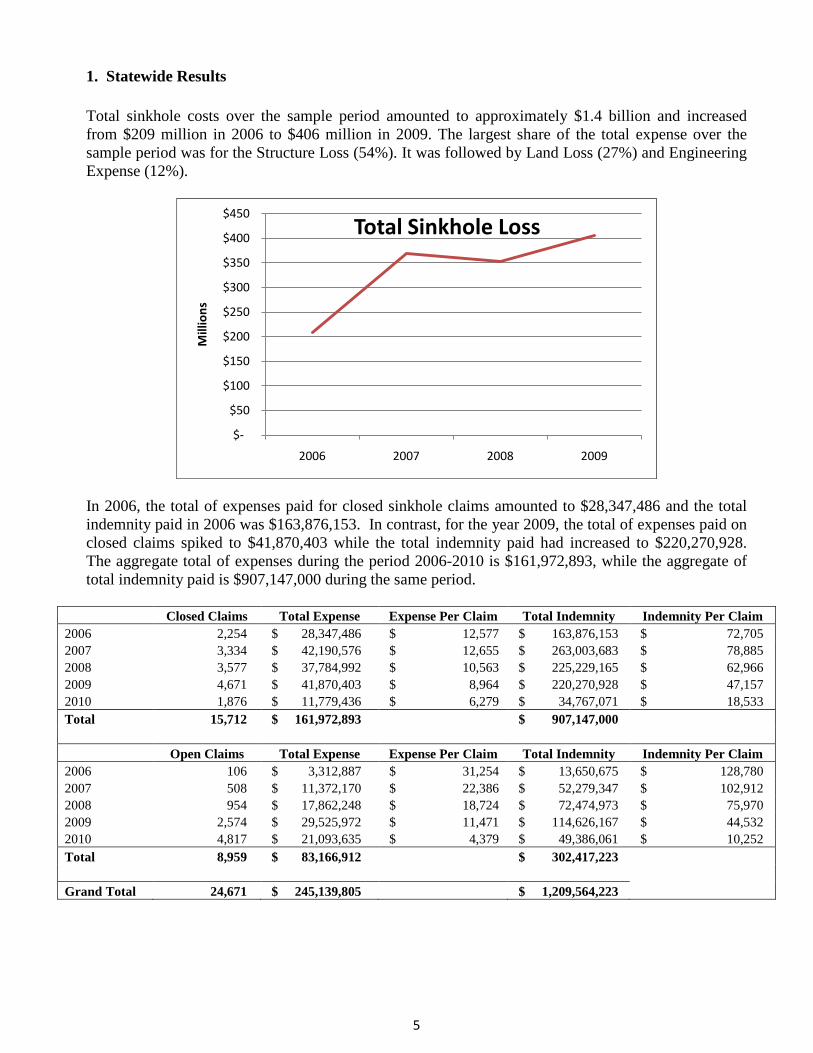
Open claims in 2006 totaled $3,312,887 for expenses paid and $13,650,675 for indemnity. By 2009, these numbers jumped to $29,525,972 and $114,626,167, respectively. The aggregate for total expenses paid during the period is $245,139,805 and the aggregate for indemnity is $1,209,564,223. The change is partially attributable to the decrease in per claim Inspection Fees, Other Damage Loss, Other Loss Adjustment Expense, and Inspection Costs. Attorney and mediation fees showed a decrease per claim, however many of the insurers did not report the full amount of attorney and mediation fees, as they were included and paid as part of the indemnity payment of disputed claims. Total reported claims increased over the sample period and rose from 2,360 in 2006 to 6,694 in 2010—totaling 24,671. Of that total, 15,712 (64%) were reported as closed, while 8,959 (36%) remain open. Using the trend in the claim counts judgmentally adjusted to anticipate lower claim counts with a 20% severity trend applied to the 2009 claims, the result would be a projected paid loss and expense of $396,000,000 for 2010 claims and $468,600,000 for 2011 claims. It should be noted that for Citizen Property Insurance Corporation and at least one other large insurer, at the policyholder’s option, fewer policies will include sinkhole coverage going forward.
*2010 claims are limited to the date data was submitted and therefore only represent approximately three quarters of the claims that will be pending by year end 2010.
-
2,000
4,000
6,000
8,000
2006 Count
2007 Count
2008 Count
2009 Count
2010 Count
2,360 3,842
4,531
7,244 6,694
Annual Sink Hole Claims*
TotalOpenClosed
7
2. Types of Claims
Collapse Sinkholes
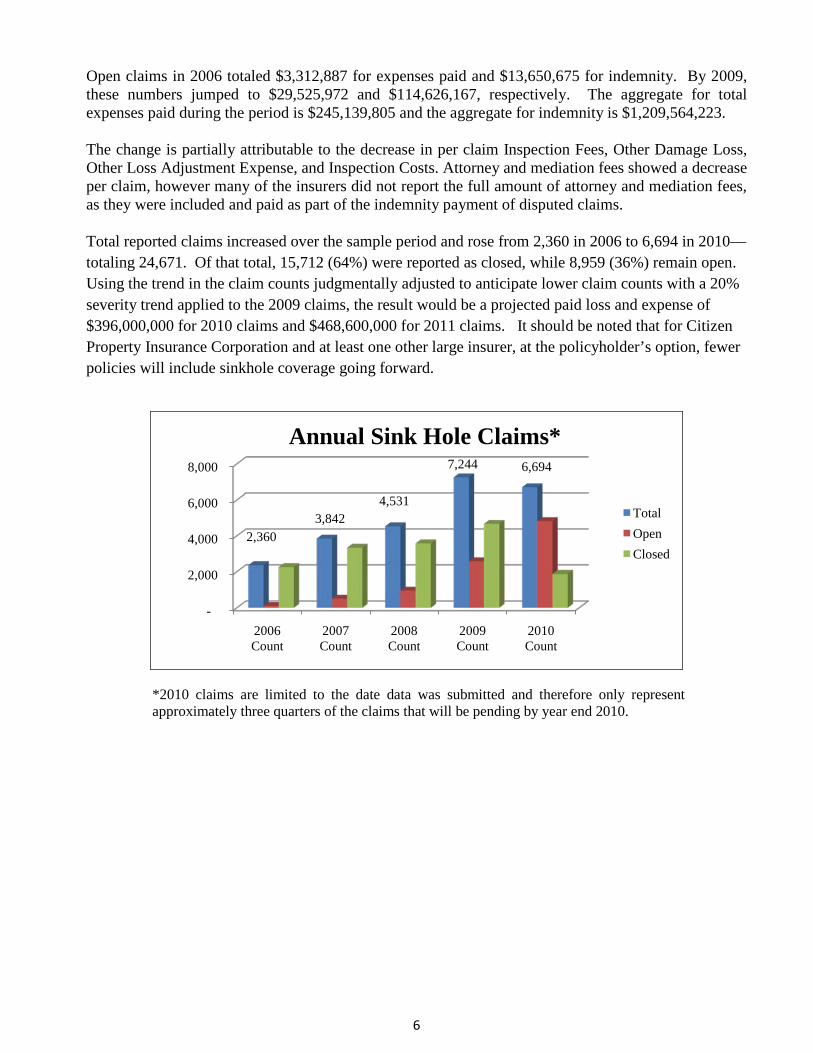
Collapse sinkholes form in areas where the overlying top layer of soil is quite thick. While it may appear sturdy, the reality is that below, there is not much stability; the underlying limestone has been carved hollow by water. They are frequently triggered by fluctuations in underground water. As water levels fluctuate, the roof of the cavity is weakened. When the water level drops too far, the cavity walls are unsupported and the roof of the empty spaces becomes too weak to support the weight on top. Eventually, the ceiling collapses and a sinkhole is formed.
If the underground water level rises, the collapse sinkhole can fill with water, and overflow like a spring. If the water-table drops below the sinkhole, it will remain dry and accumulate sediments and vegetation.
Subsidence Sinkholes
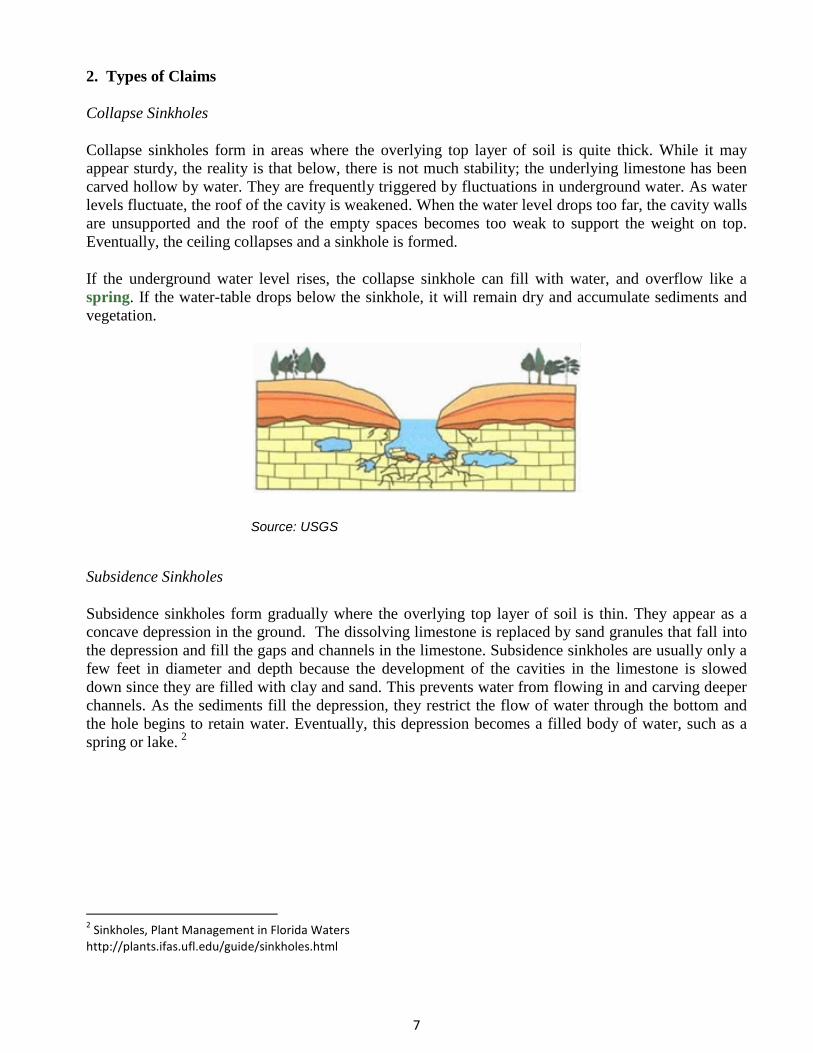
Subsidence sinkholes form gradually where the overlying top layer of soil is thin. They appear as a concave depression in the ground. The dissolving limestone is replaced by sand granules that fall into the depression and fill the gaps and channels in the limestone. Subsidence sinkholes are usually only a few feet in diameter and depth because the development of the cavities in the limestone is slowed down since they are filled with clay and sand. This prevents water from flowing in and carving deeper channels. As the sediments fill the depression, they restrict the flow of water through the bottom and the hole begins to retain water. Eventually, this depression becomes a filled body of water, such as a spring or lake. 2
2 Sinkholes, Plant Management in Florida Waters http://plants.ifas.ufl.edu/guide/sinkholes.html
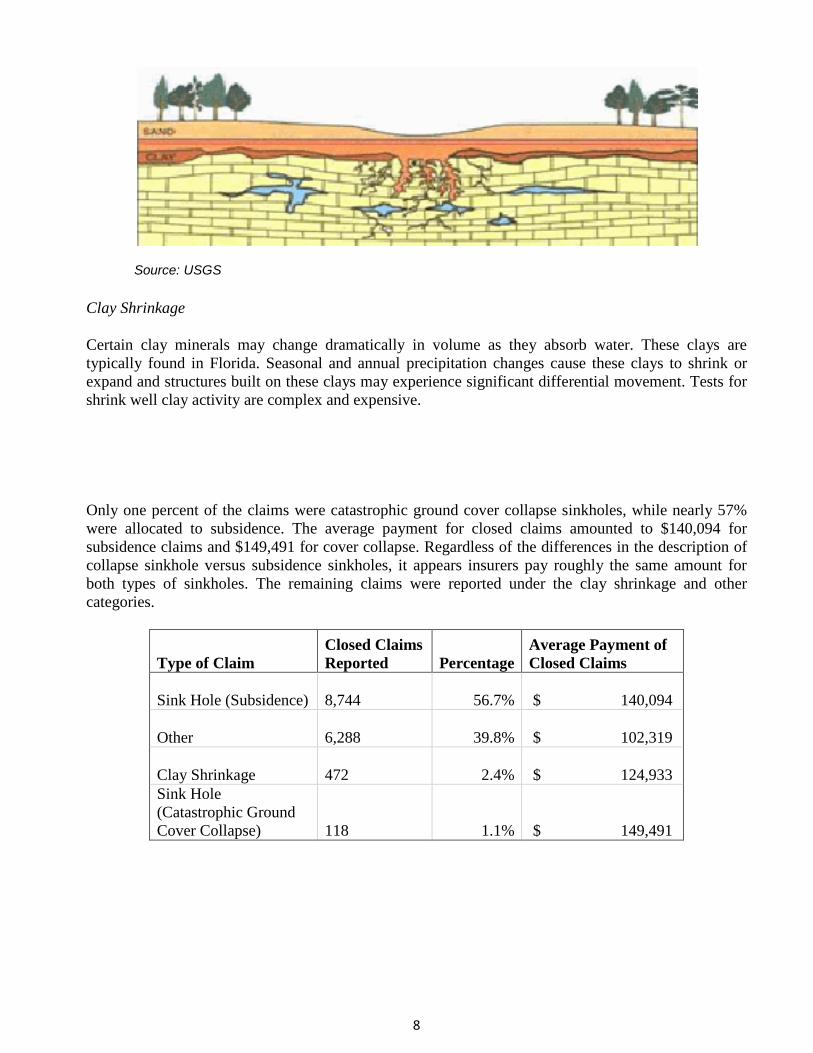
Source: USGS
8
Source: USGS
Clay Shrinkage
Certain clay minerals may change dramatically in volume as they absorb water. These clays are typically found in Florida. Seasonal and annual precipitation changes cause these clays to shrink or expand and structures built on these clays may experience significant differential movement. Tests for shrink well clay activity are complex and expensive.
Only one percent of the claims were catastrophic ground cover collapse sinkholes, while nearly 57% were allocated to subsidence. The average payment for closed claims amounted to $140,094 for subsidence claims and $149,491 for cover collapse. Regardless of the differences in the description of collapse sinkhole versus subsidence sinkholes, it appears insurers pay roughly the same amount for both types of sinkholes. The remaining claims were reported under the clay shrinkage and other categories.
Type of Claim Closed Claims Reported Percentage
Average Payment of Closed Claims
Sink Hole (Subsidence) 8,744 56.7% $ 140,094
Other 6,288 39.8% $ 102,319
Clay Shrinkage 472 2.4% $ 124,933
Sink Hole (Catastrophic Ground Cover Collapse)
118 1.1% $ 149,491
9
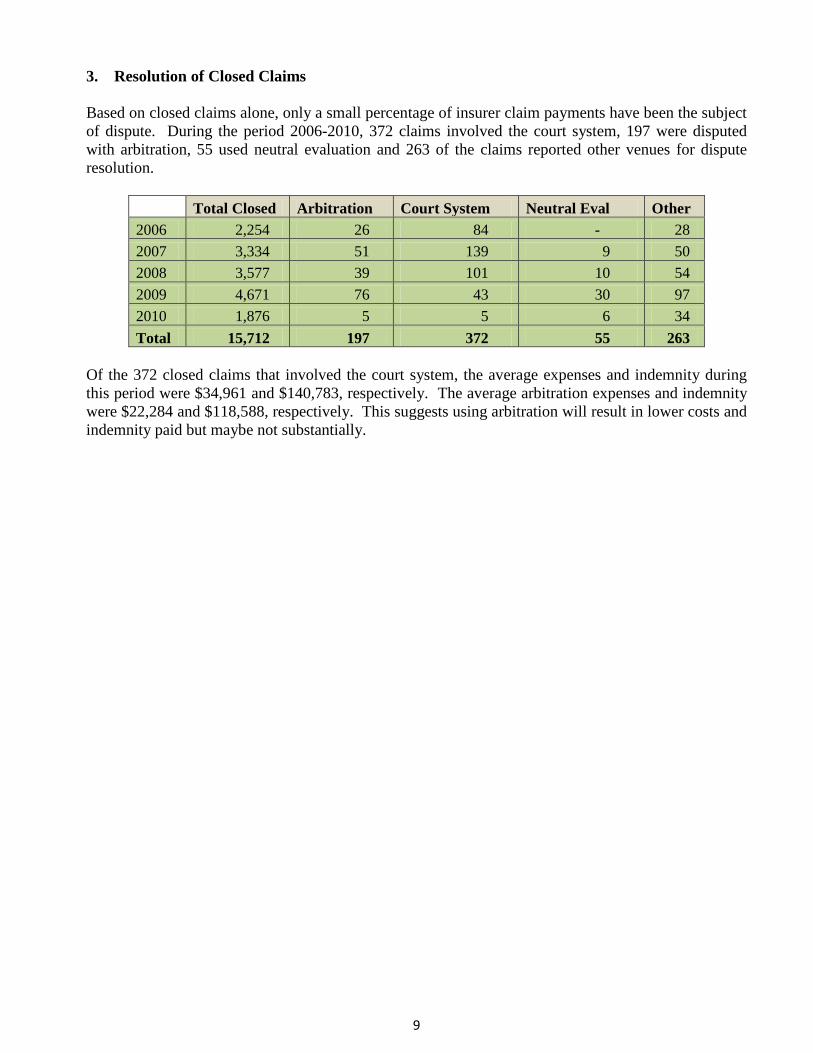
3. Resolution of Closed Claims Based on closed claims alone, only a small percentage of insurer claim payments have been the subject of dispute. During the period 2006-2010, 372 claims involved the court system, 197 were disputed with arbitration, 55 used neutral evaluation and 263 of the claims reported other venues for dispute resolution.
Total Closed Arbitration Court System Neutral Eval Other 2006 2,254 26 84 - 28 2007 3,334 51 139 9 50 2008 3,577 39 101 10 54 2009 4,671 76 43 30 97 2010 1,876 5 5 6 34 Total 15,712 197 372 55 263
Of the 372 closed claims that involved the court system, the average expenses and indemnity during this period were $34,961 and $140,783, respectively. The average arbitration expenses and indemnity were $22,284 and $118,588, respectively. This suggests using arbitration will result in lower costs and indemnity paid but maybe not substantially.
10
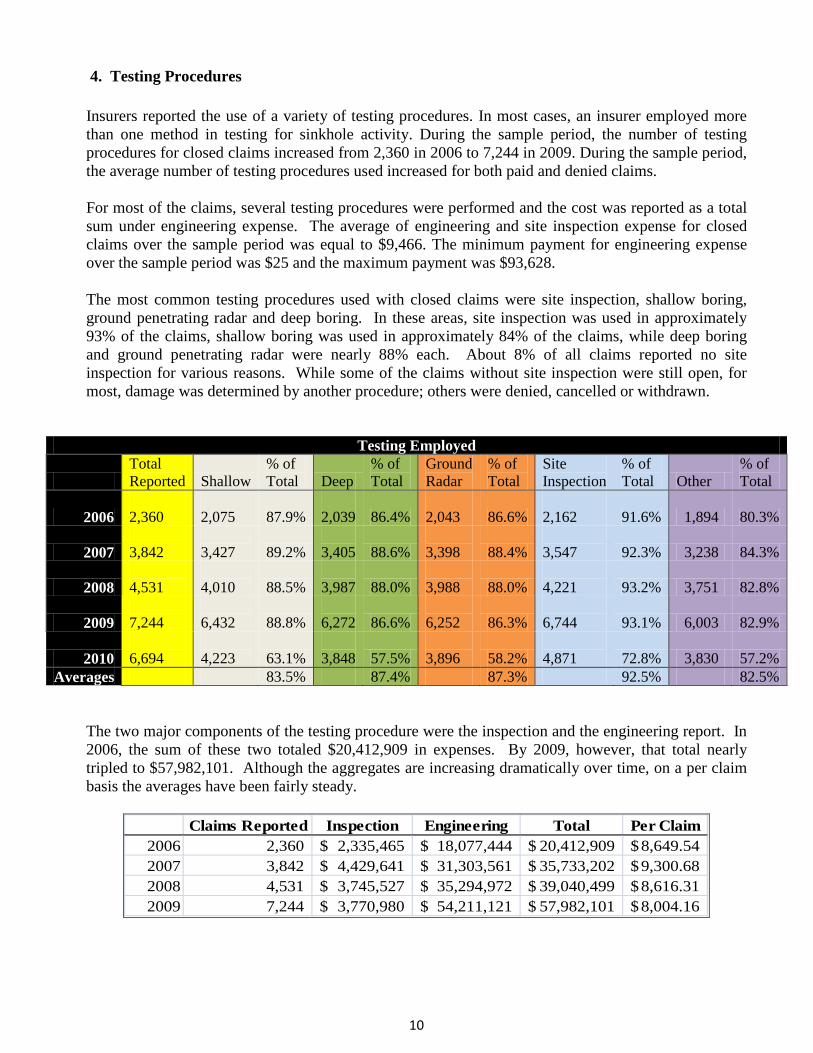
4. Testing Procedures Insurers reported the use of a variety of testing procedures. In most cases, an insurer employed more than one method in testing for sinkhole activity. During the sample period, the number of testing procedures for closed claims increased from 2,360 in 2006 to 7,244 in 2009. During the sample period, the average number of testing procedures used increased for both paid and denied claims. For most of the claims, several testing procedures were performed and the cost was reported as a total sum under engineering expense. The average of engineering and site inspection expense for closed claims over the sample period was equal to $9,466. The minimum payment for engineering expense over the sample period was $25 and the maximum payment was $93,628. The most common testing procedures used with closed claims were site inspection, shallow boring, ground penetrating radar and deep boring. In these areas, site inspection was used in approximately 93% of the claims, shallow boring was used in approximately 84% of the claims, while deep boring and ground penetrating radar were nearly 88% each. About 8% of all claims reported no site inspection for various reasons. While some of the claims without site inspection were still open, for most, damage was determined by another procedure; others were denied, cancelled or withdrawn.
Testing Employed
Total Reported Shallow
% of Total Deep
% of Total
Ground Radar
% of Total
Site Inspection
% of Total Other
% of Total
2006 2,360
2,075 87.9%
2,039 86.4%
2,043 86.6%
2,162 91.6% 1,894 80.3%
2007 3,842
3,427 89.2%
3,405 88.6%
3,398 88.4%
3,547 92.3% 3,238 84.3%
2008 4,531
4,010 88.5%
3,987 88.0%
3,988 88.0%
4,221 93.2% 3,751 82.8%
2009 7,244
6,432 88.8%
6,272 86.6%
6,252 86.3%
6,744 93.1% 6,003 82.9%
2010 6,694
4,223 63.1%
3,848 57.5%
3,896 58.2%
4,871 72.8% 3,830 57.2%
Averages 83.5% 87.4% 87.3% 92.5% 82.5%
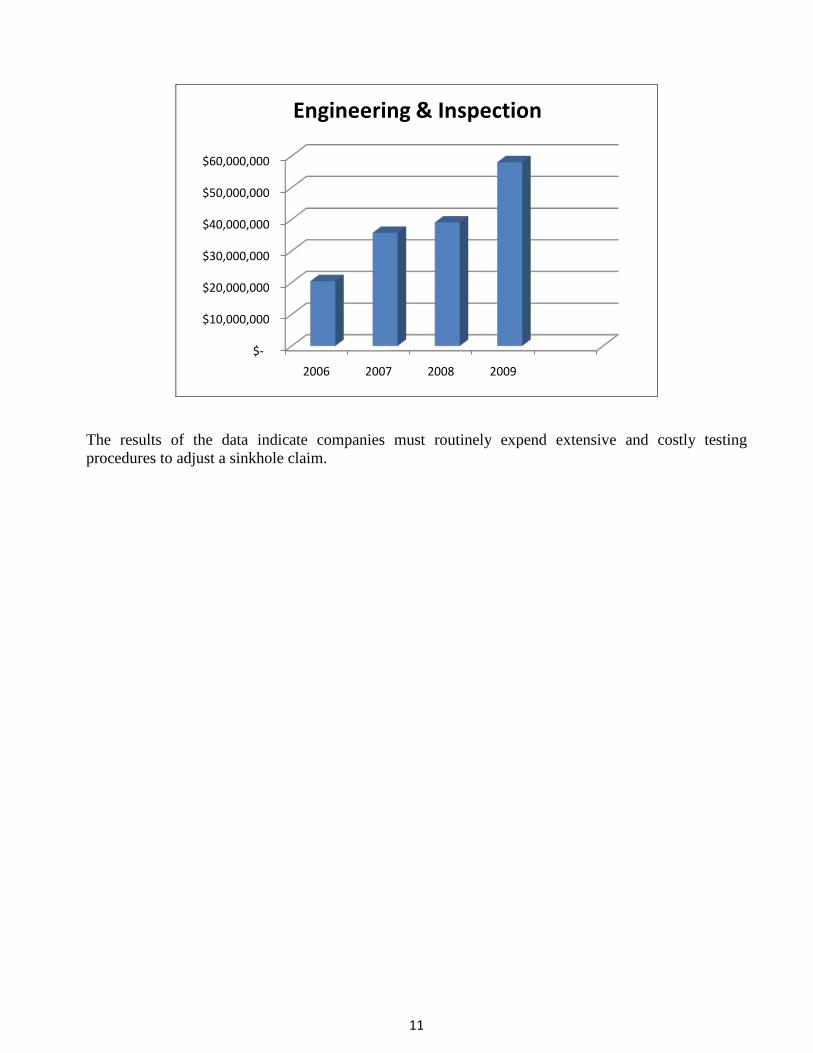
The two major components of the testing procedure were the inspection and the engineering report. In 2006, the sum of these two totaled $20,412,909 in expenses. By 2009, however, that total nearly tripled to $57,982,101. Although the aggregates are increasing dramatically over time, on a per claim basis the averages have been fairly steady.
Claims Reported Inspection Engineering Total Per Claim2006 2,360 2,335,465$ 18,077,444$ 20,412,909$ 8,649.54$ 2007 3,842 4,429,641$ 31,303,561$ 35,733,202$ 9,300.68$ 2008 4,531 3,745,527$ 35,294,972$ 39,040,499$ 8,616.31$ 2009 7,244 3,770,980$ 54,211,121$ 57,982,101$ 8,004.16$
11
The results of the data indicate companies must routinely expend extensive and costly testing procedures to adjust a sinkhole claim.
$-
$10,000,000
$20,000,000
$30,000,000
$40,000,000
$50,000,000
$60,000,000
2006 2007 2008 2009
Engineering & Inspection
12
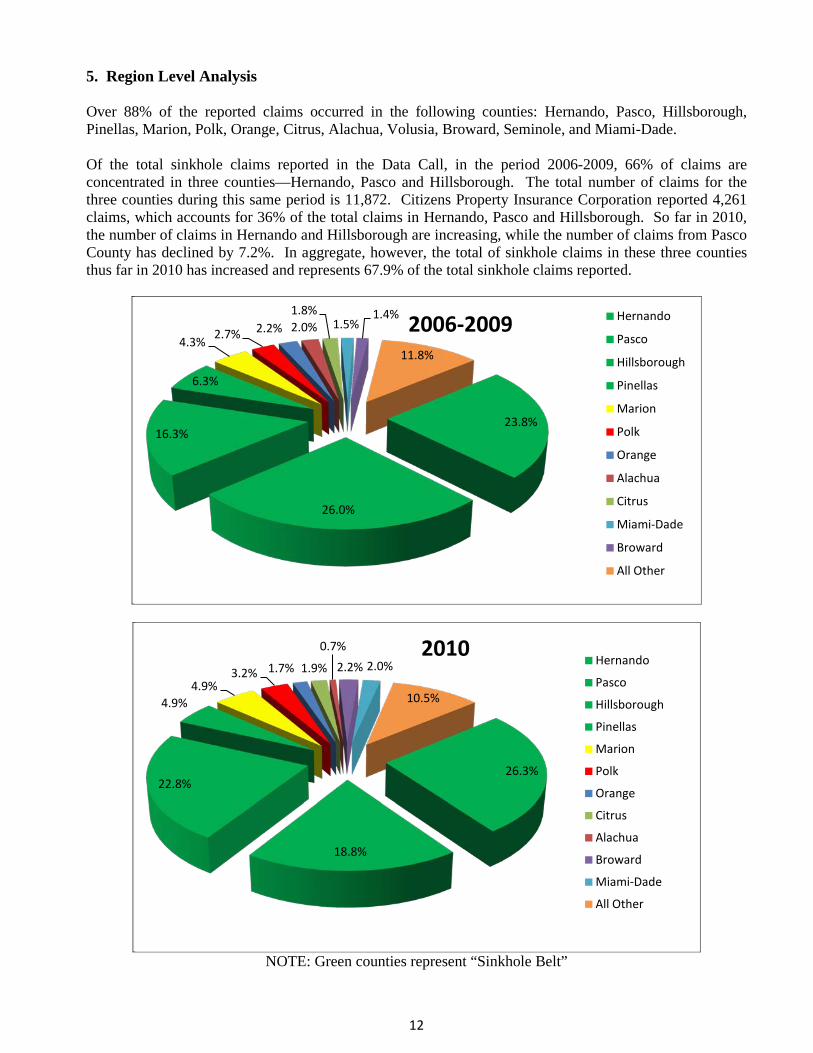
5. Region Level Analysis Over 88% of the reported claims occurred in the following counties: Hernando, Pasco, Hillsborough, Pinellas, Marion, Polk, Orange, Citrus, Alachua, Volusia, Broward, Seminole, and Miami-Dade. Of the total sinkhole claims reported in the Data Call, in the period 2006-2009, 66% of claims are concentrated in three counties—Hernando, Pasco and Hillsborough. The total number of claims for the three counties during this same period is 11,872. Citizens Property Insurance Corporation reported 4,261 claims, which accounts for 36% of the total claims in Hernando, Pasco and Hillsborough. So far in 2010, the number of claims in Hernando and Hillsborough are increasing, while the number of claims from Pasco County has declined by 7.2%. In aggregate, however, the total of sinkhole claims in these three counties thus far in 2010 has increased and represents 67.9% of the total sinkhole claims reported.
NOTE: Green counties represent “Sinkhole Belt”
23.8%
26.0%
16.3%
6.3%
4.3%2.7% 2.2% 2.0%
1.8%1.5%
1.4%
11.8%
2006-2009 Hernando
Pasco
Hillsborough
Pinellas
Marion
Polk
Orange
Alachua
Citrus
Miami-Dade
Broward
All Other
26.3%
18.8%
22.8%
4.9%4.9%
3.2% 1.7% 1.9%
0.7%
2.2% 2.0%
10.5%
2010Hernando
Pasco
Hillsborough
Pinellas
Marion
Polk
Orange
Citrus
Alachua
Broward
Miami-Dade
All Other
13
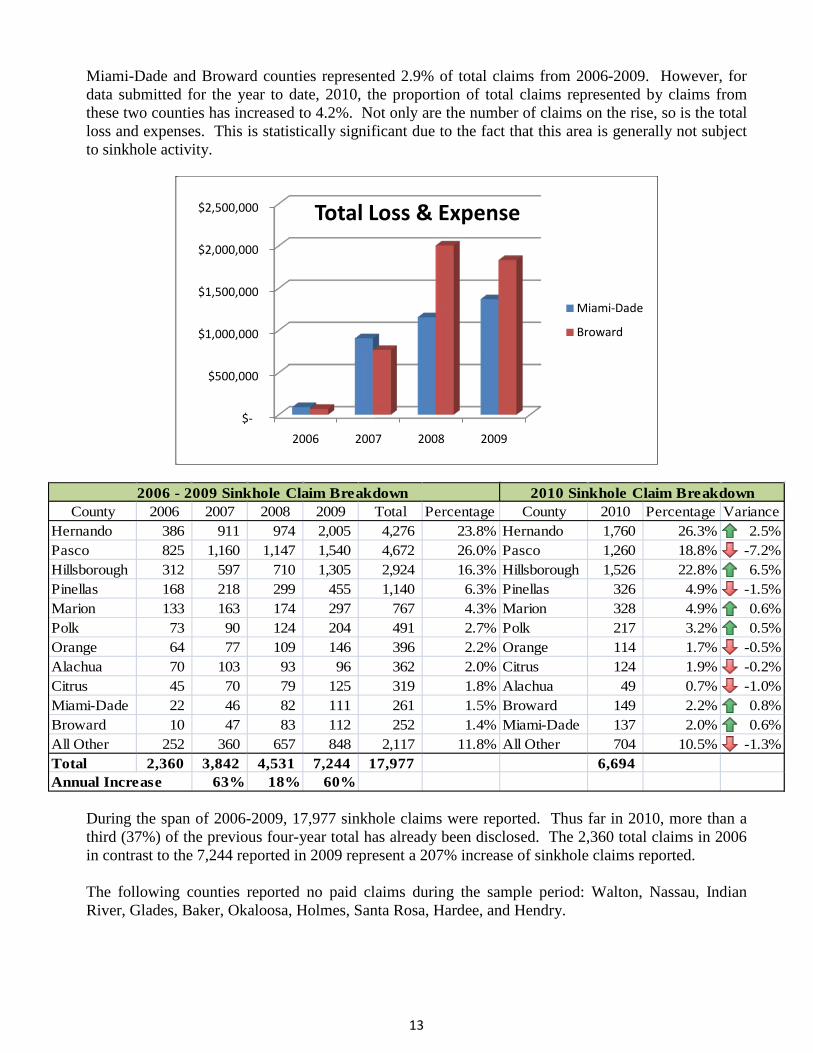
Miami-Dade and Broward counties represented 2.9% of total claims from 2006-2009. However, for data submitted for the year to date, 2010, the proportion of total claims represented by claims from these two counties has increased to 4.2%. Not only are the number of claims on the rise, so is the total loss and expenses. This is statistically significant due to the fact that this area is generally not subject to sinkhole activity.
During the span of 2006-2009, 17,977 sinkhole claims were reported. Thus far in 2010, more than a third (37%) of the previous four-year total has already been disclosed. The 2,360 total claims in 2006 in contrast to the 7,244 reported in 2009 represent a 207% increase of sinkhole claims reported. The following counties reported no paid claims during the sample period: Walton, Nassau, Indian River, Glades, Baker, Okaloosa, Holmes, Santa Rosa, Hardee, and Hendry.
$-
$500,000
$1,000,000
$1,500,000
$2,000,000
$2,500,000
2006 2007 2008 2009
Total Loss & Expense
Miami-Dade
Broward
County 2006 2007 2008 2009 Total Percentage County 2010 Percentage VarianceHernando 386 911 974 2,005 4,276 23.8% Hernando 1,760 26.3% 2.5%Pasco 825 1,160 1,147 1,540 4,672 26.0% Pasco 1,260 18.8% -7.2%Hillsborough 312 597 710 1,305 2,924 16.3% Hillsborough 1,526 22.8% 6.5%Pinellas 168 218 299 455 1,140 6.3% Pinellas 326 4.9% -1.5%Marion 133 163 174 297 767 4.3% Marion 328 4.9% 0.6%Polk 73 90 124 204 491 2.7% Polk 217 3.2% 0.5%Orange 64 77 109 146 396 2.2% Orange 114 1.7% -0.5%Alachua 70 103 93 96 362 2.0% Citrus 124 1.9% -0.2%Citrus 45 70 79 125 319 1.8% Alachua 49 0.7% -1.0%Miami-Dade 22 46 82 111 261 1.5% Broward 149 2.2% 0.8%Broward 10 47 83 112 252 1.4% Miami-Dade 137 2.0% 0.6%All Other 252 360 657 848 2,117 11.8% All Other 704 10.5% -1.3%Total 2,360 3,842 4,531 7,244 17,977 6,694
63% 18% 60%
2006 - 2009 Sinkhole Claim Breakdown 2010 Sinkhole Claim Breakdown
Annual Increase
14
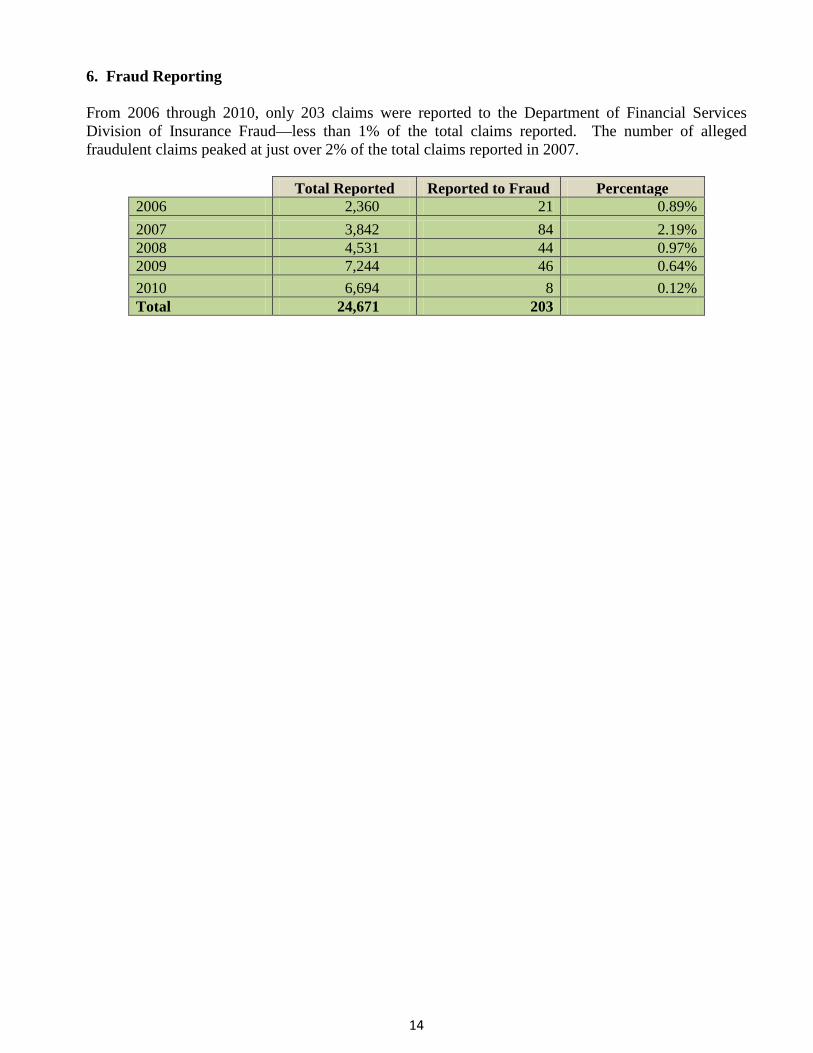
6. Fraud Reporting From 2006 through 2010, only 203 claims were reported to the Department of Financial Services Division of Insurance Fraud—less than 1% of the total claims reported. The number of alleged fraudulent claims peaked at just over 2% of the total claims reported in 2007.
Total Reported Reported to Fraud Percentage
2006 2,360 21 0.89% 2007 3,842 84 2.19% 2008 4,531 44 0.97% 2009 7,244 46 0.64% 2010 6,694 8 0.12% Total 24,671 203
15
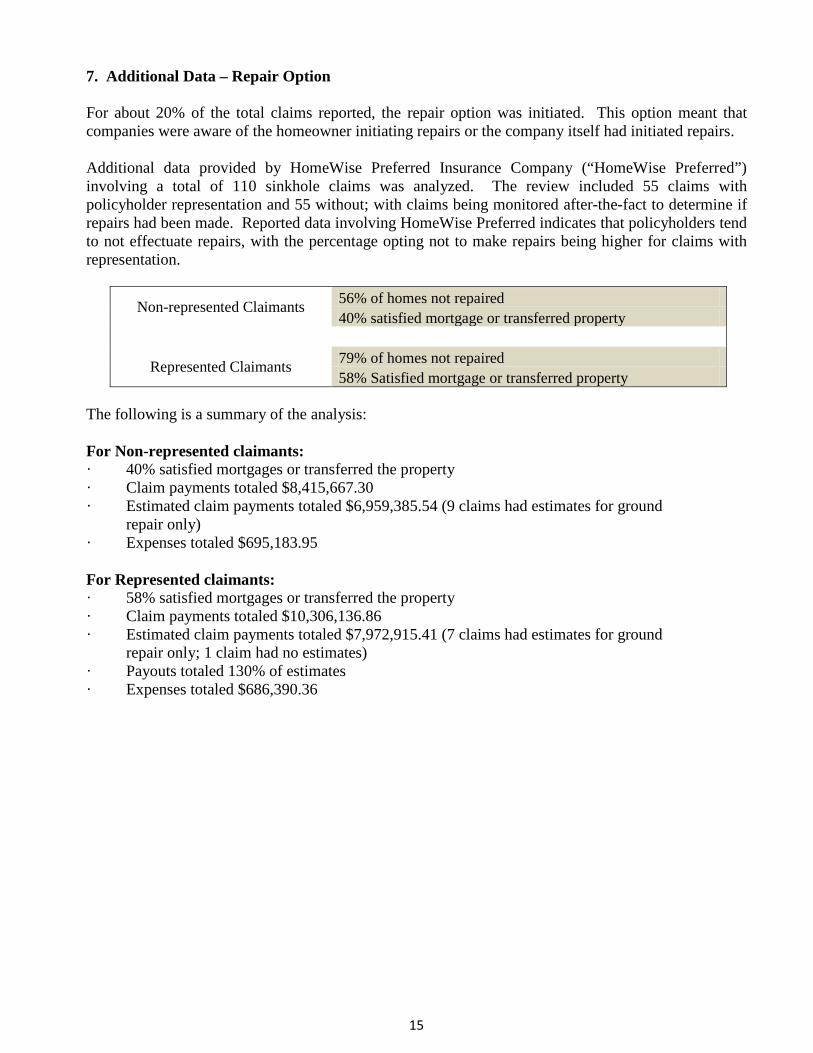
7. Additional Data – Repair Option For about 20% of the total claims reported, the repair option was initiated. This option meant that companies were aware of the homeowner initiating repairs or the company itself had initiated repairs. Additional data provided by HomeWise Preferred Insurance Company (“HomeWise Preferred”) involving a total of 110 sinkhole claims was analyzed. The review included 55 claims with policyholder representation and 55 without; with claims being monitored after-the-fact to determine if repairs had been made. Reported data involving HomeWise Preferred indicates that policyholders tend to not effectuate repairs, with the percentage opting not to make repairs being higher for claims with representation.
Non-represented Claimants 56% of homes not repaired 40% satisfied mortgage or transferred property
Represented Claimants 79% of homes not repaired
58% Satisfied mortgage or transferred property The following is a summary of the analysis: For Non-represented claimants: · 40% satisfied mortgages or transferred the property · Claim payments totaled $8,415,667.30 · Estimated claim payments totaled $6,959,385.54 (9 claims had estimates for ground repair only) · Expenses totaled $695,183.95 For Represented claimants: · 58% satisfied mortgages or transferred the property · Claim payments totaled $10,306,136.86 · Estimated claim payments totaled $7,972,915.41 (7 claims had estimates for ground repair only; 1 claim had no estimates) · Payouts totaled 130% of estimates · Expenses totaled $686,390.36
16
III. SUPPLEMENTS
Appendix A – Sinkhole Data Call Template and Affidavit Appendix B – Types/Dispositions of Claims Appendix C – Payment of Closed Claims Appendix D – Testing Procedures Employed Appendix E – Testing Procedures Employed -Regionally Appendix F – Significant Florida Residential Property Writers Report as of June 30, 2010
Appendix A: Sinkhole Data Call Template and Affidavit
VERSION 1.01
2010 Sinkhole Data Call Pursuant to Section 624.316, Florida Statutes
Scope Period: 2006 to 2010
Currently the only companies required to complete this compliance report have active policies in QUASRng.
If you need any assistance during the filing process, please contact the Office at
Due by Tuesday, September 21, 2010
17
18
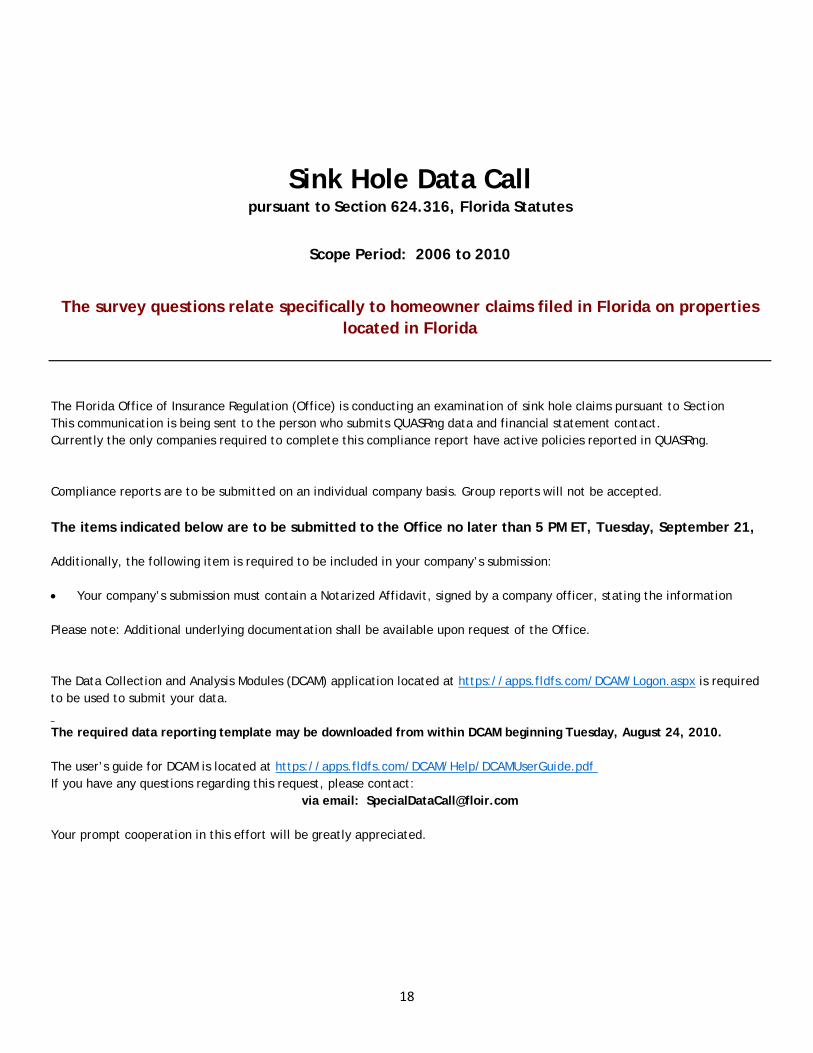
Sink Hole Data Callpursuant to Section 624.316, Florida Statutes
Scope Period: 2006 to 2010
The survey questions relate specifically to homeowner claims filed in Florida on properties located in Florida
The Florida Office of Insurance Regulation (Office) is conducting an examination of sink hole claims pursuant to Section This communication is being sent to the person who submits QUASRng data and financial statement contact. Currently the only companies required to complete this compliance report have active policies reported in QUASRng. Compliance reports are to be submitted on an individual company basis. Group reports will not be accepted.
The items indicated below are to be submitted to the Office no later than 5 PM ET, Tuesday, September 21, Additionally, the following item is required to be included in your company’s submission: • Your company’s submission must contain a Notarized Affidavit, signed by a company officer, stating the information
Please note: Additional underlying documentation shall be available upon request of the Office. The Data Collection and Analysis Modules (DCAM) application located at https://apps.fldfs.com/DCAM/Logon.aspx is required to be used to submit your data. The required data reporting template may be downloaded from within DCAM beginning Tuesday, August 24, 2010. The user’s guide for DCAM is located at https://apps.fldfs.com/DCAM/Help/DCAMUserGuide.pdf If you have any questions regarding this request, please contact:
via email: [email protected]
Your prompt cooperation in this effort will be greatly appreciated.
19
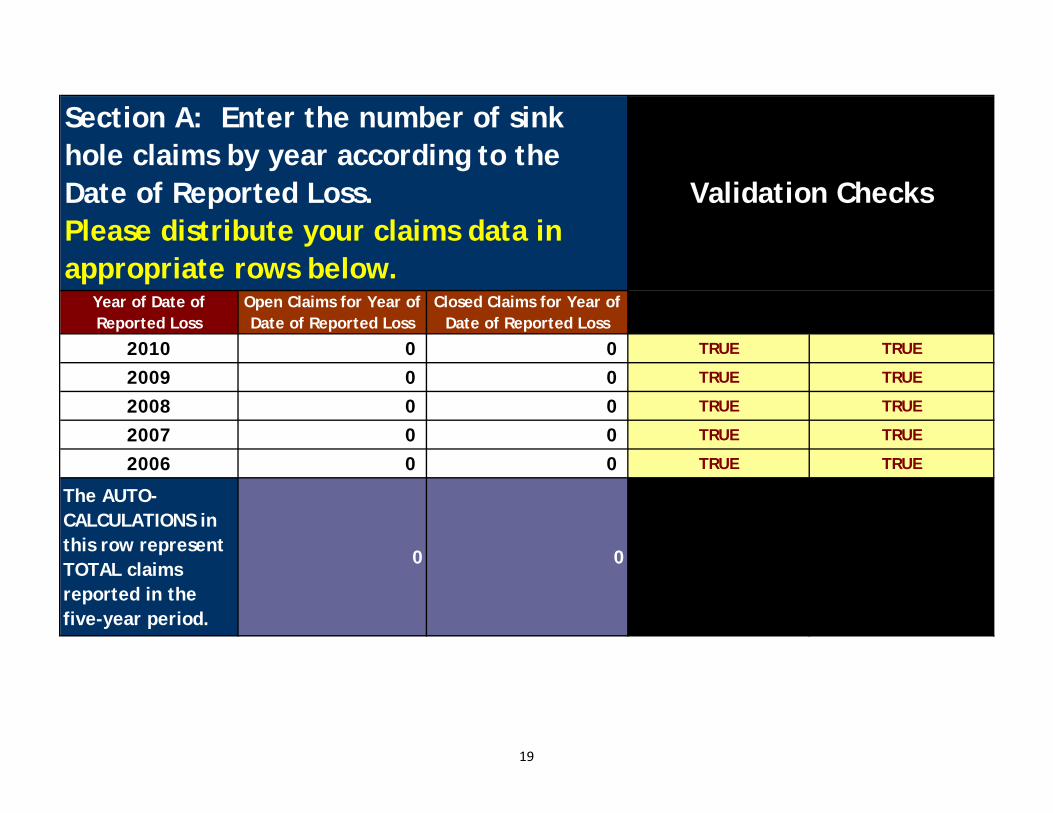
Year of Date of Reported Loss
Open Claims for Year of Date of Reported Loss
Closed Claims for Year of Date of Reported Loss
2010 0 0 TRUE TRUE
2009 0 0 TRUE TRUE
2008 0 0 TRUE TRUE
2007 0 0 TRUE TRUE
2006 0 0 TRUE TRUE
The AUTO-CALCULATIONS in this row represent TOTAL claims reported in the five-year period.
0 0
TRUE TRUE
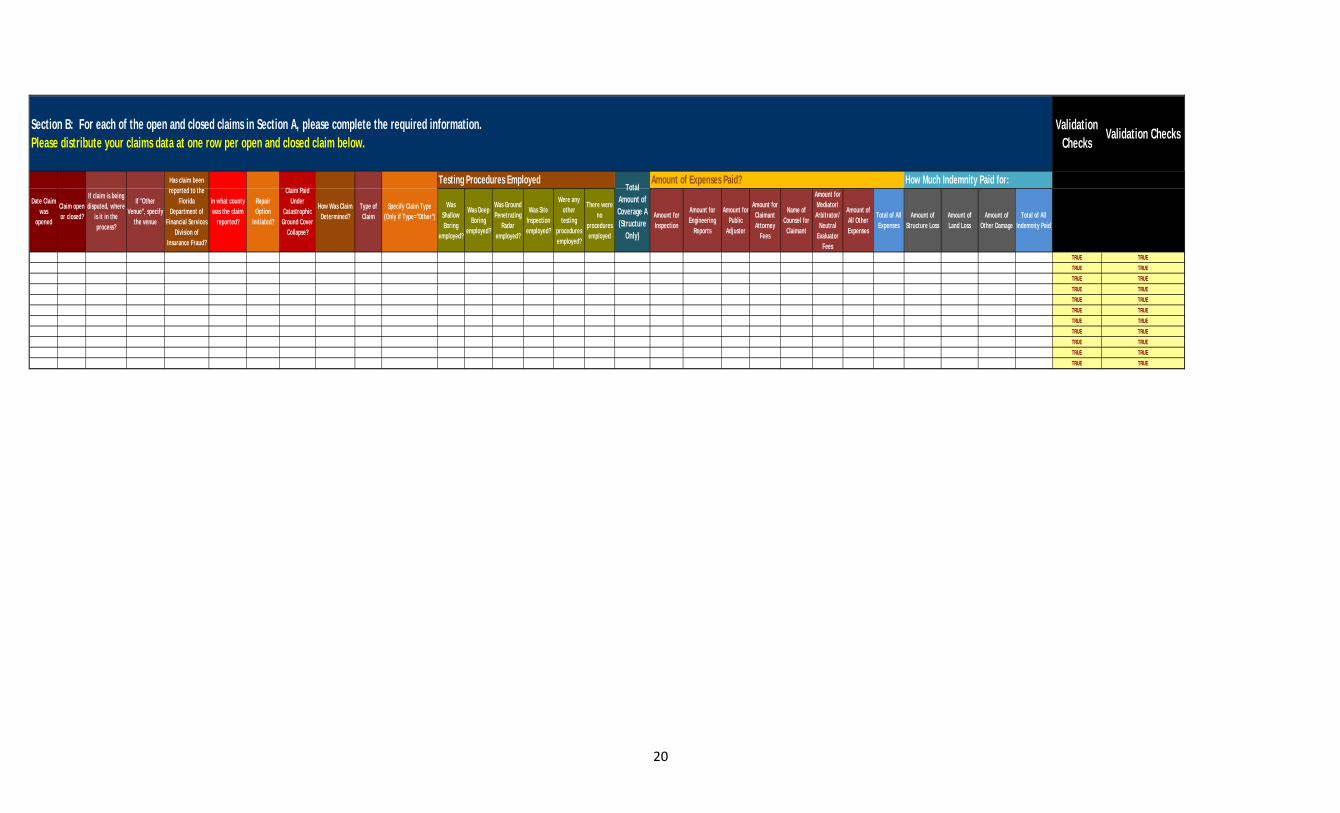
Section A: Enter the number of sink hole claims by year according to the Date of Reported Loss. Please distribute your claims data in appropriate rows below.
Validation Checks
20
Validation Checks
Validation Checks
Was Shallow Boring
employed?
Was Deep Boring
employed?
Was Ground Penetrating
Radar employed?
Was Site Inspection employed?
Were any other
testing procedures employed?
There were no
procedures employed
Amount for Inspection
Amount for Engineering
Reports
Amount for Public
Adjuster
Amount for Claimant Attorney
Fees
Name of Counsel for
Claimant
Amount for Mediator/ Arbitrator/
Neutral Evaluator
Fees
Amount of All Other Expenses
Total of All Expenses
Amount of Structure Loss
Amount of Land Loss
Amount of Other Damage
Total of All Indemnity Paid
TRUE TRUE
TRUE TRUE
TRUE TRUE
TRUE TRUE
TRUE TRUE
TRUE TRUE
TRUE TRUE
TRUE TRUE
TRUE TRUE
TRUE TRUE
TRUE TRUE
Type of Claim
Testing Procedures Employed
Section B: For each of the open and closed claims in Section A, please complete the required information. Please distribute your claims data at one row per open and closed claim below.
How Much Indemnity Paid for:Amount of Expenses Paid?Total
Amount of Coverage A (Structure
Only)
Specify Claim Type (Only if Type="Other")
If "Other Venue", specify
the venue
Claim open or closed?
Date Claim was
opened
Repair Option
Initiated?
Claim Paid Under
Catastrophic Ground Cover
Collapse?
How Was Claim Determined?
If claim is being disputed, where
is it in the process?
Has claim been reported to the
Florida Department of
Financial Services Division of
Insurance Fraud?
In what county was the claim
reported?
21
(Company Name)
Certification of Information
2010 Sink Hole Data Call Scope Period 2006 to 2010
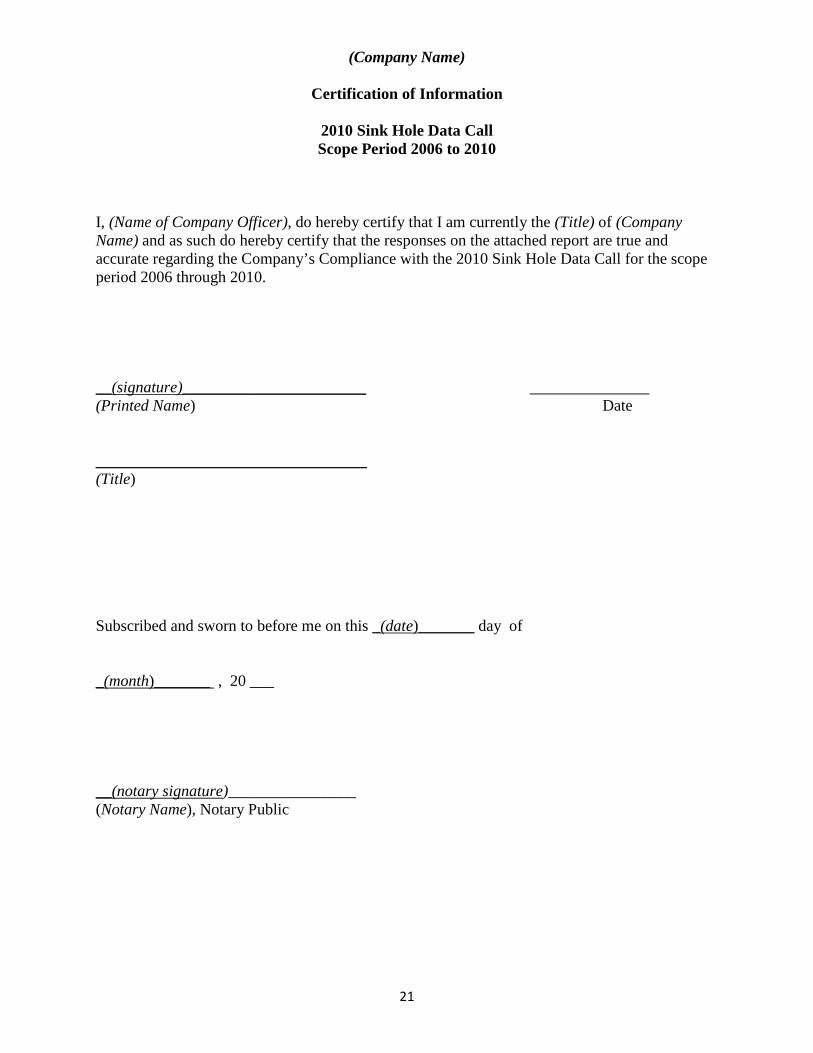
I, (Name of Company Officer), do hereby certify that I am currently the (Title) of (Company Name) and as such do hereby certify that the responses on the attached report are true and accurate regarding the Company’s Compliance with the 2010 Sink Hole Data Call for the scope period 2006 through 2010. __(signature)_______________________ _______________ (Printed Name) Date __________________________________ (Title) Subscribed and sworn to before me on this _(date)_______ day of _(month)_______ , 20 ___ __(notary signature)________________ (Notary Name), Notary Public
22
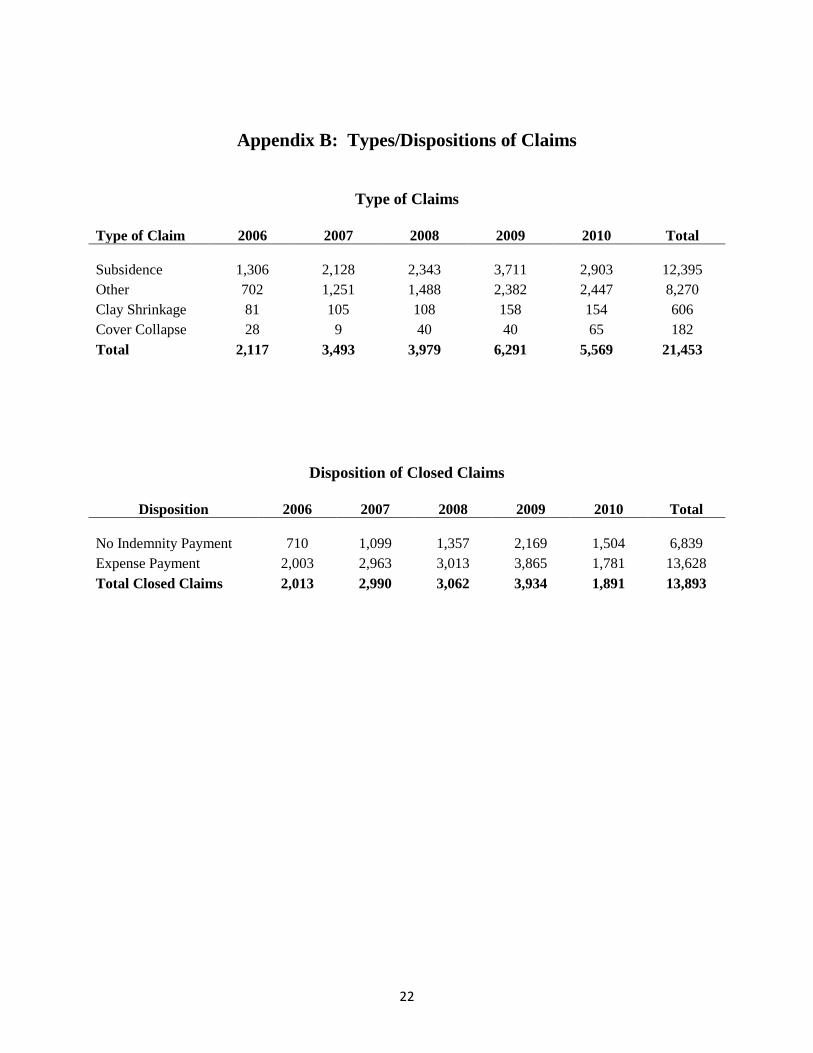
Appendix B: Types/Dispositions of Claims
Type of Claims
Type of Claim 2006 2007 2008 2009 2010 Total Subsidence 1,306 2,128 2,343 3,711 2,903 12,395 Other 702 1,251 1,488 2,382 2,447 8,270 Clay Shrinkage 81 105 108 158 154 606 Cover Collapse 28 9 40 40 65 182 Total 2,117 3,493 3,979 6,291 5,569 21,453
Disposition of Closed Claims
Disposition 2006 2007 2008 2009 2010 Total No Indemnity Payment 710 1,099 1,357 2,169 1,504 6,839 Expense Payment 2,003 2,963 3,013 3,865 1,781 13,628 Total Closed Claims 2,013 2,990 3,062 3,934 1,891 13,893
23
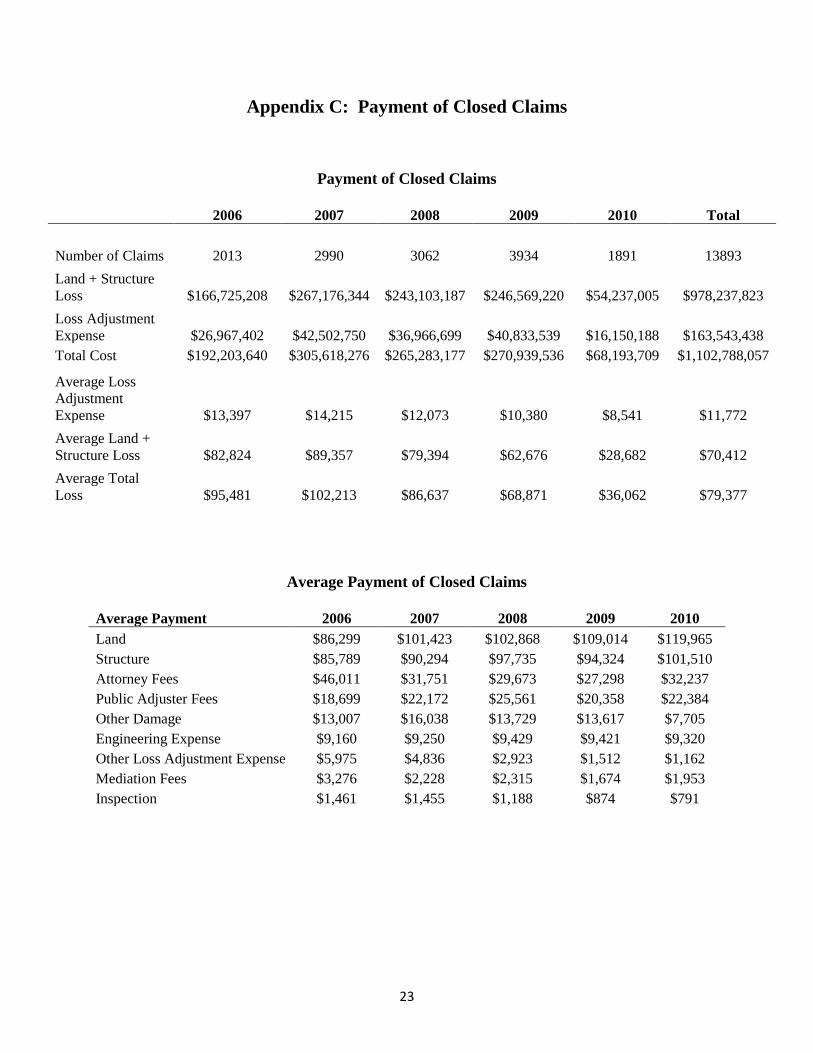
Appendix C: Payment of Closed Claims
Payment of Closed Claims
2006 2007 2008 2009 2010 Total
Number of Claims 2013 2990 3062 3934 1891 13893 Land + Structure Loss $166,725,208 $267,176,344 $243,103,187 $246,569,220 $54,237,005 $978,237,823 Loss Adjustment Expense $26,967,402 $42,502,750 $36,966,699 $40,833,539 $16,150,188 $163,543,438 Total Cost $192,203,640 $305,618,276 $265,283,177 $270,939,536 $68,193,709 $1,102,788,057
Average Loss Adjustment Expense $13,397 $14,215 $12,073 $10,380 $8,541 $11,772 Average Land + Structure Loss $82,824 $89,357 $79,394 $62,676 $28,682 $70,412 Average Total Loss $95,481 $102,213 $86,637 $68,871 $36,062 $79,377
Average Payment of Closed Claims
Average Payment 2006 2007 2008 2009 2010 Land $86,299 $101,423 $102,868 $109,014 $119,965 Structure $85,789 $90,294 $97,735 $94,324 $101,510 Attorney Fees $46,011 $31,751 $29,673 $27,298 $32,237 Public Adjuster Fees $18,699 $22,172 $25,561 $20,358 $22,384 Other Damage $13,007 $16,038 $13,729 $13,617 $7,705 Engineering Expense $9,160 $9,250 $9,429 $9,421 $9,320 Other Loss Adjustment Expense $5,975 $4,836 $2,923 $1,512 $1,162 Mediation Fees $3,276 $2,228 $2,315 $1,674 $1,953 Inspection $1,461 $1,455 $1,188 $874 $791
24
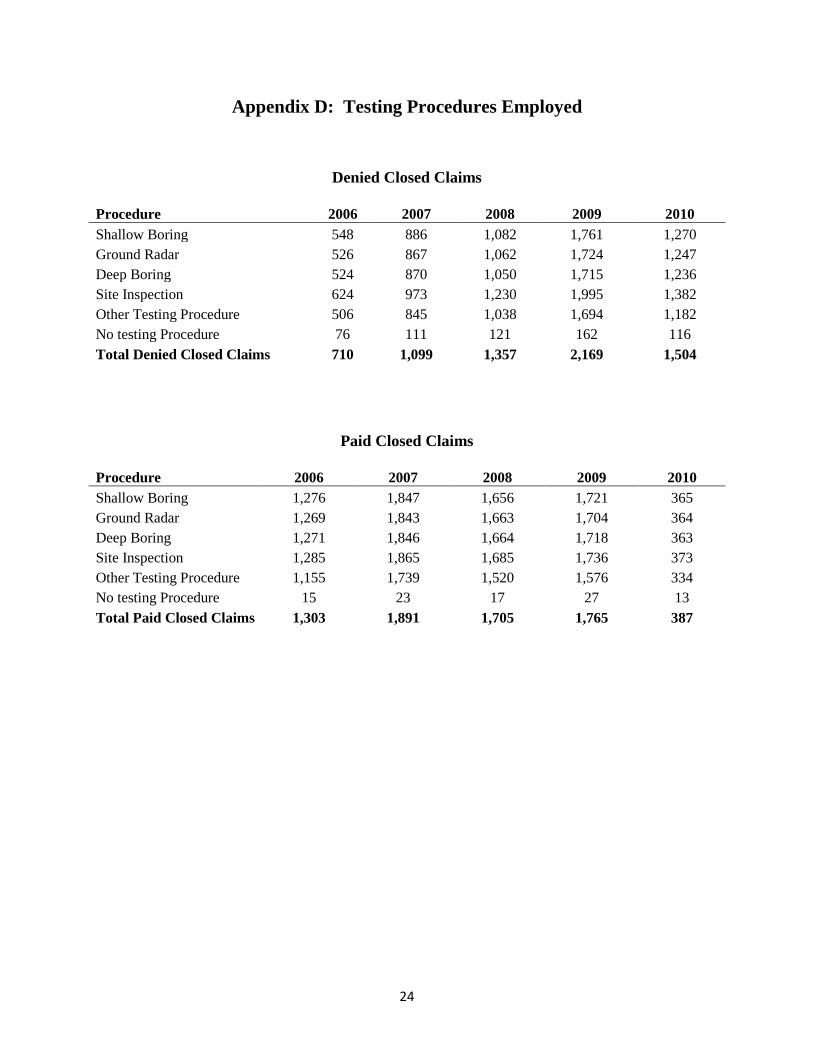
Appendix D: Testing Procedures Employed
Denied Closed Claims
Procedure 2006 2007 2008 2009 2010 Shallow Boring 548 886 1,082 1,761 1,270 Ground Radar 526 867 1,062 1,724 1,247 Deep Boring 524 870 1,050 1,715 1,236 Site Inspection 624 973 1,230 1,995 1,382 Other Testing Procedure 506 845 1,038 1,694 1,182 No testing Procedure 76 111 121 162 116 Total Denied Closed Claims 710 1,099 1,357 2,169 1,504
Paid Closed Claims
Procedure 2006 2007 2008 2009 2010 Shallow Boring 1,276 1,847 1,656 1,721 365 Ground Radar 1,269 1,843 1,663 1,704 364 Deep Boring 1,271 1,846 1,664 1,718 363 Site Inspection 1,285 1,865 1,685 1,736 373 Other Testing Procedure 1,155 1,739 1,520 1,576 334 No testing Procedure 15 23 17 27 13 Total Paid Closed Claims 1,303 1,891 1,705 1,765 387
25
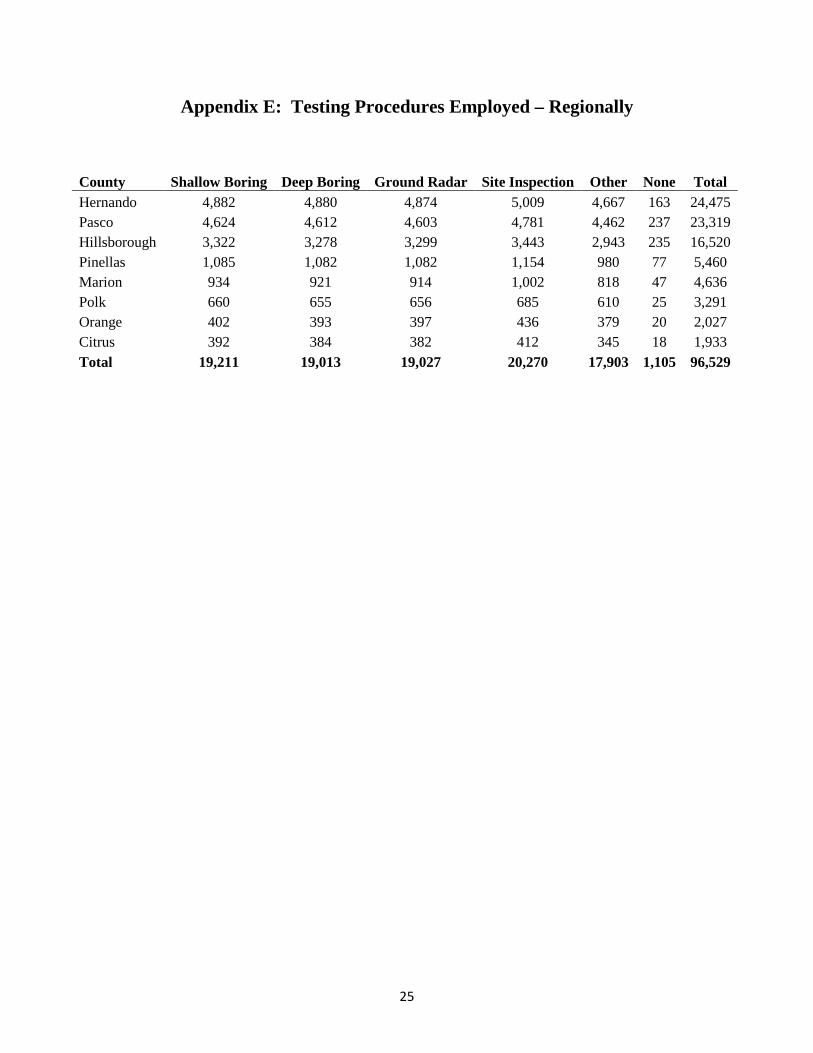
Appendix E: Testing Procedures Employed – Regionally
County Shallow Boring Deep Boring Ground Radar Site Inspection Other None Total Hernando 4,882 4,880 4,874 5,009 4,667 163 24,475 Pasco 4,624 4,612 4,603 4,781 4,462 237 23,319 Hillsborough 3,322 3,278 3,299 3,443 2,943 235 16,520 Pinellas 1,085 1,082 1,082 1,154 980 77 5,460 Marion 934 921 914 1,002 818 47 4,636 Polk 660 655 656 685 610 25 3,291 Orange 402 393 397 436 379 20 2,027 Citrus 392 384 382 412 345 18 1,933 Total 19,211 19,013 19,027 20,270 17,903 1,105 96,529
26
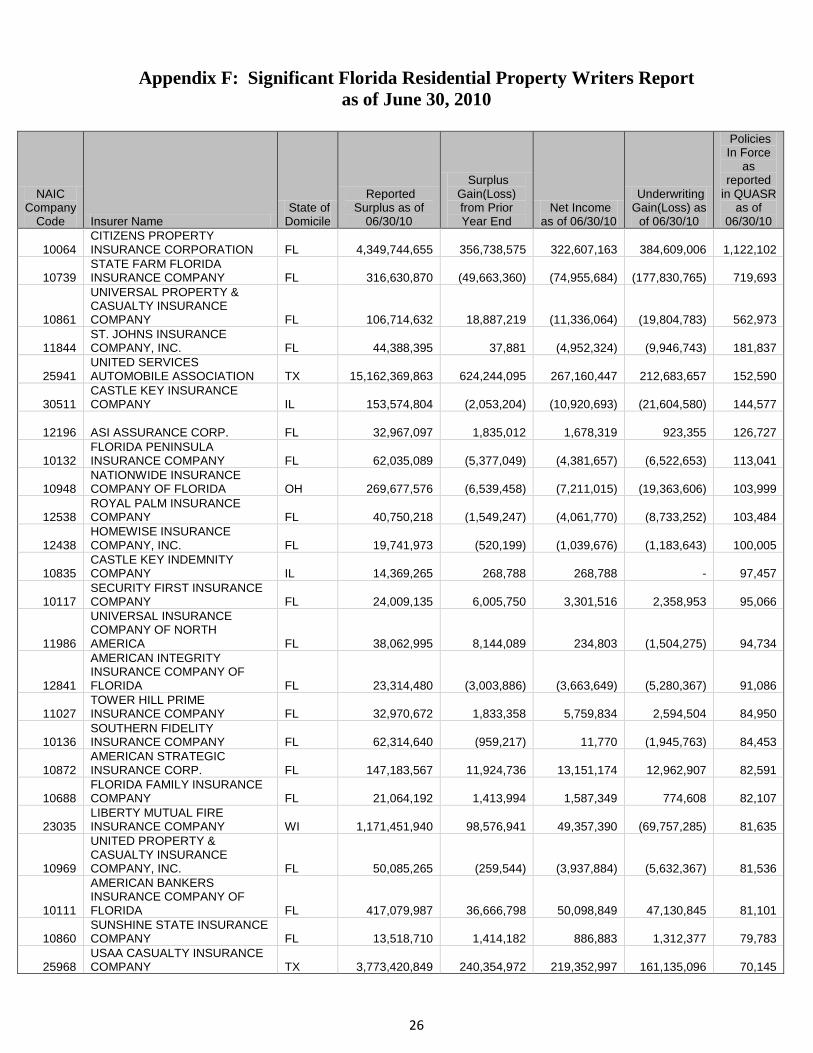
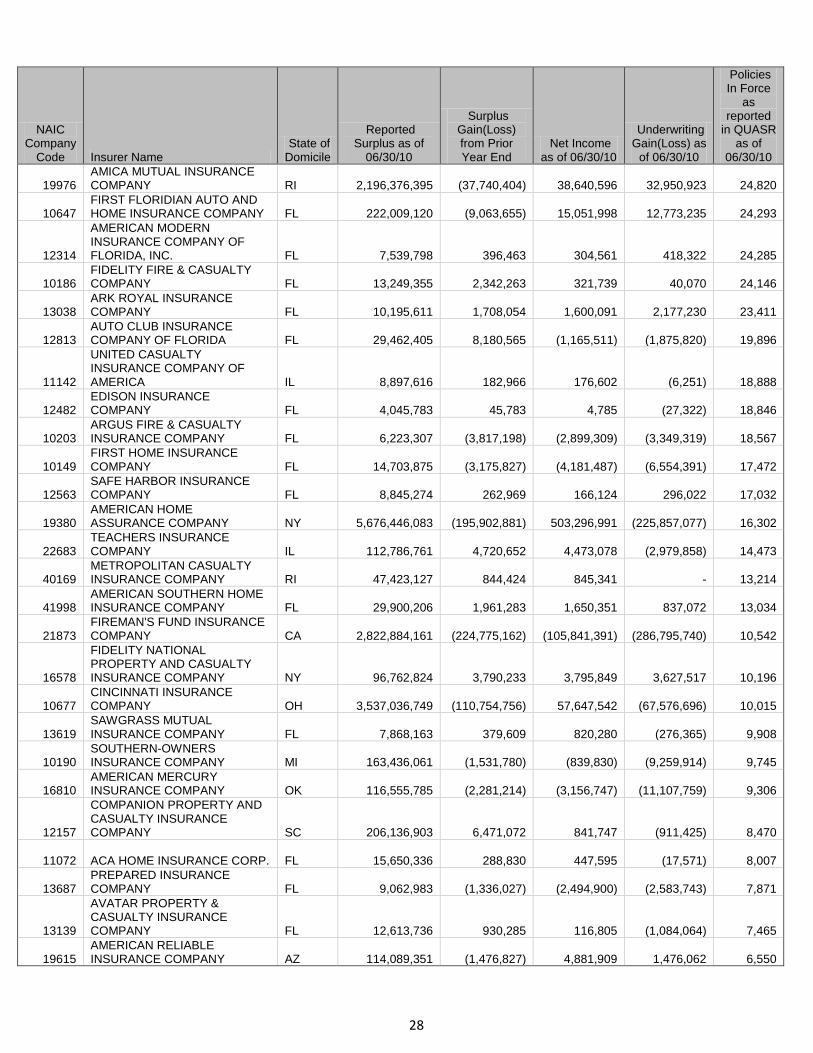
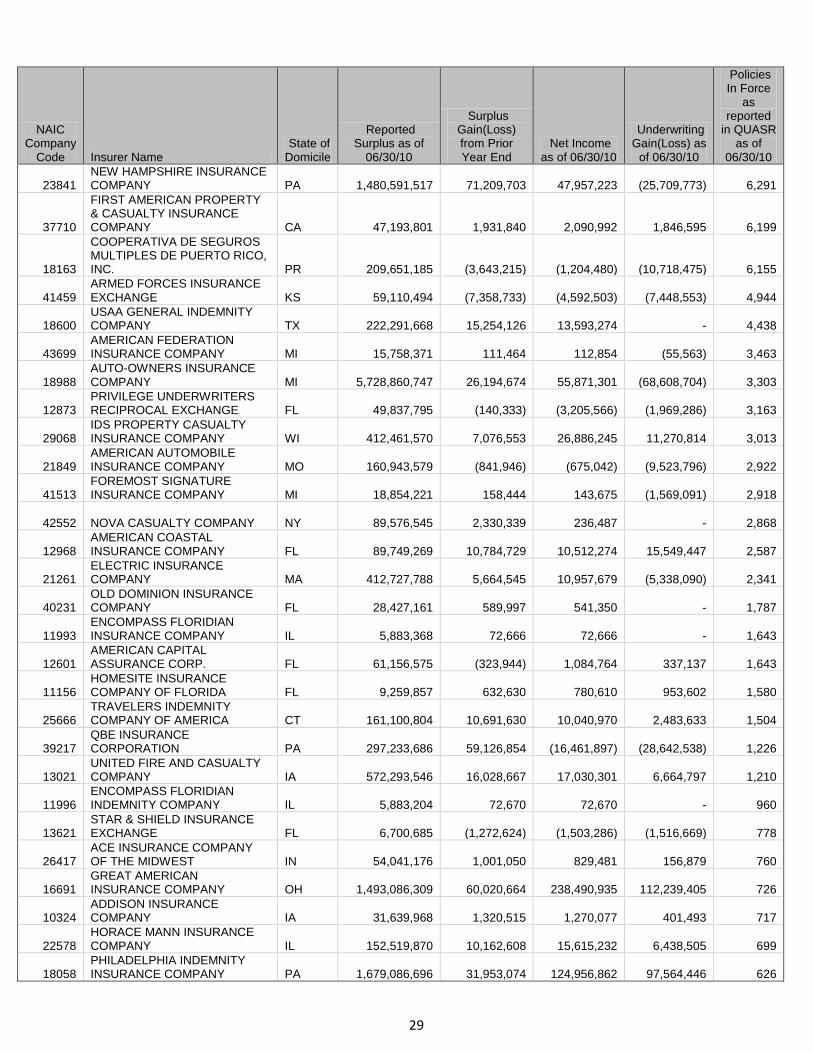
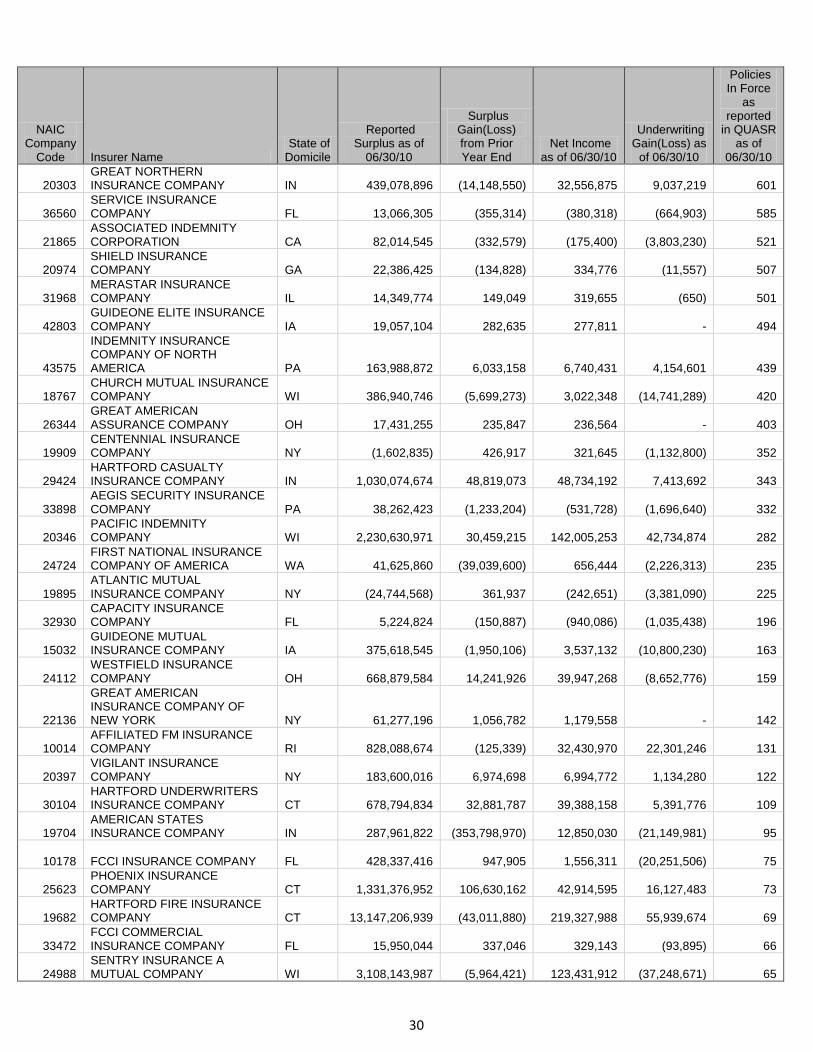
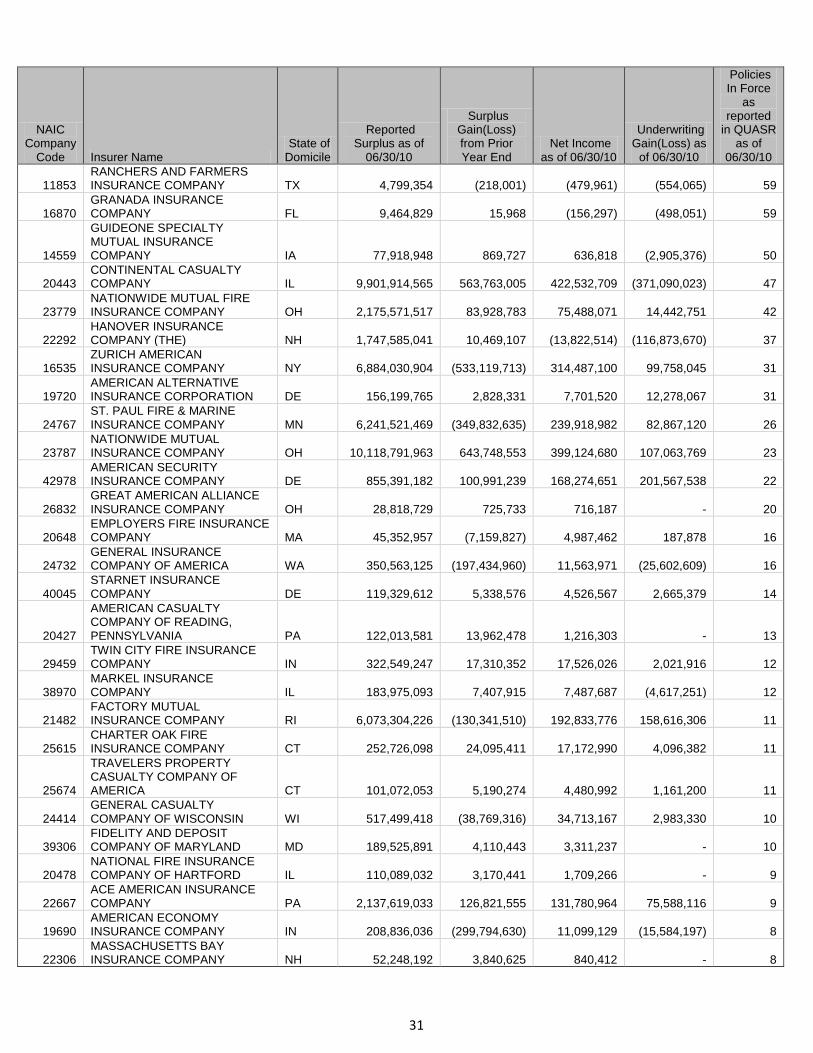
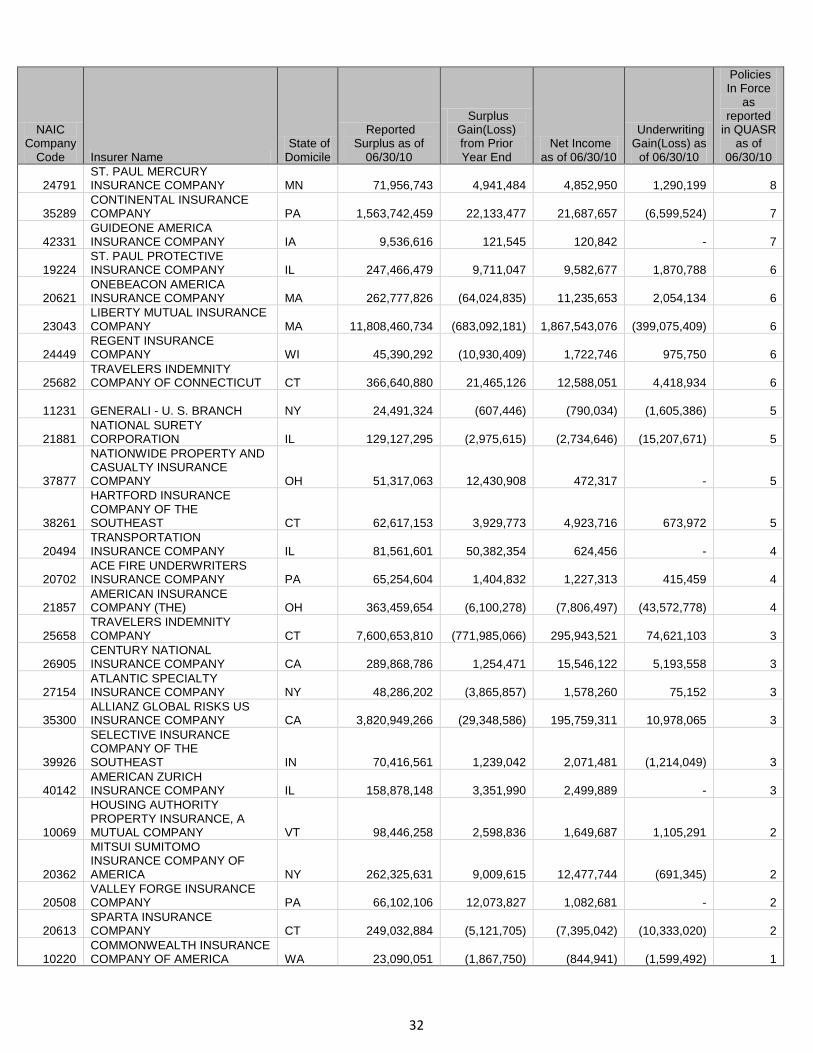
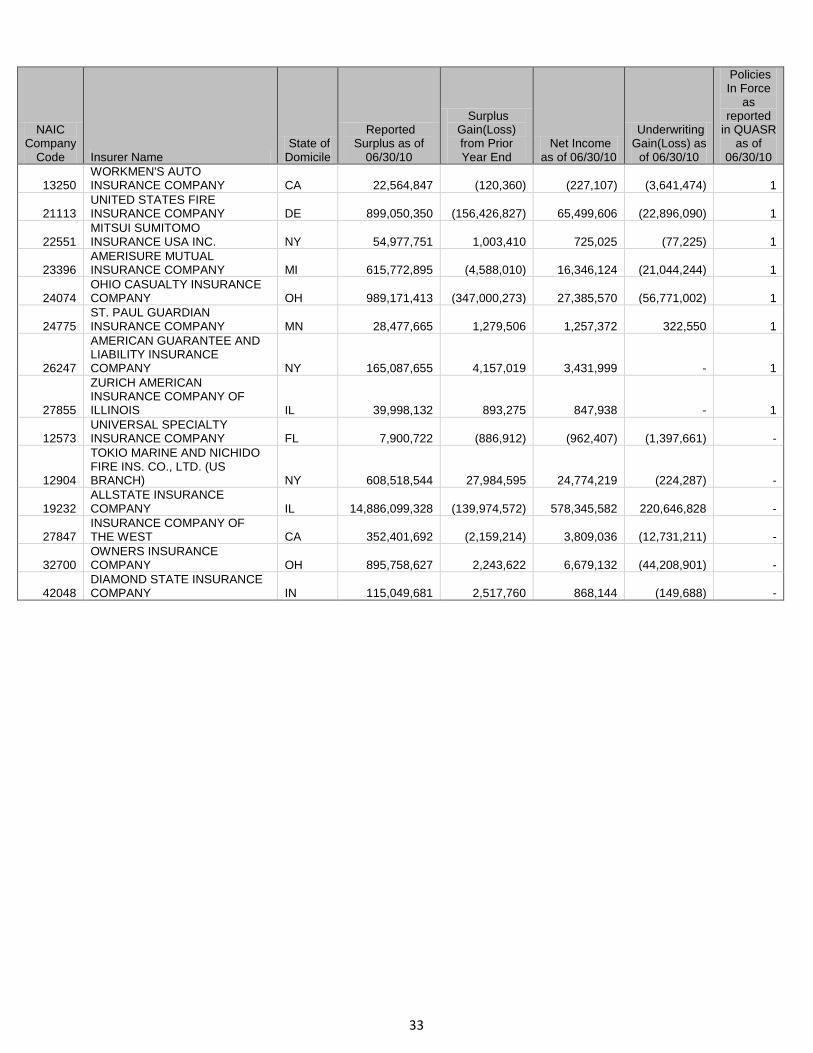
Appendix F: Significant Florida Residential Property Writers Report as of June 30, 2010
NAIC Company
Code Insurer Name State of Domicile
Reported Surplus as of
06/30/10
Surplus Gain(Loss) from Prior Year End
Net Income as of 06/30/10
Underwriting Gain(Loss) as
of 06/30/10
Policies In Force
as reported
in QUASR as of
06/30/10
10064 CITIZENS PROPERTY INSURANCE CORPORATION FL
4,349,744,655 356,738,575
322,607,163
384,609,006
1,122,102
10739 STATE FARM FLORIDA INSURANCE COMPANY FL
316,630,870
(49,663,360)
(74,955,684)
(177,830,765)
719,693
10861
UNIVERSAL PROPERTY & CASUALTY INSURANCE COMPANY FL
106,714,632 18,887,219
(11,336,064)
(19,804,783)
562,973
11844 ST. JOHNS INSURANCE COMPANY, INC. FL
44,388,395
37,881
(4,952,324)
(9,946,743)
181,837
25941 UNITED SERVICES AUTOMOBILE ASSOCIATION TX
15,162,369,863 624,244,095
267,160,447
212,683,657
152,590
30511 CASTLE KEY INSURANCE COMPANY IL
153,574,804
(2,053,204)
(10,920,693)
(21,604,580)
144,577
12196 ASI ASSURANCE CORP. FL
32,967,097
1,835,012
1,678,319
923,355
126,727
10132 FLORIDA PENINSULA INSURANCE COMPANY FL
62,035,089
(5,377,049)
(4,381,657)
(6,522,653)
113,041
10948 NATIONWIDE INSURANCE COMPANY OF FLORIDA OH
269,677,576
(6,539,458)
(7,211,015)
(19,363,606)
103,999
12538 ROYAL PALM INSURANCE COMPANY FL
40,750,218
(1,549,247)
(4,061,770)
(8,733,252)
103,484
12438 HOMEWISE INSURANCE COMPANY, INC. FL
19,741,973
(520,199)
(1,039,676)
(1,183,643)
100,005
10835 CASTLE KEY INDEMNITY COMPANY IL
14,369,265
268,788
268,788
-
97,457
10117 SECURITY FIRST INSURANCE COMPANY FL
24,009,135
6,005,750
3,301,516
2,358,953
95,066
11986
UNIVERSAL INSURANCE COMPANY OF NORTH AMERICA FL
38,062,995
8,144,089
234,803
(1,504,275)
94,734
12841
AMERICAN INTEGRITY INSURANCE COMPANY OF FLORIDA FL
23,314,480
(3,003,886)
(3,663,649)
(5,280,367)
91,086
11027 TOWER HILL PRIME INSURANCE COMPANY FL
32,970,672
1,833,358
5,759,834
2,594,504
84,950
10136 SOUTHERN FIDELITY INSURANCE COMPANY FL
62,314,640
(959,217)
11,770
(1,945,763)
84,453
10872 AMERICAN STRATEGIC INSURANCE CORP. FL
147,183,567 11,924,736
13,151,174
12,962,907
82,591
10688 FLORIDA FAMILY INSURANCE COMPANY FL
21,064,192
1,413,994
1,587,349
774,608
82,107
23035 LIBERTY MUTUAL FIRE INSURANCE COMPANY WI
1,171,451,940 98,576,941
49,357,390
(69,757,285)
81,635
10969
UNITED PROPERTY & CASUALTY INSURANCE COMPANY, INC. FL
50,085,265
(259,544)
(3,937,884)
(5,632,367)
81,536
10111
AMERICAN BANKERS INSURANCE COMPANY OF FLORIDA FL
417,079,987 36,666,798
50,098,849
47,130,845
81,101
10860 SUNSHINE STATE INSURANCE COMPANY FL
13,518,710
1,414,182
886,883
1,312,377
79,783
25968 USAA CASUALTY INSURANCE COMPANY TX
3,773,420,849 240,354,972
219,352,997
161,135,096
70,145
27
NAIC Company
Code Insurer Name State of Domicile
Reported Surplus as of
06/30/10
Surplus Gain(Loss) from Prior Year End
Net Income as of 06/30/10
Underwriting Gain(Loss) as
of 06/30/10
Policies In Force
as reported
in QUASR as of
06/30/10
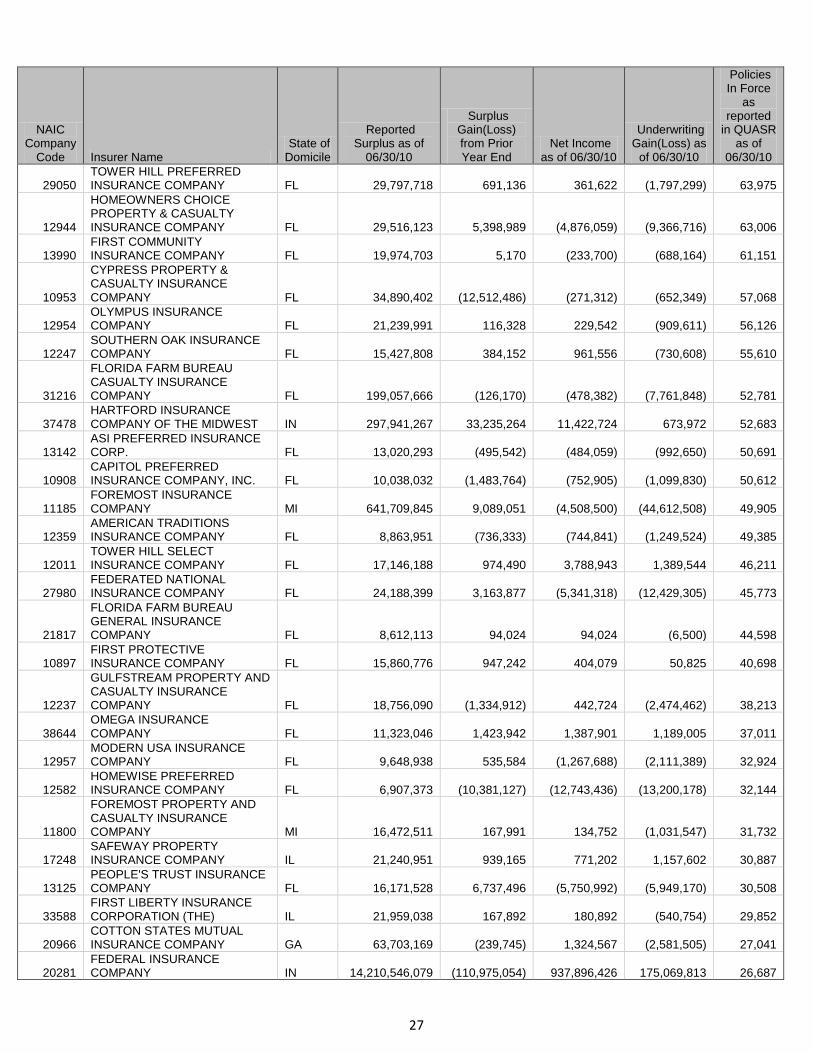
29050 TOWER HILL PREFERRED INSURANCE COMPANY FL
29,797,718
691,136
361,622
(1,797,299)
63,975
12944
HOMEOWNERS CHOICE PROPERTY & CASUALTY INSURANCE COMPANY FL
29,516,123
5,398,989
(4,876,059)
(9,366,716)
63,006
13990 FIRST COMMUNITY INSURANCE COMPANY FL
19,974,703
5,170
(233,700)
(688,164)
61,151
10953
CYPRESS PROPERTY & CASUALTY INSURANCE COMPANY FL
34,890,402
(12,512,486)
(271,312)
(652,349)
57,068
12954 OLYMPUS INSURANCE COMPANY FL
21,239,991
116,328
229,542
(909,611)
56,126
12247 SOUTHERN OAK INSURANCE COMPANY FL
15,427,808
384,152
961,556
(730,608)
55,610
31216
FLORIDA FARM BUREAU CASUALTY INSURANCE COMPANY FL
199,057,666
(126,170)
(478,382)
(7,761,848)
52,781
37478 HARTFORD INSURANCE COMPANY OF THE MIDWEST IN
297,941,267 33,235,264
11,422,724
673,972
52,683
13142 ASI PREFERRED INSURANCE CORP. FL
13,020,293
(495,542)
(484,059)
(992,650)
50,691
10908 CAPITOL PREFERRED INSURANCE COMPANY, INC. FL
10,038,032
(1,483,764)
(752,905)
(1,099,830)
50,612
11185 FOREMOST INSURANCE COMPANY MI
641,709,845
9,089,051
(4,508,500)
(44,612,508)
49,905
12359 AMERICAN TRADITIONS INSURANCE COMPANY FL
8,863,951
(736,333)
(744,841)
(1,249,524)
49,385
12011 TOWER HILL SELECT INSURANCE COMPANY FL
17,146,188
974,490
3,788,943
1,389,544
46,211
27980 FEDERATED NATIONAL INSURANCE COMPANY FL
24,188,399
3,163,877
(5,341,318)
(12,429,305)
45,773
21817
FLORIDA FARM BUREAU GENERAL INSURANCE COMPANY FL
8,612,113
94,024
94,024
(6,500)
44,598
10897 FIRST PROTECTIVE INSURANCE COMPANY FL
15,860,776
947,242
404,079
50,825
40,698
12237
GULFSTREAM PROPERTY AND CASUALTY INSURANCE COMPANY FL
18,756,090
(1,334,912)
442,724
(2,474,462)
38,213
38644 OMEGA INSURANCE COMPANY FL
11,323,046
1,423,942
1,387,901
1,189,005
37,011
12957 MODERN USA INSURANCE COMPANY FL
9,648,938
535,584
(1,267,688)
(2,111,389)
32,924
12582 HOMEWISE PREFERRED INSURANCE COMPANY FL
6,907,373
(10,381,127)
(12,743,436)
(13,200,178)
32,144
11800
FOREMOST PROPERTY AND CASUALTY INSURANCE COMPANY MI
16,472,511
167,991
134,752
(1,031,547)
31,732
17248 SAFEWAY PROPERTY INSURANCE COMPANY IL
21,240,951
939,165
771,202
1,157,602
30,887
13125 PEOPLE'S TRUST INSURANCE COMPANY FL
16,171,528
6,737,496
(5,750,992)
(5,949,170)
30,508
33588 FIRST LIBERTY INSURANCE CORPORATION (THE) IL
21,959,038
167,892
180,892
(540,754)
29,852
20966 COTTON STATES MUTUAL INSURANCE COMPANY GA
63,703,169
(239,745)
1,324,567
(2,581,505)
27,041
20281 FEDERAL INSURANCE COMPANY IN
14,210,546,079 (110,975,054)
937,896,426
175,069,813
26,687
28
NAIC Company
Code Insurer Name State of Domicile
Reported Surplus as of
06/30/10
Surplus Gain(Loss) from Prior Year End
Net Income as of 06/30/10
Underwriting Gain(Loss) as
of 06/30/10
Policies In Force
as reported
in QUASR as of
06/30/10
19976 AMICA MUTUAL INSURANCE COMPANY RI
2,196,376,395
(37,740,404)
38,640,596
32,950,923
24,820
10647 FIRST FLORIDIAN AUTO AND HOME INSURANCE COMPANY FL
222,009,120
(9,063,655)
15,051,998
12,773,235
24,293
12314
AMERICAN MODERN INSURANCE COMPANY OF FLORIDA, INC. FL
7,539,798
396,463
304,561
418,322
24,285
10186 FIDELITY FIRE & CASUALTY COMPANY FL
13,249,355
2,342,263
321,739
40,070
24,146
13038 ARK ROYAL INSURANCE COMPANY FL
10,195,611
1,708,054
1,600,091
2,177,230
23,411
12813 AUTO CLUB INSURANCE COMPANY OF FLORIDA FL
29,462,405
8,180,565
(1,165,511)
(1,875,820)
19,896
11142
UNITED CASUALTY INSURANCE COMPANY OF AMERICA IL
8,897,616
182,966
176,602
(6,251)
18,888
12482 EDISON INSURANCE COMPANY FL
4,045,783
45,783
4,785
(27,322)
18,846
10203 ARGUS FIRE & CASUALTY INSURANCE COMPANY FL
6,223,307
(3,817,198)
(2,899,309)
(3,349,319)
18,567
10149 FIRST HOME INSURANCE COMPANY FL
14,703,875
(3,175,827)
(4,181,487)
(6,554,391)
17,472
12563 SAFE HARBOR INSURANCE COMPANY FL
8,845,274
262,969
166,124
296,022
17,032
19380 AMERICAN HOME ASSURANCE COMPANY NY
5,676,446,083 (195,902,881)
503,296,991
(225,857,077)
16,302
22683 TEACHERS INSURANCE COMPANY IL
112,786,761
4,720,652
4,473,078
(2,979,858)
14,473
40169 METROPOLITAN CASUALTY INSURANCE COMPANY RI
47,423,127
844,424
845,341
-
13,214
41998 AMERICAN SOUTHERN HOME INSURANCE COMPANY FL
29,900,206
1,961,283
1,650,351
837,072
13,034
21873 FIREMAN'S FUND INSURANCE COMPANY CA
2,822,884,161 (224,775,162)
(105,841,391)
(286,795,740)
10,542
16578
FIDELITY NATIONAL PROPERTY AND CASUALTY INSURANCE COMPANY NY
96,762,824
3,790,233
3,795,849
3,627,517
10,196
10677 CINCINNATI INSURANCE COMPANY OH
3,537,036,749 (110,754,756)
57,647,542
(67,576,696)
10,015
13619 SAWGRASS MUTUAL INSURANCE COMPANY FL
7,868,163
379,609
820,280
(276,365)
9,908
10190 SOUTHERN-OWNERS INSURANCE COMPANY MI
163,436,061
(1,531,780)
(839,830)
(9,259,914)
9,745
16810 AMERICAN MERCURY INSURANCE COMPANY OK
116,555,785
(2,281,214)
(3,156,747)
(11,107,759)
9,306
12157
COMPANION PROPERTY AND CASUALTY INSURANCE COMPANY SC
206,136,903
6,471,072
841,747
(911,425)
8,470
11072 ACA HOME INSURANCE CORP. FL
15,650,336
288,830
447,595
(17,571)
8,007
13687 PREPARED INSURANCE COMPANY FL
9,062,983
(1,336,027)
(2,494,900)
(2,583,743)
7,871
13139
AVATAR PROPERTY & CASUALTY INSURANCE COMPANY FL
12,613,736
930,285
116,805
(1,084,064)
7,465
19615 AMERICAN RELIABLE INSURANCE COMPANY AZ
114,089,351
(1,476,827)
4,881,909
1,476,062
6,550
29
NAIC Company
Code Insurer Name State of Domicile
Reported Surplus as of
06/30/10
Surplus Gain(Loss) from Prior Year End
Net Income as of 06/30/10
Underwriting Gain(Loss) as
of 06/30/10
Policies In Force
as reported
in QUASR as of
06/30/10
23841 NEW HAMPSHIRE INSURANCE COMPANY PA
1,480,591,517 71,209,703
47,957,223
(25,709,773)
6,291
37710
FIRST AMERICAN PROPERTY & CASUALTY INSURANCE COMPANY CA
47,193,801
1,931,840
2,090,992
1,846,595
6,199
18163
COOPERATIVA DE SEGUROS MULTIPLES DE PUERTO RICO, INC. PR
209,651,185
(3,643,215)
(1,204,480)
(10,718,475)
6,155
41459 ARMED FORCES INSURANCE EXCHANGE KS
59,110,494
(7,358,733)
(4,592,503)
(7,448,553)
4,944
18600 USAA GENERAL INDEMNITY COMPANY TX
222,291,668 15,254,126
13,593,274
-
4,438
43699 AMERICAN FEDERATION INSURANCE COMPANY MI
15,758,371
111,464
112,854
(55,563)
3,463
18988 AUTO-OWNERS INSURANCE COMPANY MI
5,728,860,747 26,194,674
55,871,301
(68,608,704)
3,303
12873 PRIVILEGE UNDERWRITERS RECIPROCAL EXCHANGE FL
49,837,795
(140,333)
(3,205,566)
(1,969,286)
3,163
29068 IDS PROPERTY CASUALTY INSURANCE COMPANY WI
412,461,570
7,076,553
26,886,245
11,270,814
3,013
21849 AMERICAN AUTOMOBILE INSURANCE COMPANY MO
160,943,579
(841,946)
(675,042)
(9,523,796)
2,922
41513 FOREMOST SIGNATURE INSURANCE COMPANY MI
18,854,221
158,444
143,675
(1,569,091)
2,918
42552 NOVA CASUALTY COMPANY NY
89,576,545
2,330,339
236,487
-
2,868
12968 AMERICAN COASTAL INSURANCE COMPANY FL
89,749,269 10,784,729
10,512,274
15,549,447
2,587
21261 ELECTRIC INSURANCE COMPANY MA
412,727,788
5,664,545
10,957,679
(5,338,090)
2,341
40231 OLD DOMINION INSURANCE COMPANY FL
28,427,161
589,997
541,350
-
1,787
11993 ENCOMPASS FLORIDIAN INSURANCE COMPANY IL
5,883,368
72,666
72,666
-
1,643
12601 AMERICAN CAPITAL ASSURANCE CORP. FL
61,156,575
(323,944)
1,084,764
337,137
1,643
11156 HOMESITE INSURANCE COMPANY OF FLORIDA FL
9,259,857
632,630
780,610
953,602
1,580
25666 TRAVELERS INDEMNITY COMPANY OF AMERICA CT
161,100,804 10,691,630
10,040,970
2,483,633
1,504
39217 QBE INSURANCE CORPORATION PA
297,233,686 59,126,854
(16,461,897)
(28,642,538)
1,226
13021 UNITED FIRE AND CASUALTY COMPANY IA
572,293,546 16,028,667
17,030,301
6,664,797
1,210
11996 ENCOMPASS FLORIDIAN INDEMNITY COMPANY IL
5,883,204
72,670
72,670
-
960
13621 STAR & SHIELD INSURANCE EXCHANGE FL
6,700,685
(1,272,624)
(1,503,286)
(1,516,669)
778
26417 ACE INSURANCE COMPANY OF THE MIDWEST IN
54,041,176
1,001,050
829,481
156,879
760
16691 GREAT AMERICAN INSURANCE COMPANY OH
1,493,086,309 60,020,664
238,490,935
112,239,405
726
10324 ADDISON INSURANCE COMPANY IA
31,639,968
1,320,515
1,270,077
401,493
717
22578 HORACE MANN INSURANCE COMPANY IL
152,519,870 10,162,608
15,615,232
6,438,505
699
18058 PHILADELPHIA INDEMNITY INSURANCE COMPANY PA
1,679,086,696 31,953,074
124,956,862
97,564,446
626
30
NAIC Company
Code Insurer Name State of Domicile
Reported Surplus as of
06/30/10
Surplus Gain(Loss) from Prior Year End
Net Income as of 06/30/10
Underwriting Gain(Loss) as
of 06/30/10
Policies In Force
as reported
in QUASR as of
06/30/10
20303 GREAT NORTHERN INSURANCE COMPANY IN
439,078,896
(14,148,550)
32,556,875
9,037,219
601
36560 SERVICE INSURANCE COMPANY FL
13,066,305
(355,314)
(380,318)
(664,903)
585
21865 ASSOCIATED INDEMNITY CORPORATION CA
82,014,545
(332,579)
(175,400)
(3,803,230)
521
20974 SHIELD INSURANCE COMPANY GA
22,386,425
(134,828)
334,776
(11,557)
507
31968 MERASTAR INSURANCE COMPANY IL
14,349,774
149,049
319,655
(650)
501
42803 GUIDEONE ELITE INSURANCE COMPANY IA
19,057,104
282,635
277,811
-
494
43575
INDEMNITY INSURANCE COMPANY OF NORTH AMERICA PA
163,988,872
6,033,158
6,740,431
4,154,601
439
18767 CHURCH MUTUAL INSURANCE COMPANY WI
386,940,746
(5,699,273)
3,022,348
(14,741,289)
420
26344 GREAT AMERICAN ASSURANCE COMPANY OH
17,431,255
235,847
236,564
-
403
19909 CENTENNIAL INSURANCE COMPANY NY
(1,602,835)
426,917
321,645
(1,132,800)
352
29424 HARTFORD CASUALTY INSURANCE COMPANY IN
1,030,074,674 48,819,073
48,734,192
7,413,692
343
33898 AEGIS SECURITY INSURANCE COMPANY PA
38,262,423
(1,233,204)
(531,728)
(1,696,640)
332
20346 PACIFIC INDEMNITY COMPANY WI
2,230,630,971 30,459,215
142,005,253
42,734,874
282
24724 FIRST NATIONAL INSURANCE COMPANY OF AMERICA WA
41,625,860
(39,039,600)
656,444
(2,226,313)
235
19895 ATLANTIC MUTUAL INSURANCE COMPANY NY
(24,744,568)
361,937
(242,651)
(3,381,090)
225
32930 CAPACITY INSURANCE COMPANY FL
5,224,824
(150,887)
(940,086)
(1,035,438)
196
15032 GUIDEONE MUTUAL INSURANCE COMPANY IA
375,618,545
(1,950,106)
3,537,132
(10,800,230)
163
24112 WESTFIELD INSURANCE COMPANY OH
668,879,584 14,241,926
39,947,268
(8,652,776)
159
22136
GREAT AMERICAN INSURANCE COMPANY OF NEW YORK NY
61,277,196
1,056,782
1,179,558
-
142
10014 AFFILIATED FM INSURANCE COMPANY RI
828,088,674
(125,339)
32,430,970
22,301,246
131
20397 VIGILANT INSURANCE COMPANY NY
183,600,016
6,974,698
6,994,772
1,134,280
122
30104 HARTFORD UNDERWRITERS INSURANCE COMPANY CT
678,794,834 32,881,787
39,388,158
5,391,776
109
19704 AMERICAN STATES INSURANCE COMPANY IN
287,961,822 (353,798,970)
12,850,030
(21,149,981)
95
10178 FCCI INSURANCE COMPANY FL
428,337,416
947,905
1,556,311
(20,251,506)
75
25623 PHOENIX INSURANCE COMPANY CT
1,331,376,952 106,630,162
42,914,595
16,127,483
73
19682 HARTFORD FIRE INSURANCE COMPANY CT
13,147,206,939
(43,011,880)
219,327,988
55,939,674
69
33472 FCCI COMMERCIAL INSURANCE COMPANY FL
15,950,044
337,046
329,143
(93,895)
66
24988 SENTRY INSURANCE A MUTUAL COMPANY WI
3,108,143,987
(5,964,421)
123,431,912
(37,248,671)
65
31
NAIC Company
Code Insurer Name State of Domicile
Reported Surplus as of
06/30/10
Surplus Gain(Loss) from Prior Year End
Net Income as of 06/30/10
Underwriting Gain(Loss) as
of 06/30/10
Policies In Force
as reported
in QUASR as of
06/30/10
11853 RANCHERS AND FARMERS INSURANCE COMPANY TX
4,799,354
(218,001)
(479,961)
(554,065)
59
16870 GRANADA INSURANCE COMPANY FL
9,464,829
15,968
(156,297)
(498,051)
59
14559
GUIDEONE SPECIALTY MUTUAL INSURANCE COMPANY IA
77,918,948
869,727
636,818
(2,905,376)
50
20443 CONTINENTAL CASUALTY COMPANY IL
9,901,914,565 563,763,005
422,532,709
(371,090,023)
47
23779 NATIONWIDE MUTUAL FIRE INSURANCE COMPANY OH
2,175,571,517 83,928,783
75,488,071
14,442,751
42
22292 HANOVER INSURANCE COMPANY (THE) NH
1,747,585,041 10,469,107
(13,822,514)
(116,873,670)
37
16535 ZURICH AMERICAN INSURANCE COMPANY NY
6,884,030,904 (533,119,713)
314,487,100
99,758,045
31
19720 AMERICAN ALTERNATIVE INSURANCE CORPORATION DE
156,199,765
2,828,331
7,701,520
12,278,067
31
24767 ST. PAUL FIRE & MARINE INSURANCE COMPANY MN
6,241,521,469 (349,832,635)
239,918,982
82,867,120
26
23787 NATIONWIDE MUTUAL INSURANCE COMPANY OH
10,118,791,963 643,748,553
399,124,680
107,063,769
23
42978 AMERICAN SECURITY INSURANCE COMPANY DE
855,391,182 100,991,239
168,274,651
201,567,538
22
26832 GREAT AMERICAN ALLIANCE INSURANCE COMPANY OH
28,818,729
725,733
716,187
-
20
20648 EMPLOYERS FIRE INSURANCE COMPANY MA
45,352,957
(7,159,827)
4,987,462
187,878
16
24732 GENERAL INSURANCE COMPANY OF AMERICA WA
350,563,125 (197,434,960)
11,563,971
(25,602,609)
16
40045 STARNET INSURANCE COMPANY DE
119,329,612
5,338,576
4,526,567
2,665,379
14
20427
AMERICAN CASUALTY COMPANY OF READING, PENNSYLVANIA PA
122,013,581 13,962,478
1,216,303
-
13
29459 TWIN CITY FIRE INSURANCE COMPANY IN
322,549,247 17,310,352
17,526,026
2,021,916
12
38970 MARKEL INSURANCE COMPANY IL
183,975,093
7,407,915
7,487,687
(4,617,251)
12
21482 FACTORY MUTUAL INSURANCE COMPANY RI
6,073,304,226 (130,341,510)
192,833,776
158,616,306
11
25615 CHARTER OAK FIRE INSURANCE COMPANY CT
252,726,098 24,095,411
17,172,990
4,096,382
11
25674
TRAVELERS PROPERTY CASUALTY COMPANY OF AMERICA CT
101,072,053
5,190,274
4,480,992
1,161,200
11
24414 GENERAL CASUALTY COMPANY OF WISCONSIN WI
517,499,418
(38,769,316)
34,713,167
2,983,330
10
39306 FIDELITY AND DEPOSIT COMPANY OF MARYLAND MD
189,525,891
4,110,443
3,311,237
-
10
20478 NATIONAL FIRE INSURANCE COMPANY OF HARTFORD IL
110,089,032
3,170,441
1,709,266
-
9
22667 ACE AMERICAN INSURANCE COMPANY PA
2,137,619,033 126,821,555
131,780,964
75,588,116
9
19690 AMERICAN ECONOMY INSURANCE COMPANY IN
208,836,036 (299,794,630)
11,099,129
(15,584,197)
8
22306 MASSACHUSETTS BAY INSURANCE COMPANY NH
52,248,192
3,840,625
840,412
-
8
32
NAIC Company
Code Insurer Name State of Domicile
Reported Surplus as of
06/30/10
Surplus Gain(Loss) from Prior Year End
Net Income as of 06/30/10
Underwriting Gain(Loss) as
of 06/30/10
Policies In Force
as reported
in QUASR as of
06/30/10
24791 ST. PAUL MERCURY INSURANCE COMPANY MN
71,956,743
4,941,484
4,852,950
1,290,199
8
35289 CONTINENTAL INSURANCE COMPANY PA
1,563,742,459 22,133,477
21,687,657
(6,599,524)
7
42331 GUIDEONE AMERICA INSURANCE COMPANY IA
9,536,616
121,545
120,842
-
7
19224 ST. PAUL PROTECTIVE INSURANCE COMPANY IL
247,466,479
9,711,047
9,582,677
1,870,788
6
20621 ONEBEACON AMERICA INSURANCE COMPANY MA
262,777,826
(64,024,835)
11,235,653
2,054,134
6
23043 LIBERTY MUTUAL INSURANCE COMPANY MA
11,808,460,734 (683,092,181)
1,867,543,076
(399,075,409)
6
24449 REGENT INSURANCE COMPANY WI
45,390,292
(10,930,409)
1,722,746
975,750
6
25682 TRAVELERS INDEMNITY COMPANY OF CONNECTICUT CT
366,640,880 21,465,126
12,588,051
4,418,934
6
11231 GENERALI - U. S. BRANCH NY
24,491,324
(607,446)
(790,034)
(1,605,386)
5
21881 NATIONAL SURETY CORPORATION IL
129,127,295
(2,975,615)
(2,734,646)
(15,207,671)
5
37877
NATIONWIDE PROPERTY AND CASUALTY INSURANCE COMPANY OH
51,317,063 12,430,908
472,317
-
5
38261
HARTFORD INSURANCE COMPANY OF THE SOUTHEAST CT
62,617,153
3,929,773
4,923,716
673,972
5
20494 TRANSPORTATION INSURANCE COMPANY IL
81,561,601 50,382,354
624,456
-
4
20702 ACE FIRE UNDERWRITERS INSURANCE COMPANY PA
65,254,604
1,404,832
1,227,313
415,459
4
21857 AMERICAN INSURANCE COMPANY (THE) OH
363,459,654
(6,100,278)
(7,806,497)
(43,572,778)
4
25658 TRAVELERS INDEMNITY COMPANY CT
7,600,653,810 (771,985,066)
295,943,521
74,621,103
3
26905 CENTURY NATIONAL INSURANCE COMPANY CA
289,868,786
1,254,471
15,546,122
5,193,558
3
27154 ATLANTIC SPECIALTY INSURANCE COMPANY NY
48,286,202
(3,865,857)
1,578,260
75,152
3
35300 ALLIANZ GLOBAL RISKS US INSURANCE COMPANY CA
3,820,949,266
(29,348,586)
195,759,311
10,978,065
3
39926
SELECTIVE INSURANCE COMPANY OF THE SOUTHEAST IN
70,416,561
1,239,042
2,071,481
(1,214,049)
3
40142 AMERICAN ZURICH INSURANCE COMPANY IL
158,878,148
3,351,990
2,499,889
-
3
10069
HOUSING AUTHORITY PROPERTY INSURANCE, A MUTUAL COMPANY VT
98,446,258
2,598,836
1,649,687
1,105,291
2
20362
MITSUI SUMITOMO INSURANCE COMPANY OF AMERICA NY
262,325,631
9,009,615
12,477,744
(691,345)
2
20508 VALLEY FORGE INSURANCE COMPANY PA
66,102,106 12,073,827
1,082,681
-
2
20613 SPARTA INSURANCE COMPANY CT
249,032,884
(5,121,705)
(7,395,042)
(10,333,020)
2
10220 COMMONWEALTH INSURANCE COMPANY OF AMERICA WA
23,090,051
(1,867,750)
(844,941)
(1,599,492)
1
33
NAIC Company
Code Insurer Name State of Domicile
Reported Surplus as of
06/30/10
Surplus Gain(Loss) from Prior Year End
Net Income as of 06/30/10
Underwriting Gain(Loss) as
of 06/30/10
Policies In Force
as reported
in QUASR as of
06/30/10
13250 WORKMEN'S AUTO INSURANCE COMPANY CA
22,564,847
(120,360)
(227,107)
(3,641,474)
1
21113 UNITED STATES FIRE INSURANCE COMPANY DE
899,050,350 (156,426,827)
65,499,606
(22,896,090)
1
22551 MITSUI SUMITOMO INSURANCE USA INC. NY
54,977,751
1,003,410
725,025
(77,225)
1
23396 AMERISURE MUTUAL INSURANCE COMPANY MI
615,772,895
(4,588,010)
16,346,124
(21,044,244)
1
24074 OHIO CASUALTY INSURANCE COMPANY OH
989,171,413 (347,000,273)
27,385,570
(56,771,002)
1
24775 ST. PAUL GUARDIAN INSURANCE COMPANY MN
28,477,665
1,279,506
1,257,372
322,550
1
26247
AMERICAN GUARANTEE AND LIABILITY INSURANCE COMPANY NY
165,087,655
4,157,019
3,431,999
-
1
27855
ZURICH AMERICAN INSURANCE COMPANY OF ILLINOIS IL
39,998,132
893,275
847,938
-
1
12573 UNIVERSAL SPECIALTY INSURANCE COMPANY FL
7,900,722
(886,912)
(962,407)
(1,397,661)
-
12904
TOKIO MARINE AND NICHIDO FIRE INS. CO., LTD. (US BRANCH) NY
608,518,544 27,984,595
24,774,219
(224,287)
-
19232 ALLSTATE INSURANCE COMPANY IL
14,886,099,328 (139,974,572)
578,345,582
220,646,828
-
27847 INSURANCE COMPANY OF THE WEST CA
352,401,692
(2,159,214)
3,809,036
(12,731,211)
-
32700 OWNERS INSURANCE COMPANY OH
895,758,627
2,243,622
6,679,132
(44,208,901)
-
42048 DIAMOND STATE INSURANCE COMPANY IN
115,049,681
2,517,760
868,144
(149,688)
-