Embed Size (px)
Citation preview

Florida Department of Transportation Bridge Scour Evaluation Program
p. E Lagasse and E . V. Richardson, Ayres Associates K. E . Weldon, Florida Department of Transportation
Following the catastrophic failure of the Schoharie Creek bridge in April 1987 FHWA established a national bridge scour evaluation program under the National Bridge Inspection Standards to be implemented by state highway and transportation departments. Initial scour susceptibility screening was completed for the most part by October 1992, and FHWA has established January 1997 as the completion date for scour evaluations of all existing bridges identified as scour susceptible. The procedures that were developed and the results to date of scour evaluation of bridges in Florida are highlighted. The Florida Department of Transportation guideUnes contain a four-phase approach to scour evaluations: Phase I is data collection and qualitative analysis, Phase I I is hydrologic and hydraulic assessment for scour analysis. Phase I I I is geotechnical and structural scour assessment, and Phase IV is a recommended plan of action. The checklists and field procedures developed to complete Phases I and I I of the evaluation are presented, and the results of the scour evaluations to date are summarized.
Fl oUowing the catastrophic failure of the Schoharie I Creek bridge in Apr i l 1987 FHWA estabUshed a
national bridge scour evaluation program to be implemented by state highway and transportation departments. Initial scour susceptibility screening was completed for the most part by October 1992, and
FHWA has established January 1997 as the completion date for scour evaluations of all existing bridges identified as scour susceptible. Wi th almost 8,000 bridges under the National Bridge Inspection Standards (NBIS), Florida is facing a formidable task. The procedures that were developed and the results to date f rom scour evaluation of bridges in Florida by the Florida Department of Transportation (FDOT) are highlighted. The checklists and field procedures developed to complete the initial phases of the evaluation are presented and discussed. This paper expands on and updates a description of the scour evaluation program developed initially for a single district of FDOT (1).
F D O T GUIDELINES
Technical Advisory 5140.23, Evaluating Scour at Bridges (2), issued by FHWA in 1991 to supersede Technical Advisory 5140.20, provides guidance on the development and implementation of procedures for evaluating bridge scour. The technical advisory indicates that every bridge over a waterway, whether existing or under design, should be evaluated for scour to determine prudent measures to be taken for its protection. The evaluations are to be conducted by an interdisciplinary team (hydraulic, geotechnical, and struc-
237

238 FOURTH INTERNATIONAL BRIDGE ENGINEERING CONFERENCE
tural engineers) and are to include hydraulic studies and scour evaluation.
The scour evaluation procedures implemented in Florida are based on FDOT guidelines for scour evaluation studies (3), which are supported by FHWA guidance in Technical Advisory 5140.23 and FHWA's Hydraulic Engineering Circulars 18 (HEC-18) (4) and 20 (HEC-20) (5). FDOT guidelines contain a four-phase approach to scour evaluations:
• Phase I : data collection and qualitative analysis, • Phase I I : hydrologic and hydraulic assessment for
scour analysis, • Phase I I I : geotechnical and structural scour assess
ment, and • Phase rV: recommended plan of action.
The site data analysis for Phase I is qualitative. It involves preliminary conclusions and findings based on the application of simple geomorphic concepts and reconnaissance-level evaluation of office data, field data, and site conditions. This phase relies heavily on the stepwise procedure and techniques presented in HEC-20 (5). Phase I I involves basic engineering analysis techniques and development of quantitative information for bridge scour assessment. Guidance in specific areas of the evaluation and the level of detail required are based on the results of Phase I . Again, a stepwise analysis procedure presented in HEC-20 (5) provides guidance for the Phase I I effort, and scour analyses are completed in accordance with the detailed procedures presented in HEC-18 (4).
Phases I I I and*IV of the FDOT procedure, which w i l l not be discussed further, involve the structural and geotechnical disciplines represented on the scour evaluation team (Phase III) and the development of a conceptual plan for scour countermeasures for protecting structural elements considered at risk as a result of scour (Phase IV). Phase I V involves the entire multidisciplinary evaluation team and relies on the countermeasure guidance contained in HEC-18 (4) and HEC-20 (5).
EVALUATION CRITERIA
In HEC-18 (4) the recommendation is made that states screen their bridges and place them into three categories: low risk, scour susceptible, and unknown foundations. I f the evaluation team detects an immediate scour threat to a bridge during Phase I , the responsible department of transportation district should be notified. Consequently, the Phase I procedure developed for FDOT includes an additional scour-critical category. The following guidelines are provided to assist the evaluation team in making consistent ratings. A high, me
dium, and low priority is also included to assist the FDOT district in prioritizing Phase I I and follow-on activities.
Category
Scour critical Scour susceptible Low risk Foundations
Scour critical
Rating
Yes or no High, medium, low High, medium, low Known or unknown
• Evidence of structural damage due to scour, • Aggressive stream or tidal waterway (high velocity,
steep slope, deep flow), • Exposed footing in erodible material, • Exposed piles wi th unknown or insufficient
embedment, • Countermeasures needed immediately, and • Actively degrading channel.
Scour susceptible (high priority)
• Aggressive stream or tidal waterway, • Foundations are spread footings on erodible soil,
shallow piles, or embedment unknown, • Tidal flows have high velocities (surface velocity,
>0.9 m/sec) and large tidal amplitudes (>0.6 m), • Bed material is easily eroded, • Evidence of scour or degradation, • Scour is below top of footing, • Large angle of attack (>10 degrees), • No countermeasures or countermeasures in poor
condition, • Clear water scour mode (e.g., relief bridge on
floodplain), • Significant f low over the bank (potential for con
traction scour), and • Possibility of bridge overtopping (potential for
pressure flow).
Scour susceptible (medium priority)
• Characteristics fall between high and low.
Scour susceptible (low priority)
• Stream is not aggressive (low velocities) or other factors mitigate the high velocities,
• Foundations are on piles but of unknown embedment,
• Tidal flows have low velocities and tidal amplitudes,
• Bed material is erodible,

LAGASSE ET AL. 239
• Some evidence of scour or degradation, • Scour is not below top of spread footings, • Stream is degrading but foundations are known,
and
• Countermeasures are in fair to good condition.
Low risk (high priority)
• Stream is not aggressive (low velocity), or other factors mitigate the high velocity,
• Foundations on piles of known embedment, • Stream is aggressive or the tidal range is large, but
foundations are known and cross section is stable, • Stream is aggrading or stable, and • Countermeasures are in fair condition.
Low risk (medium priority)
• Characteristics fall between high and low.
Low risk (low priority)
• Stream is not aggressive or other factors mitigate high velocity,
• Foundation is in bedrock, • Stream is aggrading or stable, • Pile foundations are deep, • Cross section is stable, • No evidence of scour, • Tidal flows have low velocities and ranges, • Countermeasures are in good condition, • No possibility of overtopping bridge, • Foundations are designed using current technology, • Channel is heavily vegetated, and • No flow over the bank.
Unknown foundations
• No record of foundation type (i.e., spread footing versus piles) or condition of foundation or pile embedment is unknown (generally rated a minimum of scour susceptible, low priority, unless there are significant mitigating factors, e.g., a long history of significant aggradation).
These criteria are intended to serve as guidelines in the Phase I scour evaluation. Although a numerical rating scheme could be developed, Phase I is intended to be a qualitative evaluation based heavily on experience and engineering judgment. It is not necessary that all factors in a given category be present to justify a specific rating, but the observance of several factors in a given category would guide the rating toward that category, considering all other office review and field reconnaissance data available. As noted in FDOT guidelines (3),
the engineer must use good judgment in the evaluation process and is encouraged to use ingenuity in applying the recommended concepts and procedures.
STANDARDIZED FORMS
Phase I: Qualitative Analysis
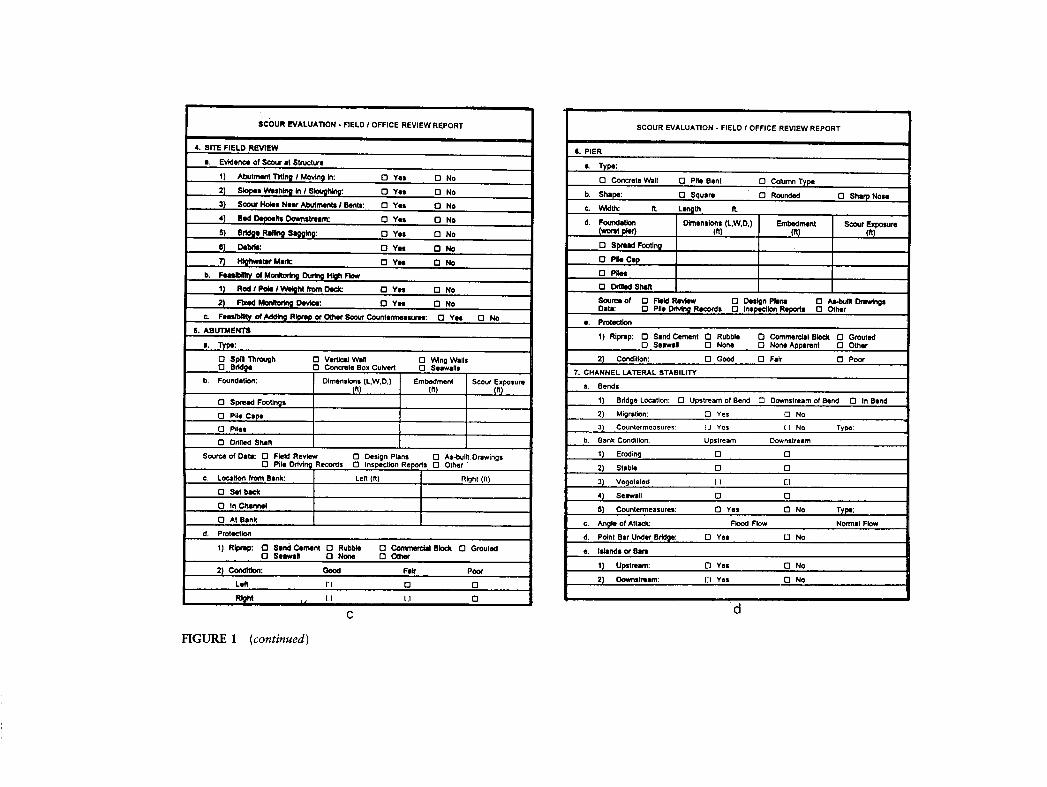
To support the Phase I office and field evaluation, a set of standardized forms was developed (Figure 1). The form consists of 11 categories that systematically address structural components affected by scour, abutments and piers, lateral and vertical channel stability, geomorphology, other considerations (watershed, tidal, and tributary factors), and additional comments (such as unique characteristics and a standard set of photographs), which can be evaluated on a qualitative basis during office and field inspections. The appropriate data collected in the office for Sections 4 through 11 (Figure 1) are considered during the Phase I field evaluation and review. Each of these categories is tied closely to the FHWA guidelines and procedures presented in HEC-18 (4) and HEC-20 (5). Initially, field site visits were scheduled before the office review, but experience has shown that many questions in the field can be avoided i f adequate time has been taken to assemble and review all available file information first.
The specific conclusions reached following the office and field review are summarized in Sections 1 through 3, which outline the Scour Vulnerability Rating (rating and reasons for rating), FDOT Scour Index (based on a preliminary screening by FDOT), and recommendations (including countermeasures and the need for a Phase I I analysis). A standard cover sheet (Figure 1) identifies the bridge by number and location, provides a scour vulnerability summary (scour mode and rating), and provides a recommendation regarding the need for a Phase I I quantitative analysis.
The forms are arranged to guide the inspector or reviewer through a standard evaluation process. Several areas of the form allow alternative choices in each of the categories. These areas are intended to be appropriately marked or circled in the field for further evaluation in the office. The scope of Phase I qualitative analysis is designed to develop an informed opinion of scour susceptibility based on available site-specific data and good engineering judgment.
The countermeasures identified on the form represent recommendations of the inspector or reviewer. I f scour monitoring is specified as a countermeasure, this would require installation on the bridge of a device designed to continuously or periodically measure scour. I f inspections are recommended as a countermeasure, the frequency is specified (i.e., during routine bridge inspec-

Prepared For: SCOUR EVALUATION REPORT
Prepared By:
/WRES A S S O C I A T E S
3901 Coconut Palm Drive SulK 100
Tampi Ftorida (813) 828-0742
R E P O R T IDENTIFICATION
• P H A S E 1 • PHASE 2 • P H A S E S • P H A S E 4 QuaMiiW* Evaluation/ HydraulcMydretoolc StniduraVCaotochnlcal PUn of Adlon Aitaiim«nl AaMftVMnl AaMtamonl Oat«' DM: OM\»: ,,,„ , Dalo:
HridoB Numbar Name: ,
Location: Counlv:
' • f " S C O U R W J L N E R A B I L n Y i ^ i ; ^ ^ ^ ^ ? ^ ^ -
S C O U R MODE: • RWwirM • TUii • Bon
S C O U R RATING: sceur cmictl: • Yti • No
Scour tinccptlbto;
• High • Madkitn • Lew
Low Rlah:
• High • Medium • Low
Fouftdatlent: • Known • Unknown
RECOMMENDATION:
Namt of Engtn*«r InHola EnghMrtng
Roglitritton Numbor
Reviewing Brfdg* Engtneef/Suptrvfsor Confirming Registered Professional Engineer
Nam* P.E. No. Mtoh. Nsmt P.E. No. Stonah>™/Stal
SCOUR EVALUATION - FIELD ( OFFICE REVIEW REPORT
Bridga Counly: Ovar
1. SCOUR VULNERABILITY RATING (PER FHWA)
a. Scour Critical: Q Yat • No
Scour Suscaptlt)!*: • High • Msdium • Low
Low Risk: • High • Mad'ium • Low
Foundations: • Known • Unknown
SInictura Typa: • Bridga • BrWga Culyerl
b. Reasons (or Rating:
2. FLORIDA DOT SCOUR INDEX NUMBER
3. RECOMMENDATIONS
a. Countermeasures:
• Riprap
n Scour Monitor
• Inspection
• Other
b. Phase Two Analysis Recommended:
c. Phase Two Prtority: • High
d. Remarks:
Secondary .
• Yes
• Medium
• No
• Low
a b
FIGURE 1 Scour Evaluation Report cover sheet and Phase I qualitative evaluation Field/Office Review Report forms.
1) Abutment TMIng / Moving In: • Yes • No
2) Sk>pas Washing In / SkxighIng: • Yes • No
3) Scour Holas Near Abutmants / Bents: D Yea • No
4 ) Bad Dapotllt Oowntlraam: • Ves • No
S) Brtdg* Railing Sagging: • Yes • No
8) Oabrit: • Yes • No
7) HIglnnlar Martc • Yas • No
b. Faaslblllty d Monitoring During High Ftow
1) R o d / P e l a / W a l g h l t a f n O « l c • Y e s • No
2) Fbcad MonKoring Oavic*; • Yas • No
S C O U R EVALUATION - FIELD ( OFF ICE REVIEW REPORT
4 . S ITE F I E L D REVIEW
a. Evidenca of Scour al Structure
fc FaaalbllHy of Adding Riprap or Other Scour Countemwasuraa: • Yas • No
6. ABUTMENTS
• Spn TTirough
o -• VentealWall • Concrete Box Culvert
a Wing Walls • Seawalls
b. Foundation; Olmensk>ns (L.W.O.) (ft)
Embedment (fl)
Scour Exposure («)
• Spread Footings
• Pile Caps
• Piles
• Drilled Shaft
Source of Data: • Field Review • Design Plans • As-bullt. Drawings • Pile Driving Records • Inspection Reports • Other
c. Location from Bank: Lcn (H) RInhl (d)
• Setback
• In Channel
D At Bank
d. Prolaelkm
1) Riprap: • Sand CamanI • Rubble • Commatcial Block • • Seawall • Nona • Other
Greuted
2) Condltkxi: Good Fair Poor
Left n • • Righl 1.1 I.I •
SCOUR EVALUATION - FIELD / OFF ICE REVIEW R E P O R T
«. PIER
a. Type:
• Concrete Wall • Pile Bent 3 Column Type
b. Shape: • Square • Rounded • Sharp Nose
e. WUth: ft. Length ft
d. Foundation (worst pier)
Dlmenskms (L.W,D.) (fl)
Embedment (ft)
Scour Exposure (ft)
• Sprtad Footing
• P l laCap
• Pllat
• Difflad Shaft
Sourca of • Field Ravtaw • Design Plans • Aa-bulll Drawings Data: • Pile Driving Records • Inspeetkm Reports • Other
e. Protection
1) Riprap: • Sand Cement • Rubble • Seawall • None
D Commercial Block • None Apparent
• Grouted • Other
2) Condition: • Good • Fair • Poor
1 7. CHANNEL LATERAL STABILITY
a. Bends
1) Bridge Location: • Upstream of Bend • Downstream of Bend • In Bend
2) Migration: • Yes O No
3) Counlcrmcasuros I J Y c i 11 No Typo:
b. Bank Condition: Upstream Downstream
1) Eroding • • 2) Stable • • 3) Vegetated 1 1
4 ) Seawall D • 5) Countenneasures • Yes • No Type:
c. Angle of Attack: Fkjod F k w Normal Fkiw
d. Point Bar Under Bridge • Yes • No
a. Islands or Bars
1) Upstream: n Yes • No
2) Downstraam: CI Yes a No
FIGURE 1 (continued)

S C O U R EVALUATION - FIELD / OFFICE REVIEW REPORT SCOUR EVALUATION - FIELD / OFFICE REVIEW REPORT
I. CHANNEL V E R T I C A L STABILITY 10. OTHER CONSIDERATIONS
a. Expotad Footing: • Yes • No Q Unknown • Not Applicable a. Sediment Transport:
b. Exposed Piles: • Yes • No • Unknown • Not Applicable 1) • Live Bed Condition • Clear Water Condition • Unknown
c. Contraction Scour (Encroachment) 2) Armored Bed: • Yes a No • Unknown
1) Ovettank Flow: • Left • Right b. Watershed: • Agrkultural • Forested • Swamp • Urban
2) ReDaf Bridge: • Yes D No c. Tidal Influence: • Yes • No • Possibly
3) Roadway Over Topping: • Yes • No • Unknown • Possible d. Tidal Features: • Bay • Estuary • Inlet • Barrier Island
4 ) Bridge ( ^ r Topping: • Yes D No • Unknown • Possible 1) Normal Range (amplitude): • Flekl Observalkin • Tkle Table
d. Long Tenn 2) Observed Surface Vekxrlty: fps
1) Aggrad«8on: • Yes • No • Unknown 3) Selchbig (wind set up): • Yes • No • Possible
2) Degradadon: • Yes • No • Unknown 4 ) Distance to coast miles (along thalweg miles)
«. Bed Material 5) Traffic • Ship • Recreation • Commercial • Barge • ICW
• Sand e. Tributaries:
• Gravel • Upstream • Downstream • No Factor
• CobbiM Distance to conftuenca of next streamAwaterbody:
• Oltitr 1. Observed Stream Vek>dty: fps
g Mannings n: Channel Overbank
9. GEOMORPHOLOOY
a. Alluvial Fan: a Yes • No 11. ADDITIONAL COMMENTS
b. Dam or Reservoir. a Yes • No a. Photographs: D Bridge Number • Upstream Channel • Upstream Face
c. River Form: • Stralgtit • Meandering • Braided • Man Made • Downstream Channel • Downstream Face
d. Instream Mining/Dredging: • Yes • No
e. Headcuts or Nickpoints: • Yes D No b. Remarks:
1. Diversions: O Yes • No
9 Channel Modification: • Yes • No
h. SIreem Size: • Sman (< 100 ft) • Medium.(100 - SOOft) • Large (> 500 ft)
1. Fk>w Characteristics: • tntermitlent D Perennial • Tidal
FleU nspectors:
Dale of FleM Review: Time of FieW Review:
FIGURE 1 {continued)

LAGASSE ET AL. 243
tions, frequent seasonal inspections, or inspections made following storm events or tidal surges).
The basic forms are combined with a single page of text and selected bridge sketches to provide a standardized Phase I report on each bridge. The one-page report summary includes a summary of findings (and recommendations), the basis for the evaluation (discussion), and a listing of the materials and documentation used to develop the report. A bridge location map and plan, profile, and boring logs are also included when they are available. The bridge profile (elevation) includes an as-built streambed cross section (profile) at the bridge and, when they are available, successive cross sections taken by bridge inspectors during the standard biennial bridge inspection under the FHWA NBIS. These successive cross sections are compared with point soundings taken by lead line, pole, or sonic sounder during the Phase I field site visit and constitute a critical component of the Phase I qualitative evaluation. Both long-term aggradation or degradation trends and any recent local scour problems are generally readily apparent f rom this time-sequenced cross section comparison.
Phase II: Hydrologic and Hydraulic Assessment for Scour
Phase I I of the FDOT program is somewhat less structured than Phase I , but it follows the recommended procedures of HEC-20 (4) and HEC-18 (5). In Florida the selection of the hydraulic analysis approach requires consideration of bojrh riverine and tidal f low conditions. Phase I I analysis has three basic components: hydrology, hydraulics, and scour computations. The majority of the effort in Phase I I is in quantifying the discharge conditions (hydrology) and modeling the corresponding flow conditions at the bridge (hydraulic analysis). Given the hydraulic variables, the scour computations are relatively simple and straightforward. If the hydrologic and hydraulic analyses can be simplified without a significant loss in the accuracy of the scour results, a major cost savings wi l l be realized.
In the interests of economy, then, a simplified riverine or tidal analysis generally is considered first. For riverine flow conditions use of a very conservative estimate of discharge and a simple FHWA WSPRO (6) water surface profile model obtained by using a limited number of cross sections of the stream usually represents the simplest approach to the problem. I f these prove inadequate for the complexities of the bridge reach (e.g., complex cross sections, flow bifurcation, multiple openings, or multiple bridge crossings in the reach), then a more complex (detailed) WSPRO model wi th more refined discharge estimates must be developed or, perhaps.
a two-dimensional hydrodynamic model must be applied.
Similarly, for tidal conditions the simplified procedures presented in HEC-18 (4) (e.g., a tidal prism or constricted waterway approach) are considered first. I f these simplified techniques prove inadequate, then more complex (detailed) one- or two-dimensional unsteady flow modeling approaches are used. Regardless of the approach used to develop hydraulic parameters for the bridge reach, the equations presented in HEC-18 (4) are applied to evaluate potential scour conditions. For scour evaluations very conservative assumptions are made to support the simplified analysis techniques for both riverine and tidal conditions. Thus, if a bridge can be shown to be at low risk for scour by the simplified approaches, more complex techniques should not be required. However, if a bridge is rated marginally susceptible for scour by simplified techniques, more complex techniques wi th less conservative assumptions could refine the evaluation and could possibly result in a lower risk rating. This approach ensures that an appropriate level of effort is applied to support a quantitative scour evaluation, resulting in overall program economy. For both riverine and tidal conditions, the results of a simplified analysis provide a point of departure for a more detailed analysis i f one is necessary.
To support the simplified or detailed Phase I I quantitative analysis, a standard format has been developed. The Phase I I Field/Office Review Report is shown in Figure 2. A standard cover sheet (Figure 1) is used to summarize the scour evaluation and update the analysis f rom the Phase I rating. This is followed by several pages of text wi th the following sections:
• 1.0 Summary of Findings • 2.0 Hydrologic Analysis • 3.0 Hydraulic Analysis • 4.0 Scour Analysis • 5.0 Materials and Documentation
Typically, two figures are included in the summary section: a bridge location map and bridge profile (elevation) showing the 100-year and 500-year scour prism or the scour prism from the overtopping flood, if that puts the most stress on the bridge. Several attachments complete the report:
• Attachment A: Phase I I Field/Office Review Report (Figure 2).
• Attachment B: hydrologic calculations, • Attachment C: WSPRO (or other computer model)
input and output files, • Attachment D: scour calculations, and • Attachment E: original Phase I Scour Evaluation
Report.

Bridge 1 County: Routs: Over
1. SCOUR VULNERABILTTY RATING (PER FHWA)
a Scour Chtical
Scour Susceplibla • High • Madtum a Low
Low Risk • High • Medium • Low
Four^dltions • Known a Unknown
b Method of Anslysis • SImpllflad • Datallod
S C O U R EVALUATION - PHASE 2
FIELD ; O F F I C E REVIEW R E P O R T
c Reasonj for Rating:
2. PHASE 1 RATING
3. FLORIDA DOT S C O U R INDEX NUMBER Initial . Secondary .
4. RECOMMENDATIONS
a. Countermeasurei
• Riprap
• Scour Monitor
• Inspection
• Other
b Phase 3 Analysis
c Phase 4 Analysis
• Require)
• Requked
• Not Required
• Not Required
6. SCOUR IMPACT A S S E S S M E N T FOR DESIGN FLOOD EVENT
8.' Reported Design / Constructed Embedment
b.* Current Remaining Embedment
c. Estimated Embedment Remaining After Scour
Based on 18 Pile Driving Records
«. EVALUATION OF METHODS
a. Method of Analytia
• Simplilled • Detailed
b. Do results of analysis provide reasonable predictkjn of scour depths (or this structure?
• Yes • NO
c. If 6b is NO, perlonn Detailed Analysis.
d. If 6b Is Y E S . does the predteted scour suggest Instability of stnjcture. based on eidsting knowledge of the bridge?
• Yes (Phase 3 or Phase 4 Is recommended) • No (No further actton required)
FIGURE 2 Phase n Field/Office Review Report forms.

7. FLOOD HISTORY
a Drainage Area
b Scour Mode;
_ sq. mi.
• Riverine • Tidal • Both
Riverine Flow
Q ,„ Discharge From:
• Gage Analysis • Regression Analysis
Qo« . to . i . « Discharge From ( Yr):
• Gage Analysis • Regression Analysis
QKO Discharge From:
• Gage Analysts • Regression Analysis
Q.« • CIS Q e « ™ , « " cfs
• Ratkinal Method • Other .
• Rattonal Method • O t h e r .
• Ralkinal Method • Other _
Q « , - cfs
Tidal Flow:
0 „ , , Discharge (Tidal Flow)
Q,oo Discharge (Surge)
Q „ Discharge (Surge)
c(s • Tide Table • H E C 18 Procedure
cfs 0 Historic Data • HEC 1« Procedure
cfs a Historic Data • HEC 18 Procedure
« CHANNEL STABILITY CONSIDERATIONS
a Natural Channel Aggradationmegradatkxi Expected Over Remaining Life of Stnicture ft
D Channel Migration Anticipated During U e of SImcture
c Armoring Potential • Yes
d Depth to Armoring for Q of cfs
e Discussion:
• Left . • Right.
a. DESIGN FLOOD - S C O U R EVENT
a. Worst Case Flood Event (< 100 yr): Discharge C F S • 100 yr • overtopping Frequency YR
b. Contraclkjn Scour Left Over Bank FT Main Channel FT
Right Over Bank FT
e. Maximum Pier Scour Location at: Scour Depth FT Minimum Remaining Pile Tip / Pier Fooling
Embednwin FT
• Worst Pier • Typical Pier Maximum Approach Vakxity FPS Pier No: Bent No: Approach Froude Number
d. Abutment Scour Left Abutment FT Right Abutment FT
e. Maximum Total Scour {8a • gb • (gc or gd)) Left Abutment FT
Main Channel Pier FT FkMd Plain Pier FT Right Abutment FT
10. C H E C K FLOOD - S C O U R EVENT
a. Wbrst Case Fkxid Event ( i yr): Discharge C F S • 500 yr • overtopping Frequency YR
b. Contraction Scour Left Over Bank FT Main Channel FT
Right Over Bank FT
c. Maximum Pier Scour Location: Scour Depth FT Minimum Remaining Pile Tip / Pier Footing
Embedmeid FT
• worst Pier D Typical Pier Maximum Approach Velocity F P S Pier No: ^ Bent No: Approach Froude Number FT
d. Abutment S iAur Left Abutment FT
Channel FT Right AtMitment FT
e. Maximum Total Scour (6a * 10b * (10c or lOd)) Left Atwtment FT
Main Channel Pier FT
Flood Plain Pier FT Right Abutment FT
FIGURE 2 {continued)

246 FOURTH INTERNATIONAL BRIDGE ENGINEERING CONFERENCE
FIGURE 3 Bridge over Baker's Haulover inlet, Biscayne Bay, District 6, FDOT.
FIGURE 5 Bridge over Shad Creek, just above confluence with St. John's River, Jacksonville, District 2, FDOT.
The standardized approach to scour evaluations adopted by FDOT for both Phase I and Phase I I evaluations wi l l lend itself to development of a statewide database on bridge scour vulnerability.
RESULTS
The Phase I and Phase I I procedures outlined above have been applied to scour evaluations of a wide variety of bridges in Florida. These range f rom large bridges over aggressive tidal inlets (Figure 3) and bascule bridges over the Intracoastal Waterway (Figure 4) or small tidal waterway bridges (Figure 5) to small riverine bridges in rural northeastern Florida (see Figure 6).
FDOT has 7,948 bridges in the inventory, wi th 4,395 bridges in the federal aid program and 3,553 not in the
federal aid program. As of March 1994 preliminary scour screening resulted in the ratings shown in Table 1. Table 2 provides a more detailed summary of results of Phase I scour evaluations for a small population of bridges in District 2 (Lake City/Jacksonville), District 6 (Miami/Florida Keys), and District 7 (Tampa Bay). Thus, a wide range of tidal, riverine, urban, and rural conditions are represented by the bridges in this sample (Figures 3 to 6). It should be noted that these bridges do not represent a random sample. Most districts in FDOT have chosen to focus on bridges that were considered potentially scour susceptible on the basis of a very preliminary screening by FDOT that primarily used office records (Table 1). As would be expected in
FIGURE 4 Bascule bridge over Intracoastal Waterway, Indian Rocks, District 7, FDOT.
FIGURE 6 U.S. Highway 17 Bridge over Unnamed Tributary to Lofton Creek, Nassau County, District 2, FDOT.

LAGASSE ET AL. 247
TABLE 1 FDOT Preliminary Bridge Scour Screening
Category Federal Aid Non-Federal Aid Total
Scour-Susceptible 2,377 2,006 4 ,383
Low Risk 1,539 726 2,265
Florida many of the bridges are tidal or tidally influenced (Table 2). Although no bridges in this small population were scour critical, 61 percent were considered scour susceptible wi th either a high, a medium, or a low priority, and a Phase I I quantitative analysis was recommended for almost all of these bridges. Exceptions were bridges on which remedial actions or replacement planning was under way.
It is significant that 49 percent of the bridges in this group were found to have unknown foundations; that is, after the office and field reviews it was uncertain what the structural foundation condition was or what the pile lengths were for pile-supported foundations. This is not a problem unique to Florida. As of February 1995, of the 481,708 bridges over water in the NBIS, 22 percent had unknown foundations. Consequently, FHWA has removed the requirement for in-depth scour evaluations to be completed by January 1997 for structures except Interstate bridges with unknown foundations (unknown pile tips). The bridges to which this exemption applies are to be monitored until such time as technology becomes available to determine foundation conditions in situ.
The approach is consistent wi th FHWA procedures presented in HEC-18 (4) and HEC-20 (5) and provides meaningful results on which to base decisions for monitoring, the use of countermeasures, or replacement for scour-susceptible bridges. Since all FDOT bridges wi l l be evaluated by the procedures highlighted here, a consistent database on bridge scour vulnerability w i l l be developed for all bridges in Florida.
The Phase I forms ensure that numerous qualitative geomorphic factors, related primarily to stream instability concerns, are considered in the evaluation. The Phase I evaluations, including office and field review for each bridge, were estimated to require a level of effort of about 40 hr for an average bridge, and the results of the first group of Phase I evaluations support this estimate.
The approach to Phase I I evaluations adopted by FDOT, which considers, first, a simplified tidal or riverine scour analysis before proceeding to more detailed or complex computational techniques, should result in significant cost savings for the statewide scour evaluation program. As of this writing, simplified techniques have been satisfactory for most of the bridges requiring a Phase I I scour analysis.
CONCLUSIONS
To meet the requirements of FHWA Technical Advisory 5140.23 for bridge scour evaluations, FDOT has adopted a four-phase approach. Although a numerical rating scheme could be developed. Phase I of the FDOT procedure is intended to be a qualitative evaluation based heavily on experience and engineering judgment.
REFERENCES
1. Lagasse, P. P., E. V. Richardson, and N . Jetha. Implementation of the NBIS Scour Evaluation Program, District 2, Florida. Proc, 1993 Hydraulic Engineering Specialty Conference, ASCE, New York, N.Y., 1993.
2. Evaluating Scour at Bridges. Technical Advisory 5140.23. FHWA, U.S. Department of Transportation, 1991.
TABLE 2 Phase I Scour Evaluation Results for 330 Bridges in Florida
Riverine Tidal Riverine/ Tidal Total Scour
Critical Scour
Susceptible Low Known Risk Foundation
Unknown Foundation
Phase II Recommended
District 2 (Lake City/
Jacksonville!
7 6 3 4 1 4 124 0 7 0 5 4 7 2 52 7 0
District 6 (Miami/
Florida Keys
0 2 7 4 31 0 2 8 3 4 2 7 2 8
District 7 (Tampa Bay)
7 3 71 31 175 0 1 0 2 7 3 9 2 8 3 1 0 2
Total 1 4 9 1 3 2 4 9 3 3 0 0 2 0 0 1 3 0 1 6 8 1 6 2 2 0 0
Percent (%) 4 5 4 0 1 5 61 3 9 51 4 9 61

248 FOURTH INTERNATIONAL BRIDGE ENGINEERING CONFERENCE
3. Guidelines for Scour Evaluation Studies. Tallahassee, Florida Department of Transportation, 1991.
4. Richardson, E. V., L. J. Harrison, J. R. Richardson, and S. R. Davis. Evaluating Scour at Bridges. FHWA Report No. FHWA-IP-90-017, Hydraulic Engineering Circular 18. Office of Research and Development, McLean, Va., 1993.
5. Lagasse, P. P., J. D. Schall, F. Johnson, E. V. Richardson,
J. R. Richardson, and F. Chang. Stream Stability at Highway Structures. FHWA Report FHWA-IP-90-014, Hydraulic Engineering Circular 20. Office of Research and Development, McLean, Va., 1991.
6. Shearman, J. O. Bridge Waterways Analysis Model for Mainframe and Microcomputers. WSPRO/HY-7. FHWA, U.S. Department of Transportation, 1987.