Embed Size (px)
Citation preview

Florida Department of HealthHIV/AIDS and Hepatitis Section
Division of Disease Control and Health Protection
Annual data trends as of 12/31/2012Living (Prevalence) data as of 06/30/2013
Epidemiology of HIV Among American Indians
Reported in Florida,Through 2012
Created: 04/11/13
Revision: 09/20/13
To protect, promote and improve the health of all people in Florida through integrated state, county, and community efforts.

HIV and AIDS Case Data Adult cases represent ages 13 and older, pediatric
cases are those under the age of 13. For data by year, the age is by age of diagnosis. For living data, the age is by current age at the end of the most recent calendar year, regardless of age at diagnosis.
Unless otherwise noted, whites are non-Hispanic and blacks are non-Hispanic.
Total statewide data will include Department of Correction Cases (DOC) unless otherwise noted. County data will exclude DOC cases.
HIV prevalence data are generated later in the year, usually in May, when most of the “expected” death data are complete.
Data for American Indians include Alaskan Natives.
Selected slides from the Florida HIV Trends Slide Set, see site below for entire set. http://www.doh.state.fl.us/disease_ctrl/aids/trends/slides/slides.html

39%
17%
44%AI-only
Black
Hispanic
Multi-Race
AIDSN=262
HIV (not AIDS)N=132
16%
59%
25%
Note: The majority of American Indian AIDS and HIV cases have a mixed racial/ethnic background. *Includes one pediatric AIDS case (<13 yrs of age).
All* HIV and AIDS Cases Among American Indians,
by Racial/Ethnic BackgroundReported through 2012, Florida

Country of Birth # %
United States 308 78%
Guatemala 10 3%
Haiti 8 2%
Mexico 7 2%
Unknow n/Other 61 15%
TOTAL 394 100%
HIV Disease Cases Among American Indians, by Select Country of Birth,
Reported through 2012, Florida

Adult HIV Infection Cases Among American Indians,
By Year of Report, 1987*- 2012, Florida
05
10152025303540
Year of Report
Nu
mb
er
of
Ca
se
s
*The first case of HIV Infection among American Indians was reported in 1987.Enhanced reporting laws were implemented in Nov. 2006, and the expansion of electronic lab reporting in 2007 led to an artificial peak in HIV cases in 2007 and 2008 followed by an artificial decrease in 2009.

Adult AIDS Cases Among American Indians,
By Year of Report, 1987*- 2012, Florida
0
5
10
15
20
Year of Report
Nu
mb
er o
f C
ases
*The first case of AIDS among American Indians was reported in 1987.**The AIDS surveillance case definition was expanded for adults/adolescents in 1993.Enhanced reporting laws were implemented in Nov. 2006, and the expansion of electronic lab reporting in 2007 led to an artificial peak in HIV cases in 2007 and 2008 followed by an artificial decrease in 2009.
Adult HIV and AIDS Cases Among American Indians, by Sex,
Reported through 2012, Florida
73%
27%
Male
Female
AIDS CasesN=261
HIV (not AIDS) Cases N=132
25%
75%
Note: HIV cases represent more recent infections, thus these data suggest that the proportionof female to male cases among American Indian reported in Florida is increasing over time.

AIDSN=261
5
32
20
12
32
0
5
10
15
20
25
30
35
13-19 20-29 30-39 40-49 50+
Perc
en
t o
f C
ases
0
37
31
1714
0
5
10
15
20
25
30
35
40
13-19 20-29 30-39 40-49 50+
Per
cen
t o
f C
ases
HIV (not AIDS)N=132
Note: HIV cases tend to be younger than AIDS cases. HIV cases tend to reflect more recent transmission than AIDS cases, and thus present a more current picture of the epidemic. Recent estimates show that 32% of HIV (not AIDS) cases occur among those aged 20-29 and 30-39 (respectively for both), whereas 37% of AIDS cases occur among those aged 30-39.
Adult HIV and AIDS Cases Among American Indians,
by Age at Diagnosis,Reported through 2012, Florida
020406080100120140160180200
95 96 97 98 99 00 01 02 03 04 05 06 07 08 09 10 11 12
Year
Nu
mb
er o
f C
ases
Male Female
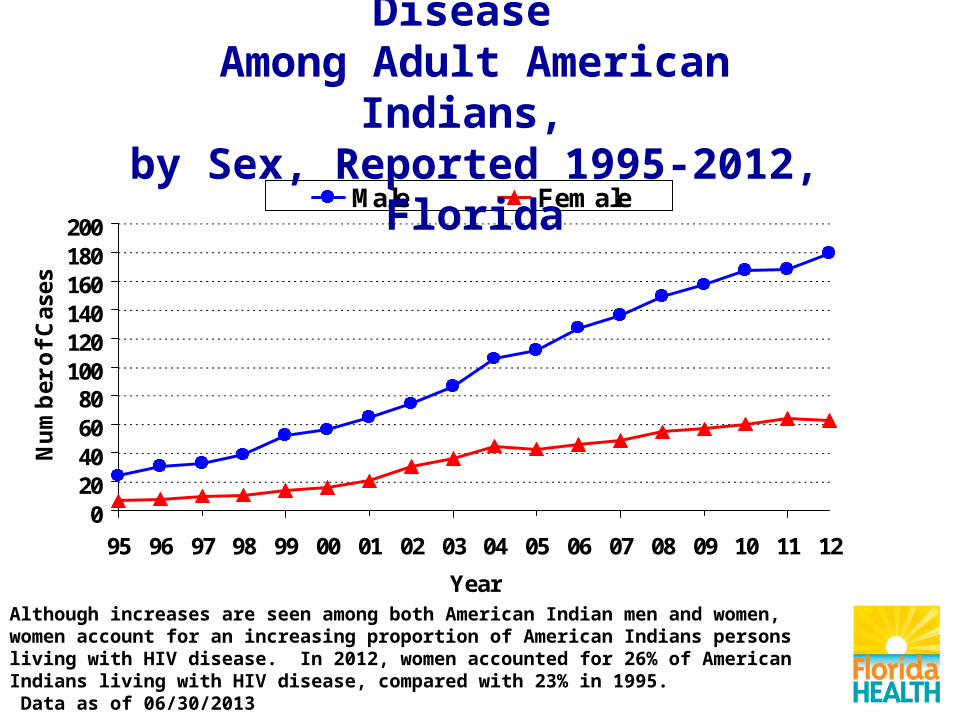
Annual Prevalence of HIV Disease Among Adult American Indians,
by Sex, Reported 1995-2012, Florida
Although increases are seen among both American Indian men and women, women account for an increasing proportion of American Indians persons living with HIV disease. In 2012, women accounted for 26% of American Indians living with HIV disease, compared with 23% in 1995. Data as of 06/30/2013

Definitions of Mode of Exposure Categories
MSM = Men who have sex with men IDU = Injection Drug Use MSM/IDU = Men who have sex with men & Injection Drug Use Heterosexual = Heterosexual contact with person with HIV/AIDS or
known HIV risk OTHER = includes hemophilia, transfusion, perinatal and other
pediatric risks and other confirmed risks. NIR = Cases reported with No Identified Risk Redistribution of NIRs = This illustrates the effect of statistically
assigning (redistributing) the NIRs to recognized exposure (risk) categories by applying the proportions of historically reclassified NIRs to the unresolved NIRs.

Mode of Transmission Among American Indians, Living with HIV
in the US* compared to Florida
Among American Indian males living with HIV, Florida has a higher percent of transmission by way of both heterosexual and MSM risk, but a lower percent of transmission by way of IDU and MSM/IDU risk compared to the US. Among American Indian females living with HIV, Florida has a lower percent of transmission by way of IDU risk but a higher percent of transmission by way of heterosexual risk than that for the US.*U.S. data: HIV Surveillance Report, 2011 (most recent available) Vol. 23, Table 17a
FLthrough
2012
MSM 65% 70% ----- -----IDU 11% 5% 32% 27%MSM/IDU 16% 9% ----- -----Heterosexual 7% 15% 65% 73%Other 1% 1% 3% 0%
Males Females
US through
2010
US through
2010
FL through
2012

27%
73%
70%
15%9%
5%1%
MSM
IDU
MSM/IDU
Heterosexual
Other
MalesN=179
FemalesN=63
Adult American Indians Living with HIV Disease
By Mode of Exposure and SexReported through 2012, Florida
Note: NIRs are redistributed. MSM is the primary risk among males (70%), followed by heterosexual risk (15%). Heterosexual contact is the primary risk among females (73%) followed by IDU (27%).

Median Survival Time (in months) from AIDS Diagnosis to Death,
by Race/Ethnicity and Time Period of Death, 1980-2012, Florida
Note: In the early years, survival times for increased for all race/ethnicity groups with the introduction of AZT in 1994. With the introduction of Highly Active Retroviral Therapy (HAART) in 1996, survival time increased significantly for all age groups, however, overall survival times are not without racial/ethnic disparities.
*Source: Florida Department of Health, Bureau of Communicable Diseases, HIV/AIDS Reporting System (as of 06/30/2013)
1980-1988 1989-1995 1996-2000 2001-2006 2007-2012
White 4 mo. 15 mo. 32 mo. 60 mo. 83 mo.
Black 1 mo. 10 mo. 22 mo. 42 mo. 60 mo.
Hispanic 3 mo. 12 mo. 23 mo. 45 mo. 60 mo.
Amer. Ind. n/a 14 mo. 21 mo. 28 mo. 79 mo.
Asian 1 mo. 13 mo. 24 mo. 21 mo. 28 mo.
Early Years
Time Period of DeathHAART

For Florida HIV/AIDS Surveillance DataContact: (850) 245-4444
Lorene Maddox, MPH Ext. 2613 Tracina Bush, BSW Ext. 2612 Madgene Moise, MPH Ext. 2373
Visit Florida’s internet site for:Monthly Surveillance Reports
Slide Sets and Fact SheetsAnnual Reports and Epi Profiles
http://www.doh.state.fl.us/disease_ctrl/aids/trends/trends.html
Visit CDC’s HIV/AIDS internet site for:Surveillance Reports, fact sheets and slide sets
http://www.cdc.gov/hiv/topics/surveillance/resources/reports/index.htm