Embed Size (px)
Citation preview

Florida Department of Health
2008FloridaPhysicianWorkforceAnnual Report
In Response to the Provisions of Section 381.4018,Florida Statutes
November 1, 2008Florida Department of Health • 4052 Bald Cypress Way, Bin C15 • Tallahassee, FL 32399-1735

Ana M. Viamonte Ros, M.D., M.P.H., State Surgeon General November 1, 2008Charlie Crist, Governor
To: The Honorable Charlie Crist The Honorable Ken Pruitt, Senate President The Honorable Marco Rubio, House Speaker
In 2007, the Florida Legislature sought to adequately assess Florida’sphysician workforce and its impact on accessing quality care. In Senate Bill 770,authority was given to the department to create a physician workforce forecasting model, to develop andmaintain a physician workforce data repository and to create a strategic plan that would incorporate keyimpact areas as they relate to physician workforce development. Building upon the momentum andforesight of esteemed members of the Florida House and Senate, I am proud to present thiscollaborative and comprehensive evaluation of Florida’s physician workforce.
The Physician Workforce Survey was an important step towards collecting valid, reliable andcontinuous information, and will help serve policymakers and state leaders in addressing a number ofimportant health access and quality of care issues. Yet, as a state, there is still much that can be done tosupport our diverse population’s healthcare needs and long-term planning. In 2008, a HealthPractitioner Workforce Ad Hoc Advisory Committee was appointed to conceptualize a strategic planfocused on three main target areas that influence the physician workforce in Florida: medical schools,graduate medical education (residency) and attracting and retaining physicians to practice in the state.The tireless efforts of this committee, and of the stakeholders at large, have propelled this projectforward. The Council of Medical School Deans, the Florida Medical Association and FloridaOsteopathic Medical Association, the Boards of Allopathic and Osteopathic Medicine, the members ofthe Graduate Medical Education Committee, the Florida Hospital Association, the Florida JusticeAssociation and many others have come to the table with unrelenting and genuine interest in improvingthe quality and access to healthcare for Floridians by improving our ability to understand and forecastthe physician workforce in the state.
As the State Surgeon General and Chairperson of this group, I would also like to thank the House andSenate committee staff, as well as my own department staff, including Deputy Secretary KimberlyBerfield and Program Administrator Jessica Swanson, whose guidance and tireless efforts brought SB770 to fruition. Additionally, I would like to acknowledge the leadership of Governor Crist, whosecommitment to healthcare and providing for the citizens of the State is a testament to his compassionand stewardship. I have the utmost respect for his vision for Florida, and feel that through thisworkforce project and beyond we will make great strides in making that vision a reality.
Thank you for allowing me, the other members of the Health Practitioner Workforce Ad Hoc AdvisoryCommittee and all the governmental and non governmental stakeholders supporting this endeavor theopportunity to participate in this groundbreaking project.
Sincerely,Ana M. Viamonte Ros, M.D., M.P.H.Chairperson, Healthcare Practitioner Ad Hoc CommitteeState Surgeon General, Florida Department of Health
2

Table of ContentsPreface . . . . . . . . . . . . . . . . . . . . . . . . . . . . . . . . . . . . . . . . . . .4
Acknowledgements . . . . . . . . . . . . . . . . . . . . . . . . . . . . . . . . . .4
Executive Summary . . . . . . . . . . . . . . . . . . . . . . . . . . . . . . . . . .5
Introduction . . . . . . . . . . . . . . . . . . . . . . . . . . . . . . . . . . . . . . . .7
Overview and History of Physician Workforce Assessmentand Development . . . . . . . . . . . . . . . . . . . . . . . . . . . . . . . . . . .7
Department of Health Implementation of CS/CS/SB 770 . . . . .12
Data Analysis and Reporting . . . . . . . . . . . . . . . . . . . . . . . . . . . .15
Physician Workforce Survey: Key Findings and Limitations . . . . . .15
Discussion and Preliminary Healthcare Practitioner Ad HocCommittee Recommendations . . . . . . . . . . . . . . . . . . . . . . . . .33
Appendix I—2006 Voluntary Physician Workforce Survey . . . . .35
Appendix II—Chapter 64B-9.002 . . . . . . . . . . . . . . . . . . . . . .36
Appendix III—2007 Mandatory Physician Workforce Survey . . .37
Appendix IV—2008 Mandatory Physician Workforce Survey . . .39
3

PrefacePursuant to CS/CS/SB 770, codified in Section 381.4018, Florida Statutes(F.S.), the Department of Health is responsible for preparing an annualreport on the physician workforce in Florida. This annual report is provided to theGovernor, the President of the Senate, and to the Speaker of the House of Representatives on November1st of each year. The report must address the following:
a) Analysis of the Physician Workforce Survey, determining by geographic area andspecialty the number of physicians who:a. Perform deliveries of children in Florida.b. Read mammograms and perform breast-imaging-guided procedures in Florida.c. Perform emergency care on an on-call basis for a hospital emergency department.d. Plan to reduce or increase emergency on-call hours in a hospital emergency department.e. Plan to relocate their allopathic or osteopathic practice outside the state.
AcknowledgmentsThe Department of Health extends a sincere thank you to those who give so generously of their time andtalents to ensure the success of physician workforce planning in Florida.
Healthcare Practitioner Ad Hoc Committee:E. Douglas Beach, Ph.D., Secretary, Department of Elder Affairs
Mathis L. Becker, M.D., Director Professional Relations, University of South Florida College of Medicine, Chair,Graduate Medical Education Committee
Robert G. Brooks, M.D, Associate Dean for Health Affairs Florida State University College of Medicine
Diane Davis Davey, M.D., Assistant Dean, Graduate Medical Ed./Prof., Pathology, Faculty and Academic AffairsUniversity of Central Florida
Liz Dudek, Deputy Secretary, Agency for Health Care Administration
Timothy C. Flynn, M.D., Associate Dean of Graduate Medical Education, University of Florida College of Medicine
Arthur Fournier, M.D., Professor of Family Medicine/Associate Dean for Community Health, University of MiamiCollege of Medicine, Director UM AHEC Program
Pascal J. Goldschmidt, M.D., Dean, University of Miami College of Medicine
Representative Ed Homan, M.D., Florida House of Representatives
Richard E. LeMon, Ph.D., Board of Governors
David Moorhead, M.D., Florida Hospital
Jennifer Roberts, Florida Department of Education
Barbara Lea Sharp, M.D., Mori, Bean & Brooks Radiology, P.A.
Anthony Silvagni, D.O., Dean, Nova Southeastern University College of Osteopathic Medicine
George A. W. Smith, M.D., Escambia Community Clinic
Kim Streit, Vice President of Health Care Research and Information, Florida Hospital Association
Fernando Valverde, M.D., Assistant Dean, Florida International University College of Medicine
Claude Earl Fox, M.D., M.P.H., Director, Florida Public Health Institute
Participating Experts:Ronald Hytoff, M.H.A., President and Chief Executive Officer, Tampa General Hospital
John Curran, M.D., Associate Dean of Academic Affairs, University of South Florida, College of Medicine
Joseph Allgeier, D.O., Director of Family Practice Residency Program Florida Hospital East
Joseph DeGaetano, D.O., MS.Ed, Assistant Dean for Clinical Curriculum/GME, NSUCOM
Peter J. (Jeff) Fabri, M.D., Associate Dean, Graduate Medical Education, University of South Florida
Ms. Terry Meek, Executive Director, Council of Florida Medical School Deans
Robert Watson, M.D., Adjunct Professor of Clinical Services, Florida State University College of Medicine
Laurence Gardner, M.D., Executive Dean for Education & Policy, Office of the Executive Dean for Education &Policy, University of Miami Miller College of Medicine
4

Executive SummaryThe assessment and development of Florida’s physician workforce came tofruition under the leadership of Governor Crist and the Florida House andSenate with the passage of CS/CS/SB 770 in 2007. The Florida legislature directed theFlorida Department of Health (Department) to undertake a comprehensive and inclusive physicianworkforce planning project that would be the essential component in determining if there was anadequate and appropriate supply of well-trained physicians to meet the state’s current and futurehealthcare needs. The Department was tasked, within existing resources and with the inclusion ofinterested governmental and non governmental stakeholders, to focus on key items as part of thislegislation, including:
� Developing a model and quantifying the adequacy of the state’s current and future physician workforce;
� Developing and recommending strategies and long-term strategic planning focused on medical schooleducation, graduate medical education (residency) and attracting and retaining physicians in Florida;
� Coordinating and enhancing existing physician workforce activities;
� Developing and implementing a mandatory physician workforce survey to assess the geographicdistribution and specialty mix of Florida physicians; and
� The Department must report the Physician Workforce Survey findings to the Governor, the Presidentof the Senate, and the Speaker of the House of Representatives by November 1st of each year.
In response to the principal tasks, the State Surgeon General created aHealthcare Practitioner Ad Hoc Committee which would provide theFlorida Department of Health with expertise and guidance on technical andprogrammatic areas. The Ad Hoc Committee has met during a series of conference calls and face-to-face meetings during the past year to create survey questions, to discuss analysis of survey data and toengage in the development of an inclusive and comprehensive strategic plan.
The Healthcare Practitioner Ad Hoc Committee’s accomplishments are considerable, and include:
� The modification of the Physician Workforce Survey to expand on key impact areas, such as emergencyon-call issues and projected changes to a physician’s scope of practice. The group also worked withresponse categories to make them mutually exclusive and exhaustive;
� Data analysis of the survey, including an extensive review of lifestyle and demographic issues as theyimpact the workforce;
� Providing technical and programmatic expertise to Department staff in implementing legislation;
� Collaborating on issues and strategic planning items as they impact Florida’s physician workforce, to bereported in the Physician Workforce Strategic Plan in early 2009; and
� Consensus on key recommendations that the group would present to the Governor, State SurgeonGeneral, Florida Legislature and other interested state policymakers and leaders.
The Department has also produced the first Physician Workforce AnnualReport. This report is structured to provide an overview and history ofstatewide physician workforce efforts, discuss the progress on implementingCS/CS/SB 770, present the development of the next physician workforcesurvey, and finally to present the data from the 2008 physician workforcesurvey. The data analysis of the Physician Workforce Survey will be showcased as a snapshot in time ofFlorida’s active, licensed physician workforce based on the 2008 Physician Workforce Survey. Thissurvey is incorporated into Florida Administrative Code Chapter 64B-9.002, and is included as part ofthe online and paper physician licensure renewal process. This self-reported data represents 30,492
5

physicians who completed the survey as part of their licensure renewal cycle, including all osteopathic,and one-half of allopathic, physicians renewing their license this year.
A summary of findings from the Physician Workforce Survey and demographic information collected aspart of the Practitioner Profile include:
� Of the half of allopathic (n= 25,850, and all osteopathic (n=4,839), physicians that renewed theirmedical licenses, 99% (n= 30,492) responded to the survey.
� There were a total of 25, 654 allopathic and 4,838 osteopathic physicians completing the survey, butonly 71% ( 21,610) of the total indicated they were practicing in Florida and had an active practiceaddress.
� Of those 21,610 physicians currently practicing in Florida and with an active practice address, 76.9%(n=16,595) were male.
� Of those 21,610 physicians responding to the survey, 78% (n=13,912) indicated that they werewhite/non Hispanic
� Physicians aged 25–45 years (n= 7,738) made up only 36% of the current workforce in Florida
� Thirteen percent (n=2,765) of respondents indicate they will change the scope of their practice(significantly reduce or leave practice) in the next 5 years.
� Of those 21,610 physicians responding to the survey, the top 4 specialties indicated were FamilyMedicine (15%; n= 3,125), Internal Medicine (13%; n=2,707), Medical Specialties (13%; n= 2,690) andSurgical Specialties (12%; n= 2,557).
� Only 31% (n= 6,758) of the respondents indicate they take emergency calls or work in an emergencydepartment.
Of the 31% taking emergency call or working in an emergency department, 78% (n=5,208) were specialty on-call and 22% (n= 1,431) were full-time emergency.
� Of those taking emergency on-call hours, 11% (n= 567) have reduced the number of hours in the lasttwo years.
� In the next two years, of the radiologists who responded that they currently read mammograms or otherbreast imaging exams (n= 97) almost 18% indicated that they will decrease or discontinue performingthe procedures.
� Only 40% (n= 554) of those respondents practicing obstetric care indicated they deliver babies.
� Over 14% (n= 80) of respondents who provide obstetrics services indicated they will discontinueproviding obstetric care in the next two years.
6

IntroductionThis report will discuss:� The history and progress of healthcare workforce issues in Florida over the past decade;
� The directives and status of the components in CS/CS/SB 770;
� The inception, development, and modification of Florida’s Physician Workforce Survey;
� Initial findings from the 2008 physician workforce survey; and
� Development of a framework for physician workforce strategic planning.
Overview and History of Physician WorkforceAssessment and Development in Florida
On a state and national level the question of how best to assess physicianworkforce has been debated for years. Many stakeholders and experts in the field agreethat any physician workforce planning has a multi-tiered focus, requiring an assessment of need andidentified gaps throughout the process. Physician workforce forecasting relies upon a multitude ofvariables, such as state gross product, diversity of socioeconomic indicators and the diversity of race andage, and other factors that create a formula which predicts shortages or surpluses in the physicianworkforce. Physician workforce forecasting allows policymakers and healthcare leaders to strategicallyplan, implement policy and fund programs that support targeted areas that will impact the timely accessto care. While the State of Florida is currently in a position to create a forecasting model and participatein advanced workforce planning, the data required to do so have not always been available. For over adecade lawmakers and stakeholders have considered proposals and studies related to physicianworkforce in an effort to define and discuss the various factors that contribute to the medical educationsystem and physician workforce planning.
In 1999, General Appropriations Act allocated funds to Florida State University and the Chancellor ofthe State University System to sponsor an independent study of Florida’s medical education system.MGT of America, Inc. (MGT) was commissioned to produce An Assessment of the Adequacy andCapacity of Florida’s Medical Education System, which discussed the general aspects of medicaleducation in Florida and the overall strategies and impacts of expanding capacity. The report includesinformation on:
� The future United States and Florida specific demand and supply of physicians,
� An overview and assessment of medical education in the United States and in Florida,
� Strategies for expanding the capacity of Florida’s medical education system,
� Criteria of evaluating strategies,
� Assessment of the impact of each strategy on accreditation, access for under-represented populations,and the supply and distribution of physicians in Florida,
� Impact of the cost of each strategy,
� Time to implement strategies, and
� The access to medical education for Florida residents.
7

The assessment in this study focused on a particular model to forecastphysician workforce aimed at replacing physicians leaving practice. The studyfound that increased demand for health care results from an increased ability of the people to purchasehealth care services and from the aging of the population. The study impacted future evaluations of themedical education pipeline in Florida and the ability to focus and create policy to support thedevelopment of the state’s physician workforce.
An Assessment of the Adequacy and Capacity of Florida’s Medical Education System also recommended:
� Ensuring access to medical education by under-represented populations including those fromunderserved rural and urban areas;
� Increasing the production of primary care physicians who understand the unique medical needs ofFlorida’s elders;
� Assessing the implications of expanding the current Florida State University-University of FloridaProgram in Medical Sciences (PIMS) and adding other PIMS-like programs elsewhere in the state;
� Addressing accreditation-related concerns; and
� Delineating the funding and time required to achieve each programmatic recommendation.
In June of 2000, following the medical education system assessmentdocument, HB 1121 passed and the Florida Legislature, in a direct effort tobe responsive to community needs and the changes in Florida’s population,granted approval to Florida State University (FSU) to create the FSUCollege of Medicine. The FSU College of Medicine was the first in Florida since 1979, and thefirst in the country in over two decades. HB 1121, became Chapter 2000-303, Laws of Florida andaddresses the impact of having 67 regions in the state identified as rural communities coupled with thechanging demands of a growing and aging population on the demand for more physicians. The FSUCollege of Medicine’s focus became recruiting and training medical students in primary care, geriatriccare, and rural medicine.
Medical education stakeholders continued discussion about the medical education continuum and whatwould have to be done in addition to expanding medical school capacity. While new or expandedmedical school positions theoretically offered hundreds of qualified university applicants the opportunityto gain admission to a medical school, there was more that needed to be addressed, including premedical education, ensuring adequate first year residency positions for graduating Florida medicalstudents, exploring expanded residency capacity and addressing incentives to attract and retainphysicians to practice in the state. Ultimately, there needed to be an comprehensive approach toevaluating the supply and demand of physician’s to meet Florida’s health care needs, an approach thataddressed not just the pipeline into medical practice, but the role of the practice climate on active,licensed physicians by geographic distribution and specialty mix.
The Florida Senate Interim Project Report 2004-164, Review of Data on Physician Availability andPatient Access to Physician Services addressed inquiries on medical malpractice and the inadequacy ofany official state-level data repository on physician practice or services raised during the 2003 legislativesession. It was noted specifically in this report that “These data inadequacies also hinder the State’shealth workforce planning and education efforts.” The report made nine recommendations, whichincluded:
� There are several inconsistencies in the law relating to procedures for practitioner profiling whichshould be corrected.
� Data collected as part of practitioner profiles should be expanded to require physician applicants to:
Identify any other address at which the physician conducts his or her practice;
Indicate the percentage of time the physician practices in a board-certified specialty, if the physician is a board-certified specialist;
8

Indicate the practice area to which the physician limits his or her practice, if the physician is not a board-certified specialist;
Indicate the type of practice settings in which the physician practices;
Indicate whether the physician has retired and is not actively practicing his or her profession;
Indicate the number of hours per week in which the physician actively practices, if the physician is in activepractice fewer than 40 hours per week;
Indicate the method by which the physician is in compliance with the financial responsibility requirements,including the type of coverage obtained, the amount of coverage maintained, and the name of the coverageprovider, if applicable.
� Require initial licensure and licensure renewal applications for physicians to be submitted electronicallythrough the Internet to facilitate the development of a statewide source of data on physician workforcesupply.
� Require practitioners to electronically submit, through the Internet, an update of information requiredfor the practitioner profiles, to facilitate the development of a statewide source of data on physicianworkforce supply.
� Encourage the department and the appropriate boards over physicians, as specific data needs areidentified, to collaborate and work with stakeholders to make revisions to the procedures andinformation gathered during licensure and other regulatory activities to improve the use and sorting ofdata for the purpose of physician workforce supply planning.
In 2004, SB 1154 introduced by the Senate Appropriations Subcommitteeon Health and Human Services and Senator Peaden, and HB 1075, byRepresentative Sullivan creating a Healthcare Practitioner WorkforceDatabase was proposed. This legislation established the Florida Health Care Practitionerdatabase, a central repository for continuous, reliable workforce information on 35 licensed healthprofessions licensed under the DOH, Division of Medical Quality Assurance, which would be used tomake informed programmatic and fiscal policy. Changes to the collection and update of licensureinformation were also included, with the overall intent to provide a streamlined licensure process andavailability of a comprehensive data set. While SB 1154 and HB 1075 were ultimately not passed by the2004 Legislature, these bills served to reinforce the concept that valid, ongoing information was essentialto serve as a basis for informed healthcare policy and health practitioner workforce development inFlorida.
The Board of Governors requested in March 2004 that the Council for Education Policy, Research andImprovement (CEPRI) “define the parameters of a model to be used to quantify the adequacy of theState’s physician workforce; project the extent to which a physician shortage exists and to developcost/benefit estimates of various alternatives to produce the required number of additional physiciansincluding but not limited to: expanding the capacity of existing medical schools, creating new medicalschools, expanding or creating new residency programs, and other incentive programs to attractphysicians to Florida.”
In November 2004, the Medical Education Needs Analysis was released by CEPRI. The CEPRI reportremains a valuable document both with respect to identification of factors that can be used in physicianforecasting and in the important discussion and policy recommendations regarding the development ofFlorida’s physician workforce.
The report reiterates the lack of available data and questions the reliability or quality of existing data.However, parameters of a model are identified that could be used to create a means to forecast physicianworkforce. These supply and demand factors include:
� Demographics that focus on various features related to the overall physician population;
� Physician practice status;
� Specialty of physicians;
9

� Place of education and training of physicians;
� Quality of care and safety of practice (related to a concern over the large number of InternationalMedical Graduates that Florida imports to meet its healthcare needs);
� Service delivery concerns, related largely to the effect of environmental restraints on service deliveryand practice climate (malpractice insurance costs and geographic distribution of physicians);
� Generational changes;
� Public perception;
� Population growth;
� Economic indicators; and
� The “Pipeline” into Medical Education (pre medical education, medical education and graduatemedical education).
The policy recommendations made in the CEPRI report include:
� The Legislature should enact the Florida Health Care Practitioner Workforce Database, as outlined inHouse Bill 1075 and Senate Bill 1154 from the 2004 Legislative Session. The database would serve as theofficial statewide source of valid, objective and reliable data on the physician workforce.
� As more reliable data becomes available, state policymakers should develop a model to quantify theadequacy of the state’s physician workforce, taking into account the following factors: demographics,physician practice status, specialty, place of education and training, quality of care and safety of practice,service delivery conditions, generational changes, public perception, population growth, economicindicators, and issues of the “pipeline” into medical education.
� To address the immediate and/or impending physician shortage in the state, the State of Florida shouldfirst pursue a policy of creating and expanding medical residency positions in the state.
� Given the federal funding limitations on the expansion and creation of residency positions, theLegislature should provide direct state funding for the residency positions at a rate no less than half ofthe average estimated direct cost for residency training. Funding for residency positions should betargeted to areas of on-going critical need to the state.
� The Legislature should provide funding to the Florida Health Service Corps (381.0302, F.S.) and theMedical Education Reimbursement and Loan Repayment Program (1009.65, F.S.) as a means toimmediately provide physicians to critically underserved areas.
� The expansion of medical school capacity should be pursued only after policies to immediately addressa physician shortage have been implemented (increasing residency positions and funding scholarship andloan forgiveness programs).
� When expansion of medical school capacity is pursued, the option of expanding existing medical schoolcapacity, establishing regional partnerships, and establishing new medical schools should be prioritizedbased on cost-efficiency.
The CEPRI report kept physician workforce issues on the radar ofstakeholders and policymakers alike. With the documented need to collect additional dataon active Florida physicians to address the current and future needs of the state, policymakers pushedforward with solutions to the perceived workforce shortage. The state addressed areas of medical schoolcapacity when the University of Central Florida (UCF) and the Florida International University (FIU)submitted proposals to the Florida Board of Governors to establish Doctor of Medicine DegreePrograms in 2005 and the Graduate Medical Education Committee focused on the need to expand orcreate new capacity in residency programs across the state.
At this time, The Florida Senate Committee on Health Care was again evaluating physician licensure andthe impact to physician workforce. Senate Interim Project Report 2006-136, Review of Medical andOsteopathic Physician Licensure was published in October 2005. This was pursuant to Interim ProjectReport 2004-164 mentioned previously, and again addressed the need for a statewide reliable database.The practice environment in the state and the potential impact to licensed physicians was discussed, as
10

were the procedures for physician licensure and renewal. Licensure trends were identified in newapplicants and current number of medical physicians active licenses. The information submitted as partof the initial licensure and licensure renewal process was again identified as a potential source of datathat would establish a repository of information. The report recommended, in part, that:
� The Department of Health, Division of Health Access and Tobacco, should be funded and charged tomonitor, evaluate and report on the supply and distribution of physicians using data that is already beingcollected. At a minimum, the division should develop a strategy to track and analyze, on an ongoingbasis, the distribution of Florida-licensed physician by specialty and geographic location.
� The Department of Health and the appropriate physician boards should collaborate and work withstakeholders, as specific data needs are identified, to revise the information gathered during the licensureprocess to improve the usefulness of the data for purposes of physician workforce supply planning.
Physician workforce legislation was filed during the 2006 Legislative Sessionto reflect the recommendations of the interim report. SB 1410 was filed as acommittee bill by the Senate Committee on Health Care, chaired by Senator Peaden; and HB 1093 wasfiled by Representative Altman. Although the substantive legislation, itself, was not passed by theLegislature during the 2006 session, the general appropriations bill, HB 5001, included proviso languageand an appropriation of $210,000 from Specific Appropriations 633 and 635. This proviso languagerequired the Department of Health to provide for collection and assessment of physician workforce data,as had been provided in the language of the substantive bills, SB 1410 and HB 1093.
Although this appropriation and the relative proviso language were vetoed by Governor Bush for fiscalreasons, the Office of the Governor, simultaneous to the veto of the appropriation, affirmed acommitment to ensuring that the state, within existing resources, initiate collection and analysis ofphysician workforce information so that Florida’s relevant healthcare policies might be based on validinformation. Through the leadership of the Governor, the Secretary of the Department of Health(subsequently re-titled as the Surgeon General), and the Board of Governors, in collaboration with othergovernmental and non governmental stakeholders, authority was granted for the Department of Healthto work, within its existing resources, to develop and implement a voluntary physician workforce survey.The survey, which would serve as the beginning of Florida’s ability to gather ongoing physicianworkforce information, was incorporated into the allopathic and osteopathic physician licensure renewalprocesses.
During the time frame of the 2006 Legislative Session, two other activities of importance to Florida’sphysician workforce were occurring. On March 23, 2006, pursuant to requests submitted by theUniversity of Central Florida and Florida International University, the Florida Board of Governorspassed and adopted a “Resolution With Regard to the Future of Medical Education in Florida.” Theresolution authorized the development of new medical schools at University of Central Florida andFlorida International University. The resolution also recognized that Florida, as a growing and dynamicstate, must be proactive in planning for the future healthcare of its citizens and found that the policy ofthe State, with respect to medical education, must be comprehensive in its approach. The Boardacknowledged a commitment to Florida’s existing medical schools; indicated that the creation of moremedical residencies is a first and immediate priority for Florida’s healthcare system and found thatperiodic adjustments should be made to ensure that residencies are in specialties that meet the needs ofthe population; and addressed the importance that Florida attract and retain new physicians, includingaccess to those from underserved populations. The Board emphasized that the CEPRI Report should bea cornerstone and blueprint for addressing Florida’s future healthcare needs in a manner that iscomprehensive, logical, action-oriented, collaborative, and expectant of tangible commitments on theparts of the Legislature, the Board of Governors and the State University System. Shortly after adoptionof the resolution by the Board of Governors, the 2006 Florida Legislature passed HB 1237, legislation
11

authorizing the initial development of new medical schools at University of Central Florida and FloridaInternational University.
Also in 2006, the voluntary Physician Workforce Survey was produced by the Department incollaboration with stakeholders, and offered a new data source that reinvigorated legislative leaders to,again, introduce physician workforce legislation during the 2007 session. Success came in the passage ofCS/CS/SB 770 by Senator Atwater (House companion bill HB 877 by Representative Homan). Thisinfluential legislation expanded upon the previous legislation by directing the Department of Health, notonly to collect and analyze physician workforce data, but to also serve as a coordinating and strategicplanning body to actively assess the state’s current and future physician workforce needs and work withmultiple stakeholders to develop strategies and alternatives to address current and projected physicianworkforce needs. The Department was further directed to serve as a state clearinghouse relative to thephysician workforce and medical education continuum in Florida.
Upon passage of CS/CS/SB 770 by the Legislature, approval of the legislation by Governor Crist, andimplementation of Florida’s physician workforce initiative by the Department, Florida’s policymakerswould be in a position to shape policy with actual data and lay the groundwork for physician and overallhealthcare practitioner planning that will be able to meet the needs of Florida’s citizens.
Department of HealthImplementation of CS/CS/SB 770
The Florida Legislature recognized that in order to plan for adequate andquality healthcare for all Floridians, there must be an understanding of themakeup and distribution of active, licensed physicians. To achieve the intent ofCS/CS/SB 770, the Department, serving as a coordinating and strategic planning body and working withexisting programs, was tasked with accomplishing the following:
� Developing and implementing a survey of Florida physicians to collect pertinent information as part ofthe licensure renewal process;
� Monitoring, evaluating and reporting on the supply and distribution of physicians in Florida, andmaintaining a database with this statewide data;
� Developing a model to quantify the surplus or shortage of physicians in Florida;
� Developing recommendations of strategies focused on medical school and graduate medical educationissues, and the attracting and retaining of physicians in Florida;
� Serving as a liaison with other states and federal agencies and programs;
� Acting as a clearinghouse for physician workforce information and the medical education continuum inFlorida; and
� Reporting each year on the geographic distribution and specialty mix of physicians in Florida.
The Department of Health has had significant success in its initialcoordination and implementation of CS/CS/SB 770, now, in part, codifiedas section 381.4018, Florida Statutes. In addition to coordinating governmental and non-governmental stakeholders, the Department has also been committed to maximizing its own internalactivities and resources. In August 2007, Department leadership identified key internal programsinvolved in physician workforce issues and held internal meetings to draft an implementation plan. TheDepartment’s proactive implementation of Florida’s physician workforce initiative has included
12

continuation and enhancement of departmental programmatic efforts already underway. Departmentprograms include the Division of Medical Quality Assurance, Office of Health Professional Recruitment,Graduate Medical Education Committee, Community Hospital Education Council, J1-VISA program,Area Health Education Centers Network, Office of Rural Health, Local Health Councils, MedicallyUnderserved Areas program, Volunteer Health Program, Office of Trauma, Bureau of EmergencyMedical Services, and Office of Injury Prevention. Since the passage of CS/CS/SB 770, the Departmenthas expanded its healthcare practitioner initiatives to the Office of Public Health Nursing, the PublicHealth Dental Program and has presented information to the Division of Family Health Services andCounty Health Departments to keep future lines of collaboration and communication open andtransparent.
As previously discussed, the first Physician Workforce Questionnaire was developed as a voluntary effortin 2006 (Appendix I). The voluntary survey was developed through collaborative efforts of governmentaland non-governmental stakeholders under the leadership and through the ongoing support of theGovernor, Secretary of the Department of Health (now Surgeon General), the legislative sponsors of SB1410 and HB 1093, and the Board of Governors. The voluntary survey “went live” during the October,2006, allopathic physician licensure renewal cycle and was completed in January of 2007. A response rateof almost 90% for the voluntary survey was recorded. For purposes of clarity in this report, the voluntaryphysician survey data that was collected in late 2006 and early 2007 will be referred to as the 2007physician data base.
The survey data was reviewed by a group of stakeholders at the Department, but the only comprehensiveanalysis was done by Dr. Robert Brooks and Dr. Nir Menachemi, published as the feature article“Florida’s Physician Workforce: Preliminary Results from a Statewide Survey” in the Florida MedicalMagazine (October, 2007). The analysis was the first attempt to dissect Florida’s active licensedphysicians by specialty mix, and identified several factors that would help reshape the mandatory surveyand focus efforts of strategic planning .
That same year, in 2007, after the passage of CS/CS/SB 770, governmental and non-governmentalstakeholders convened on a weekly basis for several months to modify the voluntary survey to becomethe mandatory survey, ensuring that it reflected the provisions of the underlying statute. Stakeholdersreached consensus on a series of questions aimed at assessing the status of Florida’s current physicianworkforce, including addressing the geographic location and specialty mix of licensed Florida physicians.Pursuant to CS/CS/SB 770, the survey also included specific questions on mammography, obstetrics andemergency on-call services. The Division of Medical Quality Assurance (MQA) incorporated themandatory physician workforce survey into the allopathic and osteopathic physician licensure renewalprocesses. MQA has also adopted provisions regarding the disciplinary/citation process for physiciansnot completing the mandatory survey into administrative rule. Initial rules were filed and published inFlorida Administrative Weekly in December, 2007. The rules were subsequently modified in July, 2008(Appendix II). The 2008 Physician Workforce Survey went live October, 2007, and included one half ofallopathic (n=25,850), and all osteopathic (n=4,839), physicians renewing their licenses during this cycle(Appendix III). For purposes of clarity, in this report, the mandatory physician survey data that wascollected in late 2007 and early 2008 will be referred to as the 2008 physician data base.
Upon the Legislature’s passage and Governor Crist’s approval of CS/CS/SB 770, the State SurgeonGeneral created a Healthcare Practitioner Workforce Ad Hoc Committee. The Ad Hoc Committee,created pursuant to section 20.43(6), Florida Statutes, was created to address survey data collection,analysis, and reporting; and the development of a framework for physician workforce strategic planning.The Ad Hoc Committee has worked diligently and inclusively with interested stakeholders to accomplishthe key tasks outlined by the State Surgeon General, the first of which was to reevaluate the survey tooland recommend changes to the survey based on the identified needs in particular areas. The group madea number of suggestions relative to the physician workforce survey document, all of which were seriouslyconsidered by the Surgeon General and Department staff. The 2008–09 Physician Workforce Survey
13

document was noticed by the Department for rulemaking and published in the Florida AdministrativeWeekly on August 1, 2008 (Appendix IV). The modified survey recently went “live” as part of the 2008–2009 Physician Licensure Renewal process, and will be completed by January, 2009.
In order to maximize the efficiency and effectiveness of the survey document and subsequent analysis ofFlorida physician workforce information, the Department is utilizing the Department’s own existingresources as much as pragmatically possible. The utilization of the survey document and Departmentresources, including the “practitioner profile”, are expected to result in the collection of significantinformation and in the provision of an initial complete, exhaustive snapshot of Florida’s workforce. Infuture years, as physician workforce information is further collected and analyzed, the Departmentshould have the ability to also reflect trend information relative to Florida’s physician workforce.
The Healthcare Practitioner Ad Hoc Committee has also addressed the development of a framework forstrategic planning as required by CS/CS/SB 770. In order to meet the strategic planning directives of thelegislation, the Ad Hoc Committee elected to concentrate on three key substantive areas: medicaleducation and the medical school pipeline, graduate medical education and the attraction and retentionof physicians in Florida. The development of a strategic planning framework continues to be atransparent and inclusive effort, drawing interest and support from an array of pubic and private entitiesand interests. The strategic planning efforts focus on objectives, which, when implemented, will meet thedirectives of CS/CS/SB 770 and will help ensure a sufficient future supply of physicians to provideneeded medical care for Florida’s citizens, and to meet the state’s geographic, demographic, andphysician specialty workforce needs. These Ad Hoc Committee objectives and framework for strategicplanning include, but are not limited to:
� Ensuring a sufficient supply of qualified medical school applicants to meet the capacity andrequirements of the state’s allopathic and osteopathic medical schools.
� Ensuring a high-quality medical education in Florida’s public and private, allopathic and osteopathicmedical schools. Such medical education should be provided in a manner that recognizes the uniquenessof each medical school and in a manner that will provide a quantity, quality and diversity of graduatesthat are adequate to meet physician workforce needs.
� Creating, expanding and maintaining sufficient graduate medical education (GME) positions in thestate. Considering funding alternatives, including the possibility of providing state funding for anincreased number of GME positions in Florida that will be adequate to support the graduates of all ofFlorida’s existing and new medical schools who elect to do GME in Florida. GME strategies and fundingshould be based on physician workforce information and should address the critical geographic,demographic and specialty needs of the state.
� Attracting and retaining physicians to care for Florida’s citizens.
Maximizing federal and state programs that use incentives to attract physicians to this state or retain physicianswithin the state. Strategies might include the use of programs such as the Florida Health Services Corps(s.381.0302, F.S.) and the Medical Education Reimbursement and Loan Repayment Program (s. 1009.65, F.S.)as a means to immediately provide physicians to critically underserved areas.
Addressing matters related to practice environment that impact Florida’s ability to recruit or retain neededpracticing physicians.
The above items reflect the Ad Hoc Committee’s initial framework forphysician workforce strategic planning. A more complete and detailed strategic planningdocument is expected to be available in early 2009. As strategic planning is a living, ever-developingprocess, the expectation is that physician workforce strategic planning functions will be ongoingactivities and will vary depending on the status of Florida’s physician workforce, Florida’s generalpopulation, and Florida’s healthcare environment and system.
14

Data Analysis and ReportingThe Department of Health is reporting here on data from the 2008mandatory physician workforce survey. This data represents one half of allopathic (n=25,654), and all osteopathic (n= 4,838) physicians renewing their licenses. Based on the intent ofCS/CS/SB 770, the Department of Health has worked to provide detailed information from the surveyand the Physician Practitioner Profile, mandated in sections 456.039, 456.041, 456.043 & 456.045, F.S.
The following caveats and limits are made with regard to the survey data:
� Physician licensure data will be provided annually. “Point in time” verification will not be conducted.
� Physician licensure data and the Physician Workforce Survey are self-reported data.
� The Department will work with stakeholders to define relevant terms and parameters for reporting.
� The first year of data evaluation will produce an initial report that will benchmark physician licensureinformation by specialty and geographic location.
� The Department will facilitate discussions and a strategic plan with stakeholders based on the analysisof data from the Physician Workforce Survey.
2008 Florida Physician Workforce Survey:Key Findings and Limitations
The Physician Workforce Survey is a direct attempt to address the concernof policymakers and stakeholders regarding the availability of data neededto assess the adequacy of the physician workforce by geographic distributionand specialty mix. The survey is a compilation of questions asking specifics of a physician’spractice status and projected changes to practice, coupled with demographic information from thestatutorily mandated Practitioner Profile. These data create the basis for a centralized repository for astatewide health workforce data system that offers a source of valid data to make policy decisions thatimpact access to quality care for Floridians.
The reporting for this annual report includes the 2008 physician renewal cycle, which represents one-halfof allopathic physicians (which renew every other year), and all osteopathic physicians licensed inFlorida.
There was a separate voluntary survey conducted for the 2007 licensure renewal process that includes theother half of allopathic physicians. In order to be comparable to analysis that was conducted by Dr.Robert Brooks and Dr. Nir Menachemi on the 2007 voluntary survey data, some criteria were heldconstant for questions, but, based on the input of the Healthcare Practitioner Ad Hoc Committee, therewas not an effort to combine the entire data set at this point (Brooks and Menachemi, 2007).
15

METHODSPhysician respondents were able to complete the 2008 survey by web-based response or by connecting tothe survey and printing the paper format to return with the renewal document, or as a stand-alonedocument. Paper surveys were then entered into the web-based system for data analysis. The surveyinstrument itself was reworked from the original 2007 voluntary survey with input from physicianworkforce stakeholders, the Council of Medical School Deans, graduate medical educationrepresentatives, the Florida Medical Association and Florida Osteopathic Medical Association, theFlorida Hospital Association, other governmental agencies, physician specialty groups including theRadiological Society and the Florida Society of Obstetrics and Gynecology, emergency physicians groupsand many others. The survey consisted of 12 core questions, and a series of specialty questions, directedby statute, for physicians taking emergency call, radiologists and specialists in obstetrics/gynecology.
RESULTSA total of 25,654 allopathic (84%) and 4,838 osteopathic (16%) physicians completed the 2008 survey.Of those who were allopathic physicians, only 18,335 physicians, (71.5%), indicated that they currentlypractice medicine at any time during the year in Florida and had a valid Florida practice address. Ofthose who were osteopathic physicians, 3,275 respondents, (67.7%), indicated that they currentlypractice in Florida and had a valid Florida practice address. The two groups were totaled together, andthe analysis in this report includes 21,610 ( 71 %) physicians responding to the survey.
DEMOGRAPHICSOf the 21,610 physicians (MDs and DOs) who responded to the 2008 Workforce Survey, Figure 1 showsthat the State’s physician workforce continues to be male-dominated (77%). Overall, the mean age of allrespondents was 46 for female and 52 for male. Of the 18,335 allopathic physicians responding to thesurvey, the mean age was 52 for male and 47 for female. The mean age for the 3,275 osteopathicphysicians responding was younger, at 49 for male, and 42, for female physicians (see Figure 1-2).
Male76.89%
Female23.11%
Figure 1. Demographics:Gender Distribution (M.D. and D.O.) Figure 1-2. Demographics: Mean Age of M.D. and D.O. by Gender
0
10
20
30
40
50
60
46.65 52.4 42.41 48.9
M.D. D.O.
Female Male
ME
AN
AG
E
16

Physicians between the ages of 25 and 45 made up only 36 percent of the total workforce (see Figure 2).Based on the survey, more than 30 percent of the physicians were over the age of 55. The majority of thephysicians were between 46 and 55 (33%). More than 34 percent of the male physicians were 56 orolder, while approximately 16 percent of the female physicians were in the same age category.
Figure 3 shows the distribution of physicians by different ethnic groups. Approximately 67 percent ofthose who responded to this question stated they were White/Non-Hispanic. Fourteen percent of therespondents identified themselves by choosing the ‘Other’ category, followed by Asian/Pacific Islander,Black/Non-Hispanic, Hispanic, and American Indian/Alaskan Native.1 Of note, 84 percent of theosteopathic physicians (DOs) were White/Non-Hispanic, compared to only 63.5 percent for allopathicphysicians (MDs) (see Figure 3-2). Twelve percent of the allopathic physicians were Asian/PacificIslander, while 5 percent of osteopathic physicians were in the same category. Both Black and Hispanicrespondents accounted for 4.6 percent of the workforce among allopathic physicians. Among theosteopathic physicians, 3 percent were Black/Non-Hispanic, while only 1.7 percent represented Hispanicphysicians.
17
Figure 2. Demographics: Age Distribution(M.D. and D.O.)
86–96, 0.17%
25–358.14%
36–4527.72%
46–5533.06%
56–6520.44%
66–75, 8.21%
76–85, 2.27%
Figure 3. Demographics: Race/Ethnicity(M.D. and D.O.)
White66.57%
Black/Non Hispanic, 4.32%
Hispanic, 4.12%American Indian/Alaskan Native, 0.11%
Asian/Pacific Islander10.53%
Other14.36%
Figure 3-2. Demographics: Distribution of Race/Ethnicity by Profession
0
10%
20%
30%
40%
50%
60%
70%
80%
90%
100%D.O.M.D.
OtherHispanicAsian/PacificIslander
AmericanIndian/
Alaskan Native
Black/Non-Hispanic
White/Non-Hispanic
63.5 83.8 4.6 3.0 0.1 0.2 11.6 4.7 4.6 1.7 15.7 6.7
1 Of the 21,610respondents included inthe sample, there were
622 missing cases and 89cases that were
‘Unknown.’ Both themissing cases and the
cases in the ‘Unknown’category were treated as
missing cases andtherefore do not
represent any part of theFigure 3.

PRACTICE STATUS2
The majority of physicians (97%; n= 20,752) responding to the survey work 9–12 months per year inFlorida (see Figure 4). The vast majority of physicians who worked at least 9 months per year (data notshown) were White/Non-Hispanic (77.5%), followed by Asian/Pacific Islander (12.5%), Black/Non-Hispanic (5%), Hispanic (4.9%), and American Indian/Alaskan Native (.1%). Among those whoworked at least 9 months, 77 percent were male physicians. Of note, the majority of those who practicedat least 9 months per year was in the 46–55 age bracket (33.5%), followed by 36–45 (28.1%) and 56–65(20.3%), while about 30 percent was over the age of 56. In addition, 35.7 percent worked more than 40hours, followed by 1–20 hours (35.5%) and 21–40 hours (28.7%).
Another indicator for the practice status is shown in Figure 5, where respondents were asked whetherthey were in a solo practice. Of the 21,610 respondents to the 2008 survey, 6,685 (31.3%) respondentsindicated that they were in a solo practice. Of note, those who were in a solo practice were older thanthose who worked in other settings for both male and female (see Figure 5-2). The mean age ofrespondents who worked in a solo setting was 49 and 55, for female, and male, respectively, while themean age for those who were in other settings other than a solo practice was 44, and 50, for female, andmale, respectively.
18
Figure 4. Number of Practice Months Per Year (M.D. and D.O.)
1–4 Months, 1.84%5–8 Months1.58%
9–12 Months96.58%
No68.69%
Yes31.31%
Figure 5. Solo Practice (M.D. and D.O.)
Figure 5-2. Mean Age of Physicians in Solo Practice vs. Non-Solo Practice
0
10
20
30
40
50
60
70Non-SoloSolo
MaleFemale
49.29 44.72 55.42 50.132Every table and figureshown is based on the
combination of bothallopathic physicians and
osteopathic physicianscombined, unless stated
otherwise.

Figure 6 shows the distribution of Florida physicians by the practice settings where the majority of theirtime is spent. Statistics show that over 60 percent of the respondents indicated a private office setting astheir main practice location, followed by hospital-inpatient (9.4%), other setting (7.2%), hospital other(6.1%), hospital emergency department (4.9%), and hospital—outpatient department/service (4.2%).
SPECIALTY MIXFigure 73 shows the distribution of specialties. These were listed by the “primary” specialty that wasreported by each respondent. (In a number of cases the physician respondent also listed “secondary”areas of specialization.) By frequency, family medicine (15%) was the largest represented group, followedby internal medicine (13%) and medical specialists (13%). Surgical specialists were not too far behindwith 12.3 percent. The “other” category4 was the fifth largest group represented with 6.8 percent,followed by anesthesiology (5.7%) and pediatrics (5.5%).
19
Figure 6. Main Practice Settings by the Physicians
Nursing Home/Extended Care Facility
Ambulatory Surgery Center/Free-Standing Imaging Diagnostic Center
Federally Qualified Health Center
Governmental Clinical Setting
Federal Healthcare Facility
Hospital—Outpatient Department/Service
Hospital Emergency Department
Hospital Other
Other Setting
Hospital—Inpatient
Private Office Setting
60.33%
9.42%
7.16%
6.10%
4.93%
4.19%
2.90%
1.80%1.52%
1.14%0.53%
Figure 7. Distribution of Specialty (M.D. and D.O.)
0200400600800
1,0001,2001,4001,6001,800
2,0002,2002,4002,6002,8003,0003,200
Pathology
Neurology
Pediatric Sub-specialist
General Surgery
Dermatology
Radiology
Psychiatry
OB/GYN
Emergency Medicine
Pediatrics
Anesthesiology
Other
Surgical Specialist
Medical Specialist
Internal Medicine
Family Medicine
15.05% 13.03% 12.95% 12.31% 6.80% 5.75% 5.51% 5.14% 4.61% 4.39% 4.07% 2.31% 2.13% 2.09% 2.03% 1.82%
CO
UN
T
3,125 2,707 2,690 2,557 1,413 1,194 1,145 1,067 957 911 846 479 442 434 422 379
3The figure excluded atotal of 842 missing
cases. 4 The majority of “Other”category represents cases
where respondents’choice of the other
category had either thesingle largest percentage
of time or the largest sumof total percentage of
time. For the purpose ofstudy, if no specialty is
distinguished to have themajority of percentage ofhours, the case is treated
as “Other” category. Ifthe respondent selectedtwo specialties and each
specialty splits thepercentage of hours
evenly, then “Other”category is selected that
best describes orrepresents his or her
primary specialty. Also, ifa respondent chose a
specialty group and gavemore than 81 percent of
time or more and alsochose the “Other”
specialty category andgave the same 81 percent
of time or more, for thepurpose of study, the
“Other” category isselected as that which
best represents therespondent’s primary
specialty. In seeminglyvalid cases where a
respondent indicated twodistinct specialties with
even percentage of hoursper week, to be
consistent with othermeasures, “Other”
category is selected so asto not give edge to one or
the other specialty.
20
SPECIALTYGENDER
TOTALFEMALE MALE
Family MedicineCount 858 2,260 3,118Percent within Primary Specialty 27.5% 72.5% 100%Percent within Gender 17.9% 14.2% 15.0%
Internal MedicineCount 773 1,934 2,707Percent within Primary Specialty 28.6% 71.4% 100%Percent within Gender 16.1% 12.1% 13.1%
PediatricsCount 614 531 1,145Percent within Primary Specialty 53.6% 46.4% 100%Percent within Gender 12.8% 3.3% 5.5%
Pediatric SubspecialistCount 151 283 434Percent within Primary Specialty 34.8% 65.2% 100%Percent within Gender 3.2% 1.8% 2.1%
OB/GYNCount 349 607 956Percent within Primary Specialty 36.5% 63.5% 100%Percent within Gender 7.3% 3.8% 4.6%
Medical SpecialistCount 367 2,321 2,688Percent within Primary Specialty 13.7% 86.3% 100%Percent within Gender 7.7% 14.5% 13.0%
General SurgeryCount 35 406 441Percent within Primary Specialty 7.9% 92.1% 100%Percent within Gender 0.7% 2.5% 2.1%
Surgical SpecialistCount 191 2,363 2,554Percent within Primary Specialty 7.5% 92.5% 100%Percent within Gender 4.0% 14.8% 12.3%
PsychiatryCount 293 618 911Percent within Primary Specialty 32.2% 67.8% 100%Percent within Gender 6.1% 3.9% 4.4%
RadiologyCount 132 713 845Percent within Primary Specialty 15.6% 84.4% 100%Percent within Gender 2.8% 4.5% 4.1%
Emergency MedicineCount 202 865 1,067Percent within Primary Specialty 18.9% 81.1% 100%Percent within Gender 4.2% 5.4% 5.1%
PathologyCount 114 265 379Percent within Primary Specialty 30.1% 69.9% 100%Percent within Gender 2.4% 1.7% 1.8%
DermatologyCount 142 336 478Percent within Primary Specialty 29.7% 70.3% 100%Percent within Gender 3.0% 2.1% 2.3%
NeurologyCount 67 355 422Percent within Primary Specialty 15.9% 84.1% 100%Percent within Gender 1.4% 2.2% 2.0%
AnesthesiologyCount 217 973 1,190Percent within Primary Specialty 18.2% 81.8% 100%Percent within Gender 4.5% 6.1% 5.7%
OtherCount 284 1,124 1,408Percent within Primary Specialty 20.2% 79.8% 100%Percent within Gender 5.9% 7.0% 6.8%
TotalCount 4,789 15,954 20,743Percent within Primary Specialty 23.1% 76.9% 100%Percent within Gender 100% 100% 100%
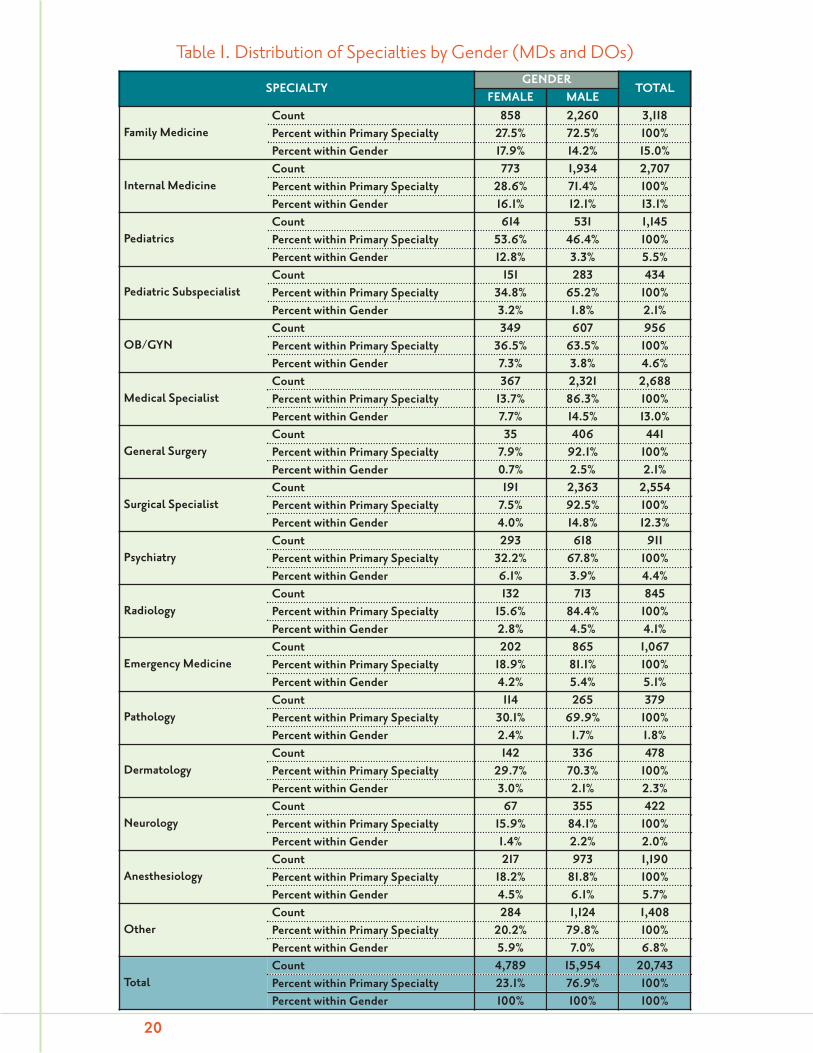
Table 1. Distribution of Specialties by Gender (MDs and DOs)

21
SPECIALTYPROFESSION CODE
TOTALM.D. D.O.
Family MedicineCount 2,002 1,123 3,125Percent within the Specialty 64.1% 35.9% 100%Percent within the Profession 11.4% 35.3% 15.0%
Internal MedicineCount 2,400 307 2,707Percent within the Specialty 88.7% 11.3% 100%Percent within the Profession 13.6% 9.7% 13.0%
PediatricsCount 1,067 78 1,145Percent within the Specialty 93.2% 6.8% 100%Percent within the Profession 6.1% 2.5% 5.5%
Pediatric SubspecialistCount 411 23 434Percent within the Specialty 94.7% 5.3% 100%Percent within the Profession 2.3% 0.7% 2.1%
OB/GYNCount 854 103 957Percent within the Specialty 89.2% 10.8% 100%Percent within the Profession 4.9% 3.2% 4.6%
Medical SpecialistCount 2,498 192 2,690Percent within the Specialty 92.9% 7.1% 100%Percent within the Profession 14.2% 6.0% 13.0%
General SurgeryCount 397 45 442Percent within the Specialty 89.8% 10.2% 100%Percent within the Profession 2.3% 1.4% 2.1%
Surgical SpecialistCount 2,320 237 2,557Percent within the Specialty 90.7% 9.3% 100%Percent within the Profession 13.2% 7.5% 12.3%
PsychiatryCount 837 74 911Percent within the Specialty 91.9% 8.1% 100%Percent within the Profession 4.8% 2.3% 4.4%
RadiologyCount 774 72 846Percent within the Specialty 91.5% 8.5% 100.0%Percent within the Profession 4.4% 2.3% 4.1%
Emergency MedicineCount 731 336 1,067Percent within the Specialty 68.5% 31.5% 100%Percent within the Profession 4.2% 10.6% 5.1%
PathologyCount 361 18 379Percent within the Specialty 95.3% 4.7% 100%Percent within the Profession 2.1% 0.6% 1.8%
DermatologyCount 380 99 479Percent within the Specialty 79.3% 20.7% 100%Percent within the Profession 2.2% 3.1% 2.3%
NeurologyCount 371 51 422Percent within the Specialty 87.9% 12.1% 100%Percent within the Profession 2.1% 1.6% 2.0%
AnesthesiologyCount 1,042 152 1,194Percent within the Specialty 87.3% 12.7% 100%Percent within the Profession 5.9% 4.8% 5.7%
OtherCount 1,146 267 1,413Percent within the Specialty 81.1% 18.9% 100%Percent within the Profession 6.5% 8.4% 6.8%
TotalCount 17,591 3,177 20,768Percent within the Specialty 84.7% 15.3% 100%Percent within the Profession 100% 100% 100%
Table 1-2. Distribution of Specialties by Profession

Table 15 shows the distribution of specialties by gender. Male physicians were more frequent in themajority of specialties, except for pediatrics where male physicians accounted for 46.4 percent of allrespondents. Specialties where males represented an overwhelming majority of respondents were generalsurgery (92.1%) and surgical specialist (92.5%). The top five specialties for women based on thefrequency of responses were pediatrics (53.6%), OB/GYN (36.5%), pediatric sub-specialist (34.8%),psychiatry (32.2%), and pathology (30.1%).
As Table 1 shows, the top five specialties by female physicians were family medicine (17.9%), internalmedicine (16.1%), pediatrics (12.8%), medical specialist (7.7%), and OB/GYN (7.3%). The top fivespecialties by male physicians were surgical specialist (14.8%), medical specialist (14.5%), family medicine(14.2%), internal medicine (12.1%), and other (7%).
When broken down by profession, the top five specialties for allopathic physicians were medical specialist(14.2%), internal medicine (13.6%), surgical specialist (13.2%), family medicine (11.4%), and other(6.5%) (see Table 1-2).6 As for the osteopathic physicians, the most represented group was family medicine(35.3%), followed by emergency medicine (10.6%), internal medicine (9.7%), other (8.4%), and surgicalspecialist (7.5%). Of note, male physicians were an average five years older than female physicians in mostof the primary specialties (see Figure 8).
Table 27 shows the distribution of specialties by age category. The top three specialties (excluding other[12.1 percent]), where the 67–96 age category represented at least 10 percent within each specialty were:psychiatry (18.7%), family medicine (13.7%), and general surgery (12%). The majority of specialties werein the 46–66 age bracket (54.8%), followed by those in the 24–45 age bracket (36.1%) and those in the67–96 age bracket (9%).
When broken down by the age categories, the top five specialties in the 25–45 age bracket were internalmedicine (15.4%), family medicine (14.3%), medical specialist (12.6%), surgical specialist (11.4%), andemergency medicine (7.1%). Among those between 46 and 66, the top five specialties included familymedicine (14.2%), medical specialist (14%), surgical specialist (12.4%), internal medicine (12.2%), andother (7.2%). Only 1.1 percent and 1.9 percent of those in the 25–45 age bracket specialized in pathology,and neurology, respectively. Of those in the 67–96 age bracket, the top five specialties included familymedicine (22.8%), surgical specialist (15.4%), psychiatry (9.1%), other (9.1%), and internal medicine(8.9%). Table 2-2 shows the distribution for allopathic physicians only.8
22
Pathology
Neurology
Pediatric Sub-specialist
General Surgery
Dermatology
Radiology
Psychiatry
OB/GYN
Emergency Medicine
Pediatrics
Anesthesiology
Other
Surgical Specialist
Medical Specialist
Internal Medicine
Family Medicine
0
10
20
30
40
50
60MaleFemale
Figure 8. Mean Age of Specialties by Gender
ME
AN
AG
E
45 54 45 50 45 52 45 51 44 54 46 51 44 53 44 52 51 56 47 52 44 47 51 55 44 50 45 51 47 49 48 53
5There were a total of 867missing cases for age
category, which reducedthe total sample size of21,610 down to 20,743
for the genderbreakdown.
6There were 842 missingcases for Table 1-2.
7There were 869 missingcases for age, which
reduced the total samplesize from 21,610 down to
20,741 for the agebreakdown.
8 There were 765 missingcases.

23
SPECIALTYAGE CATEGORY
TOTAL25–45 46–66 67–96
Family MedicineCount 1,073 1,618 426 3,117Percent within Primary Specialty 34.4% 51.9% 13.7% 100%Percent within Age Category 14.3% 14.2% 22.8% 15.0%
Internal MedicineCount 1,153 1,388 166 2,707Percent within Primary Specialty 42.6% 51.3% 6.1% 100%Percent within Age Category 15.4% 12.2% 8.9% 13.1%
PediatricsCount 475 605 65 1,145Percent within Primary Specialty 41.5% 52.8% 5.7% 100%Percent within Age Category 6.3% 5.3% 3.5% 5.5%
Pediatric SubspecialistCount 149 266 19 434Percent within Primary Specialty 34.3% 61.3% 4.4% 100%Percent within Age Category 2.0% 2.3% 1.0% 2.1%
OB/GYNCount 349 516 91 956Percent within Primary Specialty 36.5% 54.0% 9.5% 100%Percent within Age Category 4.7% 4.5% 4.9% 4.6%
Medical SpecialistCount 941 1,591 156 2,688Percent within Primary Specialty 35.0% 59.2% 5.8% 100%Percent within Age Category 12.6% 14.0% 8.3% 13.0%
General SurgeryCount 148 240 53 441Percent within Primary Specialty 33.6% 54.4% 12.0% 100%Percent within Age Category 2.0% 2.1% 2.8% 2.1%
Surgical SpecialistCount 857 1,409 288 2,554Percent within Primary Specialty 33.6% 55.2% 11.3% 100%Percent within Age Category 11.4% 12.4% 15.4% 12.3%
PsychiatryCount 226 515 170 911Percent within Primary Specialty 24.8% 56.5% 18.7% 100%Percent within Age Category 3.0% 4.5% 9.1% 4.4%
RadiologyCount 286 471 88 845Percent within Primary Specialty 33.8% 55.7% 10.4% 100%Percent within Age Category 3.8% 4.1% 4.7% 4.1%
Emergency MedicineCount 536 512 18 1,066Percent within Primary Specialty 50.3% 48.0% 1.7% 100%Percent within Age Category 7.1% 4.5% 1.0% 5.1%
PathologyCount 81 258 40 379Percent within Primary Specialty 21.4% 68.1% 10.6% 100%Percent within Age Category 1.1% 2.3% 2.1% 1.8%
DermatologyCount 202 248 28 478Percent within Primary Specialty 42.3% 51.9% 5.9% 100%Percent within Age Category 2.7% 2.2% 1.5% 2.3%
NeurologyCount 146 249 27 422Percent within Primary Specialty 34.6% 59.0% 6.4% 100%Percent within Age Category 1.9% 2.2% 1.4% 2.0%
AnesthesiologyCount 452 674 64 1,190Percent within Primary Specialty 38.0% 56.6% 5.4% 100%Percent within Age Category 6.0% 5.9% 3.4% 5.7%
OtherCount 423 815 170 1,408Percent within Primary Specialty 30.0% 57.9% 12.1% 100%Percent within Age Category 5.6% 7.2% 9.1% 6.8%
TotalCount 7,497 11,375 1,869 20,741Percent within Primary Specialty 36.1% 54.8% 9.0% 100%Percent within Age Category 100% 100% 100% 100%
Table 2. Distribution of Specialties by Age Category (MDs and DOs)

24
Table 2-2. Distribution of Specialties by Age Category (MDs Only)
SPECIALTYAGE CATEGORY
TOTAL25–45 46–66 67–96
Family MedicineCount 610 1,071 316 1,997Percent within Primary Specialty 30.5% 53.6% 15.8% 100%Percent within Age Category 10.2% 10.8% 19.0% 11.4%
Internal MedicineCount 969 1,277 154 2,400Percent within Primary Specialty 40.4% 53.2% 6.4% 100%Percent within Age Category 16.3% 12.8% 9.2% 13.7%
PediatricsCount 424 578 65 1,067Percent within Primary Specialty 39.7% 54.2% 6.1% 100%Percent within Age Category 7.1% 5.8% 3.9% 6.1%
Pediatric SubspecialistCount 132 260 19 411Percent within Primary Specialty 32.1% 63.3% 4.6% 100%Percent within Age Category 2.2% 2.6% 1.1% 2.3%
OB/GYNCount 293 472 88 853Percent within Primary Specialty 34.3% 55.3% 10.3% 100%Percent within Age Category 4.9% 4.7% 5.3% 4.9%
Medical SpecialistCount 850 1,498 148 2,496Percent within Primary Specialty 34.1% 60.0% 5.9% 100%Percent within Age Category 14.3% 15.1% 8.9% 14.2%
General SurgeryCount 122 225 49 396Percent within Primary Specialty 30.8% 56.8% 12.4% 100%Percent within Age Category 2.0% 2.3% 2.9% 2.3%
Surgical SpecialistCount 747 1,297 274 2,318Percent within Primary Specialty 32.2% 56.0% 11.8% 100%Percent within Age Category 12.6% 13.0% 16.4% 13.2%
PsychiatryCount 191 480 166 837Percent within Primary Specialty 22.8% 57.3% 19.8% 100%Percent within Age Category 3.2% 4.8% 10.0% 4.8%
RadiologyCount 259 441 73 773Percent within Primary Specialty 33.5% 57.1% 9.4% 100%Percent within Age Category 4.4% 4.4% 4.4% 4.4%
Emergency MedicineCount 325 387 18 730Percent within Primary Specialty 44.5% 53.0% 2.5% 100%Percent within Age Category 5.5% 3.9% 1.1% 4.2%
PathologyCount 78 244 39 361Percent within Primary Specialty 21.6% 67.6% 10.8% 100%Percent within Age Category 1.3% 2.5% 2.3% 2.1%
DermatologyCount 141 213 25 379Percent within Primary Specialty 37.2% 56.2% 6.6% 100%Percent within Age Category 2.4% 2.1% 1.5% 2.2%
NeurologyCount 115 229 27 371Percent within Primary Specialty 31.0% 61.7% 7.3% 100%Percent within Age Category 1.9% 2.3% 1.6% 2.1%
AnesthesiologyCount 378 600 60 1,038Percent within Primary Specialty 36.4% 57.8% 5.8% 100%Percent within Age Category 6.4% 6.0% 3.6% 5.9%
OtherCount 318 680 145 1,143Percent within Primary Specialty 27.8% 59.5% 12.7% 100%Percent within Age Category 5.3% 6.8% 8.7% 6.5%
TotalCount 5,952 9,952 1,666 17,570Percent within Primary Specialty 33.9% 56.6% 9.5% 100%Percent within Age Category 100% 100% 100% 100%

25
Table 3. Distribution of Specialties by Race (MDs and DOs)
RACE
TOTALWHITE/NON-
HISPANIC
BLACK/NON-
HISPANIC
AMERICANINDIAN/
ALASKANNATIVE
ASIAN/PACIFIC
ISLANDER HISPANIC OTHER
Family MedicineCount 2,012 179 5 278 83 475 3,032Percent within Primary Specialty 66.4% 5.9% 0.2% 9.2% 2.7% 15.7% 100%Percent within Race 15.1% 20.6% 22.7% 13.2% 10.1% 16.3% 15.1%
Internal MedicineCount 1,359 157 3 488 153 465 2,625Percent within Primary Specialty 51.8% 6.0% 0.1% 18.6% 5.8% 17.7% 100%Percent within Race 10.2% 18.1% 13.6% 23.1% 18.6% 16.0% 13.1%
PediatricsCount 565 75 0 145 54 262 1,101Percent within Primary Specialty 51.3% 6.8% 0.0% 13.2% 4.9% 23.8% 100%Percent within Race 4.2% 8.7% 0.0% 6.9% 6.6% 9.0% 5.5%
Pediatric SubspecialistCount 239 11 0 46 24 102 422Percent within Primary Specialty 56.6% 2.6% 0.0% 10.9% 5.7% 24.2% 100%Percent within Race 1.8% 1.3% 0.0% 2.2% 2.9% 3.5% 2.1%
OB/GYNCount 644 81 0 45 23 135 928Percent within Primary Specialty 69.4% 8.7% 0.0% 4.8% 2.5% 14.5% 100%Percent within Race 4.8% 9.3% 0.0% 2.1% 2.8% 4.6% 4.6%
Medical SpecialistCount 1,602 69 1 370 173 390 2,605Percent within Primary Specialty 61.5% 2.6% 0.0% 14.2% 6.6% 15.0% 100%Percent within Race 12.0% 8.0% 4.5% 17.5% 21.0% 13.4% 13.0%
General SurgeryCount 317 21 0 29 18 40 425Percent within Primary Specialty 74.6% 4.9% 0.0% 6.8% 4.2% 9.4% 100%Percent within Race 2.4% 2.4% 0.0% 1.4% 2.2% 1.4% 2.1%
Surgical SpecialistCount 2,009 54 2 137 68 210 2,480Percent within Primary Specialty 81.0% 2.2% 0.1% 5.5% 2.7% 8.5% 100%Percent within Race 15.0% 6.2% 9.1% 6.5% 8.3% 7.2% 12.3%
PsychiatryCount 537 33 2 111 27 168 878Percent within Primary Specialty 61.2% 3.8% 0.2% 12.6% 3.1% 19.1% 100%Percent within Race 4.0% 3.8% 9.1% 5.3% 3.3% 5.8% 4.4%
RadiologyCount 661 11 0 50 26 72 820Percent within Primary Specialty 80.6% 1.3% 0.0% 6.1% 3.2% 8.8% 100%Percent within Race 4.9% 1.3% 0.0% 2.4% 3.2% 2.5% 4.1%
Emergency MedicineCount 785 44 0 76 28 111 1,044Percent within Primary Specialty 75.2% 4.2% 0.0% 7.3% 2.7% 10.6% 100%Percent within Race 5.9% 5.1% 0.0% 3.6% 3.4% 3.8% 5.2%
PathologyCount 252 10 1 44 16 44 367Percent within Primary Specialty 68.7% 2.7% 0.3% 12.0% 4.4% 12.0% 100%Percent within Race 1.9% 1.2% 4.5% 2.1% 1.9% 1.5% 1.8%
DermatologyCount 374 12 4 26 9 41 466Percent within Primary Specialty 80.3% 2.6% 0.9% 5.6% 1.9% 8.8% 100%Percent within Race 2.8% 1.4% 18.2% 1.2% 1.1% 1.4% 2.3%
NeurologyCount 259 8 0 43 19 78 407Percent within Primary Specialty 63.6% 2.0% 0.0% 10.6% 4.7% 19.2% 100%Percent within Race 1.9% 0.9% 0.0% 2.0% 2.3% 2.7% 2.0%
AnesthesiologyCount 787 48 1 106 50 150 1,142Percent within Primary Specialty 68.9% 4.2% 0.1% 9.3% 4.4% 13.1% 100%Percent within Race 5.9% 5.5% 4.5% 5.0% 6.1% 5.2% 5.7%
OtherCount 960 54 3 120 52 165 1,354Percent within Primary Specialty 70.9% 4.0% 0.2% 8.9% 3.8% 12.2% 100%Percent within Race 7.2% 6.2% 13.6% 5.7% 6.3% 5.7% 6.7%
TotalCount 13,362 867 22 2,114 823 2,908 20,096Percent within Primary Specialty 66.5% 4.3% 0.1% 10.5% 4.1% 14.5% 100%Percent within Race 100% 100% 100% 100% 100% 100% 100%

Table 3 shows the distribution of specialties by race.9 White males accounted for 66.5 percent of therespondents for for all specialties combined, followed by Asian/Pacific Islander (10.5%), Black/Non-Hispanic (4.3%), Hispanic (4.1%), and American Indian/Alaskan Native (0.1%).
Table 4 shows the distribution of primary specialties in top 10 counties by population.
26
Table 4. Distribution of Specialties by Top 10 Florida Counties by Population (MDs and DOs)
SPECIALTYCOUNTY
TOTALBREVARD BROWARD DADE DUVAL HILLS-
BOROUGH LEE ORANGE PALMBEACH PINELLAS POLK
Family MedicineCount 80 305 436 198 163 99 198 168 225 74 1,946
Percent 14.1% 14.6% 13.9% 15.6% 10.5% 16.0% 16.1% 9.2% 16.4% 14.9% 13.8%
Internal MedicineCount 75 260 398 122 203 74 124 297 202 77 1,832
Percent 13.2% 12.4% 12.7% 9.6% 13.1% 12.0% 10.1% 16.3% 14.7% 15.5% 12.9%
PediatricsCount 24 120 213 64 102 29 94 84 64 26 820
Percent 4.2% 5.7% 6.8% 5.1% 6.6% 4.7% 7.6% 4.6% 4.7% 5.2% 5.8%
PediatricSubspecialist
Count 4 65 110 32 31 16 35 25 51 2 371Percent 0.7% 3.1% 3.5% 2.5% 2.0% 2.6% 2.8% 1.4% 3.7% 0.4% 2.6%
OB/GYNCount 27 108 140 62 85 32 65 83 39 32 673
Percent 4.7% 5.2% 4.5% 4.9% 5.5% 5.2% 5.3% 4.6% 2.8% 6.4% 4.8%
Medical SpecialistCount 72 253 395 188 196 74 156 255 183 55 1,827
Percent 12.7% 12.1% 12.6% 14.8% 12.7% 12.0% 12.7% 14.0% 13.3% 11.1% 12.9%
General SurgeryCount 11 43 56 26 33 8 25 31 25 18 276
Percent 1.9% 2.1% 1.8% 2.1% 2.1% 1.3% 2.0% 1.7% 1.8% 3.6% 2.0%
Surgical SpecialistCount 63 247 378 139 196 104 131 256 174 61 1,749
Percent 11.1% 11.8% 12.1% 11.0% 12.7% 16.9% 10.6% 14.1% 12.7% 12.3% 12.4%
PsychiatryCount 25 74 188 43 77 27 48 76 42 15 615
Percent 4.4% 3.5% 6.0% 3.4% 5.0% 4.4% 3.9% 4.2% 3.1% 3.0% 4.3%
RadiologyCount 29 72 123 61 68 22 57 74 52 27 585
Percent 5.1% 3.4% 3.9% 4.8% 4.4% 3.6% 4.6% 4.1% 3.8% 5.4% 4.1%
Emergency MedicineCount 30 139 118 80 62 35 70 77 75 29 715
Percent 5.3% 6.6% 3.8% 6.3% 4.0% 5.7% 5.7% 4.2% 5.5% 5.8% 5.1%
PathologyCount 10 29 62 15 49 8 38 35 28 4 278
Percent 1.8% 1.4% 2.0% 1.2% 3.2% 1.3% 3.1% 1.9% 2.0% 0.8% 2.0%
DermatologyCount 12 72 64 16 29 14 12 68 30 12 329
Percent 2.1% 3.4% 2.0% 1.3% 1.9% 2.3% 1.0% 3.7% 2.2% 2.4% 2.3%
NeurologyCount 15 35 58 29 40 11 20 40 31 9 288
Percent 2.6% 1.7% 1.9% 2.3% 2.6% 1.8% 1.6% 2.2% 2.3% 1.8% 2.0%
AnesthesiologyCount 45 145 161 107 95 22 84 105 69 26 859
Percent 7.9% 6.9% 5.1% 8.4% 6.1% 3.6% 6.8% 5.8% 5.0% 5.2% 6.1%
OtherCount 47 128 233 85 120 42 74 144 84 30 987
Percent 8.3% 6.1% 7.4% 6.7% 7.7% 6.8% 6.0% 7.9% 6.1% 6.0% 7.0%
TotalCount 569 2,095 3,133 1,267 1,549 617 1,231 1,818 1,374 497 14,150
Percent 100% 100% 100% 100% 100% 100.0% 100% 100% 100% 100% 100%
9There were a total of1,514 missing cases
regarding both specialtiesand race.

SCOPE OF PRACTICEAlmost 87 percent of the respondents indicated that they do not plan to retire or relocate outside of theState of Florida within the next five years.
Thirteen percent (n=2,765) of all respondents stated that they intend to retire or reduce the scope of thispractice within the next five years. Among female respondents, only 9.3 percent indicated that they planto retire or relocate outside of the State of Florida within the next five years, compared to 14.2 % of malerespondents (data not shown). Figure 9 shows that among those who are either planning to retire orrelocate outside of Florida, 15.7 percent are in the 25–45 age bracket. The majority of the respondentsstating that they intend to retire or reduce practice (55.1%) were in the 46–65 age bracket.
As Figure 10 indicates, the top reasons for changing the scope of practice were: liability (27.4%),reimbursement (24.4%), lifestyle considerations (20.5%), regulatory and administrative burden (12.1%),other (10.8%), and retirement (4.9%) issues.
27
Figure 9. Distribution of Physicians Planning to Retire or Reducethe Scope of Practice Within the Next Five Years by Age Category
0
5%
10%
15%
20%
25%
30%
35%
40%
86–9676–8566–7556–6546–5536–4525–35
YesNo
AGE CATEGORY
Figure 10. Top Reasons for Changing the Scopeof Practice in the Last Two Years
Retirement, 4.89%
Liability, 27.38%
Reimbursement24.36%
LifestyleConsiderations
20.46%
Regulatory andAdministrative Burden
12.11%
Other10.81%

The top three reasons seemed to differ by gender. While the top choice for male was liability (28.4%),followed by reimbursement (24.8%), and lifestyle considerations (18.9%), the top choice for femalephysicians was lifestyle considerations (26.4%), followed by liability (23.6%), and reimbursement(22.8%) (see Figure 11).
EMERGENCY CALLA total of 6,758 physicians (32.1%) responded to this question and indicated that they provide clinicalcare in a hospital emergency department, with 22 percent of those (n= 1,431) indicating that they workfull-time in an emergency department.10 Analyzed by gender, only 23.5 percent of females were workingemergency on-call hours or in emergency departments, compared to 34.7 percent of males (see Figure12).
Of the 6,758 physicians responding to this question, who take emergency call or otherwise workclinically in a hospital emergency department, 78.4 percent (5,208) took emergency call on the basis ofon-call specialty, while the remaining 21.6 percent performed this duty full time.
28
0%
6%
12%
18%
24%
30%
OtherLifestyleConsiderations
RetirementRegulatoryand
AdministrativeBurden
Reimburse-ment
Liability
MaleFemale
Figure 11. Top Reasons for Changing the Scope of Practice by Gender
23.62 28.36 22.81 24.77 11.21 12.34 3.12 5.29 26.43 18.92 12.81 10.32
Figure 12. Distribution of Gender by Emergency Call
0
10%
20%
30%
40%
50%
60%
70%
80%
YesNo
76.46 65.32 23.54 34.68
MaleFemale
10The percentage isbased on the 6,639
physicians who indicatedeither on-call specialty or
full-time, excluding 110missing cases.

As Figure 13 shows, the majority (52.9%; n= 2,826) of those taking emergency call stated that they aredoing so in just one hospital. Also, 40% (n= 2,124) of the respondents performed emergency call only1–4 days per month (see Figure 14). Of note, the majority (52.8%) of female physicians took emergencycall from 1–4 days per month, followed by 5–9 (29.6%), and 10 or more (17.6%). Male physicians tookemergency call 1–4 days per month (38%), 5–9 days per month (38%), or 10 or more days per month(23.5%).
Eleven percent (n= 567 out of a total of n= 5,179 answering this question) of those taking emergency callhours have decreased the number of hours of emergency call in the last two years (data not shown).
29
Figure 13. Number of HospitalsWhere Respondents Take Emergency Call
22.61%10 or More
37.04%5–9
40.35%1–4
17.75%Three or More
29.33%Two
52.92%One
Figure 14. Number of Days Per MonthTaking Emergency Call

The top reasons were liability, reimbursement, and life considerations, although the order of importancevaried by gender (see Figure 15).
30
Figure 15. Top Reasons for Decreasing Emergency Call by Gender
FEMALE
0%
5%
10%
15%
20%
25%
30%
0%
5%
10%
15%
20%
25%
30%
Liability Reimburse- Lifestyle Impact to Changing Exemption Other ment Consider- Private Practice ations Practice Patterns
22.44% 19.83% 24.84% 13.94% 10.02% 1.96% 6.97%
Liability Reimburse- Lifestyle Impact to Changing Exemption Other ment Consider- Private Practice ations Practice Patterns
28.45% 23.43% 19.96% 12.44% 8.65% 2.01% 5.06%
MALE

RADIOLOGICAL SERVICESCS/CS/SB 770 had clear intent to address identified health access questions, one of which focused on thereading of mammography. Twenty-seven percent (n= 489) of those respondents that perform radiologicalservices indicated that they read mammograms or other breast imaging services.11 Of note, 83 percent ofthose who indicated that they read mammograms or other breast imaging exams were male physicians(data not shown).
Based on the 1,312 respondents who provide radiological services but do not read mammograms orother breast imaging exams, the “other reasons” category represents a 60% majority (see Figure 16). Ofthe identifiable reasons, liability (24.6%) was the top reason for not reading mammograms or otherbreast imaging exams.
Only 49 percent (n= 232) of radiologists who read mammograms or other breast imaging examsindicated that they performed both ultrasound and stereotactic guided core biopsies; additionally, only48.8 percent read breast MRIs (data not shown). In Figure 17, 17.6 percent (n= 230) of those radiologistsreading mammograms or other breast imaging exams indicated that they will either decrease ordiscontinue the number of mammograms read.
OBSTETRIC SERVICESOf the respondents who provide obstetric services (n=1,387), only 40% (n= 554) indicated that theydeliver babies (a total of approximately 540 doctors for this survey cycle). Of those routine deliveries,62% of respondents deliver between 10–30 babies per month. Almost 70% of respondents indicated lessthan 10 high risk deliveries per month and less than 10 Cesarean Section deliveries per month (data notshown). Thirteen percent of respondents plan to discontinue obstetric care in the next two years, manyof whom are less than 65 years of age (see Figure 18).
31
Figure 16. Top Reasons for Not Reading Mammogramsor Other Breast Imaging Exams
Figure 17. The Number of MammogramsRead in the Next Two Years
Liability24.60%
Reimbursement1.13%Uninteresting
Field9.87%
Too Stressful1.78%
Too Much Regulation2.59%
Other60.03% Stay the Same
62.48%Discontinue
8.74%
Decrease8.93%
Increase19.85%
76–851.45%
Figure 18. Obstetricians Who Plan toDiscontinue Obstetric Care in the Next Two Years
25–355.80%
36–4530.43%
46–5530.43%
56–6526.09%
66–755.80%
11The total number ofphysicians who perform
radiological services isdetermined on the basis
of total number ofrespondents who
indicated that they eitherread or do not read
mammograms or otherbreast imaging exams. It is
assumed that those whoresponded to thisquestion provide
radiological servicesregardless of whether they
read mammograms orother breast imaging
exams. There were a totalof 1,801 respondents who
responded to thisquestion.

Discussion and SummationThe development of the Physician Workforce Survey was a direct attempt toaddress the concern of available data needed to assess the adequacy of thephysician workforce, specifically by geographic distribution and specialtymix. The survey is a compilation of questions asking specifics of a physician’s practice status andintended changes. Coupled with demographic data from the Department of Health’s Practitioner Profile,these data create the basis for a centralized repository for a statewide health workforce data system thatoffers a source of valid data to make policy decisions. Yet, this project and process is fluid, and, with thesupport of the state’s governmental and non governmental stakeholders, will continue to make specificand significant progress in refining questions and delving deeper into the available data on the physicianworkforce and its practice patterns. The first reporting for this 2008 survey data is intended to providebaseline numbers and begin establishing parameters for a model that, in future years, will yield enoughinformation to establish physician practice patterns, allow better forecasting of health care servicedelivery, and provide the basis for future policy decisions by state policy makers.
DEMOGRAPHICS AND FLORIDA’S POPULATIONAny reporting on the physician workforce is built upon the demographic features of the active, licensedphysician population. Survey data indicate that only 7,738 of physicians responding to this survey areaged 25–45. Clearly, the age of Florida physicians will impact both the anticipated changes to scopes ofpractice, but also to hours worked per week, and months worked per year. This becomes particularlyrelevant when analyzed by reported specialty, and by response to whether the physician acceptsemergency call.
Another important factor is the growing number of women in medical schools and residency programs.National studies by the American Medical Association and American Association of Medical Collegesindicate that younger female physicians tend to see fewer patients, and work fewer hours per week, thantheir male counterparts until they reach a certain age, then the trend reverses. Also of importance indiscussing gender are the specialty areas that women are choosing, and, again, the impact to the scope oftheir practice and willingness to take emergency call.
Generational issues are also of great importance to predicting the adequacy of the state’s physicianworkforce. Regardless of gender, the survey results indicated that, for the current respondents, lifestyleconsiderations and liability were the top two reasons why physicians between the age of 25 and 35changed the scope of their practice in the last two years.
Lifestyle changes can be precipitated by a number of variables but, for the younger age cohort, practicedecisions are often based on medical debt considerations and hours worked per week. These issues caninfluence the decision to go into a certain specialty or to take emergency call. Generational issues oftencan influence limiting work hours or pursuing other careers or practice opportunities in rural or urbanareas.
PHYSICIAN PRACTICE STATUS Although the American Association of Medical Colleges reports that Florida ranks 15th nationally in thenumber of active physicians per 100,000 population, these national level data do not take in to accountmany factors that determine actively practicing physician numbers. As the current survey attempts tobetter define the number of licensed physicians who are actively practicing medicine in Florida, ofinterest is that only 73% indicate that they practice in Florida at any time per year. When this figure iscombined with information on the other one-half of allopathic physicians in the state, it will likely form a
32

much more accurate picture of the true number of practicing physicians who are actively deliveringpatient care in this state. Further work on determining the number of hours worked, and number ofactual patients seen per week, by specialty and geographic region, will establish a much better picture ofworkforce activity and needs in the state.
SPECIALTYData has been very limited on the specialty mix of Florida physicians, and the 2008 Physician WorkforceSurvey attempted to address the actual clinical practice of licensed, active physicians by their mainspecialty. Combined with geographic and demographic data, this information can portray a moreaccurate picture of potential shortages or access to care issues. Future analysis, combined with nationaltrends and indicators, can aid in the strategic planning of the medical education continuum, includingbetter preparation of future applicants to medical school, the quality of the medical school educationexperience, the development of residency programs to produce physicians needed by Florida’s citizens,and focusing incentives to attract and retain physician in key geographic specialty areas.
PHYSICIAN EDUCATION AND TRAININGOnly 1.8% of those responding to the survey are residents or fellows in training in Florida. Overall,Florida has 3,458 residents in training and 2,632 students currently in medical school. The medicaleducation continuum has received a great deal of attention in attracting and retaining physicians inFlorida. Of note, of the active physicians in the Department of Health’s Physician Practitioner Profile),approximately 15% were trained in a Florida medical school, and almost 24% participated in a residencyin Florida.
All IMGs must take a U.S. medical residency training in an approved program and must pass certainlanguage and skill competency tests to practice. IMGs are an important component of the physicianworkforce, but the overall policy of filling needed positions and practices by utilizing physicians who areoften from resource-poor countries often with a physician scarcity of their own, needs to be evaluated ina more formal process.
SERVICE DELIVERY CONCERNSAdditional concerns impact the state’s physician workforce, including the current practice environmentfor physicians. In Florida, there is concern over several issues, including: malpractice insurance andliability costs, reimbursement rates, administrative burdens, and the impact of Amendment 8, approvedin November 2004 (as codified in Article X, Section 26 of the State Constitution), to prohibit a medicallicense for those physicians with repeated medical malpractice findings. These service delivery concernsmay hinder the recruitment of doctors to Florida based on real or perceived influence of the severity ofthe medical liability climate in Florida. The Physician Workforce Survey will be combined with thefinancial disclosure information as part of physician licensure renewal in the next (2009) report to start toaddress the degree to which liability coverage and malpractice claims influences practice by specialty andlocation.
Additional work will be required to determine the extent to which the physician workforce data indicategaps in coverage for special populations and geographical regions within the state. Survey data indicate,for example, that, of those responding; only 3% of physicians list their primary practice location in arural county. When evaluated by age, gender and specialty, combined with data on health professionalshortage areas and medically underserved areas, there is an area of concern for protecting the health careand access to care for rural communities. Additional analysis needs to be conducted to furtherunderstand the impact of physician coverage on rural and underserved communities.
33

In summary, the creation and implementation of the Physician Workforce Survey has laid a firmfoundation for the Department and the multi-disciplinary stakeholders working on this project to assessand target policies and programs aimed at bolstering Florida’s physician workforce in specific areas ofspecialty and geographic need. A separate strategic planning document will be forthcoming and willinitially focus on medical education, graduate medical education and attracting and retaining physiciansin Florida, but may be used as the blueprint for nursing, dental health and other allied healthprofessions, aimed at supporting access to quality and appropriate care for all Floridians.
34

35
Appendix I—2006 VoluntaryPhysician Workforce Survey
The items below relate to very important questions regarding Florida's current and future physicianworkforce. Your responses will be instrumental in shaping Florida's health care and physician workforcepolicies. Secretary of the Department of Health, M. Rony François, M.D., M.S.P.H., Ph.D., and the Councilof Florida Medical School Deans, Florida Graduate Medical Education Committee, Florida MedicalAssociation and Florida Osteopathic Medical Association appreciate your time and effort in responding tothe eight questions below.
Do you practice medicine at any time during the year in Florida?
How many months/year do you practice medicine in Florida?
In what Florida counties do you practice?(may select up to 5 counties)
Is more than twenty percent (20%) of your practice non-clinical? (i.e. research, teaching, administration)
Are you a resident or fellow?
What is the primary specialty area(s) of your current clinical practice?(may select up to 5 different areas)
Do you currently take emergency call or otherwise work clinically in a hospital emergency department orprovide for the immediate, acute care of trauma patients?
Do you plan to retire, relocate outside of the state of Florida, or significantly reduce the scope of yourpractice within the next five years?
1.
2.
3.
4.
5.
6.
7.
8.
Yes No
5-8 Months 9-12 Months
Note: If you check 'No' then please stop here.
1-20 Hrs/Wk More than 40 Hrs/WkCounty Name Numeric Code 21-40 Hrs/Wk
Yes No
Yes No
1-20% 81-100%Specialty Area Numeric Code 41-60%21-40% 61-80%
Yes No
Yes No
PHYSICIAN WORKFORCE QUESTIONNAIRE
Name: License Number:
Please note - County Names and Numeric Codes are listed on the
Please note - Specialty Areas and Numeric Codes are listed on the
FirstName MI. LastName ME 123456789
* ME0123456789*
Please print or type County Names and Numeric Codes below. back side of the form.
Please print or type back side of the form.
Specialty Areas and Numeric Codes below.
1-4 Months
a.b.c.d.e.
a.b.c.d.e.
11 ALACHUA12 BAKER13 BAY14 BRADFORD15 BREVARD16 BROWARD17 CALHOUN18 CHARLOTTE19 CITRUS20 CLAY21 COLLIER22 COLUMBIA23 DADE24 DESOTO
25 DIXIE26 DUVAL27 ESCAMBIA28 FLAGLER29 FRANKLIN30 GADSDEN31 GILCHRIST32 GLADES33 GULF34 HAMILTON35 HARDEE36 HENDRY37 HERNANDO38 HIGHLANDS
39 HILLSBOROUGH40 HOLMES41 INDIAN RIVER42 JACKSON43 JEFFERSON44 LAFAYETTE45 LAKE46 LEE47 LEON48 LEVY49 LIBERTY50 MADISON51 MANATEE52 MARION
53 MARTIN54 MONROE55 NASSAU56 OKALOOSA57 OKEECHOBEE58 ORANGE59 OSCEOLA60 PALM BEACH61 PASCO62 PINELLAS63 POLK64 PUTNAM65 ST.JOHNS66 ST.LUCIE
67 SANTA ROSA68 SARASOTA69 SEMINOLE70 SUMTER71 SUWANNEE72 TAYLOR73 UNION74 VOLUSIA75 WAKULLA76 WALTON77 WASHINGTON78 UNKNOWN79 OUT OF STATE80 FOREIGN
020 ALLERGY AND IMMUNOLOGY040 ANESTHESIOLOGY045 CRITICAL CARE MEDICINE048 PAIN MEDICINE042 PEDIATRIC ANESTHESIOLOGY060 COLON AND RECTAL SURGERY080 DERMATOLOGY100 DERMATOPATHOLOGY081 PROCEDURAL DERMATOLOGY
118 MEDICAL TOXICOLOGY114 PEDIATRIC EMERGENCY MEDICINE116 SPORTS MEDICINE119 UNDERSEA AND HYPERBARIC MEDICINE120 FAMILY MEDICINE125 GERIATRIC MEDICINE127 SPORTS MEDICINE140 INTERNAL MEDICINE141 CARDIOVASCULAR DISEASE154 CLINICAL CARDIAC ELECTROPHYSIOLOGY142 CRITICAL CARE MEDICINE143 ENDOCRINOLOGY, DIABETES, AND METABOLISM144 GASTROENTEROLOGY151 GERIATRIC MEDICINE145 HEMATOLOGY155 HEMATOLOGY AND ONCOLOGY146 INFECTIOUS DISEASE152 INTERVENTIONAL CARDIOLOGY148 NEPHROLOGY147 ONCOLOGY149 PULMONARY DISEASE156 PULMONARY DISEASE AND CRITICAL CARE MEDICINE150 RHEUMATOLOGY157 SPORTS MEDICINE130 MEDICAL GENETICS190 MOLECULAR GENETIC PATHOLOGY160 NEUROLOGICAL SURGERY180 NEUROLOGY185 CHILD NEUROLOGY187 CLINICAL NEUROPHYSIOLOGY183 NEUROMUSCULAR MEDICINE186 NEURODEVELOPMENTAL DISABILITIES181 PAIN MEDICINE188 VASCULAR NEUROLOGY200 NUCLEAR MEDICINE220 OBSTETRICS AND GYNECOLOGY240 OPHTHALMOLOGY260 ORTHOPAEDIC SURGERY261 ADULT RECONSTRUCTIVE ORTHOPAEDICS262 FOOT AND ANKLE ORTHOPAEDICS263 HAND SURGERY270 MUSCULOSKELETAL ONCOLOGY268 ORTHOPAEDIC SPORTS MEDICINE267 ORTHOPAEDIC SURGERY OF THE SPINE269 ORTHOPAEDIC TRAUMA265 PEDIATRIC ORTHOPAEDICS280 OTOLARYNGOLOGY286 NEUROTOLOGY288 PEDIATRIC OTOLARYNGOLOGY300 PATHOLOGY-ANATOMIC AND CLINICAL
305 BLOOD BANKING/TRANSFUSION MEDICINE306 CHEMICAL PATHOLOGY307 CYTOPATHOLOGY310 FORENSIC PATHOLOGY311 HEMATOLOGY314 MEDICAL MICROBIOLOGY315 NEUROPATHOLOGY316 PEDIATRIC PATHOLOGY301 SELECTIVE PATHOLOGY320 PEDIATRICS321 ADOLESCENT MEDICINE329 NEONATAL-PERINATAL MEDICINE325 PEDIATRIC CARDIOLOGY323 PEDIATRIC CRITICAL CARE MEDICINE324 PEDIATRIC EMERGENCY MEDICINE326 PEDIATRIC ENDOCRINOLOGY332 PEDIATRIC GASTROENTEROLOGY327 PEDIATRIC HEMATOLOGY/ONCOLOGY335 PEDIATRIC INFECTIOUS DISEASES328 PEDIATRIC NEPHROLOGY330 PEDIATRIC PULMONOLOGY331 PEDIATRIC RHEUMATOLOGY333 PEDIATRIC SPORTS MEDICINE336 DEVELOPMENTAL-BEHAVIORAL PEDIATRICS340 PHYSICAL MEDICINE AND REHABILITATION341 PAIN MEDICINE346 PEDIATRIC REHABILITATION345 SPINAL CORD INJURY MEDICINE360 PLASTIC SURGERY361 CRANIOFACIAL CURGERY363 HAND SURGERY380 PREVENTIVE MEDICINE 399 MEDICAL TOXICOLOGY398 UNDERSEA AND HYPERBARIC MEDICINE400 PSYCHIATRY401 ADDICTION PSYCHIATRY405 CHILD AND ADOLESCENT PSYCHIATRY406 FORENSIC PSYCHIATRY407 GERIATRIC PSYCHIATRY402 PAIN MEDICINE409 PSYCHOSOMATIC MEDICINE420 RADIOLOGY DIAGNOSTIC421 ABDOMINAL RADIOLOGY429 CARDIOTHORACIC RADIOLOGY422 ENDOVASCULAR SURGICAL NEURORADIOLOGY426 MUSCULOSKELETAL RADIOLOGY423 NEURORADIOLOGY425 NUCLEAR RADIOLOGY424 PEDIATRIC RADIOLOGY427 VASCULAR AND INTERVENTIONAL RADIOLOGY
520 SLEEP MEDICINE440 SURGERY-GENERAL443 HAND SURGERY445 PEDIATRIC SURGERY442 SURGICAL CRITICAL CARE450 VASCULAR SURGERY460 THORACIC SURGERY480 UROLOGY485 PEDIATRIC UROLOGY999 OTHER
110 EMERGENCY MEDICINE
County Names and Numeric Codes (Reference for question # 3)
Specialty Areas and Numeric Codes (Reference for question # 6) 000 NO CLINICAL PRACTICE
430 RADIATION ONCOLOGY

36
64B-9.002 Physician Survey Procedures. (1) At time of licensure renewal, each medical doctor and osteopathic physician who renews his or her license on line at
www.FLHealthSource.com must fully complete on line all applicable portions of the physician workforce survey, form DH-MQA 1119, entitled Physician Workforce Survey, effective 07/08, which is incorporated herein by reference and also may be viewed at http://www.doh.state.fl.us/mqa/medical/index.html or at http://www.doh.state.fl.us/mqa/osteopath/index.html. The address where physicians who do not renew online are required to obtain, complete and submit a paper copy of the survey with their renewal is 4052 Bald Cypress Way, Bin #C10, Tallahassee, FL 32399.
(2) The nondisciplinary citation issued to a licensee for failing to complete the survey shall be sent by regular U.S. mail to the licensee’s last address of record. The license renewal notice warning of the prohibition against renewal without first completing the survey shall be sent by regular U.S. mail to the licensee’s last address of record, and the license shall not be renewed until the survey has been completed. Specific Authority 458.3191(4), 459.0081(4) FS. Law Implemented 381.4018, 458.3191, 459.0081 FS. History–New 4-21-08, Amended 10-20-08.
Appendix II—Chapter 64B-9.002

37
PHYSICIAN WORKFORCE SURVEYGovernor Charlie Crist, State Surgeon General Ana Viamonte Ros and the Florida Legislature recognize the importance of assessing Florida’s current and future physician workforce. Critical legislation was passed last year that requires the Department of Health to evaluate the geographic distribution and specialty mix of active Florida physicians. Please refer to F.S. 381.4018 Physician workforce assessment and development. The questions in this physician workforce survey will be instrumental in shaping Florida’s health care and physician workforce policies. Your time and effort in responding to the questions below is appreciated.
Instructions for completing the survey:Questions 1 - 12 apply to all physiciansIf you are an on-call specialist taking emergency call in an emergency department, please also answer questions 13 - 16If you provide only radiological services, please also answer questions 17 - 25If you provide obstetric services, please also answer questions 26 - 32
1. Do you practice medicine at any time during the year in Florida?Yes.No. Please stop here and review the Affirmation Statement on page 4.
2. How many months per year do you practice in Florida?1-4 Months5-8 Months9-12 Months
3. In what Florida County(ies) is your medical practice located? (May select up to 5 counties - See p. 5 for county codes) For each county selected: How many hours per week do you practice in each setting?County Name Numeric Code 1-20 Hrs/Wk 21-40 Hrs/Wk > 40 Hrs/Wk
4. Are you in a solo practice? YesNo
5. Which practice setting best describes where the majority of your time is spent? (Choose Only One)Private Office SettingFederally Qualified Health CenterGovernmental Clinical Setting (for example: County Health Department)Federal Healthcare Facility (for example: military or VA)Hospital-Outpatient Department/ServiceHospital-Inpatient Hospital Emergency DepartmentHospital Other (for example: hospital-based radiologist, pathologist, anesthesiologist or medical director)Nursing Home/Extended Care FacilityAmbulatory Surgery Center/Free-Standing Imaging Diagnostic CenterOther Setting
6. Are you currently enrolled in an internship, residency program or fellowship program?YesNo
of 61DH-MQA 1119, 02/08rule number 64B-9.002
7. Does more than 20 percent of your practice include non clinical work (research, teaching, administration)?
YesNo
8. List your primary specialty area, and any additional specialties, of your current clinical practice and the percentage of time you spend working in that area: (Select up to 5 Areas - See p. 6 for specialty codes)
Specialty Area Numeric Code 1-20% 21-40% 41-60% 61-80% 81-100%
9. Do you plan to retire, relocate outside of the State of Florida, or significantly reduce the scope of your practice within the next five years?
YesNo
10. If you have changed the scope of your practice in the last two years, what are the reasons for the change (Choose All That Apply)?
LiabilityReimbursementRegulatory and Administrative BurdenRetirementLifestyle Considerations, Other than RetirementOther
11. Do you currently take emergency call or otherwise work clinically in a hospital emergency department or provide for the immediate, acute care of trauma patients?
YesNoExempt Due to Medical Staff Bylaws
12. If you take emergency call or otherwise work clinically in a hospital emergency department, are youFull TimeOn-Call Specialty
For on-call specialists taking emergency call in an emergency department please answer questions 13 - 16
13. At how many hospitals do you currently take emergency call?OneTwoThree or greater
14. How many days per month do you take call?1-45-910 or greater
15. If you have taken hospital emergency department call during the past 2 years, has the number of emergency on-call hours that you work:
IncreasedDecreasedStayed the Same
of 62DH-MQA 1119, 02/08rule number 64B-9.002
16. If you have decreased or plan to decrease or stop taking emergency department call, please check any reason that applies
LiabilityReimbursementLifestyle ConsiderationsImpact to Private PracticeChanging Practice PatternsExemptionOther
For physicians that provide only radiological services, please answer questions 17 - 25
17. Do you read mammograms or other breast imaging exams?YesNo
18. If you do not read mammograms or other breast imaging exams, please choose the most important reason why:
LiabilityReimbursementUninteresting FieldToo StressfulToo Much RegulationOther
If you read mammograms, please continue. If you do not read mammograms, please skip to question 26.
19. Do you read screening mammograms? YesNo
20. Do you read diagnostic mammograms and sonograms?YesNo
21. Do you perform BOTH ultrasound and stereotactic guided core biopsies?YesNo
22. Do you read breast MRIs?YesNo
23. Do you read breast MRIs AND perform MRI guided core biopsies?Yes No
24. In the next two years, will the number of mammograms you read change for any reason, including retirement:
IncreaseDecreaseStay the SameDiscontinue
of 63DH-MQA 1119, 02/08rule number 64B-9.002
25. Have you done a 6-month or greater breast imaging fellowship?YesNo
For physicians that provide obstetric services only, please answer questions 26 - 32
26. Do you deliver babies?YesNo. Thank you for taking this survey. Please review the Affirmation Statement on page 4.
27. How many routine deliveries per month?NoneLow, < 10 per monthMedium, 10-30 per monthHigh, >30 per month
28. How many high risk deliveries per month?NoneLow, < 10 per monthMedium, 10-30 per monthHigh, >30 per month
29. How many c-sections per month?NoneLow, < 10 per monthMedium, 10-30 per monthHigh, >30 per month
30. How many emergency room deliveries per month for patients having minimal or no "known" prenatal care?
NoneLow, < 10 per monthMedium, 10-30 per monthHigh, >30 per month
31. How many assists or consultative services per month?NoneLow, < 10 per monthMedium, 10-30 per monthHigh, >30 per month
32. Are you planning to discontinue doing obstetric care for any reason, including retirement, in the next two years?
YesNo
STATEMENT:I have completed the survey to the extent that it is applicable to me. This information provided is true and accurate to the best of my knowledge and the submission does not contain any knowingly false information.
of 64DH-MQA 1119, 02/08rule number 64B-9.002
Appendix III—2007 MandatoryPhysician Workforce Survey

38
25. Have you done a 6-month or greater breast imaging fellowship?YesNo
For physicians that provide obstetric services only, please answer questions 26 - 32
26. Do you deliver babies?YesNo. Thank you for taking this survey. Please review the Affirmation Statement on page 4.
27. How many routine deliveries per month?NoneLow, < 10 per monthMedium, 10-30 per monthHigh, >30 per month
28. How many high risk deliveries per month?NoneLow, < 10 per monthMedium, 10-30 per monthHigh, >30 per month
29. How many c-sections per month?NoneLow, < 10 per monthMedium, 10-30 per monthHigh, >30 per month
30. How many emergency room deliveries per month for patients having minimal or no "known" prenatal care?
NoneLow, < 10 per monthMedium, 10-30 per monthHigh, >30 per month
31. How many assists or consultative services per month?NoneLow, < 10 per monthMedium, 10-30 per monthHigh, >30 per month
32. Are you planning to discontinue doing obstetric care for any reason, including retirement, in the next two years?
YesNo
STATEMENT:I have completed the survey to the extent that it is applicable to me. This information provided is true and accurate to the best of my knowledge and the submission does not contain any knowingly false information.
of 64DH-MQA 1119, 02/08rule number 64B-9.002
11 ALACHUA12 BAKER13 BAY14 BRADFORD15 BREVARD16 BROWARD17 CALHOUN18 CHARLOTTE19 CITRUS20 CLAY21 COLLIER22 COLUMBIA23 DADE24 DESOTO
25 DIXIE26 DUVAL27 ESCAMBIA28 FLAGLER29 FRANKLIN30 GADSDEN31 GILCHRIST32 GLADES33 GULF34 HAMILTON35 HARDEE36 HENDRY37 HERNANDO38 HIGHLANDS
39 HILLSBOROUGH40 HOLMES41 INDIAN RIVER42 JACKSON43 JEFFERSON44 LAFAYETTE45 LAKE46 LEE47 LEON48 LEVY49 LIBERTY50 MADISON51 MANATEE52 MARION
53 MARTIN54 MONROE55 NASSAU56 OKALOOSA57 OKEECHOBEE58 ORANGE59 OSCEOLA60 PALM BEACH61 PASCO62 PINELLAS63 POLK64 PUTNAM65 ST.JOHNS66 ST.LUCIE
67 SANTA ROSA68 SARASOTA69 SEMINOLE70 SUMTER71 SUWANNEE72 TAYLOR73 UNION74 VOLUSIA75 WAKULLA76 WALTON77 WASHINGTON78 UNKNOWN79 OUT OF STATE80 FOREIGN
County Names and Numeric Codes (Reference for question # 3)
See reverse side for specialty codes.
of 65DH-MQA 1119, 02/08rule number 64B-9.002
020 ALLERGY AND IMMUNOLOGY040 ANESTHESIOLOGY045 CRITICAL CARE MEDICINE048 PAIN MEDICINE042 PEDIATRIC ANESTHESIOLOGY060 COLON AND RECTAL SURGERY080 DERMATOLOGY100 DERMATOPATHOLOGY081 PROCEDURAL DERMATOLOGY
118 MEDICAL TOXICOLOGY114 PEDIATRIC EMERGENCY MEDICINE116 SPORTS MEDICINE119 UNDERSEA AND HYPERBARIC MEDICINE120 FAMILY MEDICINE125 GERIATRIC MEDICINE127 SPORTS MEDICINE140 INTERNAL MEDICINE141 CARDIOVASCULAR DISEASE154 CLINICAL CARDIAC ELECTROPHYSIOLOGY142 CRITICAL CARE MEDICINE143 ENDOCRINOLOGY, DIABETES, AND METABOLISM144 GASTROENTEROLOGY151 GERIATRIC MEDICINE145 HEMATOLOGY155 HEMATOLOGY AND ONCOLOGY146 INFECTIOUS DISEASE152 INTERVENTIONAL CARDIOLOGY148 NEPHROLOGY147 ONCOLOGY149 PULMONARY DISEASE156 PULMONARY DISEASE AND CRITICAL CARE MEDICINE150 RHEUMATOLOGY157 SPORTS MEDICINE130 MEDICAL GENETICS190 MOLECULAR GENETIC PATHOLOGY160 NEUROLOGICAL SURGERY180 NEUROLOGY185 CHILD NEUROLOGY187 CLINICAL NEUROPHYSIOLOGY183 NEUROMUSCULAR MEDICINE186 NEURODEVELOPMENTAL DISABILITIES181 PAIN MEDICINE188 VASCULAR NEUROLOGY200 NUCLEAR MEDICINE220 OBSTETRICS AND GYNECOLOGY240 OPHTHALMOLOGY260 ORTHOPAEDIC SURGERY261 ADULT RECONSTRUCTIVE ORTHOPAEDICS262 FOOT AND ANKLE ORTHOPAEDICS263 HAND SURGERY270 MUSCULOSKELETAL ONCOLOGY268 ORTHOPAEDIC SPORTS MEDICINE267 ORTHOPAEDIC SURGERY OF THE SPINE269 ORTHOPAEDIC TRAUMA265 PEDIATRIC ORTHOPAEDICS280 OTOLARYNGOLOGY286 NEUROTOLOGY288 PEDIATRIC OTOLARYNGOLOGY300 PATHOLOGY-ANATOMIC AND CLINICAL
305 BLOOD BANKING/TRANSFUSION MEDICINE306 CHEMICAL PATHOLOGY307 CYTOPATHOLOGY310 FORENSIC PATHOLOGY311 HEMATOLOGY314 MEDICAL MICROBIOLOGY315 NEUROPATHOLOGY316 PEDIATRIC PATHOLOGY301 SELECTIVE PATHOLOGY320 PEDIATRICS321 ADOLESCENT MEDICINE329 NEONATAL-PERINATAL MEDICINE325 PEDIATRIC CARDIOLOGY323 PEDIATRIC CRITICAL CARE MEDICINE324 PEDIATRIC EMERGENCY MEDICINE326 PEDIATRIC ENDOCRINOLOGY332 PEDIATRIC GASTROENTEROLOGY327 PEDIATRIC HEMATOLOGY/ONCOLOGY335 PEDIATRIC INFECTIOUS DISEASES328 PEDIATRIC NEPHROLOGY330 PEDIATRIC PULMONOLOGY331 PEDIATRIC RHEUMATOLOGY333 PEDIATRIC SPORTS MEDICINE336 DEVELOPMENTAL-BEHAVIORAL PEDIATRICS340 PHYSICAL MEDICINE AND REHABILITATION341 PAIN MEDICINE346 PEDIATRIC REHABILITATION345 SPINAL CORD INJURY MEDICINE360 PLASTIC SURGERY361 CRANIOFACIAL CURGERY363 HAND SURGERY380 PREVENTIVE MEDICINE 399 MEDICAL TOXICOLOGY398 UNDERSEA AND HYPERBARIC MEDICINE400 PSYCHIATRY401 ADDICTION PSYCHIATRY405 CHILD AND ADOLESCENT PSYCHIATRY406 FORENSIC PSYCHIATRY407 GERIATRIC PSYCHIATRY402 PAIN MEDICINE409 PSYCHOSOMATIC MEDICINE420 RADIOLOGY DIAGNOSTIC421 ABDOMINAL RADIOLOGY429 CARDIOTHORACIC RADIOLOGY422 ENDOVASCULAR SURGICAL NEURORADIOLOGY426 MUSCULOSKELETAL RADIOLOGY423 NEURORADIOLOGY425 NUCLEAR RADIOLOGY424 PEDIATRIC RADIOLOGY427 VASCULAR AND INTERVENTIONAL RADIOLOGY
520 SLEEP MEDICINE440 SURGERY-GENERAL443 HAND SURGERY445 PEDIATRIC SURGERY442 SURGICAL CRITICAL CARE450 VASCULAR SURGERY460 THORACIC SURGERY480 UROLOGY485 PEDIATRIC UROLOGY999 OTHER
110 EMERGENCY MEDICINE
Specialty Areas and Numeric Codes (Reference for question # 8)
000 NO CLINICAL PRACTICE
430 RADIATION ONCOLOGY
of 66DH-MQA 1119, 02/08rule number 64B-9.002
Appendix III—2007 MandatoryPhysician Workforce Survey

Appendix IV—2008 MandatoryPhysician Workforce Survey
39
PHYSICIAN WORKFORCE SURVEY
Governor Charlie Crist, Surgeon General Viamonte the of and Section 381.4018, Florida the Department of Health evaluate the and specialty mix of active Physicians through this
Your be in Your and effort in completing below is appreciated.
License Number______________________Name____________________________Profession______________
State Ana Ros and Florida Legislature recognize the importance
assessing Florida’s current future physician workforce. Statutes requires that
geographic distribution Florida
survey. responses will instrumental shaping Florida’s healthcare policies. time
the questions
Instructions:
Questions 1 18 apply to all physicians Questions 19 28 apply to only physicians who provide radiological services Questions 29 35 apply to only physicians who provide obstetric services or deliver babies.
1. Do you practice medicine at any time during the year in Florida?
O Yes. If yes, please proceed to the question 2. O No. If No,
a. The main reason you have a Florida license and don’t practice medicine is (choose only one) O Retired O Liability O Reimbursement O Planning to move to Florida
O Do not maintain a full time residence in Florida O Other
b. Do you plan to relocate to Florida?
O In 1 2 years O In 3 4 years O Do not plan to relocate
c. My specialty is: _________________________________________
(please use drop down menu of specialty choices see page 10)
If you do not medicine or otherwise work as a physician in Florida, you are now finished the Thank you.
practice
with survey.
2. How many months did you practice in Florida in the last 12 months?
O 1 2 months O 7 8 months O 3 4 months O 9 10 months O 5 6 months O 11 12 months
DH MQA 1119, 07/08
Rule Number 64B-9.002 Page 1 of 11
PHYSICIAN WORKFORCE SURVEY
3. Of your total hours worked in a week, what amount of time do you spend on: a. Patient care (office and b. Administrative Matters c. Research and Teaching hospital) O 0 5 O 0 5
O 0 5 O 6 10 O 6 10 O 6 10 O 11 15 O 11 15 O 11 15 O 16 20 O 16 20 O 16 20 O 21 25 O 21 25 O 21 25 O 26 30 O 26 30 O 26 30 O 31 35 O 31 35 O 31 35 O 36 40 O 36 40 O 36 40 O 41 45 O 41 45 O 41 45 O 46 50 O 46 50 O 46 50 O 51 54 O 51 54 O 51 54 O 55 60 O 55 60 O 55 60 O 61 or more O 61 or more O 61 or more
4. How many patients do you see per week?
O 0 25 O 126 150 O 26 50 O 151 175 O 51 75 O 176 200 O 76 100 O 201 or more O 101 125
5. Which setting best describes where themajority of your practice occurs? (Choose only one)
O Office Practice Solo Practice O Volunteer Free Clinic O Office Practice Group Practice – Single specialty O County Health Department O Office Practice Group Practice – Multi specialty O Urgent Care Center O Federally Qualified Community Health Center O Ambulatory Surgery Center O Nursing Home / Extended Care Facility O Hospital Emergency Room OMedical School or Parent University O Hospital Outpatient Dept O Hospital – Hospital Based Physician (Non Emergency) O Hospital – Hospitalist O Hospital – Other O Other
a. If you are an employed physician, is your employer: OMedical School or Parent University O Government Agency O Staff or Group HMO O None of the Above
DH MQA 1119, 07/08
Rule Number 64B-9.002 Page 2 of 11
PHYSICIAN WORKFORCE SURVEY
6. Please list your primary and otherwork locations by county (Please use county list provided see page 9). Numeric Code
County Name 0 10 Hrs Per Week
11 20 Hrs Per Week
21 29 Hrs Per Week
30 39 Hrs Per Week
40 49 Hrs Per Week
50 or More Hrs Per Week
7. Are you currently enrolled in an internship, residency, or fellowship program?
O Yes _______________________(Specialty) __________(Year) (please use list of specialties provided) O No
8. What was your total debt at the time of graduation from medical school? O No Debt O Less than $25,000 OMore than $25,000, but less than $50,000 OMore than $50,000, but less than $75,000 OMore than $75,000, but less than $100,000 OMore than $100,000, but less than $125,000 OMore than $125,000, but less than $150,000 O $150,000 or more
If you are currently enrolled in an internship, residency or fellowship program, please stop here. Thank you for your in completing this survey.time
9. Did you complete a post residency or sub specialty fellowship?
O Yes _______________________(Specialty) __________(Year) (please use list of specialties provided) O No
10 . Do you have hospital privileges?
O Yes �
O No a. If yes, at how many individual hospitals?
O 1 O 2 O 3 O 4 or more
DH MQA 1119, 07/08
Rule Number 64B-9.002 Page 3 of 11
PHYSICIAN WORKFORCE SURVEY
11. Do you take emergency call or otherwise work clinically in a hospital emergency department? O Yes O No. (Please move to Question 12) O Exempt Due to Medical Staff By laws. (Please move to Question 12) If yes, are you: O Full Time. Please move to question 12.
O On Call Specialty. Please answer the following questions: a. At how many individual hospitals?
O 1 O 2 O 3 O 4 or more
b. How many days per month do you take emergency call?
O 1 2 O 3 4 O 5 6 O 7 8 O 9 10 O 11 or more
c. During the past 2 years, has the number of emergency on call days
O Increased O Decreased
O Stayed the same 12. Do you take trauma call, or attend to trauma patients, at a verified trauma center?
O Yes O No. If no, please move to question 13
a. If yes, which type?
O Level I O Level II O Pediatric
13. Are you currently accepting new patients covered by Medicare in your practice?
O Yes O No 14. Are you currently accepting new patients covered by Medicaid in your practice?
O Yes O No
DH MQA 1119, 07/08
Rule Number 64B-9.002 Page 4 of 11

40
PHYSICIAN WORKFORCE SURVEY
15. Do you plan to retire in the next 5 years? O Yes O No a. If yes, the main reason for retiring:
O Time to retire O Family OMedical liability risks and/or associated costs O Reimbursement O Looking for a change
O Other
16. Do you plan to move to work in another state in the next 5 years? O Yes No a. If yes, the main reason for moving to work in another state:
O Family OMedical liability risks and/or associated costs O Reimbursement O Looking for a change O Education / training in another state O Other
17. Do you plan to change your specialty in the next 5 years?
O Yes O No a. If yes, the main reason for changing your specialty:
O Family OMedical liability risks and/or associated costs O Reimbursement O Looking for a change O Education / training in another state O Other
18. List your primary specialty area of you current clinical practice, and any additional specialty areas of your current clinical practice and how many hours per week in each setting?
umeric ode
Specialty Area (Please use specialty
list provided-see page 10 )
0 10 Hrs Per Week
11 20 Hrs Per Week
21 29 Hrs Per Week
30 39 Hrs Per Week
40 49 Hrs Per Week
50 or More Hrs Per Week
DH MQA 1119, 07/08
Rule Number 64B-9.002 Page 5 of 11
PHYSICIAN WORKFORCE SURVEY
All other physicians please stop here. Thank you for your time and effort to complete this important workforce survey.
For physicians that provide radiological services, please answer questions 19 28. If you provide obstetric services or deliver babies, please answer questions 29 35.
19. Are you board certified? O Yes Year ________ O No O Recertified? Year_______
20. Are you subspecialty certified? O Yes Year______
O No 21. Do you have CAQ (Certificate of Added Qualifications) Recertification?
O Yes Year (______) O No
22. Do you see a particular category of patients? (Choose all that apply)
O Mammography O General Radiology O GI Radiology O Nuclear Medicine O Neuroradiology O Cardiothoracic Radiology O GU Radiology O Musculoskeletal Radiology O Pediatric Radiology O Interventional Radiology
a. If you checked that mammography is part of your practice do you: Read screening mammograms? O Yes O No Read diagnostic mammograms and sonograms? O Yes O No Read breast MRI’s O Yes O No Read MRI guided core biopsies? O Yes O No Perform ultrasound & stereotactic guided core biopsies? O Yes O No
b. If mammography is not part of your clinical practice, please choose the most important reason why not: O Liability O Reimbursement
O Too stressful O Too much regulation O Not interested O Other
23. Do you consider yourself a pediatric radiologist? O Yes O No. Please move to question 25.
DH MQA 1119, 07/08
Rule Number 64B-9.002 Page 6 of 11
PHYSICIAN WORKFORCE SURVEY
a. If you consider yourself a pediatric radiologist, do you practice: OMusculoskeletal O Neuroradiology O Nuclear Medicine O Interventional Radiology O General
24. Check your type of work location (one or more)
O Hospital O Stand alone Imaging Center O Hospital based Imaging Center O Off site (Internet based) Radiology O Multispecialty Group Imaging Center O Other
25. Do you use an outside service (Teleradiology)?
O Yes O No a. If yes, which services do you use (one or more):
O Day coverage O In state physicians O Night coverage
O Out of state physicians O Subspecialty consultations O Out of country physicians
O Other 26. Do you treat under insured patients?
O Yes O No
27. Do you treat uninsured patients?
O Yes O No
28. Are you a radiation oncologist?
O Yes O No. Please stop here. Thank you for your time and effort to complete this survey. a. If yes, are you certified by the American Board of Therapeutic Radiology?
O Yes O No
DH MQA 1119, 07/08
Rule Number 64B-9.002 Page 7 of 11
PHYSICIAN WORKFORCE SURVEY
If you are a physician providing radiological services, please stop here. you for the survey. For Physicians that provide obstetric services or deliver babies, please answer questions 29 35
Thank completing
29. Do you deliver babies?
O Yes O No (if no, please stop here).
30.How many routine deliveries do you perform per month? O None O Low, < 10 per month OMedium, < 10 30 per month O High, >30 per month
31.How many high risk deliveries do you perform per month? O None O Low, < 10 per month OMedium, < 10 30 per month O High, >30 per month
32. How many C Sections do you perform per month? O None O Low, < 10 per month OMedium, < 10 30 per month O High, >30 per month
33. How many emergency room deliveries do you perform per month for patients having minimal or no “known” prenatal care? O None O Low, < 10 per month OMedium, < 10 30 per month O High, >30 per month
34. How many assists or consultative services do you perform per month? O None O Low, < 10 per month OMedium, < 10 30 per month O High, >30 per month
35. Are you planning to discontinue doing obstetric care for any reason, including retirement, in the next two years? O Yes O No
STATEMENT: I have completed the survey to the extent that it is applicable to me. This information provided is true and accurate to the best of my knowledge and the submission does not contain any knowingly false information.
DH MQA 1119, 07/08
Ru ml be Nuer 64B-9.002 Page 8 of 11
Appendix IV—2008 MandatoryPhysician Workforce Survey

41
County Names and Numeric Codes 11 ALACHUA 34 HAMILTON 12 BAKER 35 HARDEE 13 BAY 36 HENDRY 14 BRADFORD 37 HERNANDO 15 BREVARD 38 HIGHLANDS 16 BROWARD 39 HILLSBOROUGH 17 CALHOUN 40 HOLMES 18 CHARLOTTE 41 INDIAN RIVER 19 CITRUS 42 JACKSON 20 CLAY 43 JEFFERSON 21 COLLIER 44 LAFAYETTE 22 COLUMBIA 45 LAKE 23 DADE 46 LEE 24 DESOTO 47 LEON 25 DIXIE 48 LEVY 26 DUVAL 49 LIBERTY 27 ESCAMBIA 50 MADISON 28 FLAGLER 51 MANATEE 29 FRANKLIN 52 MARION 30 GADSDEN 53 MARTIN 31 GILCHRIST 54 MONROE 32 GLADES 55 NASSAU 33 GULF 56 OKALOOSA
57 OKEECHOBEE 58 ORANGE 59 OSCEOLA 60 PALM BEACH 61
62
63
64
65
66
67
68
69
70
71
72
73
74
75
76
77
PASCO PINELLAS POLK PUTNAM ST.JOHNS ST.LUCIE SANTA ROSA SARASOTA SEMINOLE SUMTER SUWANNEE TAYLOR UNION VOLUSIA WAKULLA WALTON WASHINGTON
78 UNKNOWN 79 OUT OF STATE
List of Specialties 020 ALLERGY AND IMMUNOLOGY
040 ANESTHESIOLOGY
041 ADULT CARDIOTHORACIC ANESTHESIOLOGY
045 CRITICAL CARE MEDICINE
048 PAIN MEDICINE
042 PEDIATRIC ANESTHESIOLOGY
043 HOSPICE AND PALLIATIVE MEDICINE
060 COLON AND RECTAL SURGERY
080 DERMATOLOGY
100 DERMATOPATHOLOGY �
081 PROCEDURAL DERMATOLOGY �
082 PEDIATRIC DERMATOLOGY �
110 EMERGENCY MEDICINE
111 HOSPICE AND PALLIATIVE MEDICINE
112 MEDICAL TOXICOLOGY
113 PEDIATRIC EMERGENCY MEDICINE
114 SPORTS MEDICINE
115 UNDERSEA AND HYPERBARIC MEDICINE
120 FAMILY MEDICINE
125 GERIATRIC MEDICINE �
127 SPORTS MEDICINE �
128 SLEEP MEDICINE �
129 HOSPICE AND PALLIATIVE MEDICINE �
140 INTERNAL MEDICINE
141 CARDIOVASCULAR DISEASE
154 CLINICAL CARDIAC ELECTROPHYSIOLOGY
142 CRITICAL CARE MEDICINE
143 ENDOCRINOLOGY, DIABETES, AND
METABOLISM
144 GASTROENTEROLOGY
151 GERIATRIC MEDICINE
145 HEMATOLOGY
155 HEMATOLOGY AND ONCOLOGY
146 INFECTIOUS DISEASE
152 INTERVENTIONAL CARDIOLOGY
148 NEPHROLOGY
147 ONCOLOGY
149 PULMONARY DISEASE
156 PULMONARY DISEASE AND CRITICAL CARE
MEDICINE�
150 RHEUMATOLOGY �
157 SPORTS MEDICINE �
158 TRANSPLANT HEPATOLOGY �
153 ADOLESCENT MEDICINE �
159 HOSPICE AND PALLIATIVE MEDICINE �
521 MEDICAL ONCOLOGY �
130 MEDICAL GENETICS
190 MOLECULAR GENETIC PATHOLOGY �
191 MEDICAL BIOCHEMICAL GENETICS �
160 NEUROLOGICAL SURGERY
163 ENDOVASCULAR SURGICAL �
NEURORADIOLOGY�
180 NEUROLOGY
185 CHILD NEUROLOGY
187 CLINICAL NEUROPHYSIOLOGY
183 NEUROMUSCULAR MEDICINE
186 NEURODEVELOPMENTAL DISABILITIES
181 PAIN MEDICINE
188 VASCULAR NEUROLOGY
200 NUCLEAR MEDICINE
220 OBSTETRICS AND GYNECOLOGY
221 CRITICAL CARE MEDICINE �
222 GYNECOLOGIC ONCOLOGY �
223 HOSPICE AND PALLIATIVE MEDICINE
224 MATERNAL AND FETAL MEDICINE
225 REPRODUCTIVE ENDOCRINOLOGY /
INFERTILITY
240 OPHTHALMOLOGY
260 ORTHOPAEDIC SURGERY
261 ADULT RECONSTRUCTIVE ORTHOPAEDICS
262 FOOT AND ANKLE ORTHOPAEDICS
263 HAND SURGERY
270 MUSCULOSKELETAL ONCOLOGY
268 ORTHOPAEDIC SPORTS MEDICINE
267 ORTHOPAEDIC SURGERY OF THE SPINE
269 ORTHOPAEDIC TRAUMA
265 PEDIATRIC ORTHOPAEDICS
280 OTOLARYNGOLOGY
286 NEUROTOLOGY
287 PLASTIC SURGERY WITHIN THE HEAD AND
NECK�
289 SLEEP MEDICINE �
288 PEDIATRIC OTOLARYNGOLOGY �
530 PAIN MEDICINE
300 PATHOLOGY-ANATOMIC AND CLINICAL
305 BLOOD BANKING/TRANSFUSION MEDICINE
306 CHEMICAL PATHOLOGY
307 CYTOPATHOLOGY
310 FORENSIC PATHOLOGY
311 HERMATOLOGY
314 MEDICAL MICROBIOLOGY
315 NEUROPATHOLOGY
316 PEDIATRIC PATHOLOGY
301 SURGICAL(SELECTIVE) PATHOLOGY
317 DERMATOPATHOLOGY
318 MOLECULAR GENETIC PATHOLOGY
320 PEDIATRICS
321 ADOLESCENT MEDICINE
329 NEONATAL-PERINATAL MEDICINE
325 PEDIATRIC CARDIOLOGY
323 PEDIATRIC CRITICAL CARE MEDICINE
324 PEDIATRIC EMERGENCY MEDICINE
326 PEDIATRIC ENDOCRINOLOGY
332 PEDIATRIC GASTROENTEROLOGY
327 PEDIATRIC HEMATOLOGY/ONCOLOGY
335 PEDIATRIC INFECTIOUS DISEASES
328 PEDIATRIC NEPHROLOGY
330 PEDIATRIC PULMONOLOGY
331 PEDIATRIC RHEUMATOLOGY
333 PEDIATRIC SPORTS MEDICINE
336 DEVELOPMENTAL- BEHAVIORAL PEDIATRICS
337 CHILD ABUSE PEDIATRICS
338 HOSPICE AND PALLIATIVE MEDICINE
339 MEDICAL TOXICOLOGY
334 NEURODEVELOPMENTAL DISABILITIES
522 SLEEP MEDICINE
523 PEDIATRIC TRANSPLANT HEPATOLOGY
340 PHYSICAL MEDICINE AND REHABILITATION
341 PAIN MEDICINE �
346 PEDIATRIC REHABILITATION �
345 SPINAL CORD INJURY MEDICINE �
347 HOSPICE AND PALLIATIVE MEDICINE �
348 NEUROMUSCULAR MEDICINE �
349 SPORTS MEDICINE �
360 PLASTIC SURGERY
361 CRANIOFACIAL SURGERY
363 HAND SURGERY
364 PLASTIC SURGERY WITHIN THE HEAD AND
Page 10 of 11
NECK
380 PREVENTIVE MEDICINE
399 MEDICAL TOXICOLOGY
398 UNDERSEA AND HYPERBARIC MEDICINE
400 PSYCHIATRY
401 ADDICTION PSYCHIATRY
405 CHILD AND ADOLESCENT PSYCHIATRY
406 FORENSIC PSYCHIATRY
407 GERIATRIC PSYCHIATRY
402 PAIN MEDICINE
409 PSYCHOSOMATIC MEDICINE
430 RADIATION ONCOLOGY
420 RADIOLOGY DIAGNOSTIC
421 ABDOMINAL RADIOLOGY �
429 CARDIOTHORACIC RADIOLOGY �
422 ENDOVASCULAR SURGICAL �
NEURORADIOLOGY
426 MUSCULOSKELETAL RADIOLOGY
423 NEURORADIOLOGY
425 NUCLEAR RADIOLOGY
424 PEDIATRIC RADIOLOGY
427 VASCULAR AND INTERVENTIONAL
RADIOLOGY
431 MEDICAL NUCLEAR PHYSICS
432 DIAGNOSTIC RADIOLOGICAL PHYSICS
433 HOSPICE AND PALLIATIVE MEDICINE
434 GENERAL DIAGNOSTIC RADIOLOGY
435 MAMMOGRAPHY
436 PAIN MANAGEMENT
437 THERAPEUTIC RADIOLOGICAL PHYSICS
520 SLEEP MEDICINE
440 SURGERY-GENERAL
443 HAND SURGERY
445 PEDIATRIC SURGERY
442 SURGICAL CRITICAL CARE
450 VASCULAR SURGERY
451 HOSPICE AND PALLIATIVE MEDICINE
460 THORACIC SURGERY
466 CONGENITAL CARDIAC SURGERY
480 UROLOGY
485 PEDIATRIC UROLOGY
0 INTERNAL MEDICINE/PEDIATRICS
Appendix IV—2008 MandatoryPhysician Workforce Survey