Embed Size (px)
Citation preview
www.dep.state.fl.us Oculus ID DOD_23_3449
Florida Department of Environmental Protection
Bob Martinez Center
2600 Blair Stone Road Tallahassee, Florida 32399-2400
Rick Scott Governor
Carlos Lopez-Cantera
Lt. Governor
Jonathan P. Steverson Secretary
July 26, 2016 Scott R. Surovchak Office of Legacy Management 11025 Dover Street, Suite 1000 Westminster, CO 80021 Subject: Conditional Site Rehabilitation Completion Order (SRCO) for the Wastewater
Neutralization Area Young - Rainey STAR Center Former Pinellas Department of Energy Site Bryan Dairy Road Largo, Florida 33777, Pinellas County FL6 890 090 008 Corrective Action Permit No. 0034170/HH/004
Dear Mr. Surovchak:
The DoD & Brownfields Partnerships Section has reviewed the No Further Action with Controls Proposal for the Young-Rainey STAR Center (formerly the U.S. Department of Energy Pinellas Plant facility) for the Wastewater Neutralization Area (WWNA), dated March 2007, located at 7887 Bryan Dairy Road, Largo, Florida. This report was prepared by the U.S Department of Energy under the terms of the Hazardous and Solid Waste Amendment (HSWA) permit. Maps showing the location of the Young-Rainey Star Center and the location of the “contaminated site” (i.e., contaminant plume) for which this Order is being issued are attached as Exhibits 1 and 2 and are incorporated by reference herein.
This conditional Order is being issued for a portion of the STAR center referred to as the U.S. Department of Energy WWNA Solid Waste Management Unit (SWMU) PIN 18 and currently operates as the Young-Rainey STAR Center Industrial Wastewater Neutralization Facility (IWNF). Discharges at his facility were reported to the USEPA on April 7, 1993.

Scott R. Surovchak Wastewater Neutralization Area Conditional SRCO Proposal Page two
www.dep.state.fl.us
Arsenic is the primary contaminant of concern. The source of the arsenic contamination at the WWNA is unknown. The distribution of arsenic in soil and groundwater was extensively investigated resulting in a 1999 Corrective Measure to remove areas of high arsenic soil contamination and treatment of dissolved arsenic using groundwater extraction wells. Reduction in the extent and concentrations of the arsenic plume, likely as a result of groundwater extraction, was documented and the groundwater recovery well operations were terminated in December 20, 2005 with Department approval. A plume stability evaluation, included in Exhibit 1, demonstrates the boundary of the arsenic plume will remain stable or shrink over the next 500 years and that exceedances of the arsenic MCL will not occur beyond the area covered by the institutional control (Exhibit 2).
The Conditional NFA Proposal for the WWNA is supported by earlier submittals,
prepared pursuant to the HSWA permit, which can be found in the Department’s document repository at: http://depedms.dep.state.fl.us/Oculus/servlet/login.
Based on the documentation submitted with the Conditional NFA Proposal and other
submitted documents, the Department has reasonable assurance that U.S Department of Energy has met the criteria in Chapter 62-780, F.A.C., including the commitments set forth in the technical submittals with respect to the recordation of institutional controls. The technical submittals indicate that acceptable Alternative Cleanup Target Levels (ACTL’s) have been established for groundwater contaminants remaining at the above-referenced contaminated site, in conjunction with appropriate institutional controls. Therefore, you have satisfied the site rehabilitation requirements for the above-referenced contaminated site and are released from any further obligation to conduct site rehabilitation at the contaminated site, except as set forth below. See attached tables (Exhibit 1), incorporated by reference herein, which includes information regarding the contaminants, affected media, applicable cleanup target levels, and the ACTL’s established for the contaminated site that is the subject of this Order.
A Declaration of Restrictive Covenant was recorded by the Pinellas County Industrial
Development Authority on September 16, 2015, in Official Record Book 18926, Pages 870-879, Public Records of Pinellas County, Florida, and is attached and incorporated by reference as Exhibit 2.
Failure to meet the following requirements will result in the revocation of this Order: (a) You are required to properly plug and abandon all monitoring wells, injection wells,
extraction wells, and sparge wells unless these wells are otherwise required for compliance with a local ordinance or another cleanup within 60 days of receipt of this Order. The monitoring wells must be plugged and abandoned in accordance with the requirements of Rule 62-532.500(5), F.A.C. A Well Plugging Report shall be submitted within 30 days of well plugging;
Scott R. Surovchak Wastewater Neutralization Area Conditional SRCO Proposal Page three
www.dep.state.fl.us
(b) (b) Any current or future real property owner of the above-referenced contaminated site must comply with the provisions contained within the Declaration of Restrictive Covenant (attached) recorded prior to the execution of this Order;
(c) If the current or future real property owner of the above-referenced contaminated
site proposes to remove the institutional controls, the real property owner shall obtain prior written approval from the Department. The removal of the controls shall be accompanied by the immediate resumption of site rehabilitation or implementation of other approved controls, unless it is demonstrated to the Department that the criteria of subsection 62-780.680(1), F.A.C., are met.
Further, in accordance with Chapter 376.30701(4), Florida Statutes (F.S.), upon
completion of site rehabilitation, additional site rehabilitation is not required unless it is demonstrated that:
(a) Fraud was committed in demonstrating site conditions or completion of site rehabilitation;
(b) New information confirms the existence of an area of previously unknown
contamination which exceeds the site-specific rehabilitation levels established in accordance with Section 376.30701(2),F.S., or which otherwise poses the threat of real and substantial harm to public health, safety, or the environment;
(c) The level of risk is increased beyond the acceptable risk established under Section
376.30701(2), F.S., due to substantial changes in exposure conditions, such as a change in land use from nonresidential to residential use. Any person who changes the land use of the site, thereby causing the level of risk to increase beyond the acceptable risk level, may be required by the department to undertake additional remediation measures to ensure that human health, public safety, and the environment are protected consistent with Section 376.30701, F.S.; or
(d) A new discharge of pollutants or hazardous substances occurs at the site subsequent
to the issuance of this Order.
Legal Issues
The Department’s Order shall become final unless a timely petition for an administrative hearing is filed under sections 120.569 and 120.57, F.S., within 21 days of receipt of this Order. The procedures for petitioning for a hearing are set forth below. Persons affected by this Order have the following options:

Scott R. Surovchak Wastewater Neutralization Area Conditional SRCO Proposal Page four
www.dep.state.fl.us
A. If you choose to accept the Department’s decision regarding this Conditional SRCO, you do not have to do anything. This Order is final and effective on the date filed with the Clerk of the Department, which is indicated on the last page of this Order. B. If you choose to challenge the decision, you may do the following:
1. File a request for an extension of time to file a petition for hearing with the Department’s Agency Clerk in the Office of General Counsel within 21 days of receipt of this Order. Such a request should be made if you wish to meet with the Department in an attempt to informally resolve any disputes without first filing a petition for hearing; or
2. File a petition for administrative hearing with the Department’s Agency Clerk in the Office of General Counsel within 21 days of receipt of this Order.
Please be advised that mediation of this decision pursuant to section 120.573, F.S., is not available. How to Request an Extension of Time to File a Petition for Hearing For good cause shown, pursuant to Rule 62-110.106(4), F.A.C., the Department may grant a request for an extension of time to file a petition for hearing. Such a request must be filed (received) by the Agency Clerk in the Office of General Counsel of the Department at 3900 Commonwealth Boulevard, Mail Station 35, Tallahassee, Florida, 32399-3000, within 21 days of receipt of this Order. Petitioner, if different from Scott R. Surovchak Office of Legacy Management, shall mail a copy of the request to the Scott R. Surovchak Office of Legacy Management at the time of filing. Timely filing a request for an extension of time tolls the time period within which a petition for administrative hearing must be made. How to File a Petition for Administrative Hearing A person whose substantial interests are affected by this Order may petition for an administrative hearing under sections 120.569 and 120.57, F.S. The petition must contain the information set forth below and must be filed (received) by the Agency Clerk in the Office of General Counsel of the Department at 3900 Commonwealth Boulevard, MS 35, Tallahassee, Florida, 32399-3000, within 21 days of receipt of this Order. Petitioner, if different from the Scott R. Surovchak Office of Legacy Management, shall mail a copy of the petition to the Scott R. Surovchak Office of Legacy Management, at the time of filing. Failure to file a petition within this time period shall waive the right of anyone who may request an administrative hearing under sections 120.569 and 120.57, F.S. Pursuant to subsection 120.569(2), F.S., and Rule 28-106.201, F.A.C., a petition for administrative hearing shall contain the following information:
Scott R. Surovchak Wastewater Neutralization Area Conditional SRCO Proposal Page five
www.dep.state.fl.us
a) The name, address, and telephone number of each petitioner; the name, address, and telephone number of the petitioner’s representative, if any; the site owner’s name and address, if different from the petitioner; the DEP facility number; and the name and address of the facility;
b) A statement of when and how each petitioner received notice of the Department’s action or proposed action;
c) An explanation of how each petitioner’s substantial interests are or will be affected by the Department’s action or proposed action;
d) A statement of the disputed issues of material fact, or a statement that there are no disputed facts;
e) A statement of the ultimate facts alleged, including a statement of the specific facts the petitioner contends warrant reversal or modification of the Department’s action or proposed action;
f) A statement of the specific rules or statutes the petitioner contends require reversal or modification of the Department’s action or proposed action; and
g) A statement of the relief sought by the petitioner, stating precisely the action petitioner wishes the Department to take with respect to the Department’s action or proposed action.
This Order is final and effective on the date filed with the Clerk of the Department, which is indicated on the last page of this Order. Timely filing a petition for administrative hearing postpones the date this Order takes effect until the Department issues either a final order pursuant to an administrative hearing or an Order Responding to Supplemental Information provided to the Department pursuant to meetings with the Department. Judicial Review Any party to this Order has the right to seek judicial review of it under section 120.68, F.S., by filing a notice of appeal under rule 9.110 of the Florida Rules of Appellate Procedure with the Agency Clerk of the Department in the Office of General Counsel, Mail Station 35, 3900 Commonwealth Boulevard, Tallahassee, Florida 32399-3000, and by filing a copy of the notice of appeal accompanied by the applicable filing fees with the appropriate district court of appeal. The notice of appeal must be filed within thirty days after this order is filed with the clerk of the Department (see below). Questions Any questions regarding the Department’s review of your NFA Proposal should be directed to John R. Armstrong at 2600 Blair Stone Road, Mail Station 4535, Tallahassee, Florida 32399-2400, telephone number (850) 245-8981, or e-mail at [email protected]. Questions regarding legal issues should be referred to the Department’s Office of General

Scott R. Surovchak Wastewater Neutralization Area Conditional SRCO Proposal Page six
www.dep.state.fl.us
Counsel at (850)245-2242. Contact with any of the above does not constitute a petition for administrative hearing or request for an extension of time to file a petition for administrative hearing. Sincerely,
Peter Cornais, Program Administrator Waste Cleanup Program Division of Waste Management
PC/jra Enclosures ( Exhibits 1, and 2) cc: FILE Bryan Baker, FDEP, Tallahassee
FILING AND ACKNOWLEDGMENT FILED, on this date, pursuant to §120.52 Florida Statutes, with the designated Department Clerk, receipt of which is hereby acknowledged.
07/27/2016 _______________________ ________________
Clerk Date (or Deputy Clerk)
Pinellas Environmental Restoration Project
Young Rainey STAR CenterWastewater Neutralization AreaNo Further ActionWith Controls Proposal March 2007
Office ofLegacy Management
DOE M/1419 2007––L
Work Performed Under DOE Contract No.for the U.S. Department of Energy Office of Legacy Management.
DE–AC01–02GJ79491
Approved for public release; distribution is unlimited.
Office of Legacy ManagementOffice of Legacy ManagementOffice of Legacy ManagementU.S. Department
of Energy

DOE−LM/1419−2007
Pinellas Environmental Restoration Project
Young – Rainey STAR Center
Wastewater Neutralization Area No Further Action With Controls Proposal
March 2007
Work Performed by S.M. Stoller Corporation under DOE Contract No. DE–AC01–02GJ79491 for the U.S. Department of Energy Office of Legacy Management, Grand Junction, Colorado

U.S. Department of Energy WWNA No Further Action With Controls Proposal March 2007 Page iii
Contents Acronyms and Abbreviations ......................................................................................................... v 1.0 Introduction......................................................................................................................... 1
1.1 Purpose...................................................................................................................... 1 1.2 Site Background........................................................................................................ 1
2.0 Current Conditions.............................................................................................................. 3 2.1 Site Hydrogeology and Geochemistry...................................................................... 3
2.1.1 Hydrogeology ............................................................................................... 3 2.1.2 Geochemistry ................................................................................................ 4
2.2 Contaminants of Potential Concern .......................................................................... 4 2.3 Nature and Extent of Contamination ........................................................................ 5
2.3.1 Time-Concentration Trends .......................................................................... 6 2.3.2 Depth of Contamination................................................................................ 8 2.3.3 Ground Water Modeling ............................................................................... 8
2.4 Plume Stability Evaluation ..................................................................................... 10 2.5 Conceptual Site Model............................................................................................ 10 2.6 Risk Assessment ..................................................................................................... 10
3.0 Risk Management Options................................................................................................ 11 3.1 No Further Action Without Controls (RMO I) ....................................................... 11 3.2 No Further Action With Controls (RMO II and RMO III) ..................................... 12
3.2.1 Risk Management Option II........................................................................ 12 3.2.2 Risk Management Option III ...................................................................... 13
4.0 Summary........................................................................................................................... 13 5.0 References......................................................................................................................... 13
Figures Figure 1. Location of the WWNA at the STAR Center................................................................ 15 Figure 2. WWNA Remediation Activities Timeline .................................................................... 16 Figure 3. WWNA Site Features. ................................................................................................... 17 Figure 4. Geologic Cross-Section of the WWNA ........................................................................ 18 Figure 5. Ground Water Contours, Shallow Surficial Aquifer, March 2006................................ 19 Figure 6. Ground Water Contours, Deep Surficial Aquifer, March 2006 .................................... 20 Figure 7. Ground Water Contours, Shallow Surficial Aquifer, September 2006......................... 21 Figure 8. Ground Water Contours, Deep Surficial Aquifer, September 2006.............................. 22 Figure 9. WWNA Arsenic Plume Map, September 2006 Data. ................................................... 23 Figure 10. Cross-Section Showing Depth of Contamination........................................................ 24 Figure 11. Comparison of Current Arsenic Plume (top) and Arsenic Plume in 500 Years
(bottom)....................................................................................................................... 25 Figure 12. Comparison of the 1998 Arsenic Plume to the 2006 Arsenic Plume. ......................... 26

WWNA No Further Action With Controls Proposal U.S. Department of Energy Page iv March 2007
Tables Table 1. Summary of Geochemical Data From October 2005, March 2006, and September 2006
Sampling Events for All Wells at the WWNA ................................................................. 4 Table 2. Arsenic Concentrations During Closure Monitoring (μg/L) ............................................ 6
Appendixes Appendix A Supporting Information
Figure A−1. Arsenic in Wells PIN18−0500 and −0502 Figure A−2. Arsenic in Well PIN18−0501 Figure A−3. Arsenic in Wells PIN18−0521 and −0522 Figure A−4. Arsenic in Wells PIN18−0524 and −0525 Table A−1. WWNA VC Data Since 2003 Table A−2. WWNA Historical Arsenic Data Table A−3. WWNA Well Completion Information
Appendix B Modeling of Ground Water Flow and Arsenic Transport at the Wastewater
Neutralization Area
U.S. Department of Energy WWNA No Further Action With Controls Proposal March 2007 Page v
Acronyms and Abbreviations
bls below land surface CMIP Corrective Measures Implementation Plan COPCs contaminants of potential concern CTLs cleanup target levels DOE U.S. Department of Energy F.A.C. Florida Administrative Code FDEP Florida Department of Environmental Protection ft feet Hawthorn Hawthorn Formation ICs institutional controls IWNF industrial wastewater neutralization facility Kd soil/water distribution coefficient MCLs maximum contaminant levels μg/L micrograms per liter RFI RCRA Facility Investigation RBCA Risk-Based Corrective Action RMO Risk Management Option STAR Science, Technology, and Research VC vinyl chloride WWNA Wastewater Neutralization Area

WWNA No Further Action With Controls Proposal U.S. Department of Energy Page vi March 2007
End of current text

U.S. Department of Energy WWNA No Further Action With Controls Proposal March 2007 Page 1
1.0 Introduction
The Young - Rainey Science, Technology, and Research (STAR) Center is a former U.S. Department of Energy (DOE) facility located in Largo, Florida. DOE has been conducting corrective action at the Wastewater Neutralization Area (WWNA) in accordance with terms of the Hazardous and Solid Waste Amendment permit issued for the site, in which the WWNA is identified as a solid waste management unit (FDEP 2002). The Florida Department of Environmental Protection (FDEP) is the agency responsible for overseeing site cleanup. The WWNA is located to the west of Building 100 (Figure 1). A timeline of activities conducted for the WWNA is illustrated in Figure 2. 1.1 Purpose The purpose of this document is to briefly summarize remediation activities conducted at the WWNA, to describe current site conditions, to evaluate the stability of the contaminant plume, and to recommend a final closure option for the site of “No Further Action with Controls.” This document therefore serves the purpose of a Site Rehabilitation Completion Report and, if approved by FDEP, will lead to a Site Rehabilitation Completion Order. Corrective action at the site has been conducted in accordance with the Corrective Measures Implementation Plan (CMIP; DOE 1997a), the CMIP Addendum (DOE 2000a), and the Statement of Basis (DOE 2000b) previously prepared by DOE and approved by FDEP. In the time since these documents were prepared, several important activities have occurred that have bearing on remediation and closure of the WWNA. These activities include the following:
• Site-specific information, such as water quality data, has been collected and assessed over time (e.g., DOE 2003 and annual monitoring reports).
• A rule establishing default cleanup target levels (CTLs) was promulgated by FDEP (62-677, Florida Administrative Code [F.A.C.]) and allows CTLs less stringent than maximum contaminant levels (MCLs) in certain circumstances.
• The regulatory setting also has changed with the recent promulgation by FDEP of Global Risk-Based Corrective Action (RBCA) rules. These rules allow the application of engineered or institutional controls (ICs) as an alternative to site cleanup for unrestricted use.
• ICs guidance has been developed by FDEP (FDEP 2004) and an IC registry established.
• FDEP approved shutdown of the active ground water recovery system at the WWNA and the beginning of closure monitoring (DOE 2006).
Because of these changes, some of the assumptions previously guiding site cleanup (e.g., those in DOE 2000a and 2000b) are no longer valid. Therefore, this closure document has been prepared to reflect the current regulatory framework. 1.2 Site Background The WWNA/Building 200 Area includes the active industrial wastewater neutralization facility (IWNF), the area around Building 200, and the area south of the neutralization facility (Figure 3). The IWNF refers to the physical treatment facility that currently receives the STAR Center’s sanitary and industrial wastewater and has been in operation since 1957.
WWNA No Further Action With Controls Proposal U.S. Department of Energy Page 2 March 2007
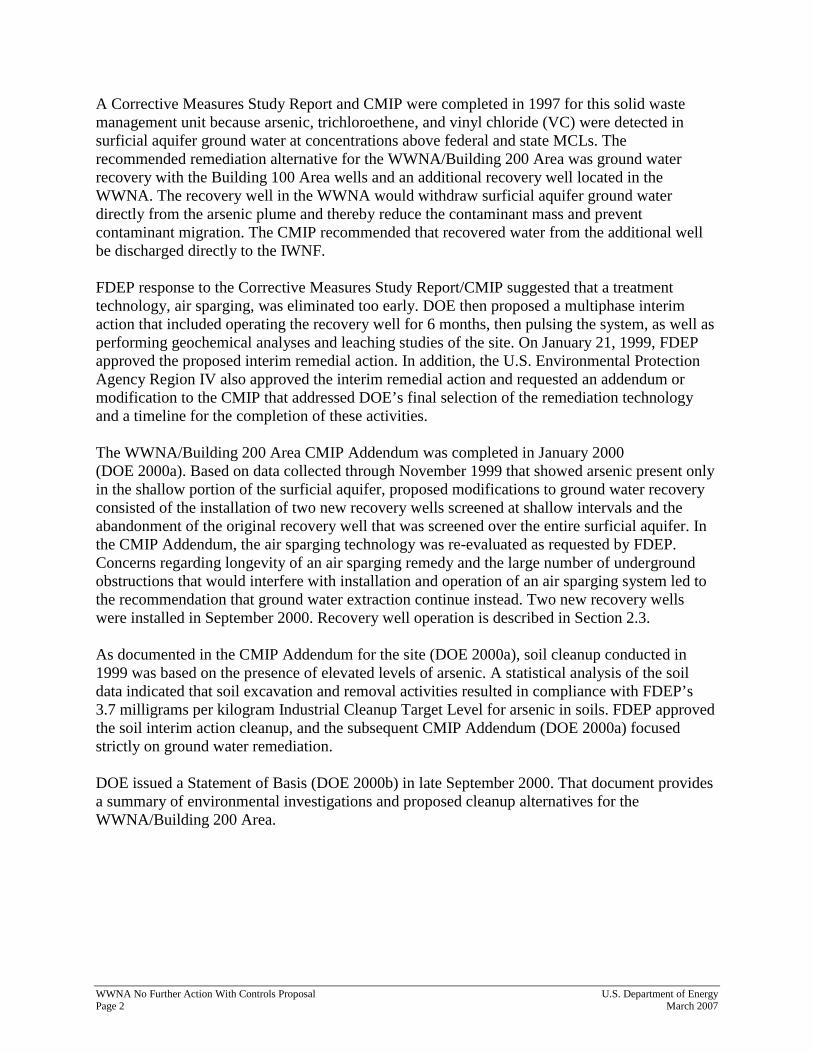
A Corrective Measures Study Report and CMIP were completed in 1997 for this solid waste management unit because arsenic, trichloroethene, and vinyl chloride (VC) were detected in surficial aquifer ground water at concentrations above federal and state MCLs. The recommended remediation alternative for the WWNA/Building 200 Area was ground water recovery with the Building 100 Area wells and an additional recovery well located in the WWNA. The recovery well in the WWNA would withdraw surficial aquifer ground water directly from the arsenic plume and thereby reduce the contaminant mass and prevent contaminant migration. The CMIP recommended that recovered water from the additional well be discharged directly to the IWNF. FDEP response to the Corrective Measures Study Report/CMIP suggested that a treatment technology, air sparging, was eliminated too early. DOE then proposed a multiphase interim action that included operating the recovery well for 6 months, then pulsing the system, as well as performing geochemical analyses and leaching studies of the site. On January 21, 1999, FDEP approved the proposed interim remedial action. In addition, the U.S. Environmental Protection Agency Region IV also approved the interim remedial action and requested an addendum or modification to the CMIP that addressed DOE’s final selection of the remediation technology and a timeline for the completion of these activities. The WWNA/Building 200 Area CMIP Addendum was completed in January 2000 (DOE 2000a). Based on data collected through November 1999 that showed arsenic present only in the shallow portion of the surficial aquifer, proposed modifications to ground water recovery consisted of the installation of two new recovery wells screened at shallow intervals and the abandonment of the original recovery well that was screened over the entire surficial aquifer. In the CMIP Addendum, the air sparging technology was re-evaluated as requested by FDEP. Concerns regarding longevity of an air sparging remedy and the large number of underground obstructions that would interfere with installation and operation of an air sparging system led to the recommendation that ground water extraction continue instead. Two new recovery wells were installed in September 2000. Recovery well operation is described in Section 2.3. As documented in the CMIP Addendum for the site (DOE 2000a), soil cleanup conducted in 1999 was based on the presence of elevated levels of arsenic. A statistical analysis of the soil data indicated that soil excavation and removal activities resulted in compliance with FDEP’s 3.7 milligrams per kilogram Industrial Cleanup Target Level for arsenic in soils. FDEP approved the soil interim action cleanup, and the subsequent CMIP Addendum (DOE 2000a) focused strictly on ground water remediation. DOE issued a Statement of Basis (DOE 2000b) in late September 2000. That document provides a summary of environmental investigations and proposed cleanup alternatives for the WWNA/Building 200 Area.

U.S. Department of Energy WWNA No Further Action With Controls Proposal March 2007 Page 3
2.0 Current Conditions
This section describes site hydrogeology and geochemistry (2.1), contaminants of potential concern (COPCs) (2.2), the nature and extent of contamination (2.3), plume stability evaluation (2.4), the site conceptual model (2.5), and provides a qualitative risk assessment (2.6). 2.1 Site Hydrogeology and Geochemistry 2.1.1 Hydrogeology
The STAR Center is located on the western coastal plain of the Florida Peninsula. The Florida Peninsula is a broad, partially submerged shelf of the Gulf of Mexico and is composed of alternating layers of sands and gravels, and carbonate deposits such as limestone. The uppermost (i.e., most recent) deposits are known as the surficial aquifer and consist of silty to shelly sands (Figure 4). At the WWNA, the surficial aquifer has an average thickness of about 35 feet (ft). Depth to water ranges from about 1 to 5 ft below land surface (bls), depending on the season. No municipal water supplies are obtained from the surficial aquifer due to the poor yield and poor quality of the ground water. Underlying the surficial aquifer is the Hawthorn Formation (Hawthorn). The Hawthorn is an aquitard that separates the surficial aquifer from the underlying upper Floridan aquifer, which is the primary source of drinking water for Pinellas County. The Hawthorn is composed of sandy clay with some carbonate lenses and forms a widespread confining layer between the surficial aquifer and the Floridan aquifer. The Hawthorn is about 70 ft thick in the area of the STAR Center. Tests to measure the aquifer properties were performed as part of the sitewide RCRA Facility Investigation (RFI) (DOE 1991). The hydraulic conductivity of the Hawthorn is several orders of magnitude lower than that of either the surficial or Floridan aquifers. Therefore, in the vicinity of the STAR Center, the Hawthorn is thick and impermeable enough that it severely restricts vertical ground water flow, making it highly unlikely that contamination will ever reach the Floridan aquifer. The RFI concluded that surficial aquifer contamination is unlikely to affect the underlying Floridan aquifer (DOE 1991), and the three monitoring wells at the STAR Center that are screened in the upper Floridan aquifer have shown no contamination. Five man-made ponds exist on the property for the purpose of collecting storm water runoff from parking lots and buildings (Figure 1). The two most recently excavated ponds (Southwest Pond and Pond 5; Figure 3) are immediately south and west of the WWNA and are hydraulically connected to the shallow portion of the surficial aquifer. The surficial aquifer at the STAR Center, including the WWNA, acts as a 2-layer hydraulic system in which the shallow and deep portions of the surficial aquifer are separated by a discontinuous, often organic-rich, silty sand layer. This layer, where present at the WWNA and Building 100, is generally encountered at about 20 ft bls and is about 1−2 ft thick. Now that ground water extraction has ended at the WWNA and the Building 100 Area, any ground water movement between the shallow and deep portions of the surficial aquifer is almost certainly controlled by the amount of recharge from rainfall. Ground water flow at the WWNA is shown for the shallow and deeper portions of the surficial aquifer for March 2006 (dry season) on Figure 5 and Figure 6, and for September 2006 (wet
WWNA No Further Action With Controls Proposal U.S. Department of Energy Page 4 March 2007
season) on Figure 7 and Figure 8. In the shallow surficial aquifer, ground water flow is toward the west, south, and east from a high that was observed around and north of former recovery wells RW02, RW03, and RW0501. Calculations using Darcy’s Law and approximations of 1 ft/day for hydraulic conductivity and 0.3 for effective porosity indicate that the ground water flow velocity from the WWNA toward the southeast was about 2 ft/year in March 2006 and about 5 ft/year in September 2006. The increased hydraulic gradient in September was due to increased recharge from rainfall. The general flow patterns observed throughout 2006 changed somewhat from previously observed patterns due to the completion of Pond 5 in early 2006. Pond 5 acts as a discharge point for the surficial aquifer, and therefore a more westerly component of flow is now observed from the WWNA. It appears that Pond 5 would not recharge the surficial aquifer ground water because an overflow structure limits the maximum water level in the pond. In the deeper surficial aquifer, the flow patterns remained more consistent with previously observed patterns, with flow primarily toward the southeast. In March 2006, the flow pattern was affected by ground water withdrawals from Building 100 Area recovery well PIN12−RW02 (Figure 6). With concurrence from FDEP, this recovery well and an adjacent Building 100 Area recovery well (PIN12−RW01) were turned off in August 2006. 2.1.2 Geochemistry
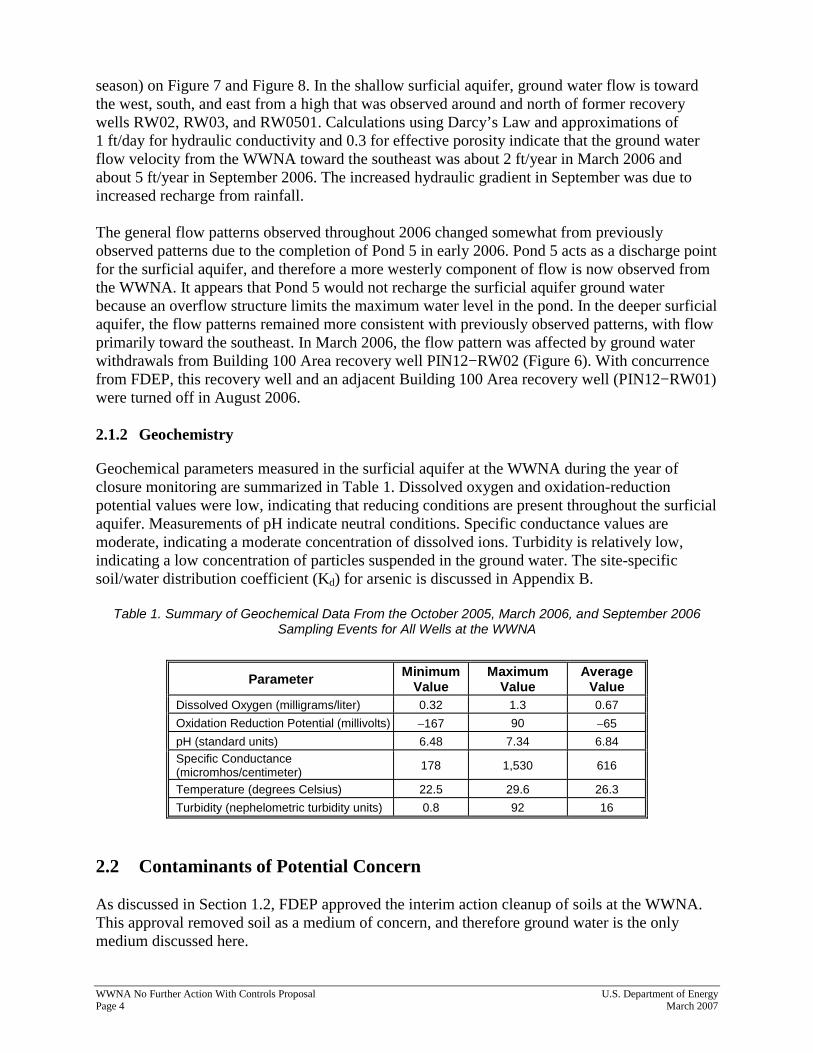
Geochemical parameters measured in the surficial aquifer at the WWNA during the year of closure monitoring are summarized in Table 1. Dissolved oxygen and oxidation-reduction potential values were low, indicating that reducing conditions are present throughout the surficial aquifer. Measurements of pH indicate neutral conditions. Specific conductance values are moderate, indicating a moderate concentration of dissolved ions. Turbidity is relatively low, indicating a low concentration of particles suspended in the ground water. The site-specific soil/water distribution coefficient (Kd) for arsenic is discussed in Appendix B.
Table 1. Summary of Geochemical Data From the October 2005, March 2006, and September 2006 Sampling Events for All Wells at the WWNA
Parameter Minimum Value
Maximum Value
Average Value
Dissolved Oxygen (milligrams/liter) 0.32 1.3 0.67
Oxidation Reduction Potential (millivolts) −167 90 −65
pH (standard units) 6.48 7.34 6.84 Specific Conductance (micromhos/centimeter) 178 1,530 616
Temperature (degrees Celsius) 22.5 29.6 26.3
Turbidity (nephelometric turbidity units) 0.8 92 16
2.2 Contaminants of Potential Concern As discussed in Section 1.2, FDEP approved the interim action cleanup of soils at the WWNA. This approval removed soil as a medium of concern, and therefore ground water is the only medium discussed here.

U.S. Department of Energy WWNA No Further Action With Controls Proposal March 2007 Page 5
During the RFI, ground water contamination was detected in the surficial aquifer (DOE 1996). At the time, concentrations of contaminants in ground water were compared to federal and state drinking water standards. Arsenic, trichloroethene, and VC were detected at concentrations exceeding standards. Since that time, trichloroethene concentrations dropped below the FDEP MCL of 3 micrograms per liter (μg/L), so trichloroethene was eliminated as a COPC during a comprehensive review and evaluation of monitoring data for the STAR Center (DOE 2003). Because VC levels have exceeded the 1 μg/L FDEP MCL, VC was retained as a COPC after the comprehensive screening process (DOE 2003). VC data since 2003 for all monitoring wells at the WWNA are shown in Table A−1 in Appendix A. The primary COPC in WWNA ground water is arsenic, which has been persistently elevated in several wells above the FDEP MCL of 10 μg/L. Elevated arsenic concentrations prompted the soil removal interim action to address source control. The subsequent ground water extraction system was installed to optimize recovery of arsenic in the ground water. While most of the previous documents for the WWNA and other solid waste management units at the Pinellas site have compared ground water contaminant concentrations to drinking water standards (i.e., MCLs), those standards are not the applicable default CTLs for the purposes of evaluating site remediation under RBCA. Based on a comprehensive review of background data for the site (DOE 2003), it was determined that the shallow ground water in the site vicinity is naturally elevated in aluminum and iron at levels far exceeding State of Florida Secondary Drinking Water Standards (Chapter 62-550, F.A.C.). Specifically, the average background concentration of 1.1 milligrams/liter for aluminum exceeds the 0.2 milligrams/liter secondary standard, and the average background concentration for iron of 9.3 milligrams/liter exceeds the 0.3 milligrams/liter secondary standard. The ambient shallow ground water in the area is therefore designated as “poor quality” as defined in 62-780.200 (35), F.A.C. Thus, the applicable ground water CTLs for the WWNA are those for ground water of “low yield/poor quality” provided in Table 1 of Chapter 62-777, F.A.C. For VC, this is 10 times the drinking water standard, or 10 μg/L. Therefore, VC can be eliminated from further consideration as a COPC because it does not exceed 10 μg/L. For arsenic, the applicable CTL is also 10 times the drinking water standard, or 100 μg/L. Monitoring results indicate exceedances of this CTL at two wells at the WWNA during recent sampling events (Figure 9; Table A−2). Therefore, arsenic is retained as the sole COPC. 2.3 Nature and Extent of Contamination The source of the arsenic measured at the WWNA is unknown (DOE 1993). Arsenic use has been documented at the Pinellas Plant (now the STAR Center), and therefore it is possible that the arsenic originated from past waste disposal practices (DOE 1997b). Remediation at the WWNA began in August 1997 with the startup of the ground water recovery system. This system consisted of recovery well PIN18−RW01 and associated piping; extracted ground water was pumped directly to the IWNF without treatment. Recovery well RW01 was screened over the entire surficial aquifer and operated until December 1, 1999 (DOE 2001). Subsequently, it was determined that arsenic contamination existed mainly in the shallow surficial aquifer, so two new shallow recovery wells (PIN18−RW02 and −RW03) were installed in September 2000, and ground water recovery began in February 2001, also with discharge

WWNA No Further Action With Controls Proposal U.S. Department of Energy Page 6 March 2007
directly to the IWNF. Excavation of arsenic-contaminated soils was conducted in September 1999, as discussed in Section 2.2. Monitoring well PIN18−0501 was converted to a recovery well (renamed PIN18−RW0501) that started operation in June 2003, also discharging directly to the IWNF. Operation of the three recovery wells was terminated on December 20, 2005, when FDEP allowed DOE to discontinue ground water recovery at the WWNA. Concurrently with cessation of remediation, FDEP allowed DOE to begin a 1-year period of closure monitoring, retroactive to the October 2005 sampling event (DOE 2006). The second closure monitoring event occurred in March 2006, and the year of closure monitoring concluded with the September 2006 monitoring event. Only the March and September 2006 events were conducted under nonpumping conditions. The data from wells in the plume area for these three sampling events (Table 2), in combination with historical data for all WWNA monitoring wells (Table A−2), are used here to evaluate the stability of the arsenic plume. In addition, ground water modeling was conducted to evaluate future plume stability (Section 2.3.3). Arsenic concentrations measured in recovery wells while the wells were in operation are not used in the evaluation because those data are not representative of actual conditions in the aquifer; results from the wells under nonpumping conditions are included in the evaluation and are shown in the tables.
Table 2. Arsenic Concentrations During Closure Monitoring (μg/L)
Well October 2005 March 2006 September 2006 0500 52.3 61.3 76.5
0501 / RW0501 RW 145 150
0502 33.7 40.3 116
0520 NS <2.9 <2.9
0521 <2.9 3.5 3.7
0522 13.7 6.8 7.9
0523 <2.9 <2.9 <2.9
0524 8.9 38.4 35.9
0525 118 32.3 72.8
RW02 RW 41.5 76.4
RW03 RW 11.4 36.1
NS = not sampled RW = operating as recovery well; data not shown.
2.3.1 Time-Concentration Trends
Time-concentration plots showing all historical arsenic data for monitoring wells in the plume area at the WWNA are included as Figure A−1 through Figure A−4 in Appendix A. This appendix also includes a table listing all historical arsenic data for all monitoring wells (Table A−2), as well as a table of well completion information, such as screened interval (Table A−3). The three recovery wells that were operating when recovery well operation was discontinued in December 2005 have since been functioning as monitoring wells. Recovery well RW0501 originally was a monitoring well (0501), but was converted to a recovery well in 2003, as

U.S. Department of Energy WWNA No Further Action With Controls Proposal March 2007 Page 7
mentioned previously. COPC concentrations measured in the recovery wells during active ground water pumping are not representative of actual concentrations in the aquifer due to potential dilution and other effects, so those data are not presented on the time-concentration plots and are not discussed. Monitoring wells 0500 and 0502 (both screened at 11−16 ft bls) have shown the highest historical arsenic concentrations measured at the WWNA (Figure A−1; Table A−2). However, several years of ground water recovery have resulted in significant concentration decreases, and arsenic concentrations in these wells remained consistent within the range of about 10 to 100 μg/L since early 2002. During the year of closure monitoring, well 0500 showed a slight increase from 52 to 76 μg/L, while well 0502 showed consistent concentrations of 34 and 40 μg/L during the first two events but increased to 116 μg/L for the last event in September 2006. Monitoring well 0501 (screened at 11−16 ft bls) showed a relatively stable arsenic concentration trend at about 100 μg/L from 1991 to 1999, but an increasing trend was evident from late 1999 to mid-2002. Subsequently, the well showed a decreasing trend for the next year into mid-2003, when it was converted to a recovery well (Figure A−2; Table A−2). The increase in 1999 to 2002 may have been related to the soil removal event in 1999. After operation as a recovery well was terminated in December 2005, the two subsequent sampling events have shown a consistent concentration of about 150 μg/L. Adjacent monitoring wells 0521 (screened at 20−30 ft bls) and 0522 (screened at 5−15 ft bls) showed relatively stable arsenic concentration trends until recovery well RW01 started operation in August 1997 (Figure A−3; Table A−2). These wells showed more variability in arsenic concentrations while RW01 was operating. However, once RW02 and RW03 started operation in February 2001, well 0521 showed consistent low concentrations (<20 μg/L, with many values below the detection limit) and well 0522 showed a consistent decrease with concentrations leveling off at about 10 μg/L by April 2004. During the year of closure monitoring, arsenic concentrations in these two wells remained very consistent, with 0521 at <4 μg/L and 0522 at <14 μg/L. Monitoring well 0520, screened at 32−42 ft bls, is co-located with wells 0521 and 0522 and has never contained arsenic >10 μg/L. Monitoring wells 0524 and 0525 are co-located at the eastern edge of the arsenic plume; well 0524 is screened at 20−30 ft bls and well 0525 is screened at 5−15 ft bls. Well 0524 has shown a relatively consistent arsenic concentration of <50 μg/L over its history, with a few intermittent, anomalous spikes in concentration (Figure A−4). Well 0525 has shown considerable variability in arsenic concentration prior to and during operation of RW01. However, once shallow recovery wells RW02 and RW03 started operation, the arsenic concentration in this shallow well became more consistent, although slight increasing and decreasing trends are evident. During the year of closure monitoring, well 0524 showed a slight increase from 9 to 36 μg/L, while well 0525 showed a slight decrease from 118 to 73 μg/L. Monitoring well 0523 is co-located with wells 0524 and 0525, is screened at 32−42 ft bls, and has never contained arsenic >10 μg/L. Former recovery wells RW02 and RW03 have been sampled twice since ground water recovery was terminated. The arsenic concentration in each well remained well below 100 μg/L, although

WWNA No Further Action With Controls Proposal U.S. Department of Energy Page 8 March 2007
both wells show slight increasing arsenic concentration trends from March to September 2006 (Table 2). Time-concentration plots are not shown for the remaining monitoring wells at the WWNA because these wells have shown very few arsenic detections. However, arsenic data from these wells are listed in Table A−2. This table also lists arsenic data from eight wells that were abandoned in August 2006 (well locations shown on Figure 3). These wells have been sampled since 1993, and most show no arsenic detections, clearly demonstrating that:
• The historical dissolved arsenic plume has been confined to the small area in the immediate vicinity of the former arsenic-contaminated soils,
• The arsenic plume remains confined to a small area (<1/4 acre), and
• Arsenic transport in ground water has been minimal. In summary, the monitoring wells located within the arsenic plume all have shown overall decreasing concentration trends, most likely due to ground water pumping operations. The arsenic concentration in all these wells has remained fairly stable over the last few years. In the year since ground water recovery was terminated, arsenic concentrations have remained relatively stable, with only two wells (0502 and RW0501) showing arsenic concentrations exceeding the 100 μg/L CTL in the most recent sampling event in September 2006. The area of the arsenic plume that exceeds the 100 μg/L CTL is <1/4 acre (Figure 9). 2.3.2 Depth of Contamination
Figure 10 is a cross-section of the WWNA showing September 2006 arsenic concentrations with depth. The highest arsenic concentrations occurred in wells with the shallowest screened intervals (11−16 ft bls and 5−15 ft bls). Wells screened at 20−30 ft bls (0521 and 0524) showed arsenic concentrations at levels about half of those in the adjacent shallow wells. Wells screened at the bottom of the surficial aquifer (0520 and 0523) did not contain arsenic at detectable levels. In summary, the highest arsenic concentrations are in the upper 16 ft of the surficial aquifer, above the division between the deep and shallow surficial aquifer layers. Arsenic concentrations decrease with depth to nondetect levels in the lower portion of the surficial aquifer. 2.3.3 Ground Water Modeling
A numerical model accounting for ground water flow and arsenic transport at the WWNA was developed for the purpose of assessing the future disposition of the arsenic plume. The model contained two layers, with the upper layer representing the shallow portion of the surficial aquifer and the lower layer representing the deep portion of the surficial aquifer. Ground water flow was assumed to be steady-state and was simulated using the code MODFLOW, as developed by the U.S. Geological Survey (McDonald and Harbaugh 1988). Arsenic transport was simulated using the code MT3DMS (Zheng 1990). A map of the area encompassed by the model is presented in Figure 11. Because water elevation data collected at monitoring wells screened in the surficial aquifer’s shallow zone at the WWNA since construction of Pond 5 (Figure 5 and Figure 7) indicate that the pond tends to act as site of ground water discharge, the model’s west boundary was placed only about 80 ft west of the

U.S. Department of Energy WWNA No Further Action With Controls Proposal March 2007 Page 9
pond’s east edge. Selection of this west boundary was also appropriate for the aquifer’s deep zone as water levels in this zone (Figure 6 and Figure 8) show deeper ground water migrating mostly to the southeast. To account for arsenic migration toward the south and southeast in both zones of the surficial aquifer, the southernmost boundary of the model was placed along the southern extent of the Southwest Pond and the eastern model boundary was placed about 350 ft east of the west end of Building 100. Though limited arsenic mobility due to sorption on aquifer sediments is expected to keep arsenic far from either of these boundaries, the large model area lying between the boundaries and the existing area of arsenic contamination made it possible to simulate southward and eastward arsenic transport in the unlikely event that arsenic transport became less retarded than is currently the case. Due to a lack of information regarding ground water flow southwest of the railroad tracks, the railroad track alignment was adopted as the southwest model boundary. A uniform value for hydraulic conductivity (1 ft/day) was used in the flow model for both the shallow and deep zones of the surficial aquifer. Ground water recharge was assumed possible in unpaved areas of the model domain, and was assumed negligible in paved areas. The ponds within the model domain (Pond 5, Southwest Pond, and South Pond) were handled as drain boundaries in Layer 1. Using this type of boundary condition to simulate discharge to the ponds, in lieu of assigning prescribed hydraulic heads to them, makes it possible for some shallow-zone ground water to migrate below pond bottoms, which appear to lie above the base of the shallow portion of the aquifer. Accordingly, it was not necessary to invoke boundary conditions in the aquifer’s deep zone (Layer 2) to represent the ponds. Cells along the perimeter of the model were handled using prescribed head and general head boundaries (McDonald and Harbaugh 1988). Calibration of the flow model was achieved through a trial-and-error process, in which flow conditions were manipulated mostly by adjusting boundary conditions along the model’s perimeter. It was not possible to develop a similar calibration for the arsenic transport model because of a lack of changing arsenic concentrations reflective of arsenic plume mobility. Consequently, transport simulations were limited to long-term predictions of arsenic fate on the basis of ground water levels measured in the area, the associated flow model, and laboratory analyses of arsenic retardation due to sorption on aquifer materials (Duke Engineering and Services 1999). All predictive simulations with the WWNA model indicated that future migration of arsenic from areas of elevated concentration will be minimal, and that any dissolved arsenic that manages to persist at concentrations exceeding 100 μg/L in the future will be limited to the relatively small area that is currently affected by the contamination. Figure 11 shows the current arsenic plume (>100 μg/L) and the plume at 500 years in the future. These modeling results reflect the combined effects of very slow migration of arsenic, expected because of its proclivity for sorbing to aquifer sediments, and mechanical dispersion that limits downgradient transport from a relatively narrow zone of existing contamination. This finding holds true even under conditions in which the retardation factor is reduced to 10 percent of the factor calculated in Appendix B. Detailed information regarding the logic that went into the WWNA model and the results of simulations with it are presented in Appendix B of this report.

WWNA No Further Action With Controls Proposal U.S. Department of Energy Page 10 March 2007
2.4 Plume Stability Evaluation As discussed in Section 2.3.1, arsenic concentrations at the WWNA have decreased significantly since monitoring started in the early 1990s, likely as a result of ground water pumping operations. Figure 12 compares the arsenic plume in 1998 to the plume in 2006, with the boundary of both plumes defined based on the poor water quality CTL of 100 μg/L. In 1998, arsenic in six wells exceeded 100 μg/L (with a maximum concentration of 550 μg/L), while arsenic concentrations in September 2006 exceed the 100 μg/L CTL in only two monitoring wells (with a maximum concentration of 150 μg/L). As discussed in Section 2.3.1, the arsenic plume was stable over the year of closure monitoring, as evidenced by arsenic concentrations that generally remained at about the same level. The modeling of arsenic transport for 500 years into the future, summarized in Section 2.3.3 and detailed in Appendix B, predicts that the area of the arsenic plume will remain the same size or will decrease over time, that arsenic concentrations above the 50 μg/L surface water standard will not approach Pond 5, and that arsenic above the 10 μg/L MCL will not approach the STAR Center property boundary. Therefore, based on modeling over a 500-year period, the plume is expected to remain stable and will only dissipate over time. 2.5 Conceptual Site Model Arsenic is the sole COPC for the WWNA, and ground water is the medium of concern. The original source of arsenic at the WWNA is unknown. The dissolved arsenic plume (concentrations >100 μg/L CTL) is confined to an area <1/4 acre in size, encompassing two monitoring wells. In fact, the current extent of the plume as estimated by the modeling work in Appendix B (Figure B−6) is approximately 0.05 acre. The vertical extent of the arsenic plume is limited to the upper half of the surficial aquifer, above 16 ft bls, and arsenic concentrations decrease to levels below detection limits at the bottom of the surficial aquifer. Modeling indicates that vertical migration of arsenic will have no significant impact on the deep surficial aquifer. The high site-specific arsenic Kd results in extremely slow transport of arsenic. Ground water modeling has shown that arsenic will not affect the surface water in Pond 5 and the Southwest Pond and that arsenic >10 μg/L MCL will not be transported past the STAR Center property boundary. Concentration trends and ground water modeling demonstrate that the arsenic plume currently is stable, and will remain stable for the foreseeable future. 2.6 Risk Assessment Because of the current and projected land and water use at the WWNA and the limited extent of ground water contamination, a quantitative risk assessment was not performed for the site. Currently there are no uses of surficial aquifer ground water at the site other than use of water from the South Pond for irrigation. Contamination is limited to shallow portions of the surficial aquifer. Downward movement into the Floridan aquifer is prevented by the presence of the thick, low-permeability Hawthorn. The shallow ground water is in hydraulic connection to surface water in ponds at the site. However, based on the very limited mobility of arsenic as determined in the modeling conducted in Appendix B, discharge of ground water to the ponds will not negatively impact pond water quality.

U.S. Department of Energy WWNA No Further Action With Controls Proposal March 2007 Page 11
Based on the current conceptual model of the site, the only potential exposure route to site-related contamination would be through installation of wells and extraction of ground water from the shallow surficial aquifer within the site boundary.
3.0 Risk Management Options
The analysis presented in Section 2 demonstrates that reductions in arsenic concentrations at the WWNA have been achieved through source removal (the soil excavation interim action) and active ground water remediation. The ground water arsenic plume is limited in extent and remains confined to the original source area. Concentrations of arsenic in ground water have declined significantly through these combined activities (see discussion in Section 2.3), though recently concentrations appeared to have leveled off. The recovery wells at the site were shut down in December 2005 with FDEP approval, and closure monitoring has been conducted since that time (DOE 2006). At this time, DOE proposes that a “No Further Action With Controls” determination be made for the WWNA and that the site can proceed to closure. This requires the selection of the appropriate Risk Management Option (RMO) for the site under the State of Florida’s Contaminated Site Cleanup Criteria (Chapter 62-780 F.A.C.). Three RMOs are identified in F.A.C. Chapter 62-780. From a practical standpoint, the two main outcomes of those RMOs are either “No Further Action Without Controls” or “No Further Action With Controls.” Controls are considered to be either engineered features or administrative mechanisms that reduce or eliminate the migration of and/or exposure to contamination. A slurry wall is an example of an engineered control; a deed restriction is a type of IC. The need for controls is largely dictated by the CTLs that have been established for a site. The original cleanup goal for arsenic in ground water at the WWNA was the FDEP MCL (DOE 2000a). This MCL was originally set at 50 μg/L, but was later lowered to 10 μg/L. As discussed in Section 2.2, however, the more appropriate default CTL for arsenic is 100 μg/L based on poor ambient water quality in the site vicinity. In addition, the State of Florida’s current risk-based approach to cleanup allows levels of cleanup that are less stringent than default CTLs, provided these “alternative CTLs” are protective. Based on current site conditions at the WWNA, there are no complete exposure pathways to site-related contamination. Current contaminant concentrations in the subsurface pose no present or future threat to on-site or off-site receptors if current land and water uses are maintained. The only potentially unacceptable risks would be through use of shallow on-site ground water as a potable water source. The applicability of each RMO with respect to the WWNA is provided in this section. 3.1 No Further Action Without Controls (RMO I) RMO I requires that default CTLs be met in site ground water. As noted above, two wells have recently contained arsenic concentrations that are elevated above the default CTL of 100 μg/L; therefore, this RMO does not apply. Unrestricted use of ground water could result in unacceptable risks.

WWNA No Further Action With Controls Proposal U.S. Department of Energy Page 12 March 2007
3.2 No Further Action With Controls (RMO II and RMO III) ICs are required as part of a closure under either RMO II or RMO III. Both options allow on-site COPCs to exceed default CTLs, provided that default CTLs are met outside of the IC boundary. The main differences between the two RMOs with controls appear to be in plume size and potential for ground water use. These RMOs and their applicability to the WWNA are discussed in this section. 3.2.1 Risk Management Option II
In order for ground water to qualify for a closure under RMO II, one or more of several criteria must be met. Generally, the contamination must be contained within the site boundary, the plume must be stable and confined to the immediate source area, and the plume must be small in size. An RMO II closure requires the establishment of ICs to prevent ground water use and a demonstration that ground water has not adversely affected any surface water body in the area. The ambient ground water in the vicinity of the WWNA meets the definition of poor quality, as discussed in Section 2.2, and the default CTL of 100 μg/L for arsenic applies. A number of wells on site have consistently contained arsenic concentrations below this CTL over time. However, concentrations in a few wells have exceeded this CTL during recent sampling events (see Table A−2). It should be noted that only two sampling events have occurred since the ground water recovery system was shut down. Because ground water movement in the vicinity of the site is so slow, contaminants in the subsurface may still be equilibrating, and it is possible that arsenic will attenuate to levels below the applicable CTL over time. However, based on recent data, arsenic in WWNA ground water does not currently meet the default CTL. According to 62-780.200 (11), F.A.C., the contaminated ground water at the site would be defined as the water that exceeds applicable CTLs from Chapter 62-777, F.A.C. (i.e., water at the WWNA exceeding the 100 μg/L CTL for arsenic). Closure can be conducted under RMO II and alternative CTLs applied if contaminated ground water is confined to the immediate vicinity of the source area, is <1/4 acre in size, is not migrating away from the localized source area, and has not affected, and will not affect, a freshwater or marine surface water body (Option IID). The contaminated ground water at the WWNA is confined to an area of <1/4 acre and is located in the vicinity where the soil excavation interim action (e.g., source removal) was conducted. Monitoring data demonstrate that the plume is stable and is not migrating off site. Modeling indicates that concentrations beyond the site boundary will not exceed either the drinking water standard or the low yield/poor quality CTL. Likewise, because contamination will not move beyond the property boundary, it will not have an impact on any surface water bodies in the vicinity of the site. Based on the above, DOE proposes to proceed with closure of the WWNA under RMO II Option IID and to apply the default poor quality arsenic CTL of 100 μg/L to on-site ground water. Soil cleanup was completed in 1999 and approved by FDEP. Therefore, acceptance of this closure proposal by FDEP indicates that both soil and ground water cleanup are complete. DOE is working with the landowner (Pinellas County) to establish ICs at the site that will: (1) restrict future land use to industrial purposes; (2) prohibit the installation of shallow wells for ground water use; and (3) limit the depth of excavations. Once ICs are in place, there will be no

U.S. Department of Energy WWNA No Further Action With Controls Proposal March 2007 Page 13
potential current or future exposure pathways to contaminated ground water. ICs will need to be established and approved by FDEP before a formal No Further Action determination can be made. 3.2.2 Risk Management Option III
Because closure is proposed under RMO II, RMO III is discussed only briefly. The WWNA could be closed out under RMO III, but the justification would be the same as that provided for an RMO II closure. No alternative CTLs would be developed for alternative ground water uses because no ground water use is anticipated. No temporary point of compliance is required because contamination is confined to site boundaries. Therefore, the exceptions and greater flexibility offered under an RMO III closure are not needed at the WWNA.
4.0 Summary
• Arsenic in ground water is the sole COPC at the WWNA.
• The arsenic plume is limited to an area <1/4 acre in size, currently is stable, and is predicted to remain stable into the foreseeable future.
• DOE proposes an RMO II closure—No Further Action with Controls—under Option IID.
• It is DOE’s intention to move forward with the establishment of ICs for the entire Pinellas site. This will involve the property owners, local governments and public, and FDEP. The template restrictive covenant from FDEPs IC guidance (FDEP 2004) will be used as a starting point in preparing the IC.
• DOE has completed the closure monitoring prescribed by the RBCA rules. No further monitoring is planned.
5.0 References
DOE (U.S. Department of Energy), 1991. RCRA Facility Investigation Report, Pinellas Plant, Environmental Restoration Program, U.S. Department of Energy, Albuquerque Operations Field Office, Albuquerque, New Mexico, September. DOE (U.S. Department of Energy), 1993. RCRA Facility Assessment Plan, Wastewater Neutralization Area/Building 200, Pinellas Plant, Largo, Florida, U.S. Department of Energy, Albuquerque Operations Office, Albuquerque, New Mexico, June. DOE (U.S. Department of Energy), 1996. RCRA Facility Investigation Report, Wastewater Neutralization Area/ Building 200 Area, U.S. Department of Energy, Pinellas Plant, Largo, Florida, February. DOE (U.S. Department of Energy), 1997a. Corrective Measures Study Report/Corrective Measures Implementation Plan Wastewater Neutralization Area/Building 200 Area, June.

WWNA No Further Action With Controls Proposal U.S. Department of Energy Page 14 March 2007
DOE (U.S. Department of Energy), 1997b. Pinellas Plant Environmental Baseline Report, prepared by Lockheed Martin Specialty Components, Inc. for U.S. Department of Energy, Pinellas Area Office, June. DOE (U.S. Department of Energy), 2000a. Wastewater Neutralization Area/Building 200 Area Corrective Measures Implementation Plan Addendum, prepared by MACTEC-ERS, L.L.C., for the U.S. Department of Energy, January. DOE (U.S. Department of Energy), 2000b. Statement of Basis, Wastewater Neutralization Area/Building 200 Area, Pinellas STAR Center, September. DOE (U.S. Department of Energy), 2001. Pinellas STAR Center Quarterly Progress Report for October through December 2000, January. DOE (U.S. Department of Energy), 2003. Historical Review and Evaluation of Contaminants of Potential Concern, GJO-2002-359-TAC, February. DOE (U.S. Department of Energy), 2006. Letter from Jack Craig (DOE) to John Armstrong (FDEP) dated February 28, 2006, Subject: Risk-Based Corrective Action Closure of the Waste Water Neutralization Area at the Young-Rainey STAR Center, Largo, Florida. Duke Engineering and Services 1999. Geochemical Evaluation of Arsenic at the Pinellas Science, Technology, and Research Center Waste Water Neutralization Area, Florida, June. FDEP (Florida Department of Environmental Protection), 2002. Hazardous and Solid Waste Amendment Permit, January. FDEP (Florida Department of Environmental Protection), 2004. Institutional Controls Procedures Guidance, Division of Waste Management, November. McDonald, M.G., and A.W. Harbaugh, 1988. A Modular Three-dimensional Finite-Difference Ground-water Flow Model, U.S. Geological Survey, Techniques of Water Resources Investigations, Chapter 6, A1, 586 p. Zheng, C., 1990. MT3D: A Modular Three-dimensional Transport Model for Simulation of Advection, Dispersion, and Chemical Reactions of Contaminants in Ground-water Systems, U.S. EPA, R.S. Kerr Environmental Research Laboratory, Ada, Oklahoma.

Figure 1. Location of the WWNA at the STAR Center
U.S. D
epartment of E
nergy W
WN
A N
o Further Action W
ith Controls Proposal
March 2007
Page 15
400
4.5 Acre Site PIN-20
SWMU PIN-18 Wastewater Neutralization Area/
Building 200 Area
-- Road
1=1=1= Railroad
-- Fence
~Slurry Wall
200 o Feet
M:IPIN\041 \0005\10\N00933\N0093300.mxd carverh 10/2312006 2:23:13 PM
N
i
SWMU PIN-12 Building 100 and
Industrial Drain Leaks

Figure 2. WWNA Remediation Activities Timeline
WW
NA
No Further A
ction With C
ontrols Proposal U
.S. Departm
ent of Energy
Page 16 M
arch 2007

U.S. Department of Energy WWNA No Further Action With Controls Proposal March 2007 Page 17
Figure 3. WWNA Site Features.
Pond 5
0504 0508 .. Building
200
ID~o Q o 0502 0500 Q, 0 • • 0 • RW02
0507 0503 •• 0509 0505 .. o51o.J506
{70514 ""-'J. A -,0516
0517 0518 1
0519
• Monitoring Well
• Extraction Well
A Monitoring Well (Abandoned)
~ Fence
--Road
~Railroad
-- Tank
Concrete Pad
D Building
D Pond
"..J
0515
100 50
M;\PIN\04110005\101N009341N0093400.mxd carverh 1211312006 3 :21 :45 PM
Southwest Pond
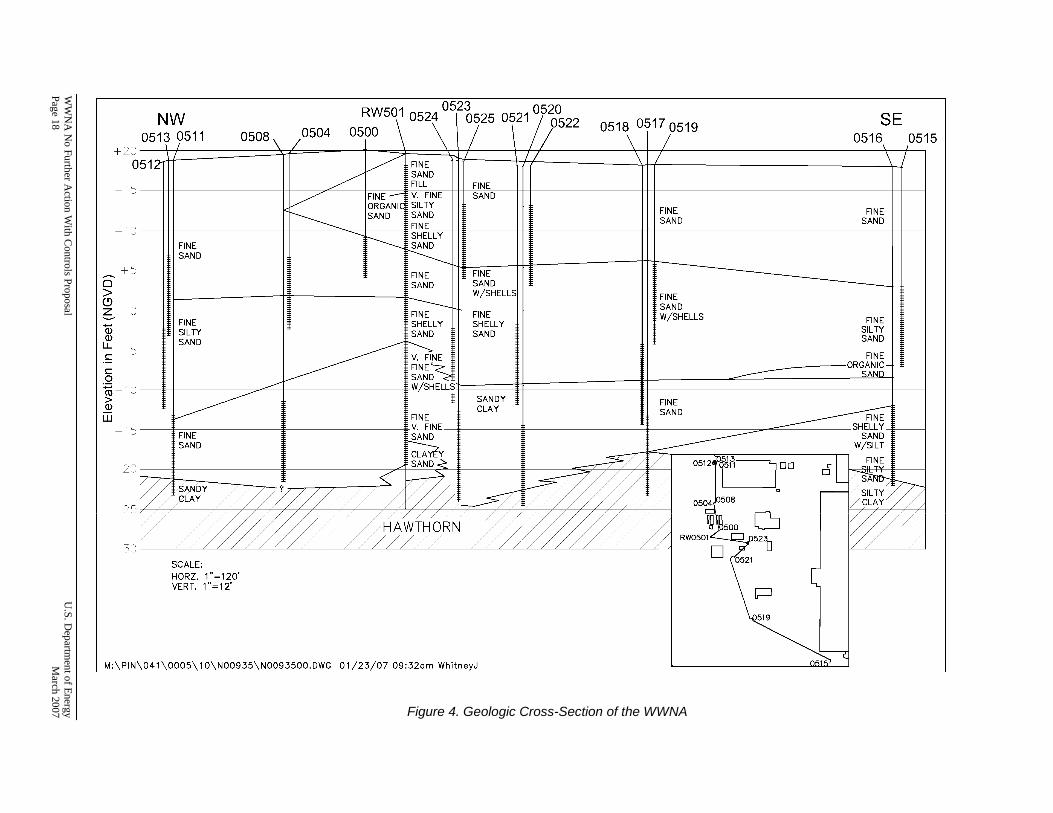
Figure 4. Geologic Cross-Section of the WWNA
WW
NA
No Further A
ction With C
ontrols Proposal U
.S. Departm
ent of Energy
Page 18 M
arch 2007
0500 \ -~ ' l 522 0518 051? 0519 NW RW501 0524 052~525 0521'70520 SE
0513 ?511 0508\ /0504 \ I I \ I 0516, p515
+20
't~t===========~nr====----r=~~~~~~=====tii~==========~hZ~==========================s:r-l 0~12 // FINE I I \ I \ I SAND FILL FINE
+15~-H~------------~--~--~---+F-IN-E---~~V-. =FIN=E~~~SA=N~D--4+~------------+H~--------------------------~~~
~ ORGANIC SILTY FINE FINE ......_____ SAND SAND SAND SAND
------- Fl N E +10~-H~------------~----~~--~~----~SHEL~LY~~----~~------------~+r-----------------------------++--1
~~~~D ~~
0 +5L-_ij~~----------UL--------j_ __ _j~FI~NE~~ilb~FIN~E~=d±!=============ttt==-----~~==---=~--------------JLL-J
SAND SAND W/SHELLS > FINE
~ ~-H~------------~------------~~-----~--~~~--4+--------------++rSAND __________________________ r+~ ~ 0 FINE FINE W/SHELLS FINE 1i) FINE SHELLY SHELLY SILTY Q) SILTY SAND SAND SAND
SAND _... ,.__ ~ -5~~~------------~---------=-~~~·~ ~~-4~----~+--------------+~----------------------------~~~ c --------------- V. F·~INE FINE ,.... FINE ~~~---ORGANIC-,_ -- _ SAND_ 0
_... SAND < J ======i-~===========tt======~==========t---~ ~ -1 0 r--~+----------~~~~------------~W/SHELLSf=
> -------- I ~ ~ FINE
SANDY CLAY
FINE SAND
-1 5 ~--~---=--------------cr--------------~V. FINE FINE SAND ~
~-+-------1 SAND ~
SAND W/SILT
• CLAYEY
~::~~///~///////~~,~~:1%~ ::Jr r -~~~~.~-~
~~~----~~------------~
ol~:~
SCALE: HORZ. 1"=120' VERT. 1"=12'
M:\PIN\041 \0005\1 O\N00935\N0093500.DWG 01/23/07 09:32am WhitneyJ
0521
.---V SILTY // /CLAY //
1%0 p
519

U.S. Department of Energy WWNA No Further Action With Controls Proposal March 2007 Page 19
Figure 5. Ground Water Contours, Shallow Surficial Aquifer, March 2006
Pond 5
100 50
0515
~ ~
0
• 0512 14.78
14.2 Well Number and Ground Water Elevation in Feet (MSL)
e Monitoring Well
• Extraction Well
-1-4- Ground Water Elevation Contour in Feet (MSL)
Contour Interval = 0.5 Feet
.... Groundwater Flow Direction
M:\PIN\041 \0005\10\N009371N0093700.mxd carverh 11231200712:12:03 PM
\
0518 14.05
•
0506 14.13
•
SVV01 Southwest Pond 13.4s
•

WWNA No Further Action With Controls Proposal U.S. Department of Energy Page 20 March 2007
Figure 6. Ground Water Contours, Deep Surficial Aquifer, March 2006
Pond 5
100 50 0
0507 14.3
•
• 0511 14.89
. 0508 14.92
' 0509 14.31
•
0507 14.3
• • Well Number and Ground Water Elevation in Feet (MSL)
Monitoring Well
Extraction Well
-1-4- Ground Water Elevation Contour in Feet (MSL)
Contour Interval = 0.5 Feet
...... Groundwater Flow Direction
M:\PIN\041\000511 O\N00936\N0093600.mxd carverh 1/2312007 12:33:17 PM
0516 13.79 .
Southwest Pond
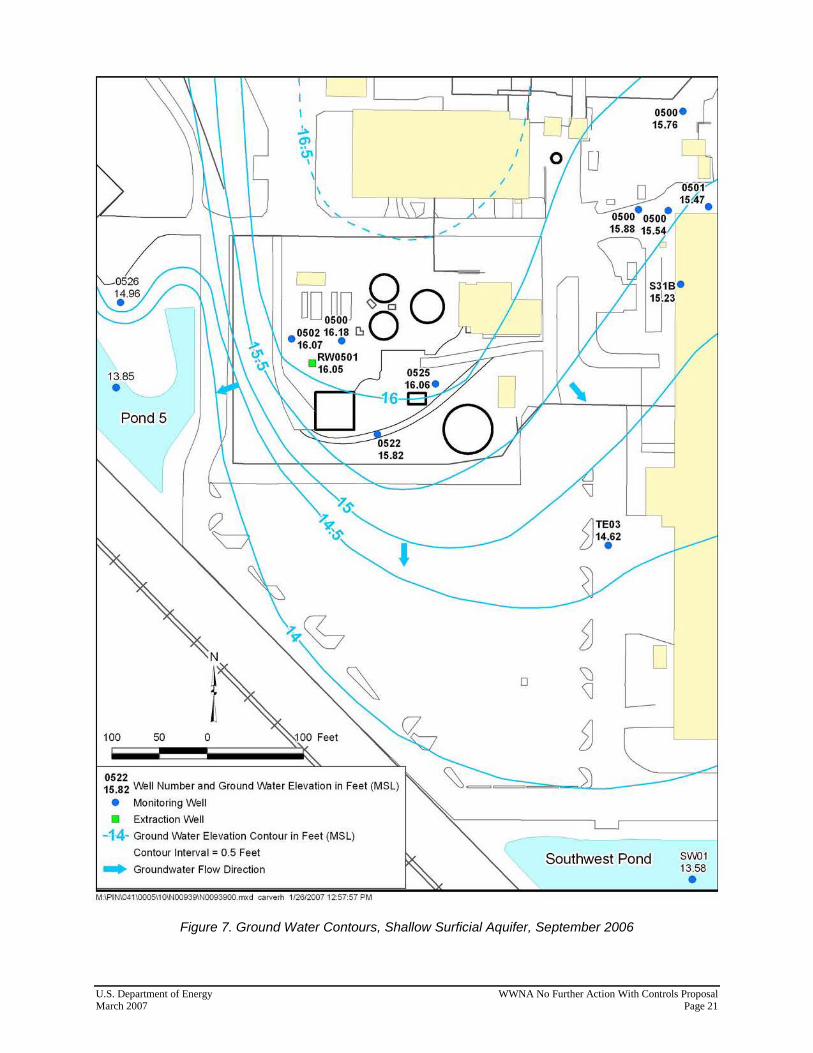
U.S. Department of Energy WWNA No Further Action With Controls Proposal March 2007 Page 21
Figure 7. Ground Water Contours, Shallow Surficial Aquifer, September 2006
13.85
• Pond 5
100 50
0522
0
15.S2 Well Number and Ground Water Elevation in Feet (MSL)
• Monitoring Well
• Extraction Well
-14- Ground Water Elevation Contour in Feet (MSL)
Contour Interval = 0 .5 Feet
.... Groundwater Flow Direction
M:\PIN\041 \0005\10\N00939\N0093900.mxd carverh 1126/200712:57:57 PM
D
Southwest Pond SW01 13.58
•

WWNA No Further Action With Controls Proposal U.S. Department of Energy Page 22 March 2007
Figure 8. Ground Water Contours, Deep Surficial Aquifer, September 2006
.... - 1-7 -
100
0509 15.2
50 0
Well Number and Ground Water Elevation in Feet (MSL)
• Monitoring Well
• Extraction Well
-1-5- Ground Water Elevation Contour in Feet (MSL)
Contour Interval = 0.5 Feet
... Groundwater Flow Direction
M:\PIN\041\0005\10\N00938\N0093800.mxd carverh 1/261200710:08:59 AM
0
I 0516
~--1_4_.1_;·::...._-
Southwest Pond

U.S. Department of Energy WWNA No Further Action With Controls Proposal March 2007 Page 23
Figure 9. WWNA Arsenic Plume Map, September 2006 Data. Arsenic concentrations in μg/L.
0502
0526 • <2.8
Pond 5
0508 ,..,.------. .......... -05_0_4_,<2:8---- --;--------,
<2.8 ..
[Jug Q 0 050~ - ' 76.5 ~ 0
1 ~ ~ ,• ' • • RW050,.1 a \ RW02 ~0523
rn.4 o~;,~-;8 D RW03 ! 0525 36.1 0521- 72.80
0522 3
'7
7.9 • o520 <2.8
0503 (? <2.8 ~0507 •• "--../ <2.8
0505
0509 3·6
<2.8 ..
0519 • <2.8
0510 . 0506 <2.8 <2.8
0
116 \ 8 Extraction Well - Inactive. Currently used as monitoring well~ 0
• Monitoring Well
~--_! 2006 Arsenic Plume
100 Feet 100 50 0
~are<! by
U.S. DEPARTMENT OF ENERGY S.M. SJZl.l&e~~r..goration GP.ANO.l.INCTION.COlMAOO No OE-AC01~G.D9•91
Arsenic Plume September and October 2006 Sampling
N
1 November 08, 2006 N0094000.mxd .mx

Figure 10. Cross-Section Showing Depth of Contamination. Arsenic concentrations in μg/L.
WW
NA
No Further A
ction With C
ontrols Proposal U
.S. Departm
ent of Energy
Page 24 M
arch 2007
+20 ~
+15
+10
+5 0 > (9
~ 0
1D Q)
LL -5 c c 0
~-10 > Q)
w -15
-20
-25
-30
NW 0502
I
(116)
SCALE:
HORZ. 1"=120' VERT. 1"=12'
RW0501
~ 0500
I
0523
\
(150) (76.5)
(35.9) SEPTEMBER 2006 ARSENIC RESULTS IN MICROGRAMS/L
\
M:\PIN\041 \0005\1 O\N00941 \N00941 OO.DWG 11/15/06 11 :OOam WhitneyJ
0524
\ \
0525
I I I
(72.8)
(35.9)
( <2.8)
(7.9)
(3.7)
( <2.8)
~o~oo D 0502 ~1:;]_
RW501~~;!524~ 0523 D r---l 0525
~20 0521 0522

U.S. Department of Energy WWNA No Further Action With Controls Proposal March 2007 Page 25
Figure 11. Comparison of Current Arsenic Plume (top) and Arsenic Plume in 500 Years (bottom). Constant Concentration Source, Kd = 63 L/kg. Arsenic concentrations in μg/L.

WWNA No Further Action With Controls Proposal U.S. Department of Energy Page 26 March 2007
Figure 12. Comparison of the 1998 Arsenic Plume to the 2006 Arsenic Plume. Arsenic concentrations in μg/L.
100
0502 116
50
N
i 0 Feet
• Monitoring Well
• Extraction Well ~--~ Arsenic Plume
M:\PIN\041 \0005\10\N00942\N0094200.mxd carverh 1124/2007 2:21 :36 PM
~ 0514 ( 5
0515~0516 ~5 <5
0510 <5 • o5o6 !1
<5 l)
0517 0518 4 <5 <10 0519
~
~
0510 . 0506 .(1 <2.8 <2.8 !)
0519 . 2 .8
D
~
~ 0

Appendix A
Supporting Information
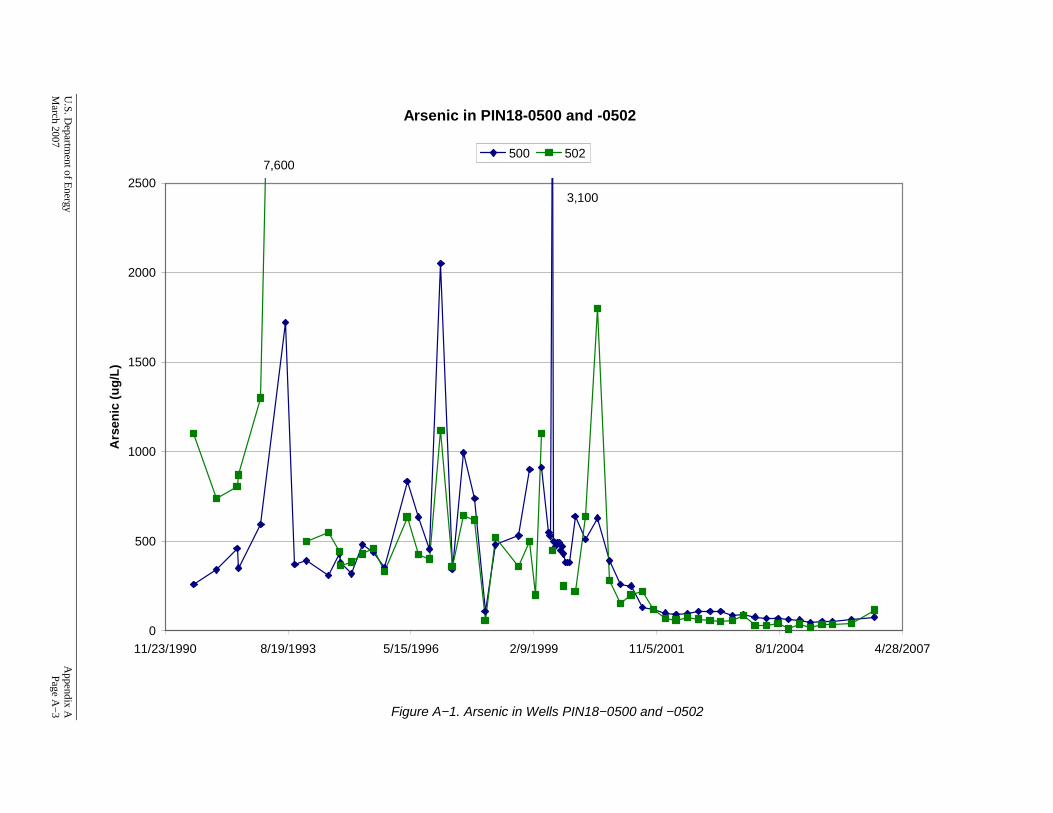
Figure A−1. Arsenic in Wells PIN18−0500 and −0502
Arsenic in PIN18-0500 and -0502
0
500
1000
1500
2000
2500
11/23/1990 8/19/1993 5/15/1996 2/9/1999 11/5/2001 8/1/2004 4/28/2007
Ars
enic
(u
g/L
)
500 5027,600
3,100
U.S. D
epartment of E
nergy A
ppendix A
March 2007
Page A−3

Figure A−2. Arsenic in Well PIN18−0501
Arsenic in PIN18-0501
0
100
200
300
400
500
600
700
800
11/23/1990 8/19/1993 5/15/1996 2/9/1999 11/5/2001 8/1/2004 4/28/2007
Ars
enic
(u
g/L
)
501
Appendix A
U
.S. Departm
ent of Energy
Page A−4
March 2007

Figure A−3. Arsenic in Wells PIN18−0521 and −0522
Arsenic in PIN18-0521 and -0522
0
50
100
150
200
250
300
350
400
450
500
11/23/1990 8/19/1993 5/15/1996 2/9/1999 11/5/2001 8/1/2004 4/28/2007
Ars
enic
(u
g/L
)
521 522
550
U.S. D
epartment of E
nergy A
ppendix A
March 2007
Page A−5

Figure A−4. Arsenic in Wells PIN18−0524 and −0525
Arsenic in PIN18-0524 and -0525
0
50
100
150
200
250
300
350
400
450
500
11/23/1990 8/19/1993 5/15/1996 2/9/1999 11/5/2001 8/1/2004 4/28/2007
Ars
enic
(u
g/L
)
524 525
1,500
Appendix A
U
.S. Departm
ent of Energy
Page A−6
March 2007

U.S. Department of Energy Appendix A March 2007 Page A−7
Table A−1. WWNA VC Data Since 2003
Well Date VC (μg/L) Data qualifiera
4/14/2003 1 U
4/21/2004 0.5 U 0500
4/11/2005 0.5 U
0501 4/14/2003 1 U
4/14/2003 1 U
4/21/2004 0.5 U 0502
4/11/2005 0.5 U
4/12/2003 1 U
4/17/2004 0.5 U 0503
4/9/2005 0.5 U
4/14/2003 1 U
4/21/2004 0.5 U 0504
4/11/2005 0.5 U
4/12/2003 1 U
4/17/2004 0.5 U 0505
4/9/2005 0.5 U
4/12/2003 1 U
4/17/2004 0.5 U 0506
4/9/2005 0.5 U
4/12/2003 1 U
4/17/2004 0.5 U 0507
4/9/2005 0.5 U
4/14/2003 1 U
4/20/2004 0.5 U 0508
4/11/2005 0.5 U
4/12/2003 1 U
4/17/2004 0.5 U 0509
4/9/2005 0.5 U
4/12/2003 1 U
4/17/2004 0.52 J 0510
4/9/2005 0.5 U
4/12/2003 1 U
4/21/2004 0.5 U 0511
4/9/2005 0.5 U
4/12/2003 1 U
4/21/2004 0.5 U 0512
4/9/2005 0.5 U
4/12/2003 1 U
4/21/2004 0.5 U 0513
4/9/2005 0.5 U
4/12/2003 1 U
4/17/2004 0.5 U 0514
4/9/2005 0.5 U

Table A−1 (continued). WWNA VC Data Since 2003
Appendix A U.S. Department of Energy Page A−8 March 2007
Well Date VC (μg/L) Data qualifiera
4/12/2003 1 U
4/17/2004 0.5 U 0515
4/9/2005 0.5 U
4/12/2003 1 U
4/17/2004 0.5 U 0516
4/9/2005 0.5 U
4/12/2003 1 U
4/17/2004 0.5 U 0517
4/9/2005 0.5 U
4/12/2003 1 U
4/17/2004 0.5 U 0518
4/9/2005 0.5 U
4/12/2003 1
4/17/2004 4.9
4/9/2005 0.5 U 0519
3/11/2006 5.2
4/14/2003 1 U
4/19/2004 0.5 U 0520
4/11/2005 0.5 U
4/14/2003 1 U
4/19/2004 0.5 U 0521
4/11/2005 0.5 U
4/14/2003 1 U
4/19/2004 0.5 U 0522
4/11/2005 0.5 U
4/14/2003 5.6
4/19/2004 0.5 U
4/11/2005 0.5 U 0523
3/13/2006 0.5 U
4/14/2003 1 U
4/19/2004 0.5 U 0524
4/11/2005 0.5 U
4/14/2003 1 U
4/19/2004 0.5 U 0525
4/11/2005 0.5 U
4/12/2003 1 U
4/21/2004 0.5 U 0526
4/9/2005 0.5 U

Table A−1 (continued). WWNA VC Data Since 2003
U.S. Department of Energy Appendix A March 2007 Page A−9
Well Date VC (μg/L) Data qualifiera
1/13/2003 1 U
4/7/2003 1 U
7/22/2003 1 U
10/2/2003 1 U
1/16/2004 0.5 U
4/6/2004 0.5 U
7/6/2004 0.5 U
4/5/2005 0.5 U
RW02
3/14/2006 0.5 U
1/13/2003 1 U
4/7/2003 1 U
7/22/2003 1 U
10/2/2003 1 U
1/16/2004 0.5 U
4/6/2004 0.5 U
7/6/2004 0.5 U
4/5/2005 0.5 U
RW03
3/14/2006 0.5 U
7/22/2003 1 U
10/2/2003 1 U
1/16/2004 0.5 U
4/6/2004 0.5 U
7/6/2004 0.5 U
4/5/2005 0.5 U
RW0501
3/14/2006 0.5 U aU = non-detect, J = estimated value between the detection limit and the reporting limit.

Appendix A U.S. Department of Energy Page A−10 March 2007
End of current text

U.S. Department of Energy Appendix A March 2007 Page A−11
Table A−2. WWNA Historical Arsenic Data Well 0501 was converted to recovery well RW0501 in June 2003. All concentrations are in μg/L. Blank cells indicate that the well was not sampled on that date.
Date 0500 0501 0502 0503 0504 0505 0506 0507 0508 0509 0510 0511 0512 0513 0514 0515 0516 0517 0518 0519 0520 0521 0522 0523 0524 0525 0526 RW02 RW03
7/15/1991 260 78 1100
1/15/1992 340 76 740
7/1/1992 459 92 804
7/15/1992 350 78 870
1/11/1993 592 94.8 1300
7/29/1993 1720 259 7600 14.8 10.5 10U 12 16.7 10U 10U 10U
10/15/1993 370 91
1/15/1994 390 120 500
7/15/1994 310 100 550 5U 5U 5U 5U 5U 5U 5U 5U
10/15/1994 430 116 445 6 6 5U 5U 5U 5U 5U 5U
10/22/1994 380 76.8 363 3.5 2U 3.1 2U 2U 2U 2U 2U 6.9 4 8.8 2U 2U 7.9 2U 2U 6.4 2.9 10 15 5.1 8.1 139
1/17/1995 317 117 384 2.3 2U 2.8 2U 2U 2U 2U 2U 2 2U 2U 2U 2U 2U 2U 2U 2U 2U 4.3 98 3.3 6.4 98.8
4/18/1995 480 99.5 429 3.4 2U 3 2U 2U 2U 2U 2U 2.3 2U 2U 2U 2U 2U 2U 2U 2U 2U 13.4 45.4 2.9 7.2 69.6
7/19/1995 440 110 460 3.6 2U 2 2U 2U 2U 2U 2U 5.5 2.6 2U 2U 2U 2U 2U 2U 2.2 2U 7.7 57 2.5 7.2 110
10/15/1995 353 31.7 329 5U 5U 5U 101 6.9
4/15/1996 836 84 635 36 232
7/15/1996 635 95 424 47 179
10/15/1996 457 108 401 34.9 41.4
1/15/1997 2050 88.3 1120 37.1 378
4/15/1997 342 113 359 5U 5U 7.4 5U 5U 5U 5.4 5U 5.1 5U 5U 5U 5U 5U 5U 5.3 5U 5U 14.6 29.7 5U 11.8 29.1
7/15/1997 993 101 645 5U 5U 7.2 6.8 37.7 15.6 254
10/17/1997 738 41 618 1U 1U 5.7 1U 1U 1U 8.2 1U 62.3 12.1 125
1/9/1998 110 300 56 10U 10U 10U 10U 10U 10U 10U 32 37 18 85
4/2/1998 480 100 520 10U 10U 10U 10U 10U 10U 10U 55 550 110 110
10/11/1998 530 110 360 10U 10U 26 28 10U 33 140 10U
1/8/1999 900 81 500 10U 10U 16 150 10U 28 220 10U
2/22/1999 200 10U
4/12/1999 910 100 1100 10U 10U 10U 10U 10U 63 110 10U 69 430 10U
6/11/1999 550 62 32
6/23/1999 530 16 33
7/11/1999 3100 110 450 10U 10U 54 83 10U 35 270 10U
7/23/1999 500 18 39
8/5/1999 470 17 31
8/20/1999 490 36 34
9/3/1999 490 57 32
9/17/1999 450 70 32
10/1/1999 470 110 29
10/7/1999 430 83 250 10U 10U 50 120 10U 34 70 10U
10/28/1999 380 94 29
11/11/1999 380 110 41
11/29/1999 380 91 32
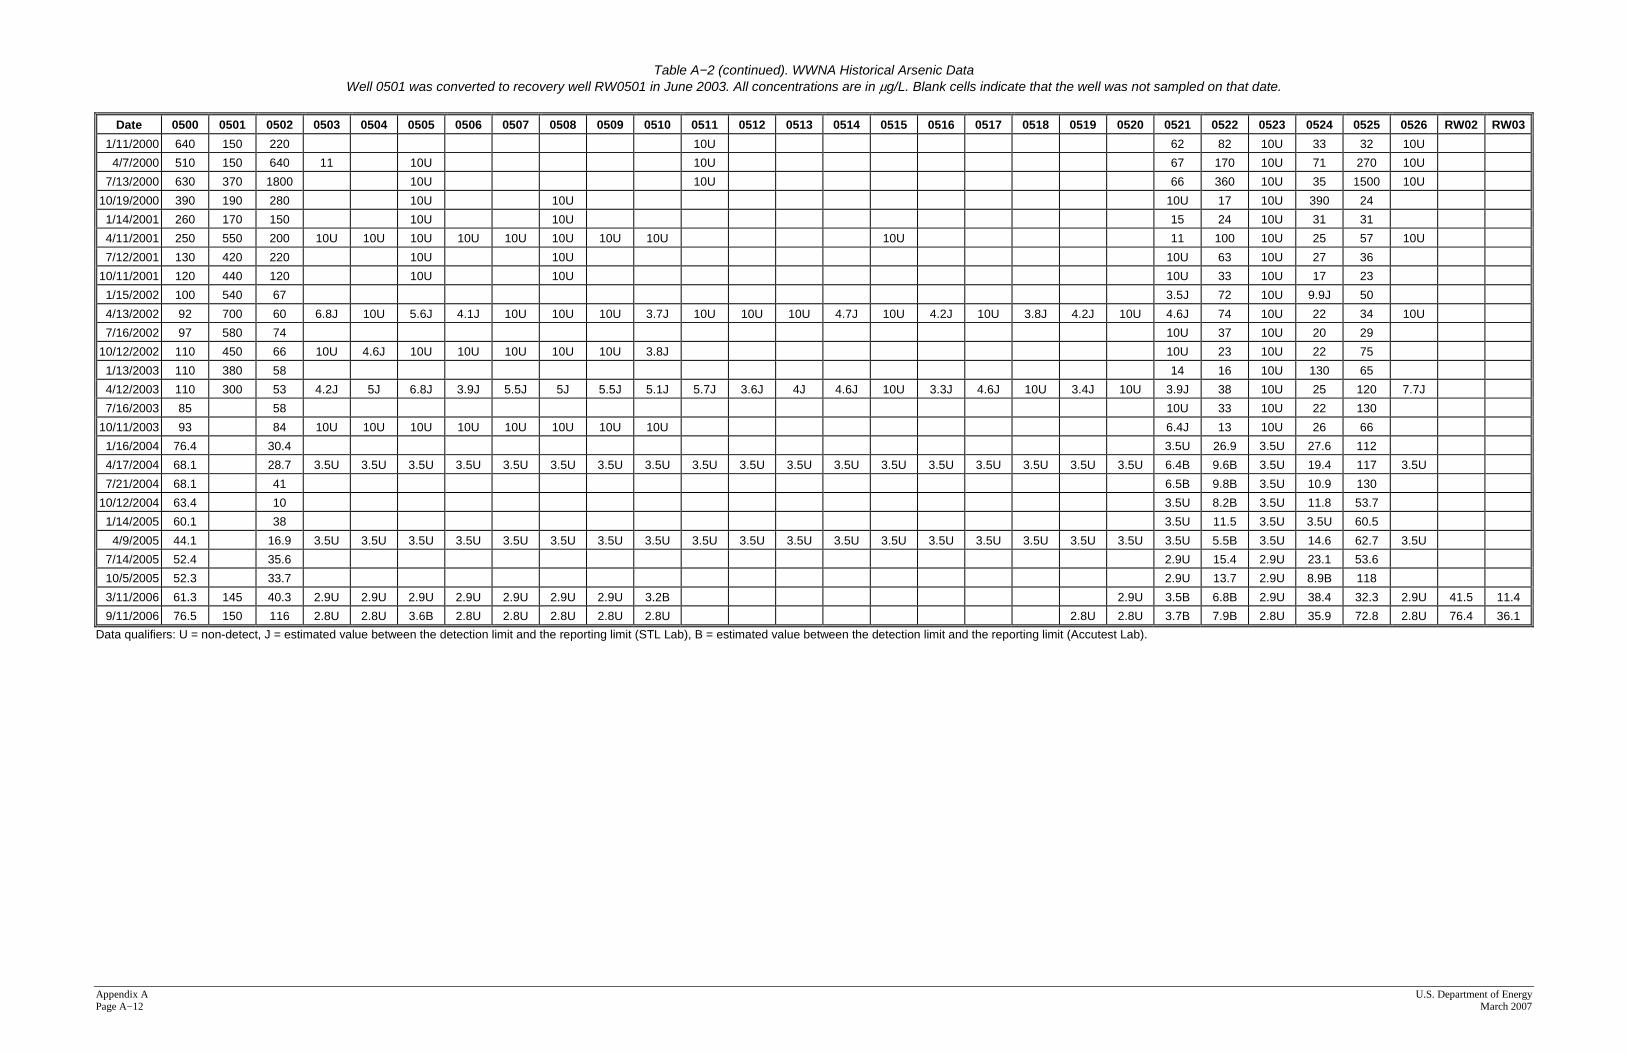
Table A−2 (continued). WWNA Historical Arsenic Data
Well 0501 was converted to recovery well RW0501 in June 2003. All concentrations are in μg/L. Blank cells indicate that the well was not sampled on that date.
Appendix A U.S. Department of Energy Page A−12 March 2007
Date 0500 0501 0502 0503 0504 0505 0506 0507 0508 0509 0510 0511 0512 0513 0514 0515 0516 0517 0518 0519 0520 0521 0522 0523 0524 0525 0526 RW02 RW03
1/11/2000 640 150 220 10U 62 82 10U 33 32 10U
4/7/2000 510 150 640 11 10U 10U 67 170 10U 71 270 10U
7/13/2000 630 370 1800 10U 10U 66 360 10U 35 1500 10U
10/19/2000 390 190 280 10U 10U 10U 17 10U 390 24
1/14/2001 260 170 150 10U 10U 15 24 10U 31 31
4/11/2001 250 550 200 10U 10U 10U 10U 10U 10U 10U 10U 10U 11 100 10U 25 57 10U
7/12/2001 130 420 220 10U 10U 10U 63 10U 27 36
10/11/2001 120 440 120 10U 10U 10U 33 10U 17 23
1/15/2002 100 540 67 3.5J 72 10U 9.9J 50
4/13/2002 92 700 60 6.8J 10U 5.6J 4.1J 10U 10U 10U 3.7J 10U 10U 10U 4.7J 10U 4.2J 10U 3.8J 4.2J 10U 4.6J 74 10U 22 34 10U
7/16/2002 97 580 74 10U 37 10U 20 29
10/12/2002 110 450 66 10U 4.6J 10U 10U 10U 10U 10U 3.8J 10U 23 10U 22 75
1/13/2003 110 380 58 14 16 10U 130 65
4/12/2003 110 300 53 4.2J 5J 6.8J 3.9J 5.5J 5J 5.5J 5.1J 5.7J 3.6J 4J 4.6J 10U 3.3J 4.6J 10U 3.4J 10U 3.9J 38 10U 25 120 7.7J
7/16/2003 85 58 10U 33 10U 22 130
10/11/2003 93 84 10U 10U 10U 10U 10U 10U 10U 10U 6.4J 13 10U 26 66
1/16/2004 76.4 30.4 3.5U 26.9 3.5U 27.6 112
4/17/2004 68.1 28.7 3.5U 3.5U 3.5U 3.5U 3.5U 3.5U 3.5U 3.5U 3.5U 3.5U 3.5U 3.5U 3.5U 3.5U 3.5U 3.5U 3.5U 3.5U 6.4B 9.6B 3.5U 19.4 117 3.5U
7/21/2004 68.1 41 6.5B 9.8B 3.5U 10.9 130
10/12/2004 63.4 10 3.5U 8.2B 3.5U 11.8 53.7
1/14/2005 60.1 38 3.5U 11.5 3.5U 3.5U 60.5
4/9/2005 44.1 16.9 3.5U 3.5U 3.5U 3.5U 3.5U 3.5U 3.5U 3.5U 3.5U 3.5U 3.5U 3.5U 3.5U 3.5U 3.5U 3.5U 3.5U 3.5U 3.5U 5.5B 3.5U 14.6 62.7 3.5U
7/14/2005 52.4 35.6 2.9U 15.4 2.9U 23.1 53.6
10/5/2005 52.3 33.7 2.9U 13.7 2.9U 8.9B 118
3/11/2006 61.3 145 40.3 2.9U 2.9U 2.9U 2.9U 2.9U 2.9U 2.9U 3.2B 2.9U 3.5B 6.8B 2.9U 38.4 32.3 2.9U 41.5 11.4
9/11/2006 76.5 150 116 2.8U 2.8U 3.6B 2.8U 2.8U 2.8U 2.8U 2.8U 2.8U 2.8U 3.7B 7.9B 2.8U 35.9 72.8 2.8U 76.4 36.1
Data qualifiers: U = non-detect, J = estimated value between the detection limit and the reporting limit (STL Lab), B = estimated value between the detection limit and the reporting limit (Accutest Lab).

U.S. Department of Energy Appendix A March 2007 Page A−13
Table A−3. WWNA Well Completion Information
Well Well Type Completion Zone Depth (ft bls)
Screen Interval (ft bls)
Installation Date
PIN18–0500 Monitoring Well Upper Surficial Aquifer 16 11–16 11/19/1990
PIN18–0501a Monitoring Well Upper Surficial Aquifer 16 11–16 11/19/1990
PIN18–0502 Monitoring Well Upper Surficial Aquifer 16 11–16 11/19/1990
PIN18–0503 Monitoring Well Surficial 23 10–20 7/23/1993
PIN18–0504 Monitoring Well Surficial 22 13–22 7/24/1993
PIN18–0505 Monitoring Well Surficial 20.5 10.5–20.5 7/25/1993
PIN18–0506 Monitoring Well Surficial 22 12–22 7/25/1993
PIN18–0507 Monitoring Well Deep Surficial Aquifer 37 27–37 7/26/1993
PIN18–0508 Monitoring Well Deep Surficial Aquifer 41 31–41 7/20/1993
PIN18–0509 Monitoring Well Deep Surficial Aquifer 37.5 27.5–37.5 7/20/1993
PIN18–0510 Monitoring Well Deep Surficial Aquifer 37.5 27.5–37.5 7/31/1993
PIN18–0511b Monitoring Well Deep Surficial Aquifer 42 32–42 9/26/1994
PIN18–0512b Monitoring Well Surficial 31 21–31 9/27/1994
PIN18–0513b Monitoring Well Surficial 23 12–22 9/28/1994
PIN18–0514b Monitoring Well Deep Surficial Aquifer 42.5 32.5–42.5 9/28/1994
PIN18–0515b Monitoring Well Surficial 30.5 22.5–32.5 9/29/1994
PIN18–0516b Monitoring Well Surficial 22 12.5–22 9/29/1994
PIN18–0517b Monitoring Well Deep Surficial Aquifer 41.5 31.5–41.5 9/29/1994
PIN18–0518b Monitoring Well Surficial 32.5 22.5–32.5 9/30/1994
PIN18–0519 Monitoring Well Surficial 22.5 12.5–22.5 10/1/1994
PIN18–0520 Monitoring Well Deep Surficial Aquifer 42.5 32.5–42.5 10/3/1994
PIN18–0521 Monitoring Well Surficial 30 20–30 10/4/1994
PIN18–0522 Monitoring Well Upper Surficial Aquifer 15 5–15 10/4/1994
PIN18–0523 Monitoring Well Deep Surficial Aquifer 42.5 32.5–42.5 10/5/1994
PIN18–0524 Monitoring Well Surficial 30 20–30 10/5/1994
PIN18–0525 Monitoring Well Upper Surficial Aquifer 15 5–15 10/5/1994
PIN18–0526 Monitoring Well Surficial 30 19.5–29 10/4/1994
PIN18–RW02 Recovery Well Surficial 23 10–20 9/7/2000
PIN18–RW03 Recovery Well Surficial 27 9–24 9/7/2000
PIN18–RW0501a Recovery Well Upper Surficial Aquifer 16 11–16 6/5/2003 aMonitoring well PIN18−0501 was converted to recovery well PIN18−RW0501 in June 2003. bMonitoring wells PIN18−0511 through −0518 were abandoned in August 2006.

Appendix A U.S. Department of Energy Page A−14 March 2007
End of current text
Appendix B
Modeling of Ground Water Flow and Arsenic Transport at the Wastewater Neutralization Area,
Young - Rainey STAR Center, Pinellas County, Florida

U.S. Department of Energy Appendix B March 2007 Page B−iii
Contents Acronyms and Abbreviations .................................................................................................... B−v B1.0 Introduction.................................................................................................................... B−1 B2.0 Modeling Objectives...................................................................................................... B−1 B3.0 Conceptual Model.......................................................................................................... B−2
B3.1 Ground Water Flow System............................................................................... B−2 B3.2 Hydraulic Properties .......................................................................................... B−2 B3.3 Sources and Sinks .............................................................................................. B−3 B3.4 Arsenic Transport............................................................................................... B−3
B4.0 Computer Model ............................................................................................................ B−4 B5.0 Model Construction ....................................................................................................... B−5
B5.1 Model Domain ................................................................................................... B−5 B5.2 Hydraulic Parameters......................................................................................... B−7 B5.3 Flow Sources, Sinks, and Boundary Conditions................................................ B−7 B5.4 Transport Parameters ......................................................................................... B−8
B6.0 Model Calibration .......................................................................................................... B−9 B6.1 Calibration Targets............................................................................................. B−9 B6.2 Calibration Performance .................................................................................. B−11
B7.0 Predictive Simulations ................................................................................................. B−13 B7.1 Base-Case Simulation ...................................................................................... B−14 B7.2 Constant Concentration Source in the Area of Arsenic Contamination .......... B−20 B7.3 Simulations of Limited Sorption...................................................................... B−20
B8.0 Summary and Conclusions .......................................................................................... B−35 B9.0 References.................................................................................................................... B−35
Figures Figure B−1. Boundary Conditions in Model Layer 1 ............................................................ B−6 Figure B−2. Boundary Conditions in Model Layer 2 ............................................................ B−8 Figure B−3. Model-Computed Ground-Water Elevations (ft above msl) in Layer 1 .......... B−10 Figure B−4. Model-Computed Ground-Water Elevations (ft above msl) in Layer 2 .......... B−11 Figure B−5. Scatter Plot of Observed and Model-Computed Water Elevations
(ft above msl) ................................................................................................... B−13 Figure B−6. Initial Arsenic Concentrations >100 μg/L in Layer 1 of the Transport Model B−15 Figure B−7. Base-Case (Simulation 1) Computed Arsenic Concentrations (>100 μg/L) in
Layer 1 after 50 Years of Transport................................................................. B−16 Figure B−8. Base-Case (Simulation 1) Computed Arsenic Concentrations (>100 μg/L) in
Layer 1 after 100 Years of Transport............................................................... B−17 Figure B−9. Base-Case (Simulation 1) Computed Arsenic Concentrations (>100 μg/L) in
Layer 1 after 250 Years of Transport............................................................... B−18 Figure B−10. Base-Case (Simulation 1) Computed Arsenic Concentrations (>100 μg/L) in
Layer 1 after 500 Years of Transport............................................................... B−19 Figure B−11. Simulation 2 Arsenic Concentrations (>100 μg/L) in Layer 1 after 50 Years
of Transport...................................................................................................... B−21 Figure B−12. Simulation 2 Arsenic Concentrations (>100 μg/L) in Layer 1 after 100 Years
of Transport...................................................................................................... B−22

Appendix B U.S. Department of Energy Page B−iv March 2007
Figure B−13. Simulation 2 Arsenic Concentrations (>100 μg/L) in Layer 1 after 250 Years of Transport...................................................................................................... B−23
Figure B−14. Simulation 2 Arsenic Concentrations (>100 μg/L) in Layer 1 after 500 Years of Transport...................................................................................................... B−24
Figure B−15. Simulation 3 Arsenic Concentrations (>100 μg/L) in Layer 1 after 50 Years of Transport...................................................................................................... B−25
Figure B−16. Simulation 3 Arsenic Concentrations (>100 μg/L) in Layer 1 After 100 Years of Transport...................................................................................................... B−26
Figure B−17. Simulation 3 Arsenic Concentrations (>100 μg/L) in Layer 1 after 250 Years of Transport...................................................................................................... B−27
Figure B−18. Simulation 4 Arsenic Concentrations (>100 μg/L) in Layer 1 after 50 Years of Transport...................................................................................................... B−28
Figure B−19. Simulation 4 Arsenic Concentrations (>100 μg/L) in Layer 1 after 100 Years of Transport...................................................................................................... B−29
Figure B−20. Simulation 4 Arsenic Concentrations (>100 μg/L) in Layer 1 after 250 Years of Transport...................................................................................................... B−30
Figure B−21. Simulation 4 Arsenic Concentrations (>100 μg/L) in Layer 1 after 500 Years of Transport...................................................................................................... B−31
Figure B−22. Simulation 4 Arsenic Concentrations (>50 μg/L) in Layer 1 After 500 Years of Transport...................................................................................................... B−32
Figure B−23. Simulation 3 Arsenic Concentrations (>10 μg/L) in Layer 1 after 500 Years of Transport...................................................................................................... B−33
Figure B−24. Simulation 4 Arsenic Concentrations (>10 μg/L) in Layer 1 After 500 Years of Transport...................................................................................................... B−34
Tables Table B−1. Hydraulic and Transport Parameters Used in the Model........................................ B−7 Table B−2. Water Elevation Residuals in the WWNA Flow Model ....................................... B−12 Table B−3. Summary of Predictive Simulations ..................................................................... B−14

U.S. Department of Energy Appendix B March 2007 Page B−v
Acronyms and Abbreviations
bls below land surface ft feet ft/day feet per day ft/yr feet per year in/yr inches per year IWNF industrial wastewater neutralization facility Kd soil/water distribution coefficient kg/L kilograms per liter L/kg liters per kilogram msl mean sea level μg/L micrograms per liter STAR Science, Technology, and Research WWNA Wastewater Neutralization Area

Appendix B U.S. Department of Energy Page B−vi March 2007
End of current text

U.S. Department of Energy Appendix B March 2007 Page B−1
B1.0 Introduction
This appendix describes the development of a numerical model that is used to project the future disposition of arsenic in ground water at the Young - Rainey Science, Technology, and Research (STAR) Center in Pinellas County, Florida. The model specifically simulates ground water flow and concomitant transport of arsenic in the surficial aquifer underlying the Wastewater Neutralization Area (WWNA). From August 1997 to December 2005, ground water was extracted from shallow wells in the area and subsequently discharged to the industrial wastewater neutralization facility (IWNF), located on the north end of the WWNA. As discussed in the main text of this report, this extraction system appeared to be successful in reducing local arsenic concentrations significantly below the concentrations that were observed for this constituent in 1998. The model discussed herein is used to estimate how the arsenic remaining in the surficial aquifer will migrate in future years now that ground water in the area is no longer affected by pumping via the extraction system. Though monitored arsenic concentrations at the WWNA have dropped in recent years in response to remediation by ground water removal, the concentration data collected prior to and during the pumping are insufficient for developing a calibrated model of arsenic transport. As a consequence, only the flow portion of the model is calibrated, and potential arsenic migration and fate is examined by conducting multiple transport simulations with each one differing with respect to the transport parameters used. The flow calibration is based on aquifer water levels observed recently during the wet season at the STAR Center, which are assumed to occur in a steady state throughout each year. This approach leads to conservative predictions of arsenic transport in the sense that the average linear ground water velocities resulting from the wet season flow system are noticeably higher than those that appear to occur during the dry season. As discussed in following sections of this appendix, retardation of arsenic transport is expected to limit its migration in coming years, even under the relatively fast flow velocities produced by the flow model.
B2.0 Modeling Objectives
Because of the lack of adequate arsenic concentration data for transport model calibration, the objective of this investigation was not to provide an exhaustive evaluation of arsenic fate that accounts for all possible physicochemical phenomena that could feasibly affect arsenic transport in the future. Rather, the model produced for this evaluation of the WWNA was intended to provide conservative estimates of arsenic transport away from the existing area of elevated arsenic concentration (i.e., greater than 10 micrograms per liter [μg/L]) now that ground water pumping is no longer used to remove arsenic from the subsurface. To meet this latter purpose, one of the simulations presented herein is based on the conservative assumptions that the mass of dissolved arsenic in the area of elevated concentration remains constant and that its retardation will be considerably less than the study of local arsenic chemistry (Duke Engineering and Services 1999) indicates.

Appendix B U.S. Department of Energy Page B−2 March 2007
B3.0 Conceptual Model
B3.1 Ground Water Flow System As discussed in the main text of this report, the surficial aquifer at the STAR Center consists of silty to shelly sands, and the average thickness of the aquifer at the WWNA is about 35 feet (ft). Depth to water varies from about 1 to 5 ft below land surface (bls), and no ground water is used from the aquifer because of its poor yield and poor quality. Because the surficial aquifer is underlain by the low-permeability Hawthorn Group, it is effectively isolated from the upper Floridan aquifer, the top of which occurs at least 100 ft bls at the site. Ground water flow in the shallow zone of the surficial aquifer appears to vary from that in the deep zone, as discussed in Section 2.1.1 of the main report. Consequently, the numerical model developed for this study takes into account the distinct flow occurring in each zone.
Ground water flow through the area of arsenic contamination in the shallow portion of the surficial aquifer tends to diverge after leaving the elevated concentration area, flowing to the south, southwest, and southeast (Figure 5 and Figure 7, main report). In contrast, flow in the deep surficial aquifer is predominantly toward the southeast, with some of the water in the eastern part of the area of elevated concentration flowing more directly eastward (Figure 6 and Figure 8, main report). To a large extent, the observed ground water flow directions at WWNA are controlled by the presence of three ponds west and south of the WWNA. Section 2.1.1 of the main report discusses how shallow-zone water levels measured since the excavation of Pond 5 (west of the WWNA) in early 2006 show ground water in the western half of the arsenic-contaminated area moving toward and eventually discharging to the pond. Also, much of the shallow zone ground water migrating to the southeast appears to discharge to the Southwest Pond (Figure 7 in the main report) and the South Pond, which lies directly east of the Southwest Pond. Though water levels measured in the deep surficial aquifer do not necessarily indicate that ground water in this zone discharges upward toward the ponds, discharge of at least a portion of the deep ground water to the ponds appears possible. Other than the three ponds near the WWNA, there is a lack of distinct hydrologic boundaries, such as no-flow zones or lines of prescribed head, in the area being investigated. Indeed, this relative lack of clear hydrologic boundaries for ground water flow in the surficial aquifer is pervasive throughout much of the STAR Center and in neighboring areas. Accordingly, it is virtually necessary to adopt boundary conditions for flow models of the aquifer that take into account observed ground water levels either at the boundaries themselves or at short distances hydraulically downgradient of them. B3.2 Hydraulic Properties Estimates of horizontal hydraulic conductivity for the fine-grained sands comprising the surficial aquifer on the basis of aquifer testing tend to range between 0.1 and 9 feet per day (ft/day), and a value of 1 ft/day is considered a representative average for this parameter (DOE 2002). The tendency of shallow surficial aquifer water levels to differ from underlying deep surficial aquifer water levels, such as those observed when one zone is pumped and the other is not, indicates that a horizontal-to-vertical anisotropy exists with regard to the aquifer’s hydraulic conductivity. On

U.S. Department of Energy Appendix B March 2007 Page B−3
the basis of such observations, a representative vertical hydraulic conductivity for the aquifer is expected to be about 0.1 to 0.01 of the horizontal value. As alluded to in Section 2.1.1 of the main report, a porosity of 0.3, or 30 percent, appears to be a reasonable estimate of this parameter for the surficial aquifer. Horizontal hydraulic gradients in the two zones of the surficial aquifer vary depending on whether dry season (ending in May or June) or wet season (ending in October or November) conditions prevail at the site at any given time. Figure 5 and Figure 7 of the main report suggest that, with the exception of the area lying directly between the area of elevated arsenic concentration and Pond 5, horizontal hydraulic gradients in the shallow surficial aquifer generally range between 0.0008 and 0.002 (dimensionless). The comparable range for horizontal hydraulic gradients in the deep surficial aquifer, based on Figure 6 and Figure 8 of the main report, is 0.004 to 0.0015. Following Darcy’s Law calculations mentioned in Section 2.1.1 of the main report, a hydraulic conductivity of 1 ft/day, and an effective porosity of 0.3, these hydraulic gradients result in estimated average linear ground water velocities for the surficial aquifer that range between 2 and 10 ft per year (ft/yr). B3.3 Sources and Sinks Most of the ground water in the portion of the STAR Center that comprises the WWNA is derived from horizontal flow from hydraulically upgradient areas, particularly to the north and northwest. Another source of the local ground water is recharge of the saturated zone in unpaved areas as a result of rainfall on those areas or the diversion of sheet flow runoff to them. A previous modeling investigation (DOE 2002) indicated that 5.5 inches per year (in/yr), or 0.00126 ft/day, is a reasonable estimate of the recharge rate in unpaved portions of the STAR Center. Ground water leaves the WWNA and surrounding locales primarily via discharge to the ponds and horizontal flow away from the area. Some discharge of ground water also occurs as evapotranspiration (ET) from unpaved areas. Because it is difficult to quantify the magnitude of ET at the STAR Center, the previously discussed modeling study of the site did not directly assess this component and instead used the estimated recharge rate mentioned above (5.5 in/yr) to represent the net recharge that occurs after ET is taken into account (i.e., infiltration minus ET). The same approach is used in this modeling assessment. In addition to the cessation of pumping from wells historically used to withdraw arsenic-contaminated water from the WWNA, two other extraction wells located near the northwest corner of Building 100 have been taken out of operation. As a consequence, no point sinks are located at the WWNA or surrounding areas. B3.4 Arsenic Transport The transport of dissolved arsenic from the existing area of arsenic contamination is affected by hydrodynamic dispersion and sorption to aquifer sediments. Longitudinal dispersivity, which affects mechanical dispersion in the direction of ground water flow, is expected to vary with the transport distance of the arsenic plume. As a general rule, a longitudinal dispersivity of about 10 percent of a contaminant’s transport distance is considered a reasonable estimate of this parameter (Gelhar et al. 1985). Field studies suggest that the horizontal dispersivity that is

Appendix B U.S. Department of Energy Page B−4 March 2007
transverse to the longitudinal dispersivity can be estimated at 10 percent of the longitudinal value, and transverse vertical dispersivity can be estimated at 1 percent of the longitudinal value. A previous study of site sediments and ground water (Duke Engineering and Services 1999) indicated that arsenic’s mobility in the surficial aquifer is extremely limited because of its tendency to sorb to aquifer sediments. The site-specific arsenic soil/water distribution coefficient (Kd) determined by 24 measurements during this study ranged from 20 to 129 liters per kilogram (L/kg), with an average value of 63 L/kg. The following equation and values of 1.6 kilograms per liter (kg/L) for dry bulk soil density, 63 L/kg for Kd, and 0.3 for porosity produce a site-specific arsenic retardation factor of 337.
Retardation factor = 1 + (bulk density × Kd)/porosity An additional factor that should be taken into account when assessing transport of arsenic at the WWNA is the potential fate of this constituent if and when it discharges to the ponds in the area, which can occur, for instance, if arsenic is eventually transported westward as far as Pond 5. The resulting arsenic concentrations in surface water are not expected to be threatening to aquatic biota for two reasons. First, arsenic concentrations in ground water reaching the ponds likely will be less than applicable surface water standards. Second, it is likely that the dilution potential of Pond 5 and the other ponds, if affected, would produce arsenic concentrations in the surface water that would be far less than those in the ground water discharging to them.
B4.0 Computer Model
Ground water flow was assumed to be in a steady state and was simulated with the finite-difference code MODFLOW, as developed by the U.S. Geological Survey (McDonald and Harbaugh 1988, Harbaugh and McDonald 1996). Arsenic transport was simulated using the finite-difference code MT3DMS (Zheng 1990, Zheng and Wang 1999). Both of these codes have been applied for many years to evaluate contaminant migration in ground water systems. The graphical user interface known as Groundwater Vistas, Version 4 (ESI 2005) was used to enter data into each of the models and graphically analyze modeling results. MODFLOW only simulates flow in the saturated zone of an aquifer and is, therefore, incapable of explicitly representing flow through the unsaturated sediments that overly the saturated zone. This limitation is not expected to be a problem, however, for the WWNA flow model. Because this modeling effort views ground water flow at the site to occur as a steady-state process, recharge of the saturated zone resulting from precipitation and subsequent seepage through the unsaturated zone is simply treated as a constant flux of water. Moreover, even if simulation of transient ground water flow was subsequently needed for evaluating arsenic transport at the facility, prescribed recharge fluxes coincident with rainfall events could be invoked in the model because the travel time from land surface to the water table is quite short given the small thickness of the unsaturated zone (approximately 1 to 5 ft). MT3DMS accounts for advective-dispersive transport in ground water as affected by equilibrium sorption of dissolved constituents on aquifer sediments. The velocities used in MT3DMS to both account for contaminant advection and calculate hydrodynamic dispersion coefficients are derived from MODFLOW output. Though the representation of sorption in MT3DMS can be

U.S. Department of Energy Appendix B March 2007 Page B−5
either linear or nonlinear, it is assumed in this study to be linear. This approach involves the selection of a value for Kd, from which a transport retardation factor can be calculated (Section B3.4). Though simulation of linear, equilibrium sorption represents somewhat of a simplification of dynamic geochemical processes in the aquifer that can temporally affect arsenic mobility (and retardation), it is not expected to limit the relevance of this investigation, particularly given the objective of this modeling effort to focus on conservative estimation of future arsenic fate.
B5.0 Model Construction
B5.1 Model Domain As mentioned in Section B3.1 of this appendix, distinct hydrologic boundaries for the surficial aquifer within and near the STAR Center occur only at ponds, making it very difficult to develop a flow and transport model whose perimeter is everywhere aligned with such boundaries. Consequently, the approach taken in selecting the WWNA model domain was to establish model borders that were unlikely to be affected by arsenic transport over a period of several hundred years, and then let adopted boundary conditions at those borders be the determinants of flow across them. More specifically, all boundaries of the model were selected such that they were either located hydraulically upgradient of the existing area of arsenic contamination or sufficiently far downgradient of this area that it would likely take hundreds of years or more for arsenic to reach them. A map of the area selected for modeling is presented in Figure B−1. Because ground water flow at the WWNA is predominantly toward the west, south and southeast, the north boundary of the model (Figure B−1) represents an area that will probably never be affected by arsenic contamination. As shown in Figure B−1, the model’s west boundary, which could potentially be affected by arsenic transport, extends only about 200 ft west of the existing area of arsenic contamination (defined by arsenic concentrations > 10 μg/L). This boundary was selected because water elevation data collected at monitoring wells screened in the shallow surficial aquifer at the WWNA since construction of Pond 5 (Figure 5 and Figure 7, main report) indicate that the pond tends to act as an area of ground water discharge. Thus, shallow-zone ground water moving westward toward Pond 5 is unlikely to migrate much farther west than the easternmost edge of the pond. In addition, water levels at wells screened in the deep portion of the aquifer (Figure 6 and Figure 8, main report) indicate that ground water in this zone migrates mostly to the southeast and east-southeast, and is not strongly affected by discharge to the ponds occurring in the overlying shallow portion of the aquifer. To account for the tendency of a large amount of shallow-zone ground water and virtually all deep-zone ground water to flow to the southeast, the model’s east and south boundaries have been established about 600 to 700 ft away from the area of elevated arsenic concentration (Figure B−1). A conservative (i.e., non-retarded) constituent migrating at a relatively low velocity of 2 ft/yr (as suggested in Section B3.2) from the area of high arsenic concentration would take about 300 to 350 years to reach these boundaries, and the comparable travel time under an average velocity of 10 ft/yr would be about 60 to 70 years. Travel times of tens to hundreds of years would also be required for a conservative constituent to migrate from the existing area of arsenic contamination to the southwest model boundary, which is aligned with the railroad tracks that skirt the site in a northwest-southeast direction. The railroad alignment
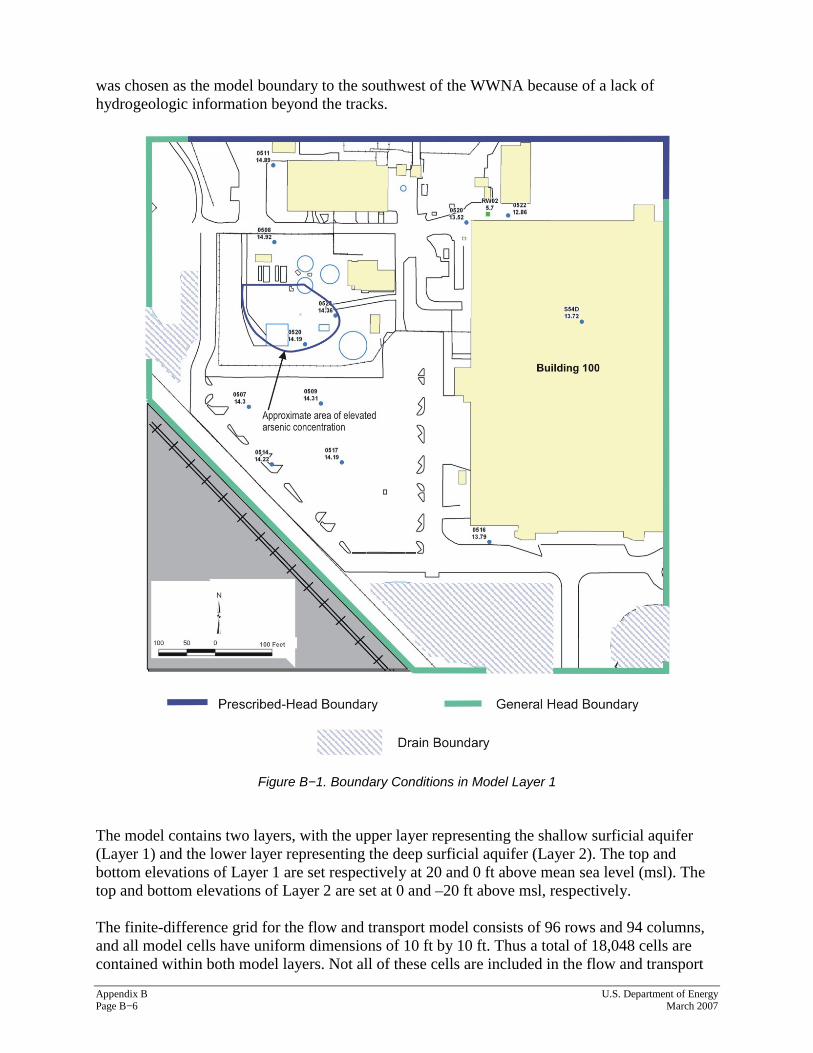
Appendix B U.S. Department of Energy Page B−6 March 2007
was chosen as the model boundary to the southwest of the WWNA because of a lack of hydrogeologic information beyond the tracks.
Figure B−1. Boundary Conditions in Model Layer 1 The model contains two layers, with the upper layer representing the shallow surficial aquifer (Layer 1) and the lower layer representing the deep surficial aquifer (Layer 2). The top and bottom elevations of Layer 1 are set respectively at 20 and 0 ft above mean sea level (msl). The top and bottom elevations of Layer 2 are set at 0 and –20 ft above msl, respectively. The finite-difference grid for the flow and transport model consists of 96 rows and 94 columns, and all model cells have uniform dimensions of 10 ft by 10 ft. Thus a total of 18,048 cells are contained within both model layers. Not all of these cells are included in the flow and transport

U.S. Department of Energy Appendix B March 2007 Page B−7
computations, however, as the area southwest of the railroad tracks that skirt the STAR Center are excluded from the simulation domain. B5.2 Hydraulic Parameters A uniform horizontal hydraulic conductivity of 1 ft/day was used in the flow model, and vertical hydraulic conductivity was assigned a value of 0.1 ft/day (Table B−1). Model cells in Layer 1 representing unpaved areas at the site were assigned a uniform, constant recharge rate of 5.5 in/yr (0.00126 ft/day). Effective porosity of aquifer materials was set at 0.3, or 30 percent.
Table B−1. Hydraulic and Transport Parameters Used in the Model
Parameter Value Hydraulic Conductivity (x-direction) 1.0 ft/day Hydraulic Conductivity (y-direction) 1.0 ft/day Hydraulic Conductivity (z-direction) 0.1 ft/day
Porosity 0.3 (dimensionless) Recharge 0.00126 in/day
Longitudinal Dispersivity 10 ft
Transverse Dispersivity 1 ft Vertical Dispersivity 0.1 ft
Distribution Coefficient (Kd) 63 L/kg and 6.3 L/kg
Bulk Density 1.605 kg/L
B5.3 Flow Sources, Sinks, and Boundary Conditions Cells along the perimeter of the model were handled using either prescribed-head or general head boundaries (see Figure B−1 and Figure B−2). Drain boundary conditions were assigned to Layer 1 cells within the pond footprints. Using this type of condition in lieu of treating the ponds as prescribed head boundaries made it possible to account for some shallow-zone ground water migrating below pond beds, which appear to be above the base of the aquifer’s shallow zone. Maps showing the areal distribution of cells at which the various types of boundary conditions were assigned to Layers 1 and 2 are presented in Figure B−1 and Figure B−2, respectively. Zero flow conditions were assumed across the model base (i.e., at the interface between Layer 2 and the Hawthorn). A uniform inflow rate of 5.5 in/yr (0.00126 ft/day) was assigned to Layer 1 cells in unpaved areas to represent recharge in these locales from rainfall. Zero recharge was assumed at all other Layer 1 cells (i.e., in paved areas and at ponds). The water budget of the flow model was determined largely as a result of the model solution itself. That is, flow rates feeding the ground water system (inflows) at and near the north model boundary were computed as a result of using either prescribed-head or general head boundary conditions at these locations. Similarly, outflows along the west, southwest, south, and east boundaries in both layers, and at the ponds in Layer 1, were computed using the respective boundary parameters assigned to these areas.
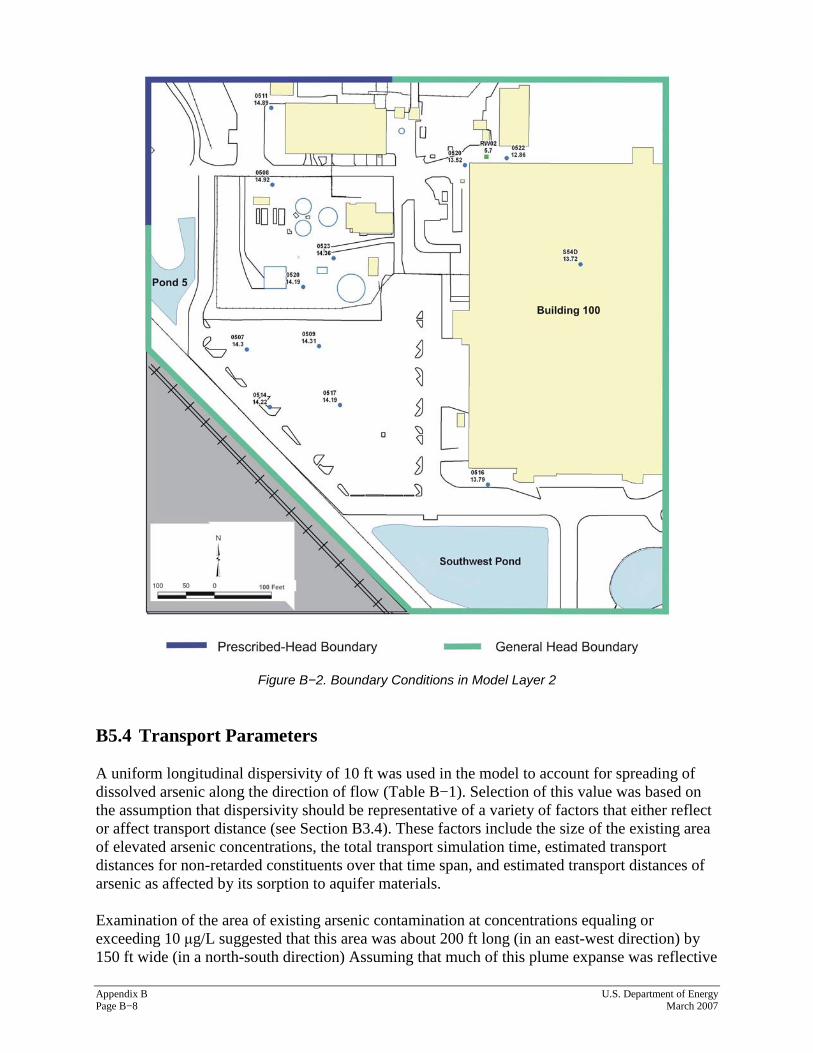
Appendix B U.S. Department of Energy Page B−8 March 2007
Figure B−2. Boundary Conditions in Model Layer 2 B5.4 Transport Parameters A uniform longitudinal dispersivity of 10 ft was used in the model to account for spreading of dissolved arsenic along the direction of flow (Table B−1). Selection of this value was based on the assumption that dispersivity should be representative of a variety of factors that either reflect or affect transport distance (see Section B3.4). These factors include the size of the existing area of elevated arsenic concentrations, the total transport simulation time, estimated transport distances for non-retarded constituents over that time span, and estimated transport distances of arsenic as affected by its sorption to aquifer materials. Examination of the area of existing arsenic contamination at concentrations equaling or exceeding 10 μg/L suggested that this area was about 200 ft long (in an east-west direction) by 150 ft wide (in a north-south direction) Assuming that much of this plume expanse was reflective

U.S. Department of Energy Appendix B March 2007 Page B−9
of past dissolved arsenic transport distances of about 100 ft away from a contaminant source, a longitudinal dispersivity amounting to 10 percent of this transport distance resulted in an estimated longitudinal dispersivity of 10 ft. Other calculations based on potential future transport distances were based on the selection of a total transport simulation time of 500 years. For a non-retarded constituent migrating at an average ground water velocity of 2 ft/yr, 500 years of transport resulted in a total transport distance of 1,000 ft, 10 percent of which was 100 ft. A comparable calculation for a non-retarded constituent migrating at a higher average velocity of 10 ft/yr produced a total travel distance of 5,000 ft over 500 years, 10 percent of which was 500 ft. In contrast, equivalent retarded velocities resulting from use of a retardation factor of 337 (per Section B3.4) were 0.006 and 0.03 ft/yr, which in turn signified total travel distances over 500 years of 3 and 15 ft, respectively. Accordingly, 10 percent of each of these latter values produced estimated longitudinal dispersivities of 0.3 and 1.5 ft., respectively. Given that these considerations resulted in a wide range of estimated longitudinal dispersivities, a value of 10 ft was considered a compromise between the extreme low and high values that were calculated. It was decided that sensitivity runs would be made with the resulting model using a Kd that was 10 percent of the 63 L/kg value resulting from the Duke Engineering and Services (1999) study. With these simulations, the above-mentioned longitudinal dispersivities (for a retardation factor of 337) would be effectively reduced to about 3 and 15 ft, respectively, which spanned the adopted dispersivity of 10 ft. Transverse horizontal and transverse vertical dispersivities were assigned uniform values of 1 and 0.1 ft, respectively.
B6.0 Model Calibration
Calibration of the flow model was achieved through a trial-and-error process, in which flow conditions were manipulated mostly by adjusting parameters used for the prescribed-head and general head boundary conditions applied along the model’s perimeter. Several model runs were made until the residuals between observed and computed hydraulic heads were reduced to relatively small values. B6.1 Calibration Targets Measured water elevations at 22 monitoring wells during September 2006 were used as calibration targets. Of this total, 13 elevations were from wells screened in the shallow surficial aquifer and nine elevations were from deep surficial aquifer wells. During the flow calibration process, attempts were also made to produce water level contours that resembled those shown in Figure 7 and Figure 8 in the main report for the respective shallow and deep zones of the surficial aquifer. Contour plots of the steady-state water elevations produced by the model for Layers 1 and 2 are presented in Figure B−3 and Figure B−4, respectively. Visual inspection of these plots suggests that the model performs reasonably well in matching observed flow patterns at the WWNA and surrounding areas during the wet season.

Appendix B U.S. Department of Energy Page B−10 March 2007
14.0 14.0
14.0
14.0
14.0
14.5
14.5
14.5
14.5
15.0
15.0
15.0
15.0
15.
0
15.5
15.5
15.
5
15.
5
16.0 16.
0
16.5
Figure B−3. Model-Computed Ground-Water Elevations (ft above msl) in Layer 1

U.S. Department of Energy Appendix B March 2007 Page B−11
14.0
14.0
14.5 14.5
15.0
15.0 15.0
15.
0
15.5
15.5
15.
5
16.0
16.0
16.5
Figure B−4. Model-Computed Ground-Water Elevations (ft above msl) in Layer 2 B6.2 Calibration Performance Table B−2 presents a listing of the monitoring wells used for flow model calibration, observed and model-computed water elevations at the wells, and corresponding residuals (observed water elevation minus computed elevation). As shown, residuals range from –0.76 ft to 0.86 ft, and the mean of the residuals is 0.11 ft. The distribution of the residuals is well balanced in the sense that the number of positive values is the same as the number of negative residuals. This balanced distribution is also illustrated in Figure B−5, which consists of a scatter plot of observed and computed water levels. A perfect fit between observed and computed water levels would show all plotted values on this graph falling on a straight line.

Appendix B U.S. Department of Energy Page B−12 March 2007
Table B−2. Water Elevation Residuals in the WWNA Flow Model
Monitoring Well Model Layer
Observed Water Elevation
(ft above msl)
Computed Water Elevation
(ft above msl)
Elevation Residual (Observed minus
Computed) (ft)
18-0500 1 16.18 15.42 0.76
18-0502 1 16.07 15.26 0.81
18-0507 2 14.81 14.71 0.10
18-0508 2 16.58 15.72 0.86
18-0509 2 15.2 14.91 0.29
18-0510 2 14.55 14.99 -0.44
18-0520 2 15.38 15.24 0.14
18-0522 1 15.82 15.29 0.53
18-0523 2 15.79 15.49 0.30
18-0525 1 16.06 15.55 0.51
18-0526 1 14.96 14.53 0.43
18-RW0501 1 16.05 15.26 0.79
10-0500 1 15.76 15.93 -0.17
06-0500 1 15.54 15.87 -0.33
06-0501 1 15.47 15.74 -0.27
09-0500 1 15.88 15.97 -0.09
12-0516 2 14.1 14.15 -0.05
12-0520 2 15.06 15.82 -0.76
12-RW02 2 15.48 15.74 -0.26
12-S31B 1 15.23 15.68 -0.45
12-TE03 1 14.62 14.92 -0.30
23-SW01 1 13.58 13.61 -0.03
Mean = 0.11

U.S. Department of Energy Appendix B March 2007 Page B−13
13.6
14.2
14.8
15.4
16.0
16.6
13.6 14.2 14.8 15.4 16.0 16.6
Observed Value
Layer 1
Layer 2
Figure B−5. Scatter Plot of Observed and Model-Computed Water Elevations (ft above msl)
Further assessment of the flow model’s ability to match observed water elevations within the modeled area is seen in the standard deviation of the residuals, which is 0.46 ft. Dividing this number by the range of the observed water elevations (3 ft) produces a normalized measure of calibration performance of 0.15 (dimensionless), or 15 percent, which can be considered a reasonable fit between observed and model-generated water elevations.
B7.0 Predictive Simulations
As summarized in Table B−3, four predicative simulations of arsenic transport were conducted using the calibrated flow model and different projections of arsenic behavior in future years. Two of the model runs (Simulations 1 and 3) were based on the assumption that past soil removal efforts at the WWNA have removed future sources of the contaminant in ground water, and that ground water arsenic levels in the existing area of elevated concentration will gradually decrease due to recharge-driven dilution, dispersion and possible flushing to surface water in the ponds. The two additional model runs (Simulations 2 and 4) assumed that continued downward flushing of arsenic sorbed on unsaturated zone soils will maintain arsenic concentrations in a portion of the existing area of contamination at relatively high, constant values. The simulations also accounted for variations in the degree of arsenic sorption that could be observed in the future.

Appendix B U.S. Department of Energy Page B−14 March 2007
Table B−3. Summary of Predictive Simulations
Simulation Continuing Source Kd
(L/kg) 1 (Base Case) No 63
2 Yes 63
3 No 6.3
4 Yes 6.3
Dissolved arsenic concentrations used as initial conditions in the predictive simulations were developed by kriging concentrations measured in September 2006 at several wells located in and near the existing area of contamination. A map of the resulting initial distribution of arsenic at concentrations >100 μg/L in Layer 1 is presented in Figure B−6. Most of the existing arsenic mass in the initial distribution is located in the upper surficial aquifer, where current arsenic concentrations can be as high as 145 μg/L. In contrast the maximum observed concentration in the deep surficial aquifer is about 35 μg/L (no map for this layer). Because this study and previous investigations indicate that very little arsenic is transported from Layer 1 to Layer 2 Layer 1 concentrations are of greatest interest with regard to the future fate of arsenic at the WWNA. As a consequence, only Layer 1 model results are discussed in this section. B7.1 Base-Case Simulation A base-case transport simulation (Simulation 1) was performed in which it was assumed that a source of arsenic in the unsaturated zone no longer exists and the average Kd determined for arsenic in the Duke Engineering and Services (1999) study (Kd = 63 L/kg) was applicable. This model run was expected to be the most optimistic of all predictive simulations in the sense that it would show arsenic concentrations gradually decreasing in the existing area of contamination but the quantity of arsenic migrating from this area would be severely limited due to heavy retardation of its transport (retardation factor = 337). Simulation 1 accounted for 500 years of arsenic migration. The distributions of resulting computed concentrations >100 μg/L after 50, 100, 250, and 500 years are illustrated in Figure B−7 through Figure B−10, respectively. These figures indicate that, over the 500-year period, the arsenic plume (>100 μg/L) remains relatively constant in size but the maximum concentration within the plume decreases.

U.S. Department of Energy Appendix B March 2007 Page B−15
Figure B−6. Initial Arsenic Concentrations >100 μg/L in Layer 1 of the Transport Model
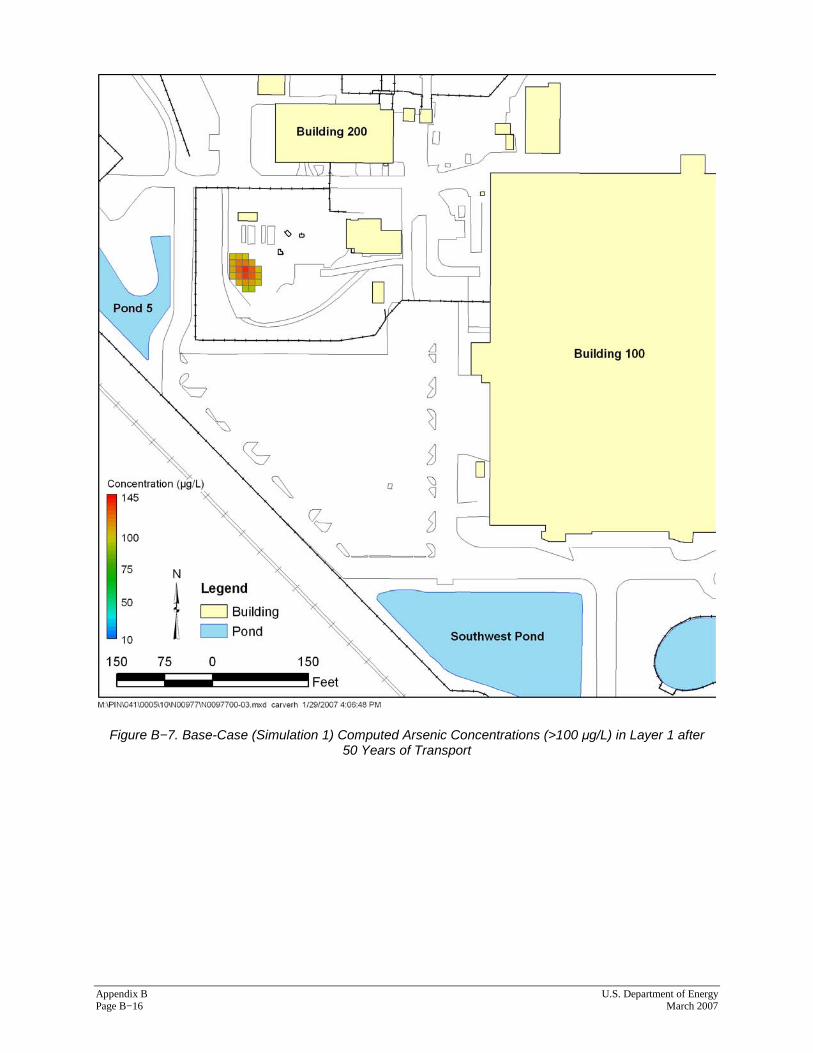
Appendix B U.S. Department of Energy Page B−16 March 2007
Figure B−7. Base-Case (Simulation 1) Computed Arsenic Concentrations (>100 μg/L) in Layer 1 after 50 Years of Transport

U.S. Department of Energy Appendix B March 2007 Page B−17
Figure B−8. Base-Case (Simulation 1) Computed Arsenic Concentrations (>100 μg/L) in Layer 1 after 100 Years of Transport
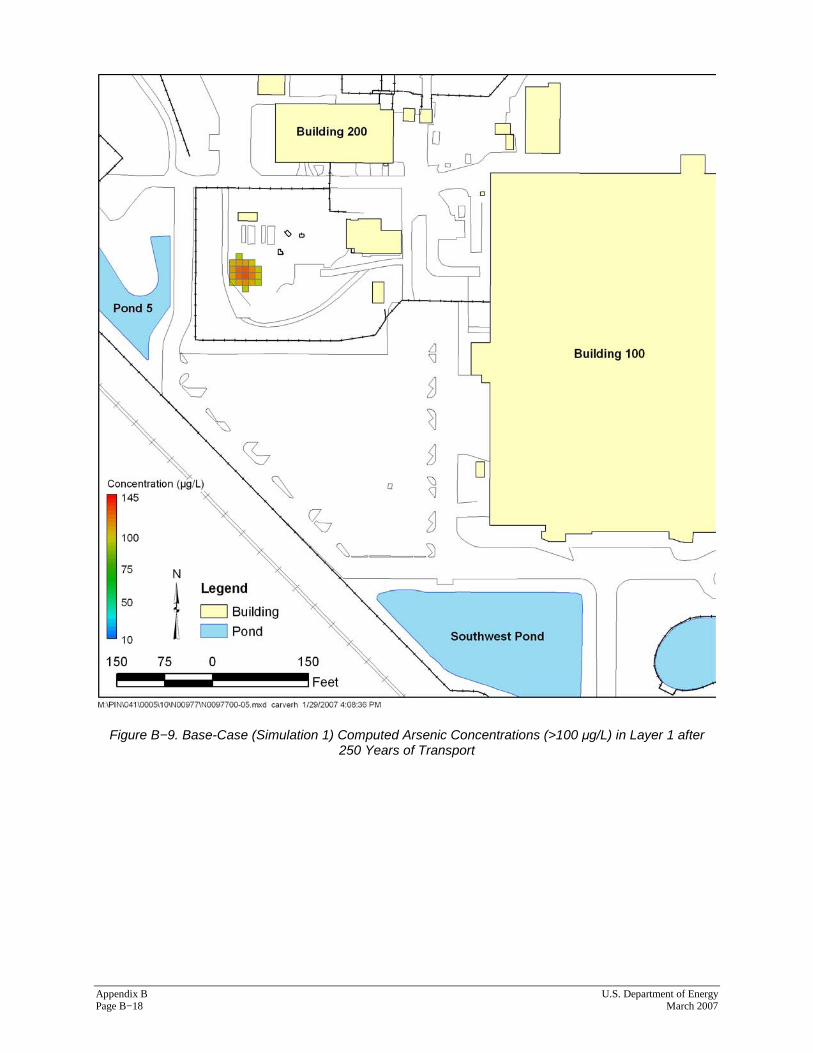
Appendix B U.S. Department of Energy Page B−18 March 2007
Figure B−9. Base-Case (Simulation 1) Computed Arsenic Concentrations (>100 μg/L) in Layer 1 after 250 Years of Transport

U.S. Department of Energy Appendix B March 2007 Page B−19
Figure B−10. Base-Case (Simulation 1) Computed Arsenic Concentrations (>100 μg/L) in Layer 1 after 500 Years of Transport

Appendix B U.S. Department of Energy Page B−20 March 2007
B7.2 Constant Concentration Source in the Area of Arsenic Contamination The second model run (Simulation 2) accounted for 500 years of arsenic migration assuming a Kd of 63 L/kg and a continuing source would keep concentrations constant in selected model cells within the existing area of contamination. The cells selected for invoking constant concentration conditions followed a line extending from the west-northwest end of the area of contamination to its east-southeast end and tracing the largest existing concentrations. As with Simulation 1, the initial concentrations for this run are shown in Figure B−6. The distributions of resulting computed concentrations >100 μg/L after 50, 100, 250, and 500 years are illustrated in Figure B−11 through Figure B−14, respectively. Over the 500-year period, the arsenic plume (>100 μg/L) again remains relatively constant in size. However, unlike Simulation 1, the use of constant concentration conditions forces the maximum concentrations within the plume to remain relatively high. B7.3 Simulations of Limited Sorption The third and fourth model runs (Simulations 3 and 4) represented limited-sorption equivalents of Simulations 1 and 2. In particular, the used in Simulations 3 and 4 was 6.3 L/kg, or 10 percent of the Kd used in the earlier simulations. Although a Kd of 63 L/kg represents an average of 24 sorption measurements made by Duke Engineering and Services (1999) using site soil and ground water, additional model runs based on the lower Kd made it possible to assess more conservative scenarios of arsenic transport. The distributions of computed concentrations >100 μg/L produced by Simulation 3 (no continuing source) after 50, 100, and 250 years are illustrated in Figure B−15 through Figure B−17, respectively. As these snapshots indicate, all computed arsenic concentrations decrease to <100 μg/L within 250 years of simulation time remains below 100 μg/L at 500 years. This disappearance of the relatively high arsenic concentrations is attributed to dilution and dispersion as the arsenic migrates west and south. Both of these contaminant attenuation processes become more effective when the use of a relatively low Kd permits arsenic to be more mobile. The distributions of resulting computed concentrations >100 μg/L produced by Simulation 4 (continuing source in the form of constant concentrations at selected cells) after 50, 100, 250, and 500 years are shown in Figure B−18 through Figure B−21, respectively. Over the 500-year simulation period, the size of the arsenic plume (>100 μg/L) decreases slightly, as expected. To evaluate the potential for arsenic entering Pond 5 or the Southwest Pond above the 50 μg/L surface water standard that applies for potential site uses (e.g., agricultural use; Table 62-302.530, Chapter 62-320 FAC), a map was generated showing arsenic concentrations of 50 μg/L and greater produced by Simulation 4 after 500 years of transport time (Figure B−22). This graphic shows that arsenic concentrations on the order of 50 μg/L do approach Pond 5 but never reach it. Though not shown, all remaining simulations suggest that arsenic concentrations of 50 μg/L or greater will either remain far from Pond 5 after 500 years or become nonexistent due to transport attenuation. All model runs indicate that arsenic contamination will always remain far upgradient of the Southwest Pond (e.g., Figure B−22).

U.S. Department of Energy Appendix B March 2007 Page B−21
Figure B−11. Simulation 2 Arsenic Concentrations (>100 μg/L) in Layer 1 after 50 Years of Transport

Appendix B U.S. Department of Energy Page B−22 March 2007
Figure B−12. Simulation 2 Arsenic Concentrations (>100 μg/L) in Layer 1 after 100 Years of Transport

U.S. Department of Energy Appendix B March 2007 Page B−23
Figure B−13. Simulation 2 Arsenic Concentrations (>100 μg/L) in Layer 1 after 250 Years of Transport

Appendix B U.S. Department of Energy Page B−24 March 2007
Figure B−14. Simulation 2 Arsenic Concentrations (>100 μg/L) in Layer 1 after 500 Years of Transport

U.S. Department of Energy Appendix B March 2007 Page B−25
Figure B−15. Simulation 3 Arsenic Concentrations (>100 μg/L) in Layer 1 after 50 Years of Transport
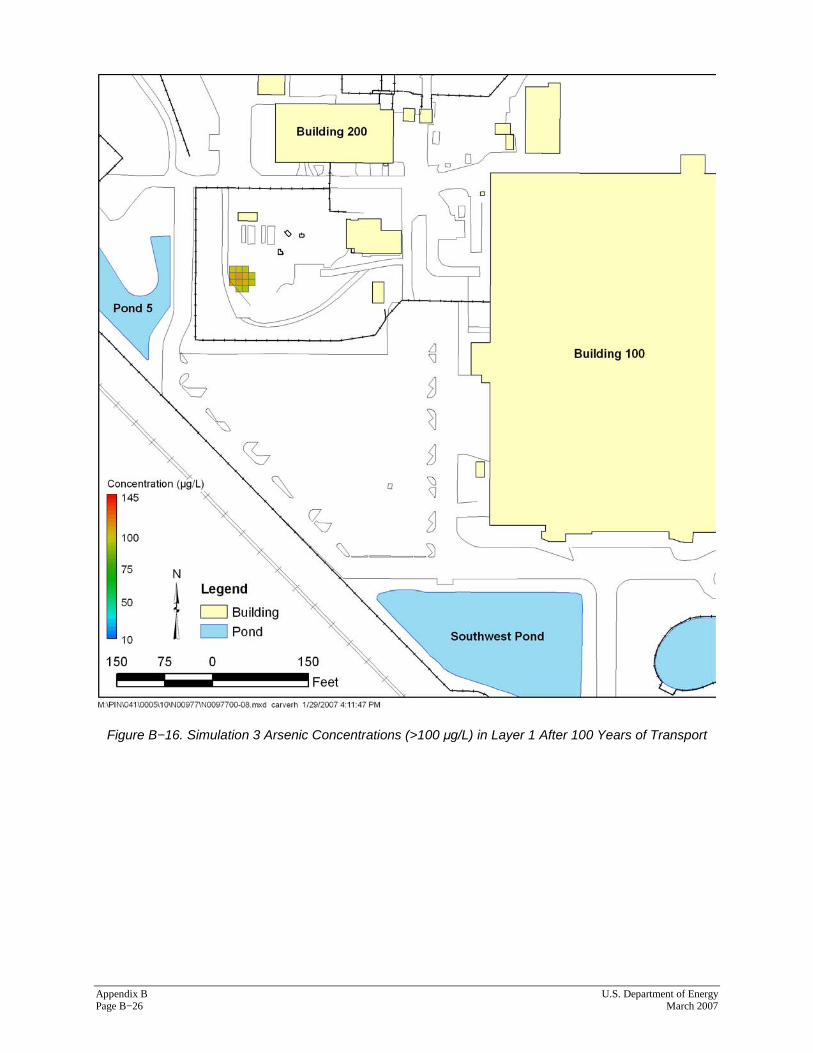
Appendix B U.S. Department of Energy Page B−26 March 2007
Figure B−16. Simulation 3 Arsenic Concentrations (>100 μg/L) in Layer 1 After 100 Years of Transport

U.S. Department of Energy Appendix B March 2007 Page B−27
Figure B−17. Simulation 3 Arsenic Concentrations (>100 μg/L) in Layer 1 after 250 Years of Transport

Appendix B U.S. Department of Energy Page B−28 March 2007
Figure B−18. Simulation 4 Arsenic Concentrations (>100 μg/L) in Layer 1 after 50 Years of Transport

U.S. Department of Energy Appendix B March 2007 Page B−29
Figure B−19. Simulation 4 Arsenic Concentrations (>100 μg/L) in Layer 1 after 100 Years of Transport
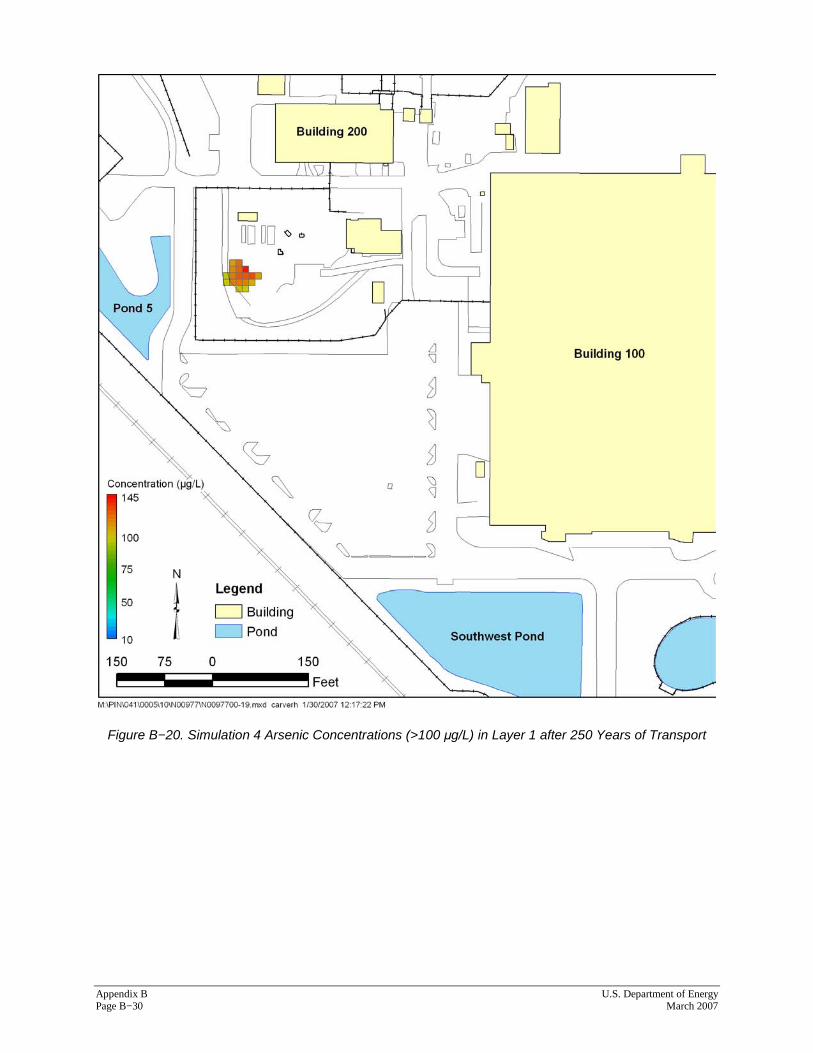
Appendix B U.S. Department of Energy Page B−30 March 2007
Figure B−20. Simulation 4 Arsenic Concentrations (>100 μg/L) in Layer 1 after 250 Years of Transport

U.S. Department of Energy Appendix B March 2007 Page B−31
Figure B−21. Simulation 4 Arsenic Concentrations (>100 μg/L) in Layer 1 after 500 Years of Transport
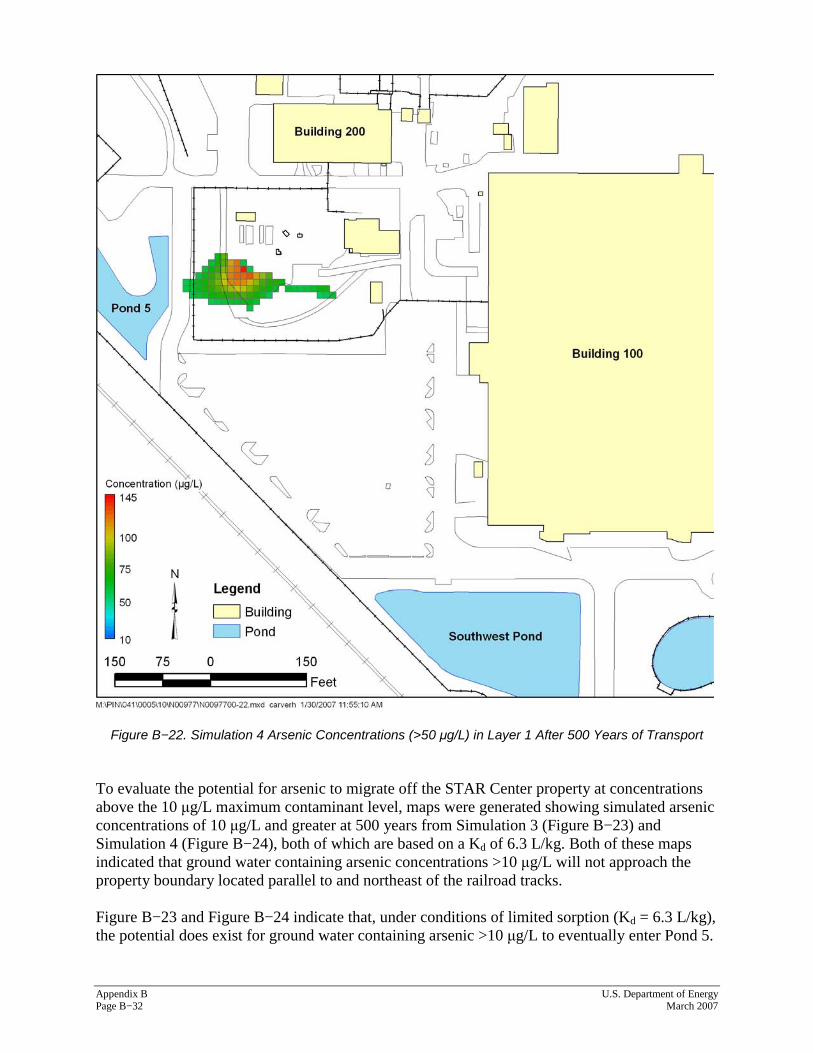
Appendix B U.S. Department of Energy Page B−32 March 2007
Figure B−22. Simulation 4 Arsenic Concentrations (>50 μg/L) in Layer 1 After 500 Years of Transport To evaluate the potential for arsenic to migrate off the STAR Center property at concentrations above the 10 μg/L maximum contaminant level, maps were generated showing simulated arsenic concentrations of 10 μg/L and greater at 500 years from Simulation 3 (Figure B−23) and Simulation 4 (Figure B−24), both of which are based on a Kd of 6.3 L/kg. Both of these maps indicated that ground water containing arsenic concentrations >10 μg/L will not approach the property boundary located parallel to and northeast of the railroad tracks. Figure B−23 and Figure B−24 indicate that, under conditions of limited sorption (Kd = 6.3 L/kg), the potential does exist for ground water containing arsenic >10 μg/L to eventually enter Pond 5.

U.S. Department of Energy Appendix B March 2007 Page B−33
However, because these concentrations fall far short of the 50 μg/L standard for surface water, they are not expected to be problematic.
Figure B−23. Simulation 3 Arsenic Concentrations (>10 μg/L) in Layer 1 after 500 Years of Transport
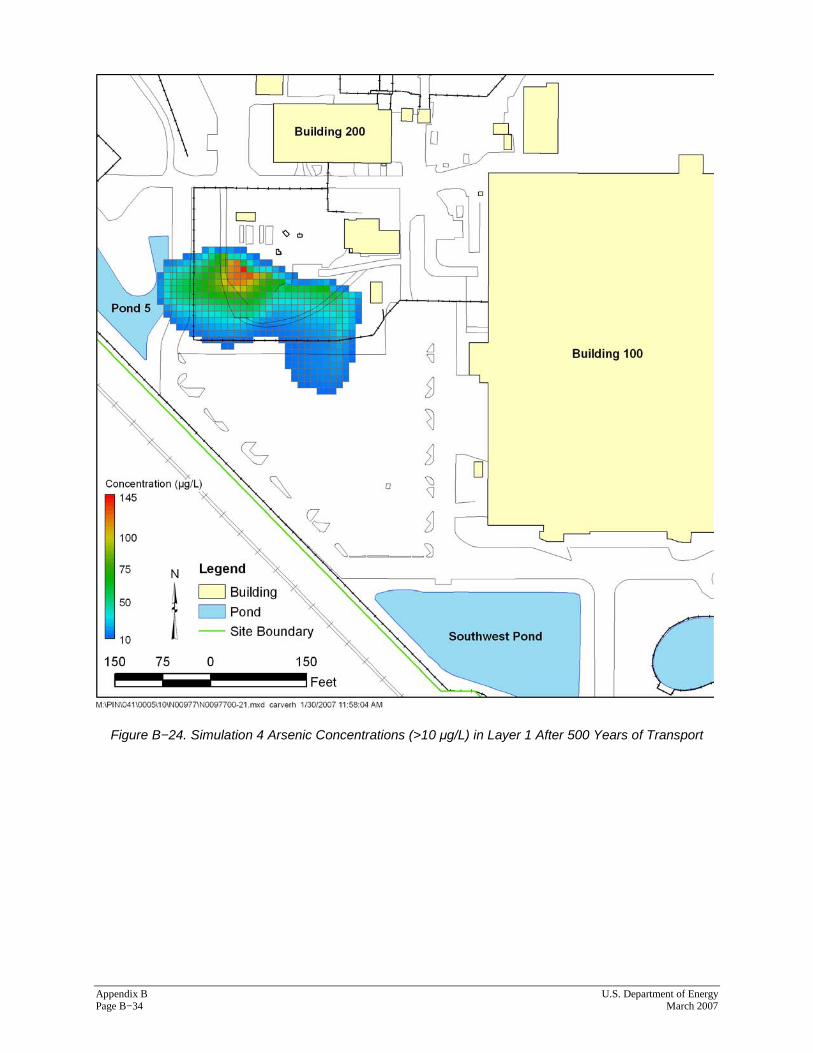
Appendix B U.S. Department of Energy Page B−34 March 2007
Figure B−24. Simulation 4 Arsenic Concentrations (>10 μg/L) in Layer 1 After 500 Years of Transport

U.S. Department of Energy Appendix B March 2007 Page B−35
B8.0 Summary and Conclusions
A numerical model of ground water flow and arsenic transport at the WWNA was used to project the disposition of arsenic 500 years in the future. Four different model scenarios were simulated, some of which account for conservative transport assumptions. The modeling results indicate that:
• The size of the existing arsenic plume, as defined the 100 μg/L CTL, will either remain relatively stable or decrease, never exceeding 1/4 acre.
• Ground water containing arsenic concentrations >50 μg/L will not enter the ponds on the STAR Center,
• Ground water containing arsenic concentrations >10 μg/L will not approach the STAR Center property boundary.
• Arsenic transport from the shallow surficial aquifer to the deep surficial aquifer will remain negligible.
B9.0 References
DOE (U.S. Department of Energy), 2002. Pinellas Environmental Restoration Project, Ground Water Flow and Transport Modeling, DOE Grand Junction Office, GJO-PIN 28.9-1. Duke Engineering and Services, 1999. Geochemical Evaluation of Arsenic at the Pinellas Science, Technology, and Research Center Waste Water Neutralization Area, Florida, June. ESI (Environmental Simulations, Inc.), 2005. Guide to Using Groundwater Vistas, Version 4, Herndon, Virginia. Gelhar, L.W., A. Mantoglou, C. Welty, K.R. Rehfeldt (1985). A Review of Field-Scale Physical Solute Transport Processes in Saturated and Unsaturated Porous Media, Electric Power Research Institute, EA-4190, Research Project 2485-5. Harbaugh, A.W., and M.G. McDonald, 1996. User’s Documentation for MODFLOW-96, an Update to the U.S. Geological Survey Modular Finite-Difference Ground-Water Flow Model, U.S. Geological Survey, Open-File Report 96-485. McDonald, M.G., and A.W. Harbaugh, 1988. A Modular Three-dimensional Finite-Difference Ground-water Flow Model, U.S. Geological Survey, Techniques of Water Resources Investigations, Chapter 6, A1, 586 p. Zheng, C., 1990. MT3D: A Modular Three-dimensional Transport Model for Simulation of Advection, Dispersion, and Chemical Reactions of Contaminants in Ground-water Systems, U.S. EPA, R.S. Kerr Environmental Research Laboratory, Ada, Oklahoma.

Appendix B U.S. Department of Energy Page B−36 March 2007
Zheng, C., and P.P. Wang, 1999. MT3DMS: A Modular Three-Dimensional Multispecies Transport Model for Simulation of Advection, Dispersion, and Chemical Reactions of Contaminants in Groundwater Systems, Documentation and User’s Guide, Contract Report SERDP-99-1, U.S. Army Engineer Research and Development Center, Vicksburg, Mississippi.

THIS INSTRUMENT PREPARED BY:
F. JOSEPH ULLO, JR., ESQUIRE LEWIS, LONGMAN & WALKER, P.A. 315 SOUTH CALHOUN STREET, SUITE 830 TALLAHASSEE, FL 32301 (850) 222-5702
:~~ ~~~~~R~~~RK OF COURT INST# 2015270106 ~~~~~%~;~AS COUNTY, FL OFF REC BK: 18926 PG· at 02:45 PM DocType:RST • 870-879
DECLARATION OF RESTRICTIVE COVENANT WASTEWATER NEUTRALIZATION AREA SOLID WASTE MANAGEMENT UNIT
THIS DECLARATION OF RESTRI~~ANT [hereinafter ;,Declaration") is made this JiL day of. I 2olj, by the Pinellas County Industrial Development Authority, a Special District created pursuant to Part III, Chapter 159, Florida Statutes, d/b/a PINELLAS COUNTY ECONOMIC DEVELOPMENT AUTHORITY, (hereinafter "GRANTOR") and the Florida Department of Environmental Protection (hereinafter "FDEP").
RECITALS
A. GRANTOR is the fee simple owner of that certain real property situated in the County of Pinellas, State of Florida, more particularly described in Exhibit A attached hereto and made a part hereof (hereinafter the "Restricted Property").
B. The FDEP Facility Identification Number for the Restricted Property is FL6 890 090 008 (PIN18). The facility name at the time of this Declaration is U.S. Department of Energy ("DOE") Wastewater Neutralization Area ("WWNA") Solid Waste Management Unit ("SWMU") and it currently operates as the Young- Rainey STAR Center Industrial Wastewater Neutralization Facility ("IWNF") which is a Pinellas County permitted discharge facility (Permit Number IE-3002-09 /12). This Declaration addresses a discharge that was reported to the US EPA on April 7, 1993.
C. The discharge of chlorinated solvents and metals on the Restricted Property fWWNA SWMU is documented in the following reports that are incorporated by reference.
1. Long-Term Surveillance and Maintenance Plan for the Pinellas Site, November 2012, submitted by the U.S. DOE.
00199166-7 Page 1 of7

2. Sitewide Environmental Monitoring, Semiannual Progress Reports for the Young- Rainey STAR Center, submitted by the U.S. DOE and dated December 2012 through May 2013.
3. Young- Rainey STAR Center Wastewater Neutralization Area No Further Action With Controls Proposal, dated January 2007, submitted by the U.S. DOE.
4. Wastewater Neutralization Area/Building 200 Area Corrective Measures Implementation Plan Addendum, submitted by the U.S. DOE.
D. The reports noted in Recital C set forth the nature and extent of the contamination that is located on the Restricted Property. These reports confirm that contaminated soil and groundwater as defined by Chapter 62-780 Florida Administrative Code (F.A.C.), exist on the Restricted Property. Also these reports document that the groundwater contamination does not extend beyond the Restricted Property boundaries and that the groundwater contamination does not exceed %-acre, and that that the groundwater contamination is not migrating.
E. The intent of the restrictions in this Declaration is to reduce or eliminate the risk of exposure to users or occupants of the Restricted Property and to the environment of the contaminants, and to reduce or eliminate the threat of migration of the contaminants.
F. The FDEP has agreed to issue a Site Rehabilitation Completion Order with Conditions (hereinafter "Order") upon recordation of this Declaration and achievement of site rehabilitation in accordance with Chapter 62-780. The FDEP can unilaterally revoke the Order if the conditions of this Declaration or of the Order are not met. Additionally, if concentrations of chemicals of concern increase above the levels approved in the Order, or if a subsequent discharge occurs at the Restricted Property, the FDEP may require site rehabilitation to reduce concentrations of contamination to the levels allowed by the applicable FDEP rules. The Order relating to FDEP Facility No. FL6 890 090 008 (PIN18) can be found by contacting the appropriate FDEP district office or bureau.
G. GRANTOR deems it desirable and in the best interest of all present and future owners of the Restricted Property that an Order be obtained for the WWNA SWMU and that the Restricted Property be held subject to certain restrictions, all of which are more particularly hereinafter set forth.
NOW, THEREFORE, to induce the FDEP to issue the Order and for other good and valuable consideration, the receipt and sufficiency of which are hereby acknowledged by each of the undersigned parties, GRANTOR agrees as follows:
00199166-7 Page 2 of7

1. The foregoing recitals are true and correct and are incorporated herein by reference.
2. GRANTOR hereby imposes on the Restricted Property the following restrictions:
00199166-7
a. i. There shall be no use of or access to the groundwater under the Restricted Property unless pre-approved in writing by FDEP's Division of Waste Management ("DWM") in addition to any authorizations required by the Division of Water Resource Management ("DWRM") and the Water Management District ("WMD").
a.ii. For any dewatering activities on the Restricted Property a plan approved by FDEP's DWM must be in place to address and ensure the appropriate handling, treatment and disposal of any extracted groundwater that may be contaminated.
a.m. There shall be no construction of new storm water swales, stormwater detention or retention facilities or ditches on the Restricted Property without prior written approval from FDEP's DWM in addition to any authorizations required by DWRM and the WMD.
b. Excavation and construction is not prohibited on the Restricted Property provided any contaminated soils that are excavated are removed and properly disposed of pursuant to Chapter 62-780, F.A.C. and any other applicable local, state, and federal requirements. Nothing herein shall limit any other legal requirements regarding construction methods and precautions that must be taken to minimize risk of exposure while conducting work in contaminated areas. Nothing in this Declaration shall prevent, limit or restrict any excavation or construction at or below the surface outside the boundary of the Restricted Property.
c. The following uses are prohibited in the WWNA SWMU as shown in Exhibit A: agricultural use of the land including forestry, fishing and mining; hotels or lodging; recreational uses including amusement parks, parks, camps, museums, zoos, or gardens; residential uses, and educational uses such as elementary or secondary schools, or day care services. These prohibited uses are specifically defined by using the North American Industry Classification System. United States. 2007 (NAICS), Executive Office of the President, Office of Management and Budget. The prohibited uses by code are: Sector 11 Agriculture, Forestry, Fishing and Hunting; Subsector 212 Mining (except Oil and Gas); Code 512132 Drive-In Motion Picture Theaters; Code 51912 Libraries and Archives; Code 53111 Lessors of Residential Buildings and Dwellings; Subsector 6111 Elementary and Secondary Schools; Subsector 623 Nursing and Residential Care Facilities; Subsector 624 Social Assistance; Subsector 711 Performing Arts, Spectator Sports and Related
Page 3 of7

Industries; Subsector 712 Museums, Historical Sites, and Similar Institutions; Subsector 713 Amusement, Gambling, and Recreation Industries; Subsector 721 Accommodation (hotels, motels, RV parks, etc.); Subs ector 813 Religious, Grantmaking, Civic, Professional, and Similar Organizations; and Subsector 814 Private Households.
3. In the remaining paragraphs, all references to "GRANTOR" and "FDEP" shall also mean and refer to their respective successors and assigns.
4. For the purpose of monitoring the restrictions contained herein, FDEP is hereby granted a right of entry upon and access to the Restricted Property at reasonable times and with reasonable notice to the GRANTOR. Access to the Property is granted by an adjacent public right of way via Bryan Dairy Road.
5. It is the intention of GRANTOR that this Declaration shall touch and concern the Restricted Property, run with the land and with the title to the Restricted Property, and shall apply to and be binding upon and inure to the benefit of GRANTOR and FDEP, and to any and all parties hereafter having any right, title or interest in the Restricted Property or any part thereof. The FDEP may enforce the terms and conditions of this Declaration by injunctive relief and other appropriate available legal remedies. Any forbearance on behalf of the FDEP to exercise its right in the event of the failure of the GRANTOR to comply with the provisions of this Declaration shall not be deemed or construed to be a waiver of the FDEP's rights hereunder. This Declaration shall continue in perpetuity, unless otherwise modified in writing by GRANTOR and the FDEP as provided in paragraph 7 hereof. These restrictions may also be enforced in a court of competent jurisdiction by U.S. DOE andjor any other party that establishes proper standing. If the GRANTOR does not or will not be able to comply with any or all of the provisions of this Declaration, the GRANTOR shall notify FDEP in writing within three (3) calendar days. Additionally, GRANTOR shall notify FDEP thirty (30) days prior to any conveyance or sale, granting or transferring the Restricted Property or portion thereof, to any heirs, successors, assigns or grantees, including, without limitation, the conveyance of any security interest in said Restricted Property.
6. In order to ensure the perpetual nature of these restrictions, GRANTOR shall reference these restrictions in any subsequent lease or deed of conveyance within the Restricted Property, including the recording book and page of record of this Declaration. Furthermore, prior to the entry into a landlord~tenant relationship with respect to the Restricted Property, the GRANTOR agrees to notify in writing all proposed tenants of the Restricted Property of the existence and contents of this Declaration of Restrictive Covenant.
7. This Declaration is binding until a release of covenant is executed by the FDEP Secretary (or designee) and is recorded in the public records ofthe county in which the land is located. To receive prior approval from the FDEP to remove any requirement herein, cleanup target levels established pursuant to Florida Statutes
00 19916'i-7 Page 4 of7

and FDEP rules must have been achieved. This Declaration may be modified in writing only. Any subsequent amendments must be executed by both GRANTOR and the FDEP and be recorded by the real property owner as an amendment hereto.
8. If any provision of this Declaration is held to be invalid by any court of competent jurisdiction, the invalidity of that provision shall not affect the validity of any other provisions of the Declaration. All such other provisions shall continue unimpaired in full force and effect.
9. GRANTOR covenants and represents that on the date of execution of this Declaration that GRANTOR is seized of the Restricted Property in fee simple and has good right to create, establish, and impose this restrictive covenant on the use of the Property. GRANTOR also covenants and warrants that the Restricted Property is free and clear of any and all lien~, mortgages, or encumbrances that could impair GRANTOR'S rights to impose the restrictive covenant described in this Declaration or that is superior to the restrictive covenant described in this Declaration.
[DECLARATION EXECUTED ON FOLLOWING PAGES]
00199166-7 Page 5 of7
IN WITNESS WHEREOF, {j§RANTOR}} has executed this instrument, this _1!f!t day of Se pi 9 """~ . 2 Ot)i
GRANTOR ATTEST: KEN BURKE Clerk of the Circuit Court ~ . ,l
_, ,Dept11J'6ler.l{, o/1..-~v----£. 'fCS) .. -· . Prjnt:Nam~: N qf l.t\tL"' 'D- :~;,~PY
-< . . . < <::_:~;>~ PINELLAS COUNTY INDUSTRIAL DEVELOPMENT AUTHORITY d/b/ a PINELLAS COUNTY ECONOMIC DEVELOPMENT AUTHORITY,
: ,.. : 'r[OFFJCJAL SIJI,1L) ~ : ,. ' . . : :~·; :: . . ·, ~ ... ~. . \,. ..... t .: .... ::
I • • ,.p' ";. e ~· .: .. -', .. , ·. '('"'··· ~· .. /:·· ;:· ',, ... ~ . • " ••• • ,c:·· _-..·
f .~ · . •••••••• .. · .·~ --
'I ' I . t'rfm-T.E-RM:S·SPECIFIED HEREIN ARE I I. 1SU~l~~t .TO APPROVAL IN OPEN
SESSION BY THE BOARD OF COUNTY COMMISSIONERS, PINELLAS COUNTY, FLORIDA
Address: Young- Rainey STAR Center 7887 Bryan Dairy Road, Suite 120 Largo, Florida 33777
APPROVED AS TO FORM: OFFICE OF THE COUNTY ATTORNEY
By:~ Managing Ass stan County Attorney
delivered in the presence of: .,.-
~~------~~~---Date: q -tO-t~
Witness u . C \/. PrrJ_ t t N N:me: ~e.rn ... e ~ 1°LI~)
11'\ tOv\A · • Date: 'f/J Q /L~ Witness ; .() . PrintName: Cft..I/~1\J (.l)(,V~JL
STATE OF f(o6 D~
COUNTY OF ~~"-e.~\.~
.- The foregoing instrument.was acknowledged before me this tol"•day of ~pte""' hcy-20~ by -Jol"\A fhorront .
Personally Known 7 OR Produced Identification .
Type of Identification Produced ~
~·-Signature of ry ~blic
00199166-7 Page 6 of7

Approved as to form by:
Toni Sturtevant, Asst. General Counsel Office of General Counsel
Signed, sealed, and delivered in in the presence of:
Printed Name
qjt~(rr-Date
STATE OF FLORIDA COUNTY OF LEON
FLORIDA DEPARTMENT OF ENVIRONTMENTAL PROTECTION
By:
Q.L/-~ JOHN COATES, Assistant Division Director
Dept. of Environmental Protection Division of Waste Management 2600 Blairstone Road Tallahassee, FL 32399-2400
Wttness Signature
l:Jun:cf 'S. 'S\oN, s Printed Name
;?4 ( <P ( 2..o cs Date
The foregoing instrument was acknowledged before me this If~ day of SO"'/~ 8 , 2015, by JOHN COATES, who is personally known to me.
orida at Large
Page 7 of7

00199166-7
EXHIBIT A LEGAL DESCRIPTION AND ILLUSTRATION OF
RESTRICTED PROPERTY
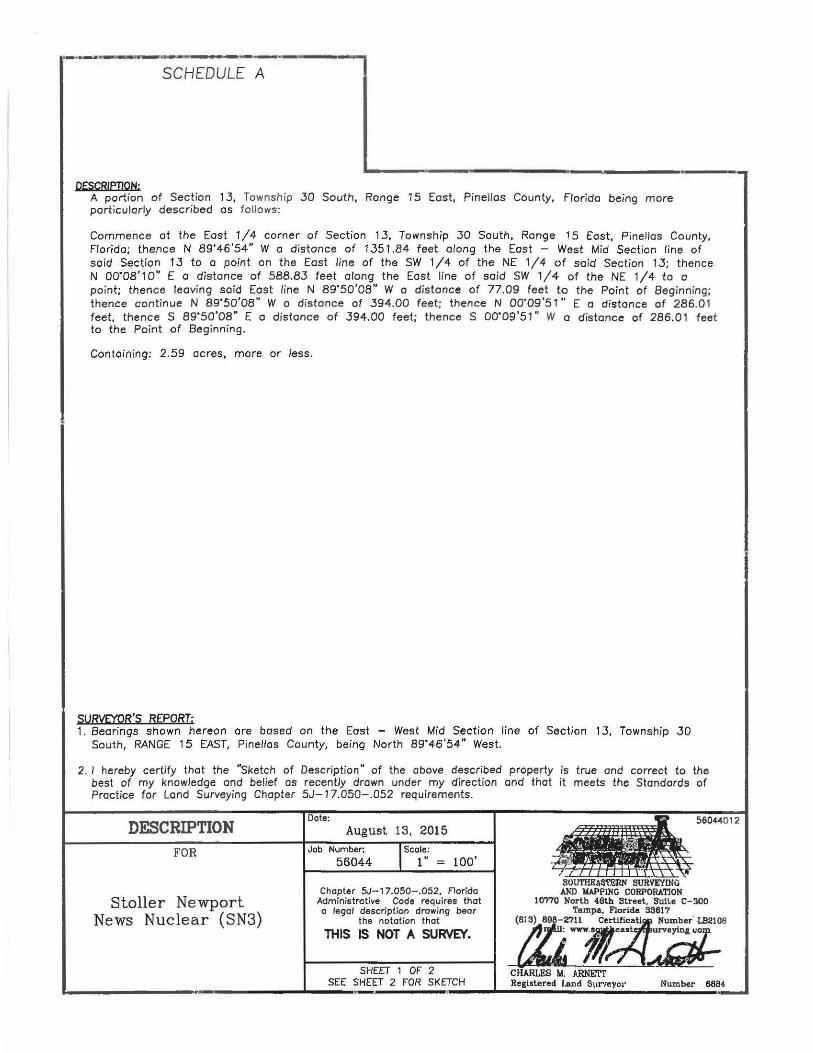
SCHEDULE A
DESCRIPTION: A portion of Section 13, Township 30 South, Range 15 East, Pinellas County, Florida being more particularly described as follows:
Commence at the East 1/4 corner of Section 13, Township 30 South, Range 15 East, Pinellas County, Florida; thence N 89'46'54" W o distance of 1351.84 feet along the East - West Mid Section line of said Section 1.3 to a point on the Eost line of the SW 1/4 of the NE 1/4 of said Section 1 J; thence N 00'08'10" E a distance of 588.83 feet along the Eost line of said SW 1/4 of the NE 1/4 to o point; thence leaving said East line N 89' 50'08" W a distance of 77.09 feet to the Point of Beginning; thence continue N 89' 50'08" W o distance of 394.00 feet; thence N 00'09'51" E a distance of 286.01 feet, thence S 89'50'08" E a distance of 394.00 feet; thence S 00'09'51" W o distance of 286.01 feet to the Point of Beginning.
Containing: 2 .59 acres, more or less.
SUIMYQR'S REPORT: 1. Bearings shown hereon are based on the East - West Mid Section line of Section 13, Township 30
South, RANGE 15 EAST, Pine/los County, being North 89'46'54" West.
2. I hereby certify that the "Sketch of Description " of the above described property is true and correct to the best of my knowledge and belief as recently drawn under my direction and that it meets the Standards of Practice for Land Surveying Chapter SJ-1 7.050-.052 requ irements.
DESCRIPTION FOR
Stoller Newport News Nuclear (SN3)
August 13, 2015 Job Number:
56044 Scale:
1" = 100'
Chapter SJ-17.050-.052, Florida Administrative Code requires thot o legal des cription drowing bear
the notation that
THIS IS NOT A SURVEY.
SHEET 1 OF 2 SEE SHEET 2 FOR SKETCH
560+4012
Number 6884

~------------------------~-·----------~ SKETCH OF DESCRIPTION
ssg·so·os"£ 394.oo'
.- -0 0
:LLJ .-,!0 O'l 0 b 0 z
WWNA PARCEL SEE SOUTHEASTERN SURVEYING AND
MAPPING DRAWING NUMBER 56044007 FOR BOUNDARY INFORMATION
POINT OF BEGINNING
N89.50'08'W 394.00'
~ " ' " "
-,!0 O'l 0 b 0 (/)
\ N89'50'08"W
. -- 77.09' -.,
t~ Ll..i co
;.., I")
(() '<tl o:i '-.,.1") ~-(()
L{) ~z VlC
.!-U l.U I= 0 :r: (.)
Co r-b:! U..u.. 0
b co 0 z w'<t
~'-... ..J-
f-LU Vlz ~
1. =100'
I GRAP~IC~ 0 100
1-z w ~ lJ.J (.) z u.. l.a.J c ~ L{)
~ ~ ~
l.U I I 0 Z o u ~ I")
c I I I.J... ul") 0 '<t -
'-...z l ~ -o
t- i== 0 VJ U
Cl.. ~ ~
SRYAN DAIRY ROAD __LB9'46'54"W 1351.84' -R-IG-H-=-T-O~F=-=-=-WAY VARIES-PER PINELLAS c=-=o::-:-u.,.,.N=TY~...:..- EAST - WEST MID SECTIO.-N-U-N=E.Jtr---"1
PUBLIC WORKS, DIVISION OF SURVEY AND MAPPING SPECIFIC PUR/?OSE SURVEY OF BRYAN DAIRY ROAD DATED 03/15/2010
Drawing Number 56044012 Job No. 56044 Dote: 08/13/2015 SHEET 2 OF 2 See Sheet 1 for Description
NOT VALJD WITHOUT SHEET THIS IS NOT A SURVEY
SOUTIIEASTERli SURVEYIJ(Q AHD IIAPPDIO CORPORATION
6500 All A111er!can Boulnard Orlalllio, Florida 32610- 4350
( 407) 292-BC'>IIO Certillcatlon Number LB2108 e- mail: lnro•aoutheaotei'DIIW'Wiy\lll.com

.. ~ 1: ....... ... . . _. .•. -
\I I ·~· (". ; +: ; \ I ' ~ ' ...
'''\• ... , ........