Embed Size (px)
Citation preview
Volume 17 LCQLoss Control QuarterlyNumber 1 January 2006
INSURINGYOUR SUCCESS
Chartered Property Casualty Underwriters
S O C I E T Y
Editor’s Note: This article originally appeared in RM/Insights, the newsletter of the Risk Management/Insurance Practice Specialty, Volume 5, No. 2 by the American Society of Safety Engineers, and is reprinted here with permission.
Introduction
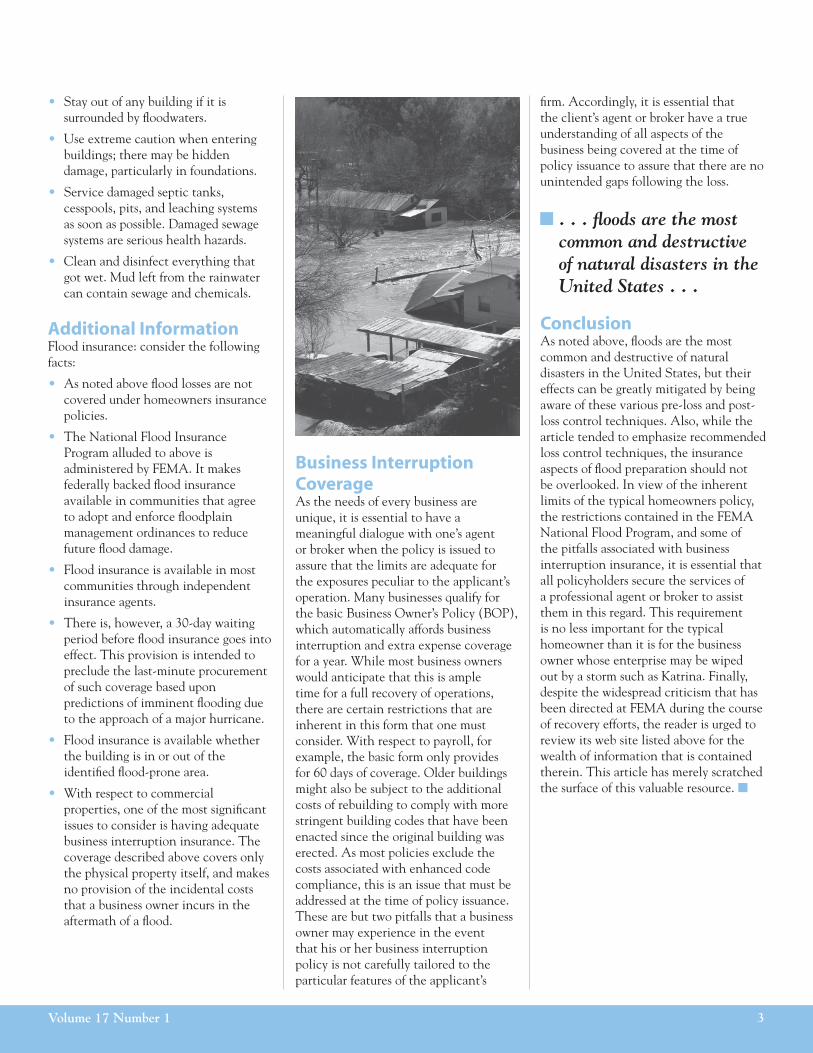
In view of the widespread property damage and loss of life sustained recently due to Hurricane Katrina, the American Society of Safety Engineers (ASSE) Risk Management/Insurance Practice Specialty determined that it would be a useful service to its readership to develop a short series of “fl ood facts” to assist the members in the event that they are confronted with such a similar natural disaster.
Flood FactsAmong the class of perils termed natural disasters, fl oods and fl ash fl oods kill more people in the United States than any other, and cause property damage in excess of a billion dollars annually. The State Farm Insurance Company’s web site (www.statefarm.com) indicates that 90 percent of all U.S. natural disasters involve fl ooding of some form. The general term “fl ood” means the threat from rising ground water, whereas “fl ash fl oods” are rapidly moving walls of water 10- to 20-feet high resulting from sudden storms or bursting dams.
While the good news is that information from the local emergency management offi ce or Red Cross can readily determine whether a particular property is located in a fl ood plain, approximately one in four fl ood disasters occurs in areas
Floods: What To Do Before, During, and After Such an Emergency Strikes by Charles H. Morgan, J.D., CPCU, CLU, CSP, ARM
with a low to moderate historical risk of fl ooding. Accordingly, the prudent property owner should seriously consider obtaining fl ood coverage from the National Flood Insurance Program, as the typical homeowners policy excludes such damage. A property owner’s local insurance agent can provide information on how to access this program.
This fact sheet is more about loss control than insurance, however, and as with any peril there are prudent measures that can be adopted to reduce both the frequency and severity of fl ood losses. An excellent source of information on this subject is the Federal Emergency Management Agency’s “Emergency Management Guide for Business & Industry” (available from www.fema.gov). Furthermore, life safety issues such as evacuation routes,
What’s In This Issue
Floods: What To Do Before,During, and After Such anEmergency Strikes . . . . . . . . . . . . . . 1
NO-Slip Treatment Revisited . . . . . 4
2005-2006 Loss ControlSection Committee . . . . . . . . . . . . . 5
State of the Art in Slip-Resistance Measurement . . . . . 6
Web-Based Continuity PlanningSoftware Can Mitigate Losses andIncrease Return on Investment . . . 12
Lessons from Katrina . . . . . . . . . . . 15
Visit us online.www.cpcusociety.org
Continued on page 2
■ Charles H. Morgan, J.D., CPCU, CLU, CSP, ARM, is in charge of the loss control program at the Banc of America Corporate Insurance Agency, LLC in Cranford, New Jersey. This is a full-service corporate broker providing both property and casualty insurance, as well as employee benefi ts, to a wide range of corporate and private clients.
Morgan serves on the CPCU Society’s Risk Management Section Committee and is the editor of LCQ. He can be reached at [email protected] or (908) 653-3177.
and the like, are beyond the scope of this article as the focus here is on emergency preparedness and response.
The FEMA guide suggests three basic types of fl ood proofi ng one’s building. The fi rst is termed “permanent fl ood proofi ng,” and includes the following steps:
• Filling windows, doors, or other openings with water-resistant materials such as concrete blocks or bricks. This approach assumes the structure is strong enough to withstand fl ood waters.
• Installing check valves to prevent water from entering where utility and sewer lines enter the facility.
• Reinforcing walls to resist water pressure. Sealing walls to prevent or reduce seepage.
• Building watertight walls around equipment or work areas within the facility that are particularly susceptible to fl ood damage.
• Constructing fl oodwalls or levees outside the facility to keep fl ood waters away.
• Elevating the facility on walls, columns, or compacted fi ll. This approach is most applicable to new construction, though many types of buildings can be elevated.
The second class of controls are termed “contingent,” and include measures taken before a fl ood, as well as additional action when fl ooding occurs. These are as follows:
• Installing watertight barriers called fl ood shields to prevent the passage of water through doors, windows, ventilation shafts, or other openings.
• Installing permanent watertight doors.
• Constructing movable fl ood walls.
• Installing permanent pumps to remove fl ood waters.
Finally, there are “emergency” fl ood-proofi ng measures that can be taken when fl ooding is imminent. These include:
• Building walls with sandbags.
• Constructing a single wall by stacking small beams or planks on top of each other.
• Providing for emergency backup pumps, generators, and battery-powered lighting.
Following a fl ood emergency, another FEMA Factsheet (September 1993) suggests the post-loss steps that should be taken to minimize the severity of the incident. These include:
• Pump out fl ooded basements gradually (about one-third of the water per day) to avoid structural damage.
• Check for gas leaks, shutting off the main valve if a leak is detected. Call the gas company from a neighbor’s property.
• Check the electrical system for sparks, broken or frayed wires, or burnt insulation. If any are detected, the power should be shut off at the breaker box and an electrician should be called immediately.
Other post-disaster recovery guidelines suggested by FEMA include the following.
• Listen for news reports to learn whether the community’s water supply is safe to drink.
• Avoid fl oodwaters; water may be contaminated by oil, gasoline, or raw sewage. Water may also be electrically charged from underground or downed power lines.
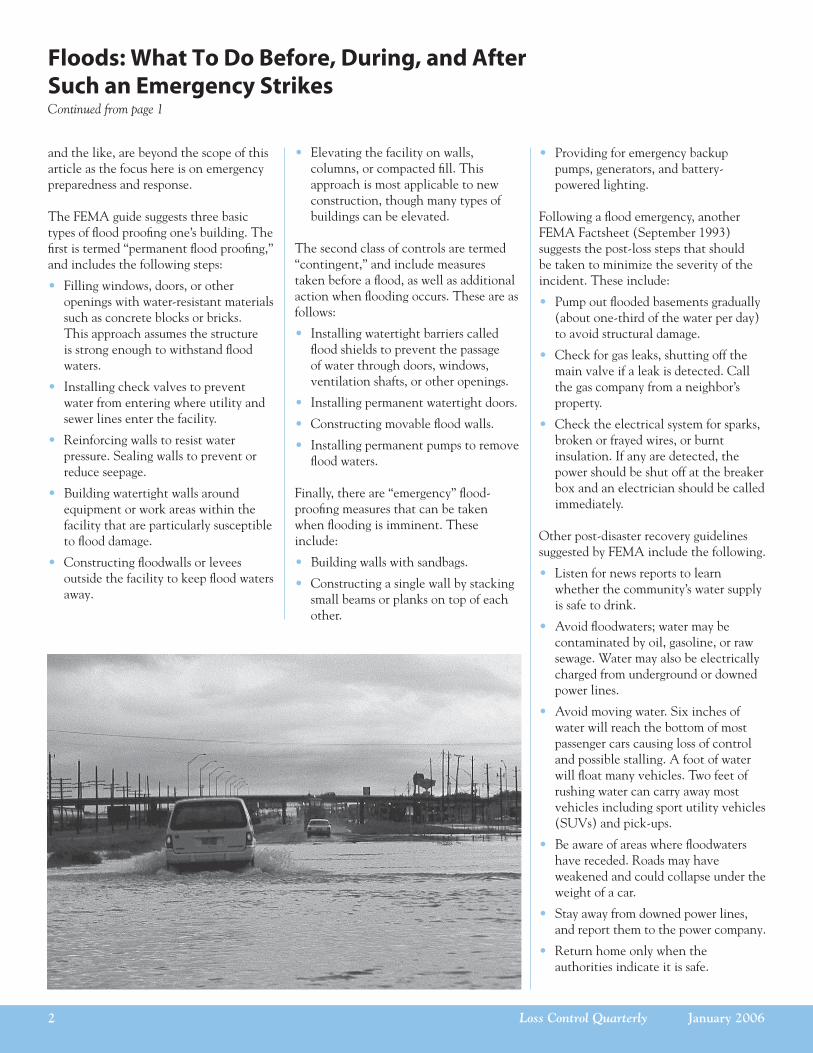
• Avoid moving water. Six inches of water will reach the bottom of most passenger cars causing loss of control and possible stalling. A foot of water will fl oat many vehicles. Two feet of rushing water can carry away most vehicles including sport utility vehicles (SUVs) and pick-ups.
• Be aware of areas where fl oodwaters have receded. Roads may have weakened and could collapse under the weight of a car.
• Stay away from downed power lines, and report them to the power company.
• Return home only when the authorities indicate it is safe.
Loss Control Quarterly January 2006 2
Floods: What To Do Before, During, and After Such an Emergency StrikesContinued from page 1
• Stay out of any building if it is surrounded by fl oodwaters.
• Use extreme caution when entering buildings; there may be hidden damage, particularly in foundations.
• Service damaged septic tanks, cesspools, pits, and leaching systems as soon as possible. Damaged sewage systems are serious health hazards.
• Clean and disinfect everything that got wet. Mud left from the rainwater can contain sewage and chemicals.
Additional InformationFlood insurance: consider the following facts:
• As noted above fl ood losses are not covered under homeowners insurance policies.
• The National Flood Insurance Program alluded to above is administered by FEMA. It makes federally backed fl ood insurance available in communities that agree to adopt and enforce fl oodplain management ordinances to reduce future fl ood damage.
• Flood insurance is available in most communities through independent insurance agents.
• There is, however, a 30-day waiting period before fl ood insurance goes into effect. This provision is intended to preclude the last-minute procurement of such coverage based upon predictions of imminent fl ooding due to the approach of a major hurricane.
• Flood insurance is available whether the building is in or out of the identifi ed fl ood-prone area.
• With respect to commercial properties, one of the most signifi cant issues to consider is having adequate business interruption insurance. The coverage described above covers only the physical property itself, and makes no provision of the incidental costs that a business owner incurs in the aftermath of a fl ood.
Business Interruption CoverageAs the needs of every business are unique, it is essential to have a meaningful dialogue with one’s agent or broker when the policy is issued to assure that the limits are adequate for the exposures peculiar to the applicant’s operation. Many businesses qualify for the basic Business Owner’s Policy (BOP), which automatically affords business interruption and extra expense coverage for a year. While most business owners would anticipate that this is ample time for a full recovery of operations, there are certain restrictions that are inherent in this form that one must consider. With respect to payroll, for example, the basic form only provides for 60 days of coverage. Older buildings might also be subject to the additional costs of rebuilding to comply with more stringent building codes that have been enacted since the original building was erected. As most policies exclude the costs associated with enhanced code compliance, this is an issue that must be addressed at the time of policy issuance. These are but two pitfalls that a business owner may experience in the event that his or her business interruption policy is not carefully tailored to the particular features of the applicant’s
fi rm. Accordingly, it is essential that the client’s agent or broker have a true understanding of all aspects of the business being covered at the time of policy issuance to assure that there are no unintended gaps following the loss.
ConclusionAs noted above, fl oods are the most common and destructive of natural disasters in the United States, but their effects can be greatly mitigated by being aware of these various pre-loss and post-loss control techniques. Also, while the article tended to emphasize recommended loss control techniques, the insurance aspects of fl ood preparation should not be overlooked. In view of the inherent limits of the typical homeowners policy, the restrictions contained in the FEMA National Flood Program, and some of the pitfalls associated with business interruption insurance, it is essential that all policyholders secure the services of a professional agent or broker to assist them in this regard. This requirement is no less important for the typical homeowner than it is for the business owner whose enterprise may be wiped out by a storm such as Katrina. Finally, despite the widespread criticism that has been directed at FEMA during the course of recovery efforts, the reader is urged to review its web site listed above for the wealth of information that is contained therein. This article has merely scratched the surface of this valuable resource. ■
Volume 17 Number 1 3
■ . . . fl oods are the most common and destructive of natural disasters in the United States . . .

Editor’s Note: Regular readers of the LCQ may recall that a previous issue (December 1998) covered an innovative fl oor treatment product designed to minimize the potential for slip/trip/fall losses by increasing the fl oor’s static coeffi cient of friction, particularly when wet. This product was called NO-Slip, and was manufactured by an Orlando-based fi rm by the same name. In view of the publication of Steven DiPilla and Keith Vidal’s article on page 6, “State of the Art in Slip-Resistance Measurement,” it seemed like an opportune time to update the readership on more recent success stories enjoyed by this noninvasive approach. Anyone seeking additional information on this product should contact Steven Plant at (416) 256-4335.
Introduction
In the intervening seven years since fi rst being featured in the LCQ, the NO-Slip treatment product remains the same but the fi rm’s name has been changed to Slip and Fall Solutions, Inc. According to President Steven Plant, the change was prompted by the fi ne-tuning that has resulted from an expanded product line created to address a number of other aspects of slip/trip/fall control measures.
As pointed out so cogently by authors DiPilla and Vidal on page 6, the problems posed by slip/trip/falls incidents remain daunting with more than 16,000 deaths annually, second only to automobile accidents as a cause of death. In order to confront this momentous problem, property and business owners must both understand the magnitude of the challenge and appreciate the need to take pre-emptive action in order to make their fl oors safer for everyone before a loss occurs, rather than deal with the consequences after the fact. Finally, it is not only the business owner and member of the public who benefi t, but, as noted below, insurance intermediaries, such as agents and brokers, can also provide “value-added” service to clients by providing real-world solutions.
The NO-Slip Treatment SolutionWhile many property owners wrongly conclude that acid etching products are the logical solution for increasing a fl oor’s static coeffi cient of friction, they are sorely mistaken and usually not aware of an alternate approach. Gilbert Morris, a risk control consultant with AON Reed Stenhouse in Toronto, can recall numerous instances where clients’ fl oors were completely destroyed, and other cases where more prudent owners tried an acid etch on a small test patch fi rst before taking the plunge. Both groups quickly came to conclude that acid etching is the wrong approach.
The reason why acid etches ultimately fail is that this is an invasive process in which the corrosive substance drastically increases the size of the fl oor’s pores allowing an accumulation of grease, dirt, and oil within the walking surface. The increased pore size not only adds to the accumulation of this foreign matter, but by breaking through the surface, it also makes the fl oor harder to keep clean, reduces stain resistance, and negatively impacts the long-term wear of the surface. The results can be disastrous, sometimes resulting in discoloration or even the total replacement of the fl oor. In most cases the increased slip resistance is short lived.
NO-Slip treatment, by contrast, has none of these adverse attributes. The quick, safe, inexpensive mop and bucket self-application results in a wet coeffi cient of friction that is usually comparable to a dry tile fl oor. An ASTM F1679-96 F13 Committee test on one tile sample using the English XL Variable Incidence Tribometer performed by the inventor himself yielded the following results:
Wet Dry
NO-SlipTreatment .66 .73
Untreated .47 .65
NO-Slip achieves these results by bonding large numbers of raised, microscopic particles to the tile to increase the traction on a wet surface. One cannot feel any difference on a dry surface, as there is no gritty sandpaper effect. As ASTM standards mandate a coeffi cient of friction of .5 or greater wet or dry, it is readily apparent that the NO-Slip treatment is the obvious solution for wet fl oors. The warranty on tile and concrete surfaces is three years, which corresponds to the recommended time period for a second application of the product.
Is NO-Slip the answer for every type of surface? Not necessarily. While it is ideal for glazed and unglazed ceramic tiles, quarry tile, cement, paver block, and slate, there are some substances that are not appropriate for NO-Slip. These include vinyl tile, acrylic or silicone sealed surfaces, wood, plastic, and fi berglass.
NO-Slip Treatment Revisitedby Charles H. Morgan, J.D., CPCU, CLU, CSP, ARM
Loss Control Quarterly January 2006 4
■ NO-Slip achieves these results by bonding large numbers of raised, microscopic particles to the tile to increase the traction on a wet surface.

So what do insurance risk management professionals have to say about the product? AON’s Gil Morris was quite outspoken regarding NO-Slip’s performance seven years ago, and is still singing its praises today. He particularly likes the fact that it is not an acid etch product, and thus cannot “ruin a customer’s fl oor.” Likewise, John Delutrie of Arthur J. Gallagher (Florida) is even more excited about introducing NO-Slip to his clients. He views this solution as being a “value-added” service to his clients that makes his agency shine in the estimation of his customers. In terms of a “cost-benefi t” solution to slippery fl oors, Delutrie says that NO-Slip treatment has no equal.
ConclusionAs noted in the DiPilla and Vidal article on page 6, slippery fl oors continue to be a vexatious problem for every property owner. The solution, therefore, is not to decry the situation after a loss has occurred, but rather, to take a proactive stance, and render one’s fl oors as slip-resistant as they can possibly be. By all accounts, there is no solution better for tile, concrete, and ceramic fl oors than NO-Slip treatment. ■
Volume 17 Number 1 5
ChairmanJane M. Wahl, CPCUState Farm Group8001 Baymeadows WayJacksonville, FL 32256-7597Phone: (904) 443-4907eMail: [email protected]
Debra L. Dettmer, CPCUFarm Credit Council ServicesBox 513010375 E Harvard, Suite 220Denver, CO 80217-5130Phone: (720) 747-4266eMail: Debbie.Dettmer@
FCCServices.com
Christopher David Conti, CPCU, CSPRiskWise16086 Acadia Dr.Prairieville, LA 70769Phone: (225) 413-7542eMail: [email protected]
Virginia W. Griffi n, CPCUACE Insurance825 Heathland Ct.Roswell, GA 30075-6915Phone: (770) 518-9210eMail: ginga.griffi [email protected]
Donald J. Jackson, CPCUZurich North America27 Palm LaneWestbury, NY 11590-6311Phone: (516) 997-8859eMail: [email protected]
Eli E. Shupe Jr., CPCUCincinnati Insurance CompanyPO Box 145496Cincinnati, OH 45250-5496Phone: (513) 870-2447eMail: eli_shupe@cinfi n.com
Eli D. Stern, CPCUCNA Insurance29 Wellford RoadWhite Plains, NY 10607Phone: (914) 289-0822eMail: [email protected]
LiaisonJohn J. Kelly, CPCUCPCU Society720 Providence RoadMalvern, PA 19355Phone: (800) 932-2728, ext. 2773eMail: [email protected]
2005-2006 Loss Control Section Committee
■ Steven DiPilla, ARM, AIC, is director of research and development for Risk Control Services at ESIS Inc. in Philadelphia, PA. DiPilla is chairman of ASTM Technical Committee F13 Pedestrian/Walkway Safety and Footwear, and ANSI A1264.2 Standard for the Provision of Slip Resistance on Walking/Working Surfaces. He is the author of more than 35 published articles, and has published a book entitled Slip and Fall Prevention, A Practical Handbook. He is a professional member of ASSE’s Penn-Jersey Chapter.
■ Keith Vidal, P.E., is founder and principal of Vidal Engineering L.C., which specializes in consulting with manufacturers of slip-resistance related products, safety and claims management professionals, maintenance and housekeeping organizations, insurance companies, and attorneys. Vidal is a member of fi ve ASTM committees that are involved with pedestrian safety. He is the chairman of the ANSI A1264 committee, and ASTM F13.10 on Traction, and has written and presented many articles and studies on the subject of slips, trips, and falls. He is a professional member of ASSE’s St. Louis Chapter.
Editor’s note: This article is reprinted with permission from the June 2002 issue of Professional Safety, monthly journal of the American Society of Safety Engineers.
The following ASTM standards referenced in this article have been withdrawn with no replacement:
• F1678 referenced in the section on the NBS-Brungraber (or Mark I) was withdrawn in 2005.
• F489, referenced in the section on the James Machine was withdrawn in 2004.
• D5859, referenced in the section on Other ASTM Standards was withdrawn in 2005.
• C1028, referenced in the section on Other ASTM Standards was withdrawn in 2005.
• All other standards remain in force.
The opinions expressed in this article are those of the authors and not necessarily the opinions of ESIS Inc. or of Vidal Engineering. Nothing in this article is intended as an opinion that any product is defectively designed or manufactured.
Falls in the workplace are the number-one preventable loss type; in public places falls are far and away the leading cause of injury. More than one million people suffer from slip, trip, or fall injuries each year, and more than 16,000 die as a result of falls, second only to automobiles as a cause of death. Falls are estimated to cause at least 17 percent of occupational injuries, and more than 18 percent of public-sector injuries (NSC 9). In addition, it is well known that falls are underreported, since accident rates are normally classifi ed by injury type rather than cause of injury in workers compensation and NEISS statistics.
Because one can measure slip resistance in many ways, no universally recognized method of measurement has yet been established. A recent count (1996) identifi ed at least 60 different slipmeters that have been invented since the fi rst known device of this type (the Hunter Machine) was developed in the 1930s (Strandberg 213-214). However, of the most widely used slip-resistance measurement devices (or tribometers), only two have suffi cient credentials to be used on dry and contaminated surfaces.
Another problem is that the output of these instruments doesn’t always agree, and no method exists to correlate the results of one class of tribometer with another. Compounding this problem is the misinformation used to market several instruments, and the inaccurate literature provided with certain fl ooring, fl oor treatments, and footwear.
The terms “static coeffi cient of friction” (SCOF) and “slip resistance” are often used interchangeably. While SCOF refers more to the theoretical and to laboratory testing, the term slip resistance includes variables found in fi eld testing (such as contamination of the fl oor or shoe surface). While older standards refer to this measurement as SCOF, emerging standards are using the term slip resistance.
Slip-resistance rating ranges from a minimum of zero to a maximum of one. The closer the rating is to zero, the greater the relative slipperiness of the surface tested. For example, a rating of 0.1 indicates very low slip resistance, while a rating of 0.9 indicates very high slip resistance.
Testing for Slip ResistanceMany slip-and-fall incidents occur as a result of contact with a spot on the fl oor surface that is unexpectedly slippery, often due to moisture. Currently, only two devices have an ASTM F-13 standard for wet testing: the portable inclineable articulated strut tribometer (PIAST, aka Brungraber Mark II) and the variable incidence tribometer (VIT, aka English XL). Many independent studies have verifi ed the reliability of these devices for wet testing. From forceplate analysis and roughness measurement to testing in workshops conducted by the American Society for Testing and Materials (ASTM) and others, the PIAST and VIT have proven to produce repeatable and reproducible results (Powers 373).
State of the Art in Slip-Resistance MeasurementA Review of Current Standards and Continuing Developmentsby Steven DiPilla, ARM, AIC, and Keith Vidal, P.E.
Loss Control Quarterly January 2006 6
■ More than one million people suffer from slip, trip, or fall injuries each year, and more than 16,000 die as a result of falls.

Why can these devices meter wet surfaces more accurately than others? They avoid “sticktion” (also known as “stick-slip”). Sticktion is the result of water being squeezed out of the interface (between the test foot and the walkway surface), creating a temporary bond between these surfaces. Test results of devices subject to sticktion can produce unrealistically high slip-resistance readings on wet surfaces—sometimes producing results indicating greater slip resistance than the same surface when metered dry. Sticktion is a byproduct of residence time, which is any delay between the instant of surface contact and the application of horizontal force (Kulakowski 235). The PIAST and VIT avoid sticktion by applying the horizontal and normal forces simultaneously, thus eliminating residence time and sticktion. A similar phenomenon cited in the literature relating to dry conditions is referred to as “adhesion” (Brungraber). While all F-13 ASTM-recognized tribometers can be used for dry testing, remember that dry contaminants can alter test results.
ASTM Tribometer StandardsASTM, a nationally recognized consensus standards-making organization, is active in the development of slip-resistance-related standards. It currently has eight active standards for six different slipmeters, which include the build-it-yourself horizontal dynamometer pullmeter method (also known as the “50-pound monster”), the no-longer-manufactured horizontal pull slipmeter (HPS), the laboratory-only James Machine, and the proprietary PAST, PIAST, and VIT devices.
Some methods are approved only for specifi c uses. For example, the standard for the horizontal dynamometer pullmeter method (C1028) specifi es that this device is approved for use only on ceramic tile and like surfaces. Therefore, using it to test walkway surfaces other than ceramic tile is of questionable validity since the device has been evaluated and approved for use only on this specifi c material.
Readings on the same surface under substantially identical conditions with two different types of instruments can result in different slip-resistance determinations. For example, tests performed with an HPS and a James Machine on the same surface and under the same conditions can produce different results. Currently, there is no known correlation between these devices; this is because test methods have their own set of biases and operator variability issues, and also because friction is, in part, a property of the system used to measure it (Marpet).
ASTM F-13 Tribometer StandardsThe title of the ASTM F-13 technical committee is Safety and Traction for Footwear. This name is a bit misleading, since its scope also includes safety and traction for walkway surfaces, as well as practices related to the prevention of slips and falls. Currently, fi ve tribometers have an F-13 standard.
James MachineThe James Machine is a laboratory-only device for dry testing in accordance with standard F489, Standard Test Method for Using a James Machine. Sidney James of Underwriters Laboratories developed this early slipmeter in the 1940s. As an articulated strut class of tribometer, the James Machine applies a known constant vertical force to a test pad (leather when evaluating fl ooring materials), then applies an increasing lateral force until a slip occurs (Sacher 33).
The James Machine has several inherent biases, prompting users to make modifi cations in an attempt to achieve good repeatability on a single instrument and good correlation between several machines. The device needs continuous maintenance and adjustment, in part due to the required release of an 80-lb. weight (ASTM D6205).
Horizontal Pull SlipmeterThis device is approved for dry testing only under standard F609, Standard Test Method for Using a Horizontal Pull Slipmeter (HPS). Charles Irvine
developed this instrument in the 1960s. The basic principle of the HPS, a dragsled class of slipmeter, is the pulling of a footwear or surrogate material against a walkway surface under a fi xed load at a constant velocity. The HPS consists of a 10-lb. weight onto which a slip index meter is attached. This component is attached to a nylon string and pulled by a capstan-headed motor. Aside from the problem of sticktion that makes this device unreliable on wet surfaces, it raises other concerns.
• Use of a spring combined with the analog indicator makes obtaining a defi nitive reading diffi cult.
• Lack of structure between the motor and the meter/weight (a nylon string) can result in operator variances in the application of lateral forces.
• Although other devices are based on similar dragsled technology, the ASTM-approved version of the HPS is no longer in production.
NBS-Brungraber (Mark I)This device is also approved for dry testing only as the portable articulated strut tester (PAST) under standard F1678, Standard Test Method for Using a Portable Articulated Strut Slip Tester. While working for the National Bureau of Standards (NBS, now known as the National Institute for Standards and Technology) in the 1970s, Robert Brungraber developed this tester. Similar in principle to the James Machine, the Mark I is also an articulated strut instrument approved only for dry testing. It is generally used with a leather test pad. Unlike the James Machine, however, it is portable and can test actual fl oors; it uses a graduated rod that provides a direct reading from the device. Some calculation is required to convert this to a slip-resistance measurement (Brungraber). Although the Mark I is still in use, Brungraber’s subsequent invention, the Mark II, has gained wider acceptance.
Volume 17 Number 1 7
Continued on page 8
Brungraber Mark IIApproved for dry and wet testing as the PIAST under standard F1677, Standard Test Method for Using a Portable Inclineable Articulated Strut Slip Tester, this device was invented by Brungraber in the 1980s. A gravity-based articulated strut device designed to avoid sticktion, the Mark II enables users to reliably meter wet surfaces. It does so by eliminating the residence time (or time delay) between the application of the vertical and horizontal forces. Like the Mark I, it is a portable device. It uses a 10-lb. weight on an inclineable frame, with a test foot suspended just above the walkway surface. Each time the angle is set to a more-horizontal position, the weight is released, until a slip occurs. The slip-resistance reading can be taken directly from the instrument.
English XLThe English XL is approved for dry and wet testing as the VIT under standard F1679, Standard Test Method for Using a Variable Incidence Tribometer. In the early 1990s, William English developed this device, an articulated strut device similar in principle to the James Machine and the Mark II. Unlike those devices, the English XL does not rely on gravity, but is powered by a small carbon dioxide cartridge at a set pressure. This feature ensures consistent operation by the application of uniform force for each test, and it permits reliable metering of inclined surfaces such as ramps (English). Like the Mark II, the application of vertical and horizontal forces is simultaneous, thus avoiding residence time and permitting reliable measurement of wet surfaces (Powers 373).
Test Pad MaterialsVarious materials have been used to test for slip resistance, including leather, Neolite® test liner, and various rubbers. Debate continues regarding the most-suitable material.
Neolite® Test Liner• Despite protests to the contrary,
Neolite® was at one time used by the footwear industry as a heel material. Documents from the U.S. Trademark Electronic Search System verify that this material was registered in 1953 by the Goodyear Tire & Rubber Co. for “soles and heels composed of an elastomer and a resin.”
• Material characteristics do not change under normal conditions, regardless of wear or moisture.
• Its traction properties are in the median range of commonly used shoe-bottom materials (Goodwin).
• It has been proven reliable and repeatable over many years in service as a friction pad material, as the material of choice for the horizontal pull dynamometer pullmeter, HPS, PIAST, and VIT (Vidal 80, 815).
Leather• Leather is not homogenous. In fact, as
it is an organic material, each piece of leather could be considered a unique material.
• Leather is highly absorbent and highly sensitive to humidity. Once leather is used for wet testing, its properties are permanently altered (Bowman, “Legal and Practical”).
• Leather is also not representative of heel material. Most heels are of a synthetic compound. Essentially, slips occur more on the rubber heels of leather-soled shoes.
• Leather can react differently depending on how worn the material has become.
RubbersVarious rubber compounds (e.g., 4S, Neoprene, Nitrile) have been proposed (and used) as a friction pad material. In most cases, these have been in relation to overseas test methods such as the pendulum tester and Tortus-type devices (see Overseas Standards). Most rubber compounds have a curing period of six months or more during which they are
unstable and, thus, unreliable. In addition, there is no source of a consistent, long-term formulation. Many rubbers are among the most slip-resistant materials currently in use for footwear and can provide overly optimistic readings when assessing the slip resistance of fl ooring materials (James 14). In contrast, neoprene rubber, a specifi cation of some U.S. government shoes, provides low traction on lubricated surfaces. The impact of wear on rubbers is another variable.
Other ASTM StandardsSome standards relating to the measurement of pedestrian slip resistance/surface traction are the responsibility of other ASTM committees, but are usually intended for merchantability of products. Except for C1028, each specifi es devices for which ASTM F-13 standards also exist.
• D2047, Standard Test Method for Static Coeffi cient of Friction of Polish-Coated Floor Surfaces as Measured by the James Machine, is under the jurisdiction of technical committee D21, Polishes. This standard uses the same apparatus as ASTM F489. As a laboratory-based machine, it can be used only on fl oor samples, not in-service fl oors. Since the device is subject to sticktion and specifi es the use of leather (the properties of which change when wet, delivering overly optimistic readings), this device should be used only to test dry surfaces (ASTM D2047). Set-up instructions have never been standardized, an issue made more complex by the presence of at least four different versions of the James Machine, some of which are no longer commercially available. Despite these shortcomings, the device is still used to validate the merchantability of new fl ooring materials and treatments.
• D5859, Standard Test Method for Determining the Traction of Footwear on Painted Surfaces Using the Variable Incidence Tester, has been transferred from D01, Paints to ASTM F-13.
• C1028, Standard Test Method for Determining the Static Coeffi cient of
Loss Control Quarterly January 20068
State of the Art in Slip-Resistance MeasurementA Review of Current Standards and Continuing Developments Continued from page 7

Volume 16 Number 3 9
Friction of Ceramic Tile and Other Like Surfaces by the Horizontal Dynamometer Pull-Meter Method, is under the jurisdiction of technical committee C21, Ceramic Tile. Although often confused with the F609 HPS device (since it operates in a similar way), the manually operated C1028 is a different instrument—a do-it-yourself device. C1028 contains instructions on how to construct and operate the device, calling for an analog dynamometer, Neolite® test pad, and 50-lb. weight (ASTM C1028). Because it is not a manufactured device, most C1028 units are unique, increasing the potential for variability in results. Although it is currently approved for wet testing, like other dragsled technologies, the C1028 method produces erratic results on wet surfaces (Guevin 5).
Plans for the ASTM “Gold” StandardThe ASTM Board of Directors appointed a Slip Resistance Task Group to address various slip-resistance issues. In essence, the documents being considered present a relative ranking. Standards may call for the identifi cation of a set of external calibration material sets (footwear- and walkway-reference materials or surrogates) that represent the range (low to high) of pedestrian slip-resistance situations. Following a detailed procedure, a valid tribometer would be required to rank these material sets in their proper order, thereby developing a calibration curve. Once generated for any apparatus, this curve would then be used to verify the instrument or qualify/measure the slip resistance of surfaces, using the reference set of surrogates. Various surfaces or footwear materials tested would be ranked against this calibration set.
If this approach is technically feasible, ranking results may eliminate the need to reconcile the differences in numeric results of the various tribometers. Work continues on this challenging effort.
Overseas StandardsU.S. standards for tribometers are the result of “full consensus.” In the case of ASTM, no more than 50 percent of the committee may be producers, and a wide range of interests are represented, including footwear, fl ooring, steel, consultants, and the general public. This is known as “balancing” a committee so that no one interest group can exert undue infl uence on how the standard is developed or its requirements. The consensus approach aims to arrive at viable standards that provide protection to the public while being reasonable enough to be implemented by industry.
Overseas standards are a different story, however. Often, these standards are not developed by consensus, but rather are funded, written, and published primarily by commercial groups with vested fi nancial interests in industry-friendly standards. While such organizations may welcome the participation of all parties, they are not required to maintain a specifi c balance of interests (Bowman “Impact”).
Ramp TestsRamp tests originated in Germany with a set of DIN (a nongovernmental standards-making organization in Germany) standards, and are now in Australian/New Zealand standards. DIN 51097/51130 requires a number of test subjects to walk on various wet tiles. The angle of the ramp is gradually increased until the person is about to slip. Unfortunately, this approach raises several issues. Experts agree that a person’s awareness of a potentially slippery surface infl uences the way he or she traverses that area. For example, if ice or water are present, a person will adjust gait accordingly and likely cross the surface without incident. It is when a person is unaware of the hazard and expects the level of traction to continue that slips are most likely to occur. That said, let’s look at ramp tests.
• People selected to participate in the ramp test will expect a slippery surface and, in anticipation, will change their gait. No amount of preparation or instruction will change that. As a
result, they will perform much better on the ramp test than they would when encountering an unexpectedly slippery surface in real life.
• People walk on inclines differently than they do on level surfaces. Slipping at a certain point on an incline cannot be compared in any way to slipping on the same surface were it level (Hughes).
• The test method specifi es the use of as few as two test subjects, a statistically inadequate sample to provide a basis for validation of the results (Adams). The two subjects selected could easily be anomalous, thus delivering measurements that bear no resemblance to actual conditions.
In essence, ramp tests involve so many biases and variables that whether they can be considered a viable method for evaluating the traction of level walkway surfaces remains in question.
Pendulum TestersThe basic principle of the pendulum class of slip-resistance tester involves the calculation of friction loss as an indirect measurement of slip resistance. The pendulum is raised to a fi xed height above the surface and is swung across it. As the test foot crosses the walkway, a spring presses the foot material against the surface. The rubbing of the foot on the surface results in a loss of energy due to friction determined by the reduced length of the swing. This is then related to the COF (Sigler).
Since its development in the late 1940s, the Sigler pendulum tester has fallen out of U.S. standards for pedestrian slip resistance since its results cannot correlate with human perception of slipperiness. At one time, an NBS standard covered this device, and it was also specifi ed in Federal Test Method Standard 501a, Method 7121. Practical problems with such devices include their dynamics and operation. Of particular concern is the excessive velocity at which the machine operates, bearing no relation
Volume 17 Number 1 9
Continued on page 10
to that of human ambulation (English). Research conducted in the 1970s by ASTM Task Group 15.03 determined that pendulum devices showed signifi cant variation across the test surface, making a reasonable correlation of these results to a single slip-resistance value impractical (Brungraber). The same conclusion was reached in a separate research project
by the NBS in the late 1970s. Usability is also a concern; the device is complex and diffi cult to operate, so its results are highly subject to operator error (Adler and Pierman 9).
Digitized DragsledsThe original patent for the Tortus, originally developed by British Ceramic Research Ltd., has expired, but several similar devices are currently in use: the Tortus II (British), Sellmaier (German), FFT (Floor Friction Tester), Gabrielli (Italy), and FSC2000. The Tortus and its progeny are self-propelled electronic devices based on dragsled principles that in no way emulate human ambulation. Test pad material varies (Tortus II uses 4S rubber; Sellmaier uses several different materials). As the test pad is dragged across the fl oor, it records frictional forces and displays and prints the values. Forceplate data from the 1991 ASTM workshop at Bucknell demonstrate the erratic and unstable output of this class of tester, which produces results similar to the variable results of HPS, another dragsled device, when performing wet testing.
Tortus and like devices have several major disadvantages:
• They are not reliable for wet testing due, in part, to the lack of adequate wheel traction and the problem of sticktion. Even the new AS/NZ 4586 standard (Slip Resistance Classifi cation of New Pedestrian Surface Materials) does not list this device for wet testing due to poor repeatability (Bowman “Tortus”). A study by RAPRA Technology concluded that “the Tortus instrument is not at all reliable in wet conditions” (Hughes and James).
• There are no known calibration procedures or requirements.
• As yet, no U.S. standard recognizes this class of tribometer as a valid test device, nor are any plans underway to develop one.
ConclusionSH&E professionals are wise to be wary of instruments and test methods not supported by a nationally recognized consensus organization such as ASTM. Some slip-resistance measurement instruments have been portrayed as standardized devices. While ASTM recognizes several test instruments for metering clean, dry surface conditions, only two tribometers have been proven reliable for wet and contaminated testing: PIAST (Mark II) and the VIT (English XL). Slip-resistance standards from overseas may have little applicability in the U.S. because they may not be developed by consensus; there is little agreement between European Union countries regarding a unifi ed approach; and most of these technologies have already been explored by U.S. standards organizations.
ASTM’s effort to establish a single standardized test method, independent of test instruments, promises to resolve longstanding inconsistencies in the measurement of slip resistance between technologies. This “performance-based” approach would permit any instrument to be used, providing it could demonstrate reproducible and accurate test results on external calibration materials. ■
Loss Control Quarterly January 200610
State of the Art in Slip-Resistance MeasurementA Review of Current Standards and Continuing Developments Continued from page 9
■ SH&E professionals are wise to be wary of instruments and test methods not supported by a nationally recognized consensus organization such as ASTM.
Reducing Slips and Falls in the Workplace
A1264.2 Standard Covers Walking/Working SurfacesAccording to the U.S. Department of Labor, 15 percent of accidental workplace deaths are caused by slips, trips, and falls, second only to traffi c crash fatalities. A1264.2, Standard for the Provision of Slip Resistance on Walking/Working Surfaces, was developed to help SH&E professionals address this problem. The standard defi nes the term slip resistance and establishes common and accepted practices for providing reasonably safe walking and working surfaces. The standard was approved by ANSI July 2, 2001, with ASSE serving as secretariat for the A1264n Standards Committee.
A1264.2 explores surface characteristics, footwear traction, and environmental factors of slip resistance to ensure a safer walking/working environment. It explains fl oor characteristics, including the installation of mats and runners, controlling access to areas with a slippery environment and providing appropriate signage, footwear properties, such as a shoe’s sole design to ensure slip resistance, housekeeping training and maintenance, surface testing equipment, and fl oor selection. The standard is available from ASSE. For more information, visit www.asse.org or call ASSE’s Customer Service Department at (847) 699-2929; request item #3383.

Volume 16 Number 3 11
ReferencesAdams, N., “Slips and Falls: Some Arguments About Measuring Coeffi cients of Friction,” University of NSW, 1997.
Adler, S.C. and B.C. Pierman, “A History of Walkway Slip-Resistance Research at the National Bureau of Standards,” Gaithersburg, MD: National Bureau of Standards (NBS), 1979.
Bowman, R., “The Impact of New Standards on the Specifi cation of Tiling Systems and Products,” Dickson, Australia: Commonwealth Scientifi c and Industrial Research Organization (CSIRO), 1995, http://www.infotile.com/services/techpapers/95tilex.shtml.
Bowman, R., “Legal and Practical Aspects of Problems Arising from Slippery Floors,” Dickson, Australia: CSIRO.
Bowman, R., “The Tortus Floor Friction Tester: Round Robin Tests,” In Ceramics: Adding the Value: AUSTCERAM 92, M.J. Bannister, ed. Dickson, Australia: CSIRO Publications, 1992.
Brungraber, R.J., “National Bureau of Standards Technical Note 953: A New Portable Tester for the Evaluation of the Slip-Resistance of Walkway Surfaces,” Gaithersburg, MD: NBS, July 1977.
English, W., Pedestrian Slip Resistance: How to Measure It and How to Improve It, Alva, FL: William English Inc., 1996.
Goodwin, V.D., “Slip and Fall Accidents: Floor Testing,” March 1999, http://www.mde.cc/publications/slipfall.html.
Guevin, P.R., “Status of Skid and Slip Resistance Testing Relatable to Painted Floors.”
Hughes, R.C. and D.I. James, “Slipping Determinations: Magic and Myth,” undated paper, Shawbury, U.K.: RAPRA Technologies.
James, D.I., “A Standard Slider for Slip Measurements,” Polymer Testing, 8(1989): 9-17.
Kulakowski, B.T., et al, “Evaluation of Performance of Three Slip Resistance Testers,” Journal of Testing and Evaluation, 1989.
Marpet, M.I., “Comparison of Walkway Safety Tribometers,” Journal of Testing and Evaluation, 24(1996): 245-254.
National Safety Council (NSC), Accident Facts, Itasca, IL: NSC, 1999.
Powers, C.M., et al, “Repeatability and Bias of Two Walkway Safety Tribometers,” Journal of Testing and Evaluation, 27(1999): 368-374.
Sacher, A., “Slip Resistance and the James Machine 0.5 Static Coeffi cient of Friction Sine Qua Non,” ASTM Standardization News, Aug. 1993: 52-59.
Sigler, P., et al, “Measurement of the Slipperiness of Walkway Surfaces,” National Bureau of Standards NBS RP1879, Vol. 40, 1948.
Standards Australia, “Slip Resistance Classifi cation of New Pedestrian Surface Materials,” AS/NZS 4586:1999, Sydney, Australia: Standards Australia, 1999.
Strandberg, L., “Ergonomics Applied to Slipping Accidents,” in Ergonomics of Workstation Design, London: Butterworth, 1983.
Vidal, K., “Slips, Trips and Falls,” in Safety Management Handbook, Riverwoods, IL: CCH Inc., 2000.
Volume 17 Number 1 11
Slip-and-Fall Related Standards
American Society for Testing Materials Standards (ASTM)
• ASTM C1028 Standard Test Method for Determining the Static Coeffi cient of Friction of Ceramic Tile and Other Like Surfaces by the Horizontal Dynamometer Pull-Meter Method
• ASTM D2047 Standard Test Method for Using a James Machine
• ASTM D6205 Standard Practice for Calibration of the James Static Coeffi cient of Friction Machine
• ASTM D5859 Standard Test Method for Determining the Traction of Footwear on Painted Surfaces Using the Variable Incidence Tester
• ASTM F489 Standard Test Method for Using a James Machine
• ASTM F462 Standard Consumer Safety Specifi cation for Slip-Resistant Bathing Facilities
• ASTM F609 Standard Test Method for Using a Horizontal Pull Slipmeter
• ASTM F1677 Standard Test Method for Using a Portable Inclineable Articulated Strut Slip Tester
• ASTM F1678 Standard Test Method for Using a Portable Articulated Strut Slip Tester
• ASTM F1679 Standard Test Method for Using a Variable Incidence Tribometer
Deutsches Institute fur Normung e.V (DIN) Standards
• DIN 51097 Testing of fl oor coverings; determination of the anti-slip properties; wet-loaded barefoot areas; walking method; ramp test (November 1992).
• DIN 51130 Testing of fl oor coverings; determination of the anti-slip properties; workrooms and fi elds of activities with raised slip danger; walking method; ramp test (November 1992).
■ Tracy Hall, CBCP, is a business continuity planner and project leader at CAPS Business Recovery Services of Shelton, CT. Hall is a Certifi ed Business Continuity Professional and is also certifi ed on RecoveryPlanner software, an interactive integrated Continuity and Disaster Recovery Planning platform. She joined CAPS in 1999. She is active with organizations like the New England Disaster Recovery Exchange (NEDRIX) and Continuity Planning Exchange (CPE), and represents CAPS at national trade shows and conferences annually. Hall has also participated in the testing and recovery from disasters of several CAPS clients at its business recovery sites. She can be reached at (203) 925-3900.
The cost associated with downtime for companies across all industries is staggering. In fact, statistics show that companies that suffer signifi cant outages without a plan rarely survive the near term. In addition to having a plan, is it possible that business continuity planning tools can help minimize the impact of downtime? In what ways can a planning tool, or software product, maximize planning return on investment (ROI)?
ROIWhat is ROI? According to searchCIO.com, “For a given use of money in an enterprise, the ROI is how much profi t or cost saving is realized.” In essence, how can I get the most bang for my buck?
ROI can be measured in both hard and soft dollars. Not only might the company save actual money over the long term by purchasing a software product to assist in business continuity planning, the savings in soft dollars are often even more signifi cant and regularly translate to a savings of hard dollars. Saving time, increasing preparedness, adopting effi cient communication strategies, and fostering ease of proper documentation are all examples of soft-dollar savings.
Business continuity planning tools can satisfy immediate needs (we need a plan and we need it now!) as well as offer long-term results. These long-term results are typically the soft-dollar savings mentioned above, and all contribute to an overall increased ROI.
Managing a Business Continuity ProgramPrior to realizing how a planning tool can impact your company’s overall program, it is important to understand the enormity of the task of managing that program. Being in charge of your
company’s business continuity plan (BCP) or disaster recovery plan (DRP) is a lot of work. Creating the plan requires interviewing business unit key personnel, gathering supporting documentation, and distributing the information to the employees considered to be disaster critical. Not only is a business continuity manager in charge of the plan, which probably includes business impact analyses for critical departments, he or she is often responsible for relationships with alternate sites as well as awareness of the BCP and testing. This person is also typically the person in charge of disaster management should an emergency occur. Developing a business continuity program and keeping it current and exposed to the employees are big jobs. Often, a business continuity manager will be someone who already has a full-time job in the organization and has been given the responsibility of business continuity and/or disaster recovery.
Business Continuity Plan OptionsThere are options when deciding how you wish to build your plan.
Rudimentary Plans that Are Word BasedAlthough you have the ability to document and customize the details of the plan the way you would like, these plans are often insuffi cient for most companies. Maintenance and distribution of updates become a nightmare when you have hundreds of pages and many copies of the plan distributed throughout the organization. Ensuring that employees update their sections of the plan is diffi cult, and knowing that each member of the plan updates to the correct version is almost impossible. Communication and disaster management remain separate endeavors when utilizing Word-based plans.
Web-Based Business Continuity Planning Software Can Mitigate Losses and Increase Return On Investmentby Tracy Hall, CBCP
12 Loss Control Quarterly January 2006

ConsultantsAlthough this can take the burden off of the business continuity manager, hiring consultants to manage paper plans can be an expensive option. Then, unless there has been a thorough turnover phase (directed from the top down) to employees who will take over the maintenance updates, inter-departmental communication, and testing, the plan will quickly become obsolete.
Software SolutionsThere are a number of reasons why business continuity planning tools can be a favorable alternative. They offer a centralized repository for plans throughout your entire organization. All gathered supporting documentation can be kept in the same place, and all critical personnel have access to the same version of documents at the same time.
Planning tools allow the distribution of management and maintenance of the plan to various employees in the company. This allows for an increased awareness of plan details throughout the organization, which increases disaster preparedness. By using a software product, there is no longer the need to distribute updated hard copies of the plan to many different employees. A simple login is all they need to access critical details of the plan.
Planning tools also contribute to testing preparations. If the tool allows for the attaching of documents, testing objectives and results can be posted to the product for viewing of all personnel involved in the test.
Many software products offer effi cient forms of communication that are rapid, and can also be tracked in an audit trail. Documenting milestones in a place where all involved can see can be extremely helpful when dealing with insurance companies after the fact as well as when developing a list of “lessons learned.” In a disaster, the situation is often chaotic from the onset, and establishing sound communication methods beforehand can be critical to sharing essential information throughout
your organization. This can help lessen the time it takes to recover.
Planning tools also can tighten security on sensitive information regarding your company that is stored in your plan. Without a login, users cannot access the information that is easily accessible in a paper plan that is not secured.
Added ValuesImplementing an Internet-based software package is an added plus to your organization. If your plan resides securely on the web, it is accessible from anywhere at anytime as long as there is an Internet connection. Gone are the days of leaving important documentation in your offi ce that has been lost in the disaster. If your plan is on the Internet, it can help minimize network traffi c if employees are trying to access critical information on the network that has been affected and is being restored.
An even better situation is to subscribe to an application service provider (ASP) Internet solution. With an ASP, the application is housed at another location, which eliminates the concern of the application being affected by the disaster. It is important to ensure that employees and team members have access to the documentation they need to support a recovery effort, and this may not be possible if the software is affected by the disaster and not suffi ciently redundant.
It is important to look for a product that is user friendly. This, of course, should be balanced with functionality. A product that is easy to use requires less training, and chances are you’ll fi nd more people will use it.
Another thing to consider is that our society is growing more and more technology-minded by the day. People are more comfortable with technology and automated tasks than ever before, and will more than likely welcome a cutting-edge software tool.
So How Can a Software Planning Tool Maximize Your Resources and ROI? Resources, such as people, knowledge, time, and documentation, can all be more effi cient with a planning tool. By distributing responsibility of the plan throughout the organization, more people can contribute to the success of a recovery strategy. Also, more people will be aware that a plan exists and will know what to do in the event of a disruption. This will help save money lost during “down time” due to being unprepared, having a delay in communication, accessing old documentation, etc. Distribution of plan responsibility takes the huge task off one or just a few people and distributes the workload to many, saving valuable time and increasing plan awareness. This can eliminate the need to have a position created for one person to be solely responsible for the plan.
What is the bottom line? Saving time and increasing the effi ciency of valuable resources inevitably save your company money, translating to a higher return on investment. ■
Volume 17 Number 1 13

Loss Control Quarterly January 200614
Choose from four packages:
Conference Interactive CD-ROM Set $149 +(s/h) Set includes both Leadership Track and
Property & Casualty Insurance Track CD-ROMs. Offered in MP3 format with speaker handouts/slides.
Leadership Track $139 +(s/h)
Property & Casualty Insurance Track $139 +(s/h)
Fraud Theme Seminars $79 +(s/h)
Audio recordings of Annual Meeting seminars are now available on CD-ROM. The sessions were recorded at the CPCU Society’s 61st Annual Meeting and Seminars, October 22-25, in Atlanta, GA.
To order: Visit The Sound of Knowledge’s web site at http://www.twosense.net/specials/CPCU2005 to see a complete list of the seminar tracks. Order online or download an order form to order by fax, phone, mail, or e-mail.
Note: CD-ROM plays on WIN 98/NT/2000/XP and Mac. It will not play on your house or car stereo.
Learn Valuable New Information and Skills That You Can Apply Immediately
Photos from the CPCU Society’s 61st Annual Meeting and Seminars are now available for purchase through Choice Photography, the CPCU Society’s offi cial Annual Meeting photographer. View and order your own photographic prints, enlargements, and digital images on CD-ROM today!
Make Your Annual Meeting Memories Last a Lifetime!
To access Annual Meeting photos, go to www.cpcusociety.org, click on “View Highlights from the 2005 Annual Meeting and Seminars,” and click on the photograph link on the left side of the page.

■ Christopher D. Conti, CPCU, CSP, owns a loss control and injury management company. He can be reached at [email protected] or www.riskwise.biz or (225) 413-7542.
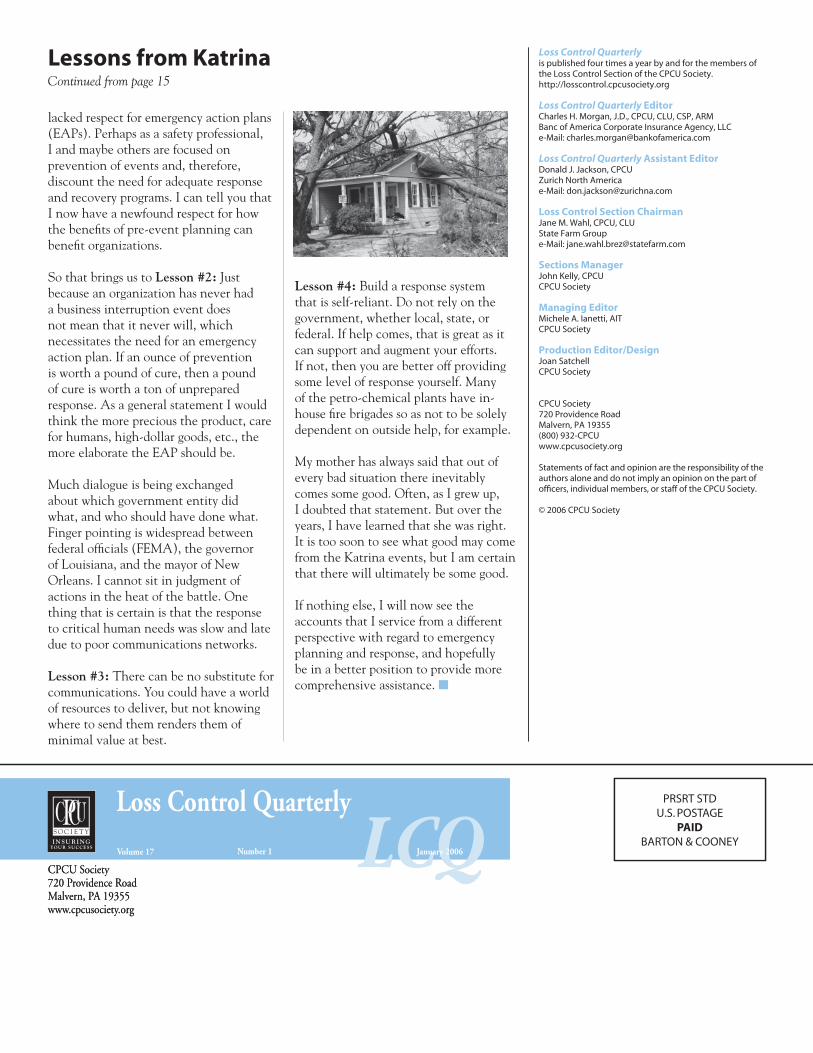
As most people know, Hurricane Katrina dealt a devastating blow to the Gulf Coast of the United States. The hardest-hit areas were east of New Orleans, LA. The actual city of New Orleans fared well in the storm, but the wind force caused signifi cant window damage to some of the taller buildings. As these buildings were built many years ago surely the architects knew the geography of the region with regards to the potential for hurricanes coming out of the Gulf of Mexico. Therefore, one might think that the buildings could have been engineered to withstand Category 5 hurricane-force winds. More to the point is a thing called storm surge—which is during a hurricane, due to the force of the wind, water is “surged” or forced into inland
areas. New Orleans has an elaborate system of levees, fl ood walls, and pumping stations to handle high-water conditions or so it thought. Add to the gumbo the topography of the city, which is actually in the shape of a bowl. Some of the earthen levees failed, and one fl oodwall—the now infamous 17th Street canal—lost a section approximately one-quarter of a mile wide. This fl ood wall was roughly 10 inches thick and 14 feet high, and was made of concrete and steel.
So this brings us to Lesson #1: There is an assumption of adequate engineering, design, and construction. I heard this topic described very well on the radio the other day. A civil engineer said that of all the engineering disciplines, mechanical, structural, electrical, civil, etc., we—civil engineers—do not get the luxury to actually test our fi nished product. It is often tested over time and through use and nature. There was a presumption that the Corps of Engineers had designed and oversaw the building of a fl ood
protection system that used an adequate safety factor as we do in safety design. Most engineering is sound and delivers structural integrity. The levees and fl ood walls were designed and built many years ago, and I wonder if current scientifi c modeling and computers would have changed the design and building criteria.
Another series of negative events occurred during and after the storm force, namely loss of electrical power, loss of running water, loss of natural gas, and loss of phone service, including cellular service. Cars, buses, and trolley cars were fl ooded and could not be used for evacuation. Certainly the employers and medical professionals operating in New Orleans, here again knowing the geography of the region, would have devised adequate plans complete with redundant systems to respond and recover from the predictable consequences of a hurricane. Well, some did and those employers/businesses that were prepared reduced the economic impact and human suffering that occurred. The large charity hospital system in downtown New Orleans did not evacuate the ill patients. I am sure it had its reasons for its decisions. Perhaps it relied on the backup generator. However, the generator was located in the basement of the hospital, and quickly failed as the city fi lled up with water from the burst fl ood wall. Another unsettling event was that one of the nursing homes that cared for the elderly suffered storm-related fatalities totaling 19 persons. I have to admit that pre-Katrina—which is now a post-Katrina offi cially coined term—that I
Volume 17 Number 1 15
Lessons from Katrinaby Christopher D. Conti, CPCU, CSP
Continued on page 16
“ The night before the storm, we took in six people, two of whom we did not know, andthey stayed 18 days. When they showed the pictures on TV of the devastation, I couldnot hold back the tears—to see the city that I was raised in and often work in, under somuch water fi lled my heart with sorrow.”
–Christopher D. Conti, CPCU, CSP
Loss Control Quarterlyis published four times a year by and for the members of the Claims Section of the CPCU Society.http://losscontrol.cpcusociety.org
Loss Control Quarterly EditorCharles H. Morgan, J.D., CPCU, CLU, CSP, ARMFleet Insurance Servicese-Mail: [email protected]
Loss Control Quarterly Assistant EditorDonald J. Jackson, CPCUZurich North Americae-Mail: [email protected]
Loss Control Section ChairmanEli E. Shupe Jr., CPCUCincinnati Insurance Companye-Mail: eli_shupe@cinfi n.com
Sections ManagerJohn Kelly, CPCUCPCU Society
Managing EditorMichele A. Ianetti, AITCPCU Society
Production Editor/DesignJoan SatchellCPCU Society
CPCU Society720 Providence RoadMalvern, PA 19355(800) 932-CPCUwww.cpcusociety.org
Statements of fact and opinion are the responsibility of the authors alone and do not imply an opinion on the part of offi cers, individual members, or staff of the CPCU Society.
© 2005 CPCU Society
CPCU Society720 Providence RoadMalvern, PA 19355www.cpcusociety.org
Loss Control Quarterly
Volume 16 Number 3 LCQSeptember 2005
PRSRT STDU.S. POSTAGE
PAIDBARTON & COONEYINSURING
YOUR SUCCESS
Chartered Property Casualty Underwriters
S O C I E T Y
Loss Control Quarterlyis published four times a year by and for the members of the Loss Control Section of the CPCU Society.http://losscontrol.cpcusociety.org
Loss Control Quarterly EditorCharles H. Morgan, J.D., CPCU, CLU, CSP, ARMBanc of America Corporate Insurance Agency, LLCe-Mail: [email protected]
Loss Control Quarterly Assistant EditorDonald J. Jackson, CPCUZurich North Americae-Mail: [email protected]
Loss Control Section ChairmanJane M. Wahl, CPCU, CLUState Farm Groupe-Mail: [email protected]
Sections ManagerJohn Kelly, CPCUCPCU Society
Managing EditorMichele A. Ianetti, AITCPCU Society
Production Editor/DesignJoan SatchellCPCU Society
CPCU Society720 Providence RoadMalvern, PA 19355(800) 932-CPCUwww.cpcusociety.org
Statements of fact and opinion are the responsibility of the authors alone and do not imply an opinion on the part of offi cers, individual members, or staff of the CPCU Society.
© 2006 CPCU Society
CPCU Society720 Providence RoadMalvern, PA 19355www.cpcusociety.org
Loss Control Quarterly
Volume 17 Number 1 LCQJanuary 2006
PRSRT STDU.S. POSTAGE
PAIDBARTON & COONEYINSURING
YOUR SUCCESS
Chartered Property Casualty Underwriters
S O C I E T Y
lacked respect for emergency action plans (EAPs). Perhaps as a safety professional, I and maybe others are focused on prevention of events and, therefore, discount the need for adequate response and recovery programs. I can tell you that I now have a newfound respect for how the benefi ts of pre-event planning can benefi t organizations.
So that brings us to Lesson #2: Just because an organization has never had a business interruption event does not mean that it never will, which necessitates the need for an emergency action plan. If an ounce of prevention is worth a pound of cure, then a pound of cure is worth a ton of unprepared response. As a general statement I would think the more precious the product, care for humans, high-dollar goods, etc., the more elaborate the EAP should be.
Much dialogue is being exchanged about which government entity did what, and who should have done what. Finger pointing is widespread between federal offi cials (FEMA), the governor of Louisiana, and the mayor of New Orleans. I cannot sit in judgment of actions in the heat of the battle. One thing that is certain is that the response to critical human needs was slow and late due to poor communications networks.
Lesson #3: There can be no substitute for communications. You could have a world of resources to deliver, but not knowing where to send them renders them of minimal value at best.
Lesson #4: Build a response system that is self-reliant. Do not rely on the government, whether local, state, or federal. If help comes, that is great as it can support and augment your efforts. If not, then you are better off providing some level of response yourself. Many of the petro-chemical plants have in-house fi re brigades so as not to be solely dependent on outside help, for example.
My mother has always said that out of every bad situation there inevitably comes some good. Often, as I grew up, I doubted that statement. But over the years, I have learned that she was right. It is too soon to see what good may come from the Katrina events, but I am certain that there will ultimately be some good.
If nothing else, I will now see the accounts that I service from a different perspective with regard to emergency planning and response, and hopefully be in a better position to provide more comprehensive assistance. ■
Lessons from KatrinaContinued from page 15