Embed Size (px)
Citation preview

BioOne sees sustainable scholarly publishing as an inherently collaborative enterprise connecting authors, nonprofit publishers, academic institutions, research libraries,and research funders in the common goal of maximizing access to critical research.
Flooding Patterns of the Okavango Wetland in Botswana between 1972 and 2000Author(s): Jenny M. McCarthy, Thomas Gumbricht, Terence McCarthy, Philip Frost, Konrad Wessels, and FrankSeidelSource: AMBIO: A Journal of the Human Environment, 32(7):453-457. 2003.Published By: Royal Swedish Academy of SciencesDOI: http://dx.doi.org/10.1579/0044-7447-32.7.453URL: http://www.bioone.org/doi/full/10.1579/0044-7447-32.7.453
BioOne (www.bioone.org) is a nonprofit, online aggregation of core research in the biological, ecological, andenvironmental sciences. BioOne provides a sustainable online platform for over 170 journals and books published bynonprofit societies, associations, museums, institutions, and presses.
Your use of this PDF, the BioOne Web site, and all posted and associated content indicates your acceptance of BioOne’sTerms of Use, available at www.bioone.org/page/terms_of_use.
Usage of BioOne content is strictly limited to personal, educational, and non-commercial use. Commercial inquiries orrights and permissions requests should be directed to the individual publisher as copyright holder.
INTRODUCTION
The Okavango Delta in northern Botswana (Fig. 1) is one ofthe world’s largest inland deltas and is situated on an alluvialfan nearly 40 000 km2 in size. The Delta consists of swamps,islands and river channels in a shifting mosaic. The wetland is fedby local summer rains (~6 x 10⁹m3 yr-1), and is flooded annuallywhen the floodwaters from the Angolan highlands arrive with theOkavango River between February and May (~9 x 10⁹ m3 yr-1)(1).The flood reaches the lower parts of the Delta 3 to 4 months afterthe peak in the Delta entry channel – the Panhandle (Fig. 1).The period of maximum inundation isnormally in winter (May – September),gradually decreasing to a low in summer(November – March). The wetland canhence be divided into a permanentand a seasonal swamp. Only a smallfraction of the flow is discharged fromthe wetland to the Boteti River, asabout 97% of the incoming water islost by evapotranspiration (2).
The catchment of the OkavangoRiver is shared by Angola, Namibia andBotswana, and in periods of drought thefreshwater of the river and wetlandbecomes a valuable potential watersource in the dry Kalahari environment.Fears of a possible future conflict overthe water have fuelled research with thegoal of describing and predicting waterflow. However, hydrological modelshave only been developed for predictingthe outflow in the Boteti River, and havenot focused on seasonal flooding andspatial patterns, which are ecologicallyfar more important (2). Estimates ofhistorical flooding are a prerequisite forpredictive modelling of the hydrologicaleffects of both natural and man-made
changes in the catchment and climate. The aim of this study hasbeen to quantify flooded area and flooding patterns over thelast 30 years using available remotely sensed data. The use ofsatellite images is essential as the wetland is largely inaccessibleon the ground.
The annual variation in water recharge to the Okavango Deltais high, and the extent of flooding and the spatial advancementof the flood wave are poorly understood. Inter-annual variationshave also been observed, with a general decline of rechargesince 1980 (3). Over the past 2 centuries historical records revealthat the channel distribution on the Delta has changed (4, 5) andthat the flooded area has shifted. These changes are believed tobe induced by external climate changes and El Niño/SouthernOscillation (ENSO) effects, and by internal factors includingsedimentation, channel blockage and avulsion (4).
The quoted size of the Okavango wetland differs betweensources, ranging from 3000 to 16 000 km2 (6-12). Examples ofthe use of satellite images for inundation area analysis exist forOkavango, but only for limited time periods or in global datasets (2, 11, 12). Multitemporal studies describing the spatialchanges in the flooding over a longer period of time, utilizingthe full range of available satellite data, have not previouslybeen conducted.
In this study, more than 3000 satellite images, mainly fromthe NOAA AVHRR sensors, supplemented with Landsat data,were employed to gain knowledge of the recent flooding patternsin Okavango, showing the seasonal and inter-annual changes inwetland size and distribution for the period 1972 to 2000.
453
Report Jenny M. McCarthy, Thomas Gumbricht, Terence McCarthy, Philip Frost, Konrad Wessels and Frank Seidel
Flooding Patterns of the Okavango Wetland inBotswana between 1972 and 2000
Ambio Vol. 32 No 7, Nov. 2003 © Royal Swedish Academy of Sciences 2003http://www.ambio.kva.se
The inundated area of the Okavango Delta changesannually and interannually. The variability relates to regionalprecipitation over the catchment area in the Angolanhighlands, and to local rainfall. The patterns of the wetlandwere captured using more than 3000 satellite images forthe period 1972 to 2000, near daily NOAA AVHRR datafor 1985-2000, and less frequent images of the Landsatsensors from 1972 onwards. One AVHRR image forevery 10-day period was classified into land and waterusing an unsupervised classification method. Evaluationagainst Landsat TM and ERS2-ATSR data indicate anagreement of 89% for the size of estimated inundationarea. Results show that the wetland area has variedbetween approximately 2450 km2 and 11 400 km2 duringthe last 30 years.
Figure 1. The Okavango Delta in Botswana, with selecteddigitized rivers projected on a Landsat TM mosaic image.The coordinates are given in kilometers.
Artikel4 03-10-24 12.11 Sida 453
© Royal Swedish Academy of Sciences 2003http://www.ambio.kva.se
Ambio Vol. 32 No 7, Nov. 2003
MATERIAL AND METHODS
Satellite Data
NOAA Advanced Very High Resolution Radiometer(AVHRR) satellite images were the main data sourcefor estimating inundation. Nearly 3000 images wereavailable for the period 1985 to 2000 (Table 1).Standard geometric corrections were applied using bothorbital and Ground Control Point (GCP) information.Radiometric corrections on the visible and near-infraredchannels were made using the post-launch calibrationformulae presented by Rao and Chen (13), derived bycalculation of top-of-the-atmosphere albedo for a 10-yearperiod at stable calibration sites. The method is based onthe regression relationship between the slope of thealbedo for each channel and the elapsed time in orbit,expressed in days after launch. A subset of images (one image per10-day period, in total 381 out of 2951 images) was selected froman automated cloud detection algorithm. Clouds were maskedout in the AVHRR data using thresholds in channels 2 (0.9 �m)and 4 (11 �m) and a distance function from the identifiedclouds was applied to decrease cloud shadow contamination.Hence, pixels falling within 2.5 km from an identified cloudwere eliminated. Images near the center of the swath width wereideally selected to minimize geometric observation effects;however, in the rainy summer months the occurrence of cloudsdetermined the image selection. The selected scenes weremanually georeferenced in east-west, north-south directions.The data were projected to Universal Transverse Mercator(UTM) S 34, using the Cape datum (Central meridian: 21; Scalefactor: 0.9996; False Easting: 500 000; False Northing: 10 000000) in 1-km resolution. Landsat Multispectral Scanner(MSS) and Thematic Mapper (TM) data in 500 m resolution,projected to the same coordinate system, were used for datesearlier than 1985. ERS-2 Along Track Scanning Radiometer(ATSR) and Landsat TM and Enhanced TM (ETM) scenes wereused for calibration and evaluation of classification accuracy.
Water Identification
Deep waterbodies with a free surface are comparatively easy todetect in satellite data, whereas shallow wetlands covered withvegetation are more difficult to classify as the signal then includesconstituents other than water. Various methods are commonlyused for classifying wetlands, such as thresholding and ratioingbetween channels, or supervised and unsupervised classifications(14). Supervised classification uses area statistics based onsample training to classify an image, whereas unsupervisedclassifications involve algorithms that examine a large number of
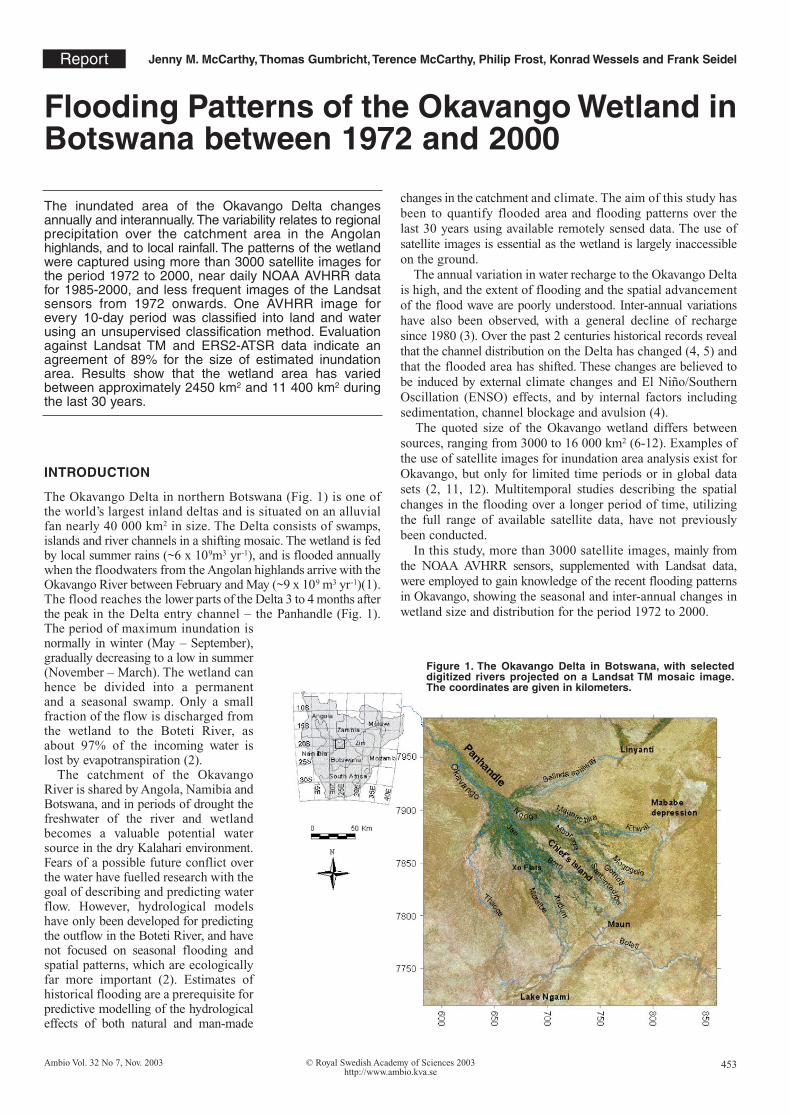
unknown pixels and divide them into a number of classes basedon natural groupings (15). In this study, an automated routine forsupervised maximum likelihood classification was initially tested,using a set of training areas representing known permanentlyflooded and dry areas in the images. Initial cloud detectiondetermined which training areas to use for each scene. Due togeometric inaccuracies, radiometric problems related to theuse of different sensors, and remains of cloud shadows andother atmospheric disturbances, the supervised classificationmethod had to be rejected. A ratioing and thresholding formulaincluding all channels (NOAA AVHRR) was also tested forthe classification, but due to the radiometric problems allimages needed manual calibration of the formula. In the end,unsupervised classification in 15-30 classes was used fordistinguishing between land and water (Fig. 2). The 381AVHRR scenes selected from the cloud algorithm were classified,using all channels. Extending back in time, Landsat data priorto 1985 and for the year 1986 were used for estimating floodingindependently for 8 months (November 1972, May-June 1979,May-August 1984, November 1986). The Okavango Deltacovers 4 Landsat scenes, and for each of these dates at least 3Landsat scenes were available. If needed, the data gap (i.e. the4th quadrant) was filled by dates with similar flooding patternsto the other 3.
Calibration of the thresholds specifying the water classesfrom the unsupervised classification, and of weighting of filter-ing, was set by using Landsat and ATSR scenes for comparison.10 Landsat MSS/TM images spanning February to September(1985-1988) were used, and 12 ATSR images spanning March toNovember (2000). For ATSR data, water was extracted usingunsupervised classification, while the water classification of theLandsat scenes was done from manually identified training areasas supervised classification. For the unsupervised classifications
454
Table 1. Satellite data used in the inundation study.
No. of scenes
381 (selectedfrom 2951)
28
44
34
18
Sensor
NOAA AVHRR(9, 11, 14)
ERS-2 ATSR
Landsat MSS
Landsat TM
Landsat ETM
Acquisition years / periods/ dates
1985 – 1988, 1990 – 2000
Aug. – Dec. 1999, Mar. – Nov. 2000
1972, 1979, 1984, 1985
1984, 1985, 1987, 1988, 1994, 1995
1999, 2000
Figure 2. Classification steps a) original AVHRR scene (rgb 1,2,3) (date 25 August 1998);b) unsupervised classification in 10 classes; and c) water – land classification.
Artikel4 03-10-24 12.11 Sida 454
Ambio Vol. 32 No 7, Nov. 2003 © Royal Swedish Academy of Sciences 2003http://www.ambio.kva.se
the water area was always maximized until pixels also outsidethe Okavango wetland entered the inundation class – this lastclass was then omitted. Most of the calibration scenes cover onlypart of the Okavango. Hence, the calibration only used visualinspection of the coherence between the AVHRR classificationand the reference (ATSR/Landsat) classification.
A 3-dimensional contextual and weighted filter, using thepreceding and following 10-day images as the third dimension,smoothed the water classification. Pixel locations with cloudswere handled by seeking the closest cloud-free image for thatpixel. A maximum limit was set at 30 days, with back and forthsearching for the closest image with data. If no cloud-freeimage was available within +/- 1 month, the average floodingsituation for that particular date (i.e. month) was used todetermine flooding status. At those locations inundated morethan 95% of cloud-free time, the cloudy pixels were directlytranslated as water. This approach could not be evaluated dueto lack of reference data for the cloudy summer months.
Scattered rain puddles were present in the images from therainy season. As the main focus was on the flood, small (< 3km2) temporary rain pools were eliminated by comparing thescattered water pixels with filtered images from preceding andfollowing dates. If the pools did not last longer than 1 month
they were classified as land pixels. The use of filtered imageswas necessary to compensate for the effects of geopositionmismatch.
The classifications were evaluated against 6 Landsat and 6ATSR scenes (Table 2) for single occasions corresponding to theAVHRR dates. The Landsat and ATSR classifications wereregarded as “true” inundation data in the evaluation, asimplification made due to the high spatial resolution ofLandsat and high radiometric quality of ATSR. Total andcoinciding areas of inundation between the estimated floodswere calculated.
Apparent problems with the classification of the anomalouslylarge 2000 spring-flood (after heavy local rains) were solved byincluding 7 ATSR calibration scenes in the classification (dates8 March 2000 -– 20 May 2000). As Landsat data were availablefor evaluation of the same period (Table 2) the inclusion ofcalibration data to the model data could be justified.
In a final step, after evaluation, the 10-day images weretranslated to represent monthly flooding. Each image was filteredby a mean filter with double weight for the central pixel, tofurther generalize the flooding pattern. Individual images andfiltered versions of those images, representing a particularmonth, were then averaged.
455
Table 2. Accuracy evaluation results derived from cross tabulation of classification and reference data.
AVHRR(km2)
7387(4891)(2539)
633279368518
722670426562
(6532)(5804)(5377)
Date
5 July 19944 Dec. 199415 Feb. 19957 Oct. 19997 Apr. 20008 Sept. 2000
25 Aug. 19993 Sept. 199919 Sept. 199928 Sept. 19997 Oct. 199916 Dec. 1999
Date
7 Jul. / 1 Aug. 19947 Dec. / 14 Dec. 199416 Feb. 199510 Oct. / 2 Nov. 19993 Apr. / 10 Apr. 20001 Sept. / 10 Sept. / 2 Nov. 2000
30 Aug. 1999 (8 Sept. 1999)2 Sept. 1999 (8 Sept. 1999)18 Sept. / 21 Sept. 199924 Sept. 19994 Oct. 199916 Dec. 1999
ReferenceLandsat (km2)
7126(4926)(3785)
632679588192
Reference ATSR (km2)
690269925675
(6034)(4706)(4026)
AVHRR correct(%)
86%78% (only part of image)81% (only part of image)84%85%87%
87%89%79%85% (only part of image)73% (only part of image)63% (partly cloudy)
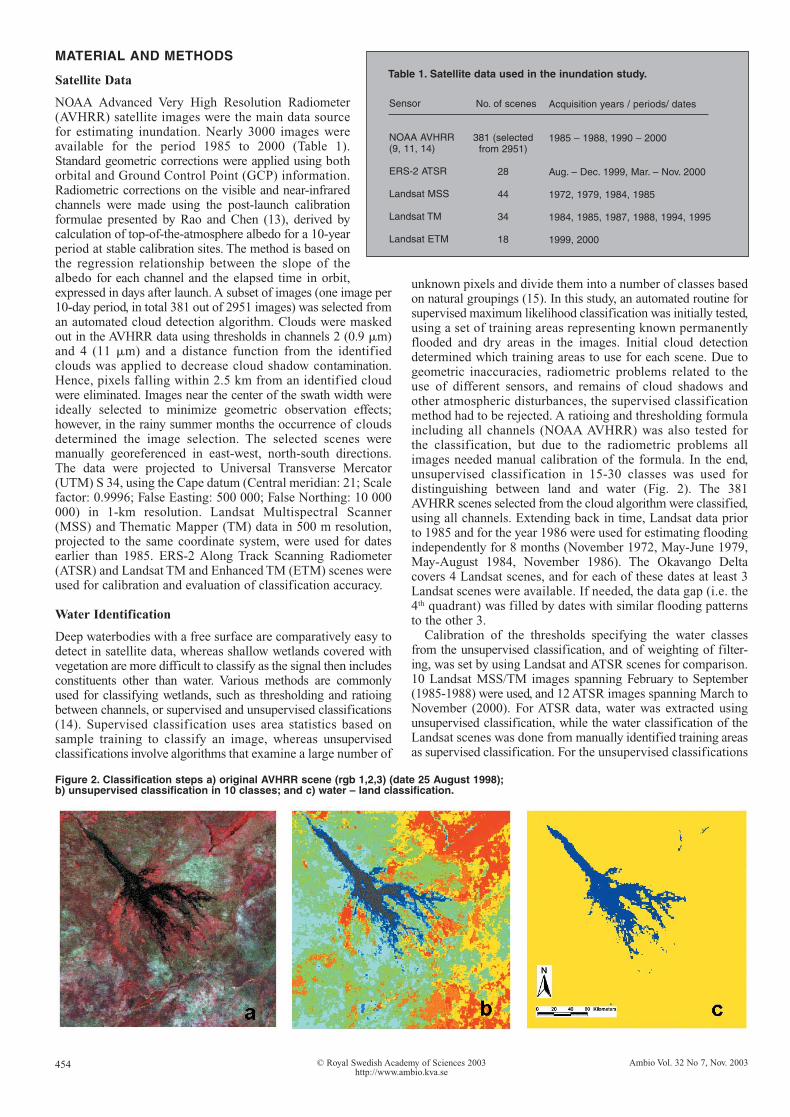
Figure 3. Monthly area of inundation for the years between 1985 and 2000 (in km2), classified from NOAA AVHRRsatellite images. The zero-values indicate gaps in the data series. Note the breaks in the x-axis before 1984.
Artikel4 03-10-24 12.11 Sida 455
© Royal Swedish Academy of Sciences 2003http://www.ambio.kva.se
Ambio Vol. 32 No 7, Nov. 2003
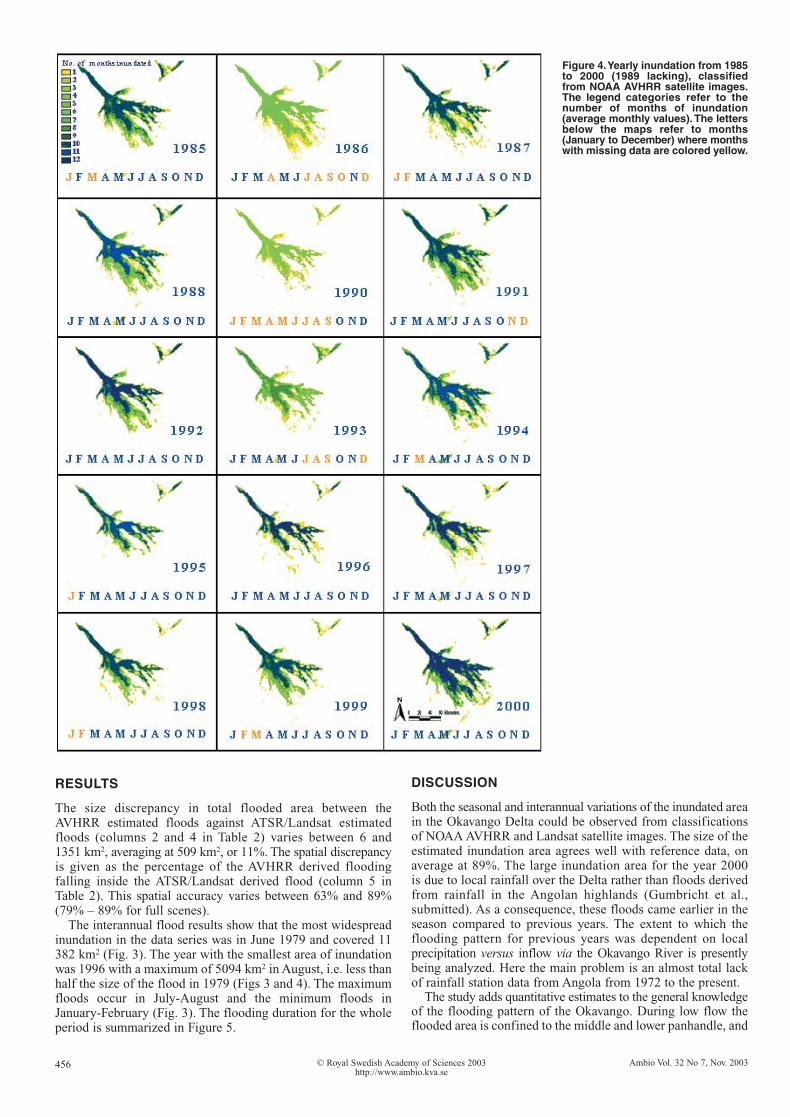
RESULTS
The size discrepancy in total flooded area between theAVHRR estimated floods against ATSR/Landsat estimatedfloods (columns 2 and 4 in Table 2) varies between 6 and1351 km2, averaging at 509 km2, or 11%. The spatial discrepancyis given as the percentage of the AVHRR derived floodingfalling inside the ATSR/Landsat derived flood (column 5 inTable 2). This spatial accuracy varies between 63% and 89%(79% – 89% for full scenes).
The interannual flood results show that the most widespreadinundation in the data series was in June 1979 and covered 11382 km2 (Fig. 3). The year with the smallest area of inundationwas 1996 with a maximum of 5094 km2 in August, i.e. less thanhalf the size of the flood in 1979 (Figs 3 and 4). The maximumfloods occur in July-August and the minimum floods inJanuary-February (Fig. 3). The flooding duration for the wholeperiod is summarized in Figure 5.
DISCUSSION
Both the seasonal and interannual variations of the inundated areain the Okavango Delta could be observed from classificationsof NOAA AVHRR and Landsat satellite images. The size of theestimated inundation area agrees well with reference data, onaverage at 89%. The large inundation area for the year 2000is due to local rainfall over the Delta rather than floods derivedfrom rainfall in the Angolan highlands (Gumbricht et al.,submitted). As a consequence, these floods came earlier in theseason compared to previous years. The extent to which theflooding pattern for previous years was dependent on localprecipitation versus inflow via the Okavango River is presentlybeing analyzed. Here the main problem is an almost total lackof rainfall station data from Angola from 1972 to the present.
The study adds quantitative estimates to the general knowledgeof the flooding pattern of the Okavango. During low flow theflooded area is confined to the middle and lower panhandle, and
456
Figure 4.Yearly inundation from 1985to 2000 (1989 lacking), classifiedfrom NOAA AVHRR satellite images.The legend categories refer to thenumber of months of inundation(average monthly values). The lettersbelow the maps refer to months(January to December) where monthswith missing data are colored yellow.
Artikel4 03-10-24 12.11 Sida 456
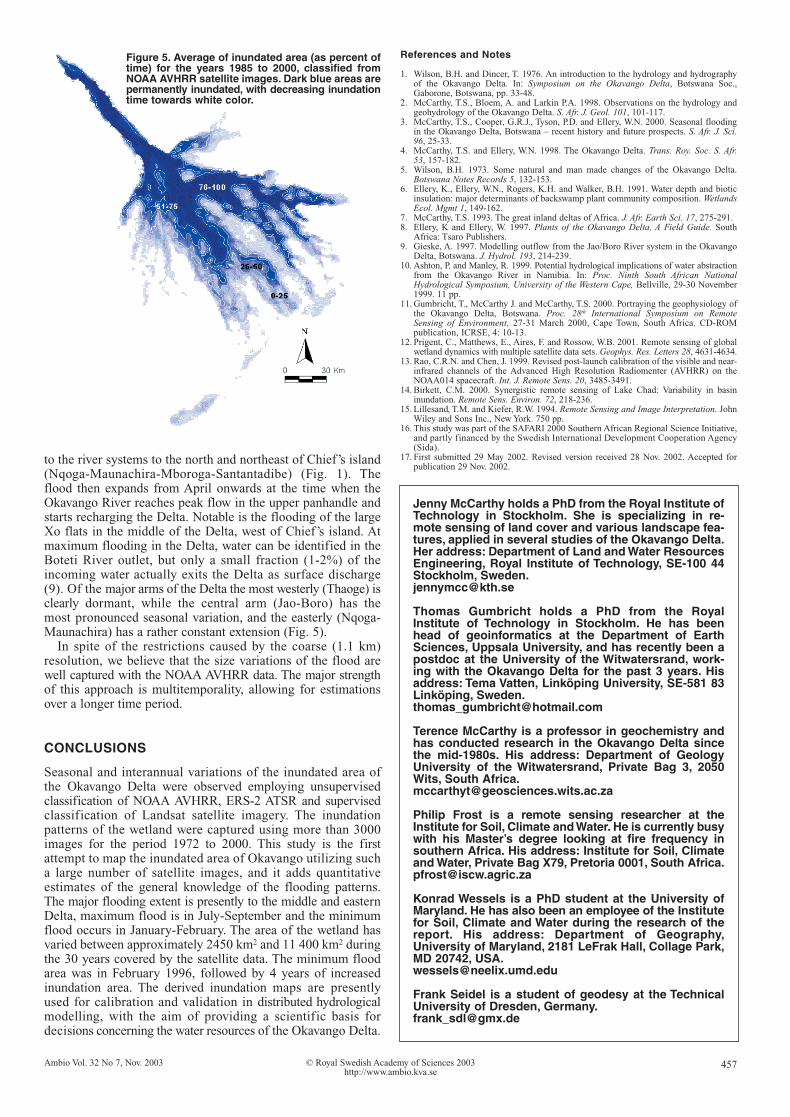
to the river systems to the north and northeast of Chief’s island(Nqoga-Maunachira-Mboroga-Santantadibe) (Fig. 1). Theflood then expands from April onwards at the time when theOkavango River reaches peak flow in the upper panhandle andstarts recharging the Delta. Notable is the flooding of the largeXo flats in the middle of the Delta, west of Chief’s island. Atmaximum flooding in the Delta, water can be identified in theBoteti River outlet, but only a small fraction (1-2%) of theincoming water actually exits the Delta as surface discharge(9). Of the major arms of the Delta the most westerly (Thaoge) isclearly dormant, while the central arm (Jao-Boro) has themost pronounced seasonal variation, and the easterly (Nqoga-Maunachira) has a rather constant extension (Fig. 5).
In spite of the restrictions caused by the coarse (1.1 km)resolution, we believe that the size variations of the flood arewell captured with the NOAA AVHRR data. The major strengthof this approach is multitemporality, allowing for estimationsover a longer time period.
CONCLUSIONS
Seasonal and interannual variations of the inundated area ofthe Okavango Delta were observed employing unsupervisedclassification of NOAA AVHRR, ERS-2 ATSR and supervisedclassification of Landsat satellite imagery. The inundationpatterns of the wetland were captured using more than 3000images for the period 1972 to 2000. This study is the firstattempt to map the inundated area of Okavango utilizing sucha large number of satellite images, and it adds quantitativeestimates of the general knowledge of the flooding patterns.The major flooding extent is presently to the middle and easternDelta, maximum flood is in July-September and the minimumflood occurs in January-February. The area of the wetland hasvaried between approximately 2450 km2 and 11 400 km2 duringthe 30 years covered by the satellite data. The minimum floodarea was in February 1996, followed by 4 years of increasedinundation area. The derived inundation maps are presentlyused for calibration and validation in distributed hydrologicalmodelling, with the aim of providing a scientific basis fordecisions concerning the water resources of the Okavango Delta.
References and Notes
1. Wilson, B.H. and Dincer, T. 1976. An introduction to the hydrology and hydrography of the Okavango Delta. In: Symposium on the Okavango Delta, Botswana Soc., Gaborone, Botswana, pp. 33-48.
2. McCarthy, T.S., Bloem, A. and Larkin P.A. 1998. Observations on the hydrology and geohydrology of the Okavango Delta. S. Afr. J. Geol. 101, 101-117.
3. McCarthy, T.S., Cooper, G.R.J., Tyson, P.D. and Ellery, W.N. 2000. Seasonal flooding in the Okavango Delta, Botswana – recent history and future prospects. S. Afr. J. Sci. 96, 25-33.
4. McCarthy, T.S. and Ellery, W.N. 1998. The Okavango Delta. Trans. Roy. Soc. S. Afr. 53, 157-182.
5. Wilson, B.H. 1973. Some natural and man made changes of the Okavango Delta. Botswana Notes Records 5, 132-153.
6. Ellery, K., Ellery, W.N., Rogers, K.H. and Walker, B.H. 1991. Water depth and biotic insulation: major determinants of backswamp plant community composition. Wetlands Ecol. Mgmt 1, 149-162.
7. McCarthy, T.S. 1993. The great inland deltas of Africa. J. Afr. Earth Sci. 17, 275-291.8. Ellery, K and Ellery, W. 1997. Plants of the Okavango Delta, A Field Guide. South
Africa: Tsaro Publishers.9. Gieske, A. 1997. Modelling outflow from the Jao/Boro River system in the Okavango
Delta, Botswana. J. Hydrol. 193, 214-239.10. Ashton, P. and Manley, R. 1999. Potential hydrological implications of water abstraction
from the Okavango River in Namibia. In: Proc. Ninth South African National Hydrological Symposium, University of the Western Cape, Bellville, 29-30 November 1999. 11 pp.
11. Gumbricht, T., McCarthy J. and McCarthy, T.S. 2000. Portraying the geophysiology of the Okavango Delta, Botswana. Proc. 28th International Symposium on Remote Sensing of Environment, 27-31 March 2000, Cape Town, South Africa. CD-ROM publication, ICRSE, 4: 10-13.
12. Prigent, C., Matthews, E., Aires, F. and Rossow, W.B. 2001. Remote sensing of global wetland dynamics with multiple satellite data sets. Geophys. Res. Letters 28, 4631-4634.
13. Rao, C.R.N. and Chen, J. 1999. Revised post-launch calibration of the visible and near-infrared channels of the Advanced High Resolution Radiomenter (AVHRR) on the NOAA014 spacecraft. Int. J. Remote Sens. 20, 3485-3491.
14. Birkett, C.M. 2000. Synergistic remote sensing of Lake Chad: Variability in basin inundation. Remote Sens. Environ. 72, 218-236.
15. Lillesand, T.M. and Kiefer, R.W. 1994. Remote Sensing and Image Interpretation. John Wiley and Sons Inc., New York. 750 pp.
16. This study was part of the SAFARI 2000 Southern African Regional Science Initiative, and partly financed by the Swedish International Development Cooperation Agency(Sida).
17. First submitted 29 May 2002. Revised version received 28 Nov. 2002. Accepted for publication 29 Nov. 2002.
457Ambio Vol. 32 No 7, Nov. 2003 © Royal Swedish Academy of Sciences 2003http://www.ambio.kva.se
Figure 5. Average of inundated area (as percent oftime) for the years 1985 to 2000, classified fromNOAA AVHRR satellite images. Dark blue areas arepermanently inundated, with decreasing inundationtime towards white color.
Jenny McCarthy holds a PhD from the Royal Institute ofTechnology in Stockholm. She is specializing in re-mote sensing of land cover and various landscape fea-tures, applied in several studies of the Okavango Delta.Her address: Department of Land and Water ResourcesEngineering, Royal Institute of Technology, SE-100 44Stockholm, [email protected]
Thomas Gumbricht holds a PhD from the RoyalInstitute of Technology in Stockholm. He has beenhead of geoinformatics at the Department of EarthSciences, Uppsala University, and has recently been apostdoc at the University of the Witwatersrand, work-ing with the Okavango Delta for the past 3 years. Hisaddress: Tema Vatten, Linköping University, SE-581 83Linköping, [email protected]
Terence McCarthy is a professor in geochemistry andhas conducted research in the Okavango Delta sincethe mid-1980s. His address: Department of GeologyUniversity of the Witwatersrand, Private Bag 3, 2050Wits, South [email protected]
Philip Frost is a remote sensing researcher at theInstitute for Soil, Climate and Water. He is currently busywith his Master’s degree looking at fire frequency insouthern Africa. His address: Institute for Soil, Climateand Water, Private Bag X79, Pretoria 0001, South [email protected]
Konrad Wessels is a PhD student at the University ofMaryland. He has also been an employee of the Institutefor Soil, Climate and Water during the research of thereport. His address: Department of Geography,University of Maryland, 2181 LeFrak Hall, Collage Park,MD 20742, [email protected]
Frank Seidel is a student of geodesy at the TechnicalUniversity of Dresden, [email protected]
Artikel4 03-10-24 12.11 Sida 457


![BOTSWANA WILD PARKS...Day 3 - 4 OKAVANGO DELTA [tented camp x2 BLD] We drive into the Okavango Delta to the launch station where we board our mekoro’s and pole to our tented camp](https://img.pdfslide.us/doc/110x75/6024111e889b9e642c2cc51c/botswana-wild-parks-day-3-4-okavango-delta-tented-camp-x2-bld-we-drive-into.jpg)