Embed Size (px)
Citation preview

1
Flood Risk Management, Mapping and Planning: The Institutional Politics of Decision-Support in England
James Porter Centre for Biomedicine & Society, Department of Sociology & Communications Brunel University. Kingston Lane, Uxbridge, Middlesex UB8 3PH. [email protected] David Demeritt King’s College London, Department of Geography, Strand, London, WC2R 2LS [email protected]
Abstract. Flood maps play an increasingly prominent role in government strategies for flood risk management. Maps are instruments not just for defining and communicating flood risks, but also for regulating them and for rationalizing the inevitable limits and failures of those controls. Drawing on policy document analysis, official statistics, and 66 key informant interviews, this paper explores the institutional conflicts over the use of the Environment Agency (EA) Flood Map to support decision-making by English Local Planning Authorities (LPAs), whose local political mandate, statutory obligations and professionalized planning culture put them at odds with the narrower bureaucratic imperative of the Agency to restrict developments at risk of flooding. The paper shows how the Flood Map was designed to standardize and script the planning process and ensure LPA decisions were aligned with EA views about avoiding development in zones at risk of flooding without actually banning such development outright. But technologies are also shaped by their users, and so the paper documents how planners accommodated and resisted this technology of indirect rule. Their concerns about sterilizing areas depicted as being at risk of flooding and about the difficulties of actually using the Flood Map for speedy and defensible development control decisions were crucial in its eventual replacement by a new decision-support technology, Strategic Flood Risk Assessments, which then led to the de-scripting of the Flood Map to influence a new set of users: the public. The paper closes with some wider reflections on the significance of the case for risk-based governance.
1. Introduction
Moving away from its traditional emphasis on flood defence the UK government has
increasingly embraced a broader portfolio of measures for managing the risks from
flooding (Butler & Pidgeon 2011; Johnson & Priest 2008; Scrase & Sheate 2005). The
basic idea is neatly encapsulated in the title of the government’s flood risk management
strategy for England: Making Space for Water (Defra 2004). In contrast to engineered
defences designed to keep water away, the new strategy seeks to make ‘space’ for
flooding, both literally and figuratively. Defra (2009 paras 60, 65) now publicly
acknowledges that “building ever higher and stronger defences is not sustainable” and
thus that “it may be necessary to let some places flood more frequently in future. It will

2
be important to understand the potential consequences and help communities to become
more resilient and adapt to changing levels of risk”.
Spatial planning is central to this new ‘risk-based’ approach to flooding. As White
and Richard (2007: 513) insist, planning is “the most sustainable method to manage flood
risk in that not only can it provide for risk management, it can also avoid or even reduce
risk [by] influenc[ing] factors such as the location, type, design, and function, of
development”. Despite such high hopes, questions about the effectiveness of planning
controls have been a persistent theme of various ex-post investigations and ‘lessons
learned’ reports into the management of flooding. As the non-departmental public body
with strategic responsibility for flood risk management in England and Wales, the
Environment Agency (EA) (e.g. 1999: 8) has sought to deflect criticism of its own
conduct by blaming the planning system for allowing inappropriate development and
insisting “our regulatory powers need strengthening” (EA 2003a: 12). However, planning
in England is a delegated responsibility of local government, which has historically
enjoyed broad discretion in formulating local development plans and licensing
applications for development within an overarching, national framework of principles
and performance targets set by central government (Cullingworth & Nadin 2006).
Planning professionals are generalists, and while official planning policy circulars
encouraged them to seek expert advice about flooding from the EA and its various
predecessors, there was no obligation on local planning authorities (LPAs) to heed that
advice.
Recent reforms have reduced that discretion and increased the influence of the EA
over LPA decision-making in England. In 2001 Planning Policy Guidance Note 25
(PPG25) made the EA a statutory consultee on applications for planning permission in
areas at risk of flooding and required LPAs to follow a sequence of risk-based decision
rules designed “to avoid such risk where possible” (DETR 2001: 1). Urged to “assert and

3
defend vigorously its advice” (Bye & Horner 1998: 9), the EA began monitoring LPA
compliance and to name and shame LPAs acting against its advice. In 2006, the EA was
given additional powers to ‘call in’ for review by the central Government local planning
applications granted contrary to its sustained objections.
To supplement these formal powers, the EA also produced a series of national
flood risk maps to “help local authority planners understand how flood risk may affect
and be affected by development proposals” (EA 2010: 3). These maps depict the
probability of flooding, using different colors to mark out zones exposed to different
levels of risk from fluvial and tidal flooding. The first such map, the Indicative Flood
Map (IFM) (see Figure 1), was published in 1999 and was essentially binary, indicating a
safe zone and areas exposed to a risk from river flood events with a 1% annual
probability or from coastal flooding events with a 0.5% annual probability. In 2004, the
IFM was replaced by a new Flood Zone Map (see Figure 1), which uses more up-to-date
and nationally consistent modeling to recalculate the 1% and 0.5% flood outlines of the
IFM, which are now designated as Flood Zone 3 of ‘high probability’. The current Flood
Map also outlines a second Zone 2 at medium risk of flooding from an extreme event
with a 1%-0.1% annual probability, and for this reason is sometimes called the Extreme
Flood Outline (EFO) map to distinguish it from the IFM.1 The residual area of ‘little or
no risk’ is termed Zone 1. These zones enable LPAs to fulfill the requirements first
introduced under PPG25 to apply a ‘Sequential Test’ so as to steer development into
zones at lower risk and preferably into Zone 1 with little or no risk at all.
[FIGURE 1 – The Environment Agency’s Flood Risk Maps]
1 We refer to these maps collectively as the ‘Flood Map’ and use the terms IFM and EFO to distinguish between separate editions of it, while reserving the lower case ‘flood maps’ to refer generically to the technology of flood risk mapping in general. .

4
Although promoted as “indicative only, to be used as a basis for consultation and
not as the sole basis for decisions on where planning policies apply” (DETR 2001: para
24), such decision-support tools should be understood as political artefects that “embody
specific forms of power and authority” (Winner 1986: 19). Critical cartographers, for
example, have emphasized that maps are shot through with relations of power, which
they reflect and reproduce (Crampton & Krygier 2006). Deconstructing maps as texts,
geographers have highlighted critical silences, such as the erasure of native peoples from
colonial maps, and traced the political programmes advanced through map projections of
places, objects, and spaces that are then reshaped, both symbolically and materially,
through the very process of their cartographic enframing (e.g. Demeritt 1997; 2001;
Wood 2010). Maps are ways of worldmaking, generative of new ways of seeing and
being, and critical cartographers have been particularly sensitive to the cultural politics of
representation and identity involved in maps and mapping. Looking beyond the case of
maps explored by geographers, sociologists of science have emphasized how
technological systems more generally embody various political and institutional desires
and plans. Early work in science and technology studies often understood the design of
technology to be socially shaped, but once stabilized to provide an unproblematic vehicle
for the transmission and reproduction of wider social visions within the body politic.
Thus Noble (1984) described the history of automation as a technology designed with
the express intention of deskilling and thereby disempowering semi-skilled mechanics
and industrial workers, while Winner (1986), has claimed that the master plans for the
New York Metropolitan area devised by Robert Moses incorporated low bridges on its
winding parkways so as to allow private motor vehicle access but discourage buses and
so keep the public beaches of Long Island reserved for ‘respectable’ middle class car
owners2. This somewhat determinist reading of technology has been surplanted by
2 Winner’s schematic account of the bridges to Jones Beach State Park on Long Island is an iconic one in

5
increasing emphasis on interpretative flexibility in both the construction and application
of technologies and a recognition that political designs are not automatically realized in
the development and use of technology Alongside that recognition of the contingency of
socio-technical development trajectories, however, another important strand of work in
science and technology studies looks to standardization in and through technology as a
central, if heretofore sometimes overlooked (cf. Lampland and Star 2009), motor of
modernity, helping to organize and regulate social and political life by ensuring
consistency and communicability across time and space (Timmermans & Epstein 2010).
Technical objects, like the flood maps, come to incorporate “scripts” (Akrich
1992), which configure their users by inviting them to perform particular identity
positions and practices built into their design. Users, in turn, often adapt those scripts to
their own contexts and purposes. Thus it is important to study technology in the
contexts of its application and to appreciate the trials of force, as users either submit or
subvert the standards of conduct inscribed for them by system designers. In the case of
decision support technologies, the aim is typically to make decision-making less arbitrary
and more rational by standardizing both the information considered by decision makers
and the protocols they use to reach their decisions. While the formalization of medical
decision-making has routinely been promoted as a way to transform clinical practice
from an art into an evidence-based science (Berg 1997), Porter (1995) highlights the
political implications of adhering to strict decision rules. By reducing the scope for
partiality and subjective bias, formal decision rules lend authority to administrative
decisions otherwise vulnerable to challenge: “A decision made by the numbers (or by
explicit rules of some other sort) has at least the appearance of being fair and
science and technology studies (STS). While Joerges (1999) is certainly right to complain that Winner oversimplifies a complicated history, the dismissal of Winner as a determinist and his account of Jones beach as an exaggerated ‘urban legend’ have become their own, kind of just-so stories in STS, which authorize the currently dominant, relational approach, while at the same time ignoring something of the larger truth about the discriminating automobility that, to this day, remains at the heart of Jones Beach Park, where the area devoted to private car parking dwarfs the recreational space itself.
6
impersonal... [and] is a way of making decisions without seeming to decide” (Porter 1995:
8).
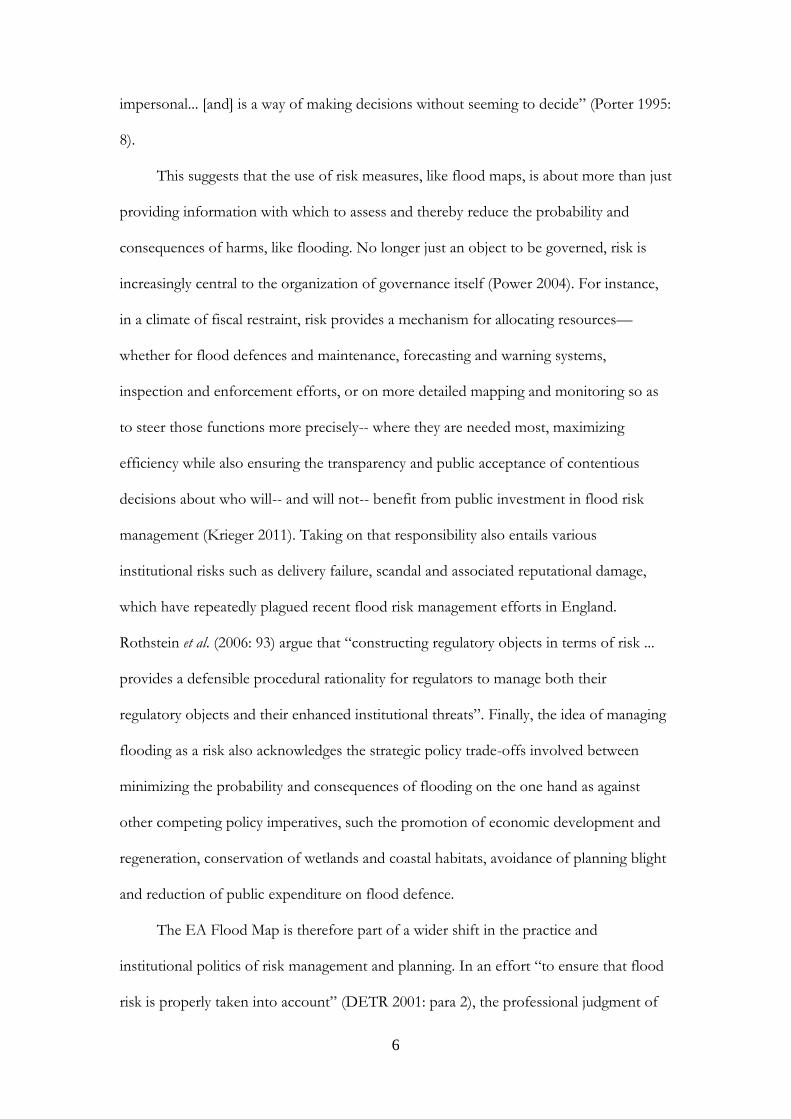
This suggests that the use of risk measures, like flood maps, is about more than just
providing information with which to assess and thereby reduce the probability and
consequences of harms, like flooding. No longer just an object to be governed, risk is
increasingly central to the organization of governance itself (Power 2004). For instance,
in a climate of fiscal restraint, risk provides a mechanism for allocating resources—
whether for flood defences and maintenance, forecasting and warning systems,
inspection and enforcement efforts, or on more detailed mapping and monitoring so as
to steer those functions more precisely-- where they are needed most, maximizing
efficiency while also ensuring the transparency and public acceptance of contentious
decisions about who will-- and will not-- benefit from public investment in flood risk
management (Krieger 2011). Taking on that responsibility also entails various
institutional risks such as delivery failure, scandal and associated reputational damage,
which have repeatedly plagued recent flood risk management efforts in England.
Rothstein et al. (2006: 93) argue that “constructing regulatory objects in terms of risk ...
provides a defensible procedural rationality for regulators to manage both their
regulatory objects and their enhanced institutional threats”. Finally, the idea of managing
flooding as a risk also acknowledges the strategic policy trade-offs involved between
minimizing the probability and consequences of flooding on the one hand as against
other competing policy imperatives, such the promotion of economic development and
regeneration, conservation of wetlands and coastal habitats, avoidance of planning blight
and reduction of public expenditure on flood defence.
The EA Flood Map is therefore part of a wider shift in the practice and
institutional politics of risk management and planning. In an effort “to ensure that flood
risk is properly taken into account” (DETR 2001: para 2), the professional judgment of

7
planners is being challenged by new decision-making procedures and by the increased
influence over them by the EA. As the lead agency responsible for flood risk
management, the priorities and institutional mandate of the EA are significantly narrower
than those of LPAs, whose elected officials answer to local voters and are responsible for
discharging a wide array of statutory responsibilities, including local economic
development, housing provision and sustainable communities. In this paper we explore
this clash of institutional priorities and professional cultures as it was expressed in the
trial of force over the use of the Flood Map in planning decision-making. After
describing our data and methods, we discuss the Flood Map and the ways in which it
sought to script planning practice and restrict development exposed to flooding. We then
consider the evidence from official statistics about the effectiveness of the Flood Map in
achieving those ends before turning to the accounts from planners to consider the ways
in which they accommodated and resisted the new risk-based approach to flood risk
management. The paper closes by tracing how the EA’s Flood Map has been superseded
by a new decision-support technology, Strategic Flood Risk Assessments, which in turn
have led to a redefinition of the Flood Map as tool for influencing a an entirely new
audience: the public.
2. Data & Methods
This paper is based on what Glaser and Strauss (1967) call a ‘source’ triangulation
between three broad types of primary data about the design and use of the Flood Map in
spatial planning. First, we collected and reviewed formal policy documents, such as
planning policy guidelines, policy consultation submissions, and Parliamentary Select
Committee testimony and evidence, pertaining to flood risk management, mapping, and
planning. As matters of public record, they set out the official grounds in which actors
publicly explain their actions to others, and we supplemented them by comparing them

8
against a second body of documentary material collected through Freedom of
Information Act requests.
To explore the ‘backstage’ experiences hinted at, but not necessarily revealed, in
those documents, our third data source came from 66 semi-structured interviews,
conducted between summer 2006 and early 2009, with EA staff involved in flood risk
management policy formulation and implementation (n=21), modelers and consultants
involved in the design and building of the Flood Map (n=24), and spatial planners
(n=21), from heads of departments, all the way down to case officers working in
development control and forward/strategic planning. From that wider set of interviews,
this paper draws, in particular, on those with planners. They were selected from a
purposeful sample of LPAs designed, first to capture those at greatest risk of flooding
and so having the most experience of working with the EA and its Flood Map, and
second to reflect the geographic spread across the 8 EA regions in England. Interviews
took place in participants’ offices, were audio-recorded (with consent), and transcribed.
A conversational approach was adopted using open-ended questions to encourage
people to reflect on their experiences using their own words (Hoggart et al. 2002).
Transcripts were coded and analyzed alongside other documentary material to identify
emerging themes and triangulate them against different sources.
3. The Flood Map and Its Script for Planning Practice
While there is a long history of mapping the high water marks from historic floods to
delineate areas at risk from flooding (Monmonier 1997), physically-based, spatially
distributed modeling and mapping first took off in the 1960s. In England the first
systematic efforts at flood mapping were initiated by the 1973 Water Act. Under its
Section 24(5), Regional Water Authorities were required to survey and map areas with
flooding problems, typically to justify agricultural land reclamation. Not surprisingly,

9
these maps had little influence on spatial planning (Scrase & Sheate 2005). Providing
better information to control development around flooding ‘hotspots’ was the explicit
aim of the maps called for by Section 105(2) of the 1991 Water Resources Act, but they
were patchy in their coverage, inconsistent in their methods, and late in their delivery
(Bye & Horner 1998: 43), so that in the aftermath of the Easter 1998 floods, the EA was
severely criticized.
Among the numerous recommendations emerging from the public inquiries into
the Easter 1998 floods was the need for tighter controls over “future development in
flood plain land” (House of Commons 1998: para 89; cf. Bye & Horner 1998: 5). The
EA was also keen “to have its influence over the location and design of new
development strengthened” (EA 2001: 32), not least because of the added pressure it
placed on its flood defence budgets. However the EA lacked the political mandate for
overruling democratically elected LPAs, and there was discomfort within the EA with
suggestions about it, as “a non-departmental public body having a right of veto over
elected councils over where development should happen” (House of Commons 1998:
question 81).
Rather than outright veto powers, the EA favored strengthening the general
presumption against development. This was endorsed by the influential House of
Commons report, which also urged the EA to make “the production of flood warning
hazard maps and their delivery to local authorities” its “highest priority” (1998: para 112).
In response, the Government Minister for Housing and Planning explained that the
“content of the guidance [in PPG 25] has been strengthened” (House of Commons 2000
para 133), but rejected “a moratorium on any building in flood plains... [which would]
essentially be consigning our whole brownfield strategy to the dustbin” (para 120). He
also called for the EA to “ensure that there is improved information… including flood
plain maps and other advice … for planning decisions” (para 137).

10
The EA Flood Map was thus born of a desire to restrict development exposed to
flooding, but to do so indirectly by “influencing and managing the activities of third
parties”, in particular the decision-making of LPAs responsible for granting development
permission, rather than through any outright prohibition (EA 1998: para 5.3.2). Political
theorists associate this regulatory preference for risk communication and suasion over
more direct policy instruments of command-and-control as the hallmark of deeper shifts
in the nature of governance. Some invoke the idea of an emergent ‘regulatory state’ and a
shift away from the centralized exercise of police power and direct provision of social
security to an enabling function exercised through various arms-length agencies and
indirect forms of regulatory control, such as audit, performance targets and codified
standards of practice (e.g. Majone 1997; Moran 2003). Others look to the
governmentality of an ‘advanced liberalism’ in which power increasingly operates beyond
the state and at a distance by inculcating new rationalities of rule and self-regulation
(Rose & Miller 1992). These rather synoptic accounts can be fleshed out by drawing on
the sociology of science and technology to show how regulation was enacted through the
Flood Map and its visualization of flooding as a calculable risk. In particular the concept
of a technological ‘script’ highlights how, like the script of a film, the design of “technical
objects define[s] a framework of action together with actors and the space in which they
are supposed to act” (Akrich 1992: 208).
In designing its Flood Map, the EA was keen to address the ignorance, wilful or
otherwise, of LPAs about the management of flood risks for which it was responsible.
Complaining of “numerous examples of developments… allowed against the advice of
the Agency and its predecessors” (House of Commons 1998: para 86), EA officials saw
the map as another way in which it was “continuing to seek to influence and educate
those [LPAs] least willing to recognise the problems created by development in flood risk
areas” (EA 1998: 5.3.6). An official Flood Map would concretize the EA’s knowledge of

11
flood risk and make it both easier for LPAs to access and, at the same time, harder for
them to ignore.
That desire to “ensure that local planning authorities (LPAs) consult us and take
our advice in the planning process” informed the way flood risk was visualized in the
Flood Map (EA 2003: 12). The map depicted risks from tidal flooding from the sea and
from fluvial flooding from main rivers, but not those “from localized sources, such as
reservoir, storm drain failures, or runoff from fields or urban areas” (Brown & Damery
2002: 415), which are both more difficult to model in a robust and nationally consistent
way and are also not the sole responsibility of the EA to manage. The full significance of
those omissions would not become apparent until the extensive surface water flooding in
2007 led the Pitt (2008) Review to call for improvements in the modeling and mapping
of such risks.
At 1:10,000 the scale of the Flood Map provided to LPAs is deliberately coarse
and sufficient only to identify general zones of risk rather than to determine whether
individual properties are at risk.3 This choice of scale was partly driven by technical
limitations imposed by the budget and timescale for delivering the Flood Map
(Anonymized research 2010)—the greater the spatial resolution, the greater the demands in
terms of data, computational power and other resources required to resolve the
additional, small scale processes involved in locally detailed flood inundation modelling.
Omitting such local details closed off a line of technical criticism about the adequacy of
their representation in the model (Lane et al. 2011). The coarse scale of the Flood Map
also served to script the behaviour of its users. Without being able to resolve individual
properties, LPAs would be compelled first to require developers to commission
additional, more detailed flood risk assessments, and second to contact the EA for
further technical advice. The choice of scale also indemnified the EA against liability for
3 At 1:20,000 the Flood Maps displayed on the publicly accessible website is even less detailed.

12
providing a property-level risk assessment and against complaints about the effects of its
Flood Map on property values or access to insurance (Priest et al. 2008).
Another important feature of the Flood Map is its treatment of flood defences.
The initial IFM did not show any flood defences at all so as to amplify the perception of
risk and encourage consultation. As Geoff Mance, Director of Water Management at the
EA explained:
At this stage we have deliberately not shown whether there is a defence in
place. We wanted people to ask questions and to find out. The first thing is
to flag up whether somewhere is a risk area and then they can take an
interest and seek further information (House of Commons 2000: question
82).
Areas benefiting from flood defences were shown on the revised and reissued EFO, but
its Flood Zone delineations were still based on the assumption of a natural flood outline
unimpeded by defences.
There were several institutional considerations behind their exclusion from the
EA Flood Map. First, as the agency responsible for flood defence, the EA has a major
interest communicating the residual risk from those defences being overtopped or
otherwise failing in the face of extreme events beyond the design standard to which they
were built. In this context, the National Audit Office explained that “defended areas
were purposely excluded [from the map] in order not to give the public a false sense of
security… that flood defences can remove entirely the risk that flooding will occur”
(NAO 2001, para. 2.11). Communicating those residual risks is one strategy for the EA
to manage public expectations about its own performance and the institutional risk of
blame in the event of flooding. This use of risk, as Krieger (2011: 142-42) explains,
“offers a justification for failures to protect… while providing evidence that the EA has
discharged its flood management responsibilities competently.”
13
Second, communicating residual risk is also important for behavior modification
and avoiding what Gilbert White (1942) famously termed “the levee effect” whereby the
construction of levees lulls residents into a false sense of security, encourages more
intensive and less resilient uses of vulnerable flood plains, and leads, ultimately, to much
higher losses when defences are overtopped and flooding occurs. Wider public failures to
appreciate the residual risk of flooding pose a particular problem for the EA because of
the way that flood defence funding is allocated in England. If the presence of protection
structures is allowed to spur new development, the resulting increases in exposure to
flood risk will, in turn, attract additional resources for flood defences by driving up the
benefit/cost ratios used for their allocation in a steady ‘escalator-like’ increase in risk
exposure and resulting flood defence spending (Scrase & Sheate 2005). EA officials were
acutely conscious of the moral hazard involved in the diversion of their scarce public
funding to protect inappropriate private development sanctioned by LPAs not
responsible for the cost of defending them. By amplifying perception of residual risk, the
EA was determined to shift institutional responsibility on to LPAs for preventing in
appropriate developments in the first place rather than having to bear the cost of
defending them later on.
Lastly, in interviews EA officials also acknowledged how mapping the outline for
undefended flood risks tends to increase the spatial extent of predicted flood outlines
and therein the scope of the EA’s authority over planning. They presumed that the map
would be used as an automatic screening-tool, “the beginning of the chain” for
everything planners do (Senior Flood Risk Policy Manager 1). With the Flood Map
uploaded onto the internal GIS system of every LPA, planners would see whether an
application falls within a flood zone and when EA advice is required to inform decision-
making. It would no longer be “‘hit or miss’ whether we were consulted on planning
applications” (Senior Flood Risk Policy Manager 5).

14
While the formal aim of the map may simply have been to “increase awareness
among the public, local authorities and other organisations of the likelihood of flooding”
(EA 2009b), EA officials imagined its role in decision-making to go well beyond mere
information provision. As Senior Flood Risk Policy Manager 1 at the EA put it:
[the map] is a way for us to say: don’t develop in areas at-risk of flooding.
Don’t even plan to. Don’t even think about trying to develop here and then
trying to get us to build defences. If they see its at-risk: don’t build there!
Rather than just guiding decision making, the intention was that planners’ decision-
making should be determined by the Flood Map. To reinforce the authority of that
advice, the EA began to monitor LPA compliance in its HLT reports and to name and
shame those LPAs ignoring its script for planning.
As an ‘obligatory passage point’ through which all planning decisions would be
filtered (Callon 1986), the Flood Map was supposed to ensure more rational, reliable and
responsible planning approaches to managing flood risk. The map was designed not
simply to raise planners’ awareness of flood risks—“to make planners stop and think” as
one EA official put it (Senior Flood Risk Policy Manager 5)-- but to discipline them into
behaving in certain prescribed ways: by identifying areas at risk from flooding, soliciting
expert advice from the EA about development applications in those at risk areas, and
then refusing them permission in line with EA advice. Standardizing the cartographic
visualization of flood risk, then, creates standards to be upheld by those using the map
for decision-support. This new script restricts the scope for discretion about whether an
area is at risk or what actions should follow from that expert designation.
4. Impacts on Planning Outcomes in England
Official statistics provide two measures of the influence the EA on planning outcomes in
England. First, the Land Use series can be used to estimate the percentage of new

15
dwellings built each year in high flood risk areas (Figures 2-3). While there are no clear
trends at the Government Office Region scale, either within regions or after major policy
changes, such as the introduction of the IFM in 2000 or the new planning policy
statement on flood risk (PPS25) in 2006, at the national scale, there has been a slow but
steady increase the percentage of new housing built in areas of high flood risk has slowly
increased from 7-8% in the late 1980s to 9-11% in 2008-10. While this might suggest a
lack of EA influence, it is important to recognize that government policy has strongly
favored the redevelopment of brownfield land, much of which lies in areas at risk of
flooding. With the percentage of new dwellings on brownfield increasing from just over
51% in 1989 to 78% in 2009 (Figure 3), it might be argued that just a 1-2% increase over
the same period in the proportion of new homes built in areas at high risk of flooding
represents a success for the EA and its script for planning.
[FIGURE 2 - Percentage of New Dwellings in England Built within Areas of High Risk,
by Region, 1989-2010]
[FIGURE 3 - Percentage of New Dwellingsin England Built on Previously Used,
‘Brownfield’ Lands 1989-2010].
A second, more direct measure of EA influence comes from its annual High
Level Target (HLT) 5 reports. The most recently published HLT report claims that for
“the third year running ... over 96% of [planning] outcomes have been in line with our
advice” and concludes that “we are influential advisors to the planning system” (EA
2009a: 5)
[TABLE 1 – LPA Planning Applications Considered by the Environment Agency, 2000-
16
2009]
Closer examination of the data suggests a more complex picture. There have
been steady year-on-year reductions in the proportion of applications that LPAs are
known to have approved against sustained EA objections, from nearly 40% in 2001/02,
the first year after the introduction of the Flood Map and PPG 25, to just under 9% in
2008/09. At the same time the frequency of EA objections on flood risk has increased,
as the “national roll-out of the Environment Agency’s ‘Standing Advice’” on minor
applications and its “increasing uptake by LPAs” (EA 2009a: 13) has enabled it to focus
its scrutiny on larger, more consequential developments. But in constructing its headline
figure of 96% compliance with its advice, the EA is engaging in statistical sleight of hand,
by the dividing the number of applications known to have been permitted by LPAs
contrary to EA advice (row 6 in Table 1) by the total number of cases to which the EA
objected (row 2 Table 1). This conveniently overlooks the “disappointing” number of
cases in which LPAs fail to “inform us of the final outcome of our objections” (EA
2009a: 41), despite the specific requirement to do so.
These statistics reinforce claims about an ongoing implementation gap between
high-level flood risk strategies and LPA practice. White and Richards (2007) found an
uneven pattern of uptake of national flood guidance in local development plans, while
Wynn’s (2005) survey of English LPAs found that nearly three quarters of LPAs were
prepared to accept an application for development in Flood Zones 2 and 3 without the
required FRA. This administrative failing remains the leading cause of EA objections on
flood risk grounds, and its frustration is palpable:
It is a matter of concern that 7 years after the publication of PPG25 a very
large proportion of consultations are still being submitted to the

17
Environment Agency without a satisfactory FRA as required by PPG/PPS25
(EA 2009a: 20)
While most LPA decisions seem to be in line with EA advice and the percentage of
decisions taken contrary to EA advice has steadily fallen, it remains much higher than the
headline figure reported by the EA, and in addition to 8.8% of applications known to
have been permitted in the face of specific objections from the EA on flood grounds in
2008/9, a further 9.4% of applications to which the EA objected were refused by the
LPA, but not on the grounds of flood risk, which implies that LPAs did not regard flood
risk and EA advice about it as “sufficient grounds for refusal” (Richards et al 2008: 13).
5. Responses to the EA and Its Flood Map
Technology is generative, and its effects are not entirely determined by the scripts built
into it by system designers. Users and their contexts of application play an important role
in shaping how the capacities of technical objects are ultimately realized. Whereas the EA
hoped its Flood Map would prevent development in areas at risk of flooding, planners
resented EA interference with their professional autonomy, and their responses to the
Flood Map reflected deeper institutional tensions between the EA and LPAs.
While acknowledging the risks it poses and often welcoming the Flood Map for
helping “draw our attention straight away to the problem areas” (Planner 19), planners
also insisted that flooding is not the only sustainability issue that they have a professional
duty to consider. In addition to flooding, LPAs are statutorily obligated to promote
economic development (PPG1: para 21), greenbelt protection (PPG1: para 30) housing
provision (PPG3), and brownfield redevelopment in planning future development
trajectories. Planners were anxious that “the Agency would simply ignore the importance
of [these] other planning priorities” (Planner 15), because its narrow script for planning
reduced sustainability to a “black and white issue [where] planners must be mad to allow

18
developments in the floodplain” (Planner 10). By contrast, planners saw themselves as
promoting a fuller sense of sustainable development, which required them to exercise
professional judgement so as to balance competing policy imperatives and secure the
best local outcomes. This sense of expert judgement is deeply embedded both in the
ethos of the planning profession and in the governance of the planning system, which
“above all ... embraces discretion and general planning principles,” for which expert
“interpretation is [then] required” to manage the “balancing of conflicting
considerations” (Cullingworth & Nadin 2006: 52-53).
In addition to these differences in professional outlook, planners drew another
distinction between democratically accountable LPAs and the EA: “unlike the Agency,
LPAs are political organisations” (Planner 9) and must respond to the wishes of local
voters. While professional officers deal with minor development applications as a matter
of routine, major development applications are decided upon by elected members, as is
the wider Local Development Framework (LDF) within which all such LPA decisions
are taken. Since “the way it [the political system] is designed is that we do it [i.e. make
decisions]”, it was thus a source of no little irritation for LPAs to be named and shamed
by the EA in its HLT reports, as if it were “the judge and jury, whereas their role is to
advise us” (Planner 2). As another planner put it “the EA give advice; we give
permission” (Planner 6). Many planners felt that in second guessing LPA decisions, the
EA was exceeding its limited political mandate. Though the contradiction went
unremarked, this critique of EA interference with the democratically authorized decision
making of LPAs sits uncomfortably alongside planners’ impassioned defence of their
own professional discretion in making those decisions.
Tensions between the EA and LPAs were most acute in low-lying areas and in
the centrally designated ‘growth areas’, like the Thames Gateway, where implementing
central government targets for new housing and brownfield regeneration put LPAs on a

19
collision course with the EA over its responsibility to manage flood risks. As Planner 9
explained:
they [the EA] fear that we might not take flood risk seriously and from our
point of view there’s a fear that flood risk is the only consideration they’ll
accept. That makes it really difficult for low-lying areas, like ours.
In Lincolnshire, for example, the Flood Map positions 96% of Boston and 76% of South
Holland in Zone 3 of high-risk (LCC 2007), and under PPG25 LPAs are required to
steer development away from those areas. There were widespread concerns that “the
map could blight areas by saying you're at such a high-risk of flooding that you can't
develop here, which in our area made one or two insurance companies very worried, not
to mention the local residents” (Planner 8). In interviews, 81% (17/21) of planners
expressed concern about the reputational effects of the map which could “blight areas
and devalue businesses” (Planner 9), while a further 71% complained the EA was too
rigid in its interpretation of the flood zones and failed to acknowledge “greater variability
exists within these flood boundaries” (Planner 10). As Planner 1 put it:
Yes 98% of the city is within a flood risk zone. Yet we have a major inland
port, motorway, and railway links. So who could deny that Hull is a place to
be developed with many sustainable options?
The problem of stigma was also highlighted in the formal responses from LPAs to the
PPS25 consultation (DCLG 2006a: 12).
These broader institutional tensions shaped how planners understood and used
the Flood Map. Planners were particularly critical of the way the Flood Map ignored the
protection provided by flood defences. As Planner 20 remarked:
the Flood Map doesn’t take account of defences. Instead, it shows where it
would flood if the defences weren’t there. Well that’s an artificial picture
20
because defences are there… [OK] we can’t say they’ll never be breached or
overtopped but it’s just wrong to say they don’t exist.
These concerns about realism were echoed by the Royal Town Planning Institute (RTPI
2006) in its response to government consultations on revising planning policies for flood
risk.
Although many LPAs had followed the EA script for planning in loading the
Flood Map onto their in-house GIS systems as an initial screening tool, it proved better
suited to some planning functions than others. Planners certainly welcomed the
convenient access to information about flood risk, particularly as many LPAs had lost in-
house drainage expertise to budget cuts and outsourcing, which made it “very hard for us
to know when an application might be at risk” (Planner 13). With the Flood Map
planners were able to see for themselves what areas were at risk. As Planner 7 explained:
We really like the Flood [Zone] Map because it draws our attention straight
away to the problem areas and makes us ask ourselves: should we even be
considering this site in the first place; and if so, what extra information do
we need to make that decision.
Such praise was most common among those involved in formulating LDF documents.
Under the new plan-led system in England, LPAs invest considerable effort mapping out
where development of different kinds is to be permitted. With its delineation of three
broad zones of increasing flood risk, the Flood Map went with the basic grain of this
planning practice:
the policy team really like the map. For us, it’s a bit like a constraints map in
that it shows us what we need to think about and work around at the
strategic level (Planner 14).
By contrast, it was much more difficult to reconcile the Flood Map with the
demands of development control, and those involved in this planning function were the

21
most vocal in their hostility to the Flood Map and its script for planning. Development
control works to tight time constraints with the LPA’s Planning Delivery Grant
depending on it meeting a 56-day Best Value target for deciding on applications for
planning permission. In interviews, planners consistently reinforced the importance of
those targets and the consequences, in terms of staff redundancies and service quality, of
failing to meet them (cf. RTPI 2006; Wynn, 2005).
This need for speed lay at the heart of two intertwined complaints about the
Flood Map and its script for planning. First, planners sometimes complained that the
Flood Map did not provide sufficient spatial resolution to judge individual planning
applications. As Planner 6 put it, “the accuracy of the [Flood] Map at the level of detail
we require for making clear-cut decisions just isn’t there”. The EA, of course, never
designed the Flood Map for that purpose. It wanted planners to require developers to
produce a more detailed FRA as part of their application and then to consult the EA for
more detailed assessment of its merits. Planners, however, resisted this script. They were
sensitive to complaints from developers about the added costs of requiring an FRA
“even for reasonably minor extensions… that might be more costly than the rest of the
process put together” (Planner 21), but their primary concern was the slow pace of the
involved process of consultation and site-specific flood risk assessment envisioned by the
EA. LPAs needed greater speed and certainty than such consultation allowed, which
takes us to a second reason why Planner 6 thought, “there is a problem with the scale [of
the Flood Map] and not being able to drill down to specifics”. In interviews planners
frequently complained that the EA was too slow in responding to consultation requests,
a concern echoed in the responses to the consultations over PPS25:
LPAs were particularly concerned about how the Environment Agency
would ensure that responses would be received in time for LPA targets for
dealing deciding planning applications to be met (DCLG 2006a: 22).

22
Such concerns are corroborated by Wynn’s (2005) analysis and by the EA (2006: 23)
itself, which put out its standing advice precisely to reduce the number of minor
applications to which it needed to respond. Nevertheless, Planner 6, for instance,
reported that her LPA “receives responses [from the EA] for about 10-20% of submitted
applications. This creates a dilemma for us: what do we do in the other 80-90% of cases
where there’s no feedback? Well, we just grant them permission”.
The EA presumed that development applications in Flood Zones 2 and 3 would
simply be rejected automatically, but rejections require reasons and can be difficult to
sustain in the face of an appeal without robust advice. As Planner 2 reflected:
We, as a Local Planning Authority, need to have confidence to be able to say
to a developer, and in front of the Planning Inspectorate if necessary, that we
have good evidence for denying this application. Any vagueness will not only
upset but will be jumped on by developers.
As Table 1 shows, in nearly 10% of cases where the EA has sustained objections on
flood risk grounds, LPAs have not felt confident enough to base their rejection on that
basis.
In response to those concerns, the EA is committed to updating the Flood Map
quarterly to incorporate the very latest science. Long-serving planners recognized that
that EFO had improved upon the IFM and was getting better all the time. But this
process of continuous improvement led to further complications for development
control. First, it suggested that the flood outlines were merely provisional, and this
undermined the way that planners relied upon the Flood Map to legitimate their
decisions. The Flood Map, explained Planner 14:
gives us a level of certainty. Therefore we can show [developers] the map
and discuss with them our reasoning. It’s very important to demonstrate,

23
with a degree of clarity, precisely why we’re refusing something and making
sure our reasoning stands up.
Second, 28% (6/21) of planners also noted that revisions to the Flood Map created
problems for development decisions and planning consents taken under previous flood
outlines. Having put the Flood Map up on the wall in his office, Planner 21 recalled how:
three months later we had updated plans from the EA, which was as a
response to them gleaning additional information through the planning
process to improve the accuracy of those plans. We had developers saying to
us which plans are you dealing with. ...We found ourselves in a situation
where there were outline planning consents granted on the back of the
original maps ... but by the time we got to consider the application the maps
had changed. So, which ones apply? And certainly when we dealt with the
Planning Inspectorate he thought that this was a moving fixture that is
impacting upon the basis on which we would manage the application.
The best flood risk science, then, is not necessarily the most useful science (Porter 2010).
Rather, as Porter (1994: 391) remarks, “standardization and proper surveillance are in
some ways more important to a public measurement system than a close approximation
to true values”. Paradoxically, efforts to increase the scientific quality of the Flood Map
increased the uncertainties about its application in planning.
6. Displacing the Flood Map’s Script
Despite being the newest and most detailed planning policy guidance note, PPG25 was
completely revised in 2006 as part of a wider recasting of all planning policy guidance
notes into planning policy statements. The new guidance responded to many of the
concerns raised by planners about the Flood Map and its script for planning. While LPAs
wanted greater flexibility, the EA was concerned that LPAs were not taking a strategic

24
enough approach to managing flood risk across all planning stages. Both agreed that too
much time and resources were being wasted micromanaging referrals (DCLG 2006c). In
keeping with wider efforts to ‘front-load’ the planning system (Cullingworth & Nadin
2006), PPS25 called on LPAs to manage flood risk ‘upstream’ through their LDFs,
strategic plans and local policies, which would then structure ‘downstream’
implementation through development control. In parallel with this increased emphasis
on managing flood risk through LDFs, external controls over development control were
relaxed with the phasing out the HLTs and the introduction of an ‘Exceptions Test’ to
enable LPAs to allow essential development “ in Flood Zones 2 and 3, … to avoid social
or economic blight” (DCLG 2006b: para 19). To do this, PPS25 called on every LPA in
England to produce a Strategic Flood Risk Assessment (SFRA) to inform its LDF and
through that its development control decisions.
The SFRA has thus displaced the Flood Map as the primary decision support
tool for planning. For LPAs, the SFRA provides an opportunity to incorporate greater
detail than was included in the original Flood Map, which in turn is now being updated
by the EA based on local SFRAs. Indeed, even before the revision of PPS25 made the
production of SFRAs a requirement, several LPAs “got frustrated that the Environment
Agency wouldn’t modify their maps so we went out and commissioned our own
Strategic Flood Risk Assessment” (Planner 21). With their own SFRA, these LPAs were
less reliant on the EA for technical advice and better able to decide on planning
applications within the required time scale (see DCLG 2006c: para 60). The EA also sees
some advantages in the use of more detailed SFRAs, which free up EA staff from
consulting with LPAs over minor applications so they can focus their efforts on major
ones and play a more ‘strategic’ role in flood risk management, in line with the Pitt
Review (2008) recommendations.

25
The emergence of SFRAs, thus, helped to consolidate some broader shifts in the
roles of the LPAs and the EA. While SFRAs “empower and extend” planners’
responsibilities for managing flood risks (Senior Flood Risk Policy Manager 1), the EA
itself now serves less as a ‘regulator’ of planning decisions than a ‘strategic enabler’
providing LPAs with technical support in fulfilling their new responsibilities for flood
risk management. Institutional-political tensions remain, however, and like the Flood
Map before it, the new SFRAs are a flashpoint for conflict over the relationship between
LPAs and the Agency. Unlike the Flood Map, SFRAs are commissioned and paid for by
LPAs who look to them as tool to help them exercise more control over flood plain
development. In interviews 66% of planners expressed the hope that producing their
own SFRAs would enable them to define the flood zones more precisely so as to
accommodate development in Zones 2 and 3 under the Sequential and Exception Tests.
For the EA, the concern is that SFRAs could be used to justify what they see as
inappropriate development. Planner 6 recounted how “one of the Environment Agency’s
officers told me that he hadn’t seen a single Sequential Test that proved the development
shouldn’t go in the floodplain” (Planner 6). Such concerns are given credence by recent
EA-commissioned research, which found evidence “that some SFRAs are being
prepared on the basis of existing land allocations in their local development documents
[LDF]” rather than as a constraint on those allocations (DEFRA/EA 2009: 1). To retain
its influence, the EA acts as an arbiter of scientific quality. It encourages LPAs to use
contractors from its approved list of ‘framework consultants’ and can challenge the
validity of the resulting SFRAs, if it so chooses. Without EA approval, SFRAs hold little
authority:
We came to the conclusion that the SFRA had no validity unless the Agency
signed off on it. Otherwise they’ll just ask the Secretary of State to intervene

26
on everything and we would be back at square one. So you have to reach
some sort of agreement (Planner 9).
Displaced of its decision-support role for planning, the EA Flood Map has been
repurposed as a tool for communicating flood risk to the general public. The aim is now
to “encourage people living and working in areas prone to flooding to find out more and
take appropriate action” (EA 2009b). In this individually responsibilizing script, people
are expected to use the map to assess their own risk and to take appropriate steps to
manage it. But experience in other risk management domains suggests such strategies are
liable to face resistance from competing models of risk, responsibility and citizen-state
relationships (e.g. Bickerstaff et al. 2008), while research on flood risk communication in
particular highlights the challenges involved in trying to use communication as an
instrument of behavior change (Demeritt & Nobert 2011; Soane et al. 2010).
7. Conclusion
Flood maps and other forms of risk communication play an increasingly prominent role
in new government strategies for flood risk management. Indeed, under the EU Floods
Directive (2007/60/EC), EU member states are now required to produce flood maps as
the central instrument of a common European “framework for the assessment and
management of flood risks” (EC 2007: article 1). As with many framework directives, the
Floods Directive presents flood maps in purely technical terms as “an effective tool for
information as well as a valuable basis for priority setting and for further technical,
financial and political decisions” (para 12).
In this paper we have challenged that all-too-common vision of decision support
technologies as purely technical instruments standing outside of politics and feeding
neutral information into the political realm. Instead, we explored the ways in which the
Flood Map shaped, and in turn was shaped by, institutional tensions between the EA and

27
LPAs over political mandates, institutional priorities and professional discretion in
planning and flood risk management. While the Floods Directive specifies a host of
technical details about the information flood maps must include, it is conspicuously silent
on these institutional issues about who will use them, how, why and with what wider
effects. That silence may be diplomatic given the subsidiary principle and member-state
sensitivities about competency grabbing by the Commission, but it begs important
questions not just about whether the production of flood maps will achieve the central
purpose of the Directive— “reduction of the adverse consequences ... associated with
floods in the Community” (Article 1)— but also about what those adverse consequences
actually are. Flooding poses direct risks to life and property, but the responsibility for
managing those potential harms also creates various second-order institutional risks of
blame in the event of failure to discharge that responsibility properly (Rothstein et al.
2006). In this context, risk maps do much more than just represent the spatial
distribution of hazards to health and safety. They also provide an instrument for
regulating those risks, by defining areas subject to additional controls, and for accounting
for the inevitable limits of those controls, both enabling LPAs to over-ride those controls
by exercising the risk-based Sequential and Exception Tests and to deflect blame in the
event of some flood event by pointing to all the reasonably practicable measures they had
taken to mitigate and manage the risks of such an eventuality.
Drawing on traditions of critical cartography and science studies, we showed how
the Flood Map was designed to standardize the process by which flood risk was
considered in LPA decision-making and thereby to ensure planning decisions were
aligned with EA views about avoiding development in zones at risk of flooding without
actually banning such development outright. But technologies are also shaped by their
users, and planners actively contested elements of the EA’s script for planning and its
designs for the Flood Map. Their concerns both about sterilizing areas depicted as being

28
at risk of flooding and about the difficulties of actually using the Flood Map for speedy
and defensible development control decisions were crucial in its eventual replacement by
LPA-commissioned SFRAs as the main decision support tool for planning.
It is tempting to read this displacement in terms of the longstanding tug-of-war
between central and local government over planning and the balance between central
targets and regulatory controls as against local autonomy and planners’ professional
discretion. There is certainly a sense in which the shift to SFRAs, the adoption of a new
Exception Test, and elimination of HLTs has given LPAs greater scope to allow
development in Flood Zones 2 and 3. But flood maps are, nevertheless, still central to
the governance of flood risk and the EA retains substantial influence both over the
SFRAs and the LDFs they inform and through them over development control decision
making. It is less the fact of regulatory control over planning and flood risk management
that has changed than the form and instruments by which those indirect controls are
exercised.

29
FIGURE 1 – Environment Agency’s Flood Risk Maps, Source: Environment Agency.
The Indicative Floodplain Map (IFM) is shown in the upper left and the Flood Zone Map, or Extreme Flood Outline (EFO), in the bottom in the bottom right. The overlap between them is shown by the square overlain on top of the IFM. In the IFM the green area indicates the zone exposed to a 0.5% annual probability of tidal flooding and the blue the area exposed to a 1.0% annual probability of fluvial flooding. This distinction between fluvial and tidal flooding is not shown in the EFO, which does indicate, with hashing, areas benefiting from flood defences (unlike the IFM that ignores the location and protection afforded by defences altogether). In the EFO, dark blue marks the boundary of Flood Zone 3, which is defined as areas exposed either to a 1.0% annual probability of fluvial flooding or a 0.5% annual probability of tidal flooding. Flood Zone 2, which is defined as areas exposed to 0.1% annual probability of tidal or fluvial flooding is marked with light blue, whereas Flood Zone 1 with little or no risk of flooding is the residual area shown in white.

30
FIGURE 2 - Percentage of new dwellings in England built within areas of high risk, by region, 1989-2010. Source: Land Use Change Series table 251.
http://www.communities.gov.uk/planningandbuilding/planningbuilding/planningstatistics/livetables/landusechange/

31
FIGURE 3 - Percentage of new dwellingsin England built on previously used, ‘brownfield’ lands (solid black line) and within areas of high flood risk (dashed
grey line), 1989-2010.Source: Calculated from Land Use Change Series tables 221 and 251.
http://www.communities.gov.uk/planningandbuilding/planningbuilding/planningstatistics/livetables/landusechange/

32
TABLE 1 – LPA planning applications considered by the Environment Agency, 2000-2009. Source: calculations based on data compiled from annual HLT reports prepared by the Environment Agency
i This covers the period prior to the introduction of PPG25, when the LPA consultations with the EA were governed by Circular 30/92
ii This figure was initially reported as 470 in the 2001/02 HLT report, but then corrected (without any explanation) to 475 in subsequent editions.
iii This includes applications approved with conditions only partly meeting EA concerns
iv This figure was initially reported as 288 in the 2001/02 HLT report, but then corrected to 183 in subsequent editions.
2000/01i 2001/02 2002/03 2003/4 2004/5 2005/6 2006/7 2007/8 2008/09
Consultations which required detailed consideration on flood risk grounds
23952 24138 20452 22067 13937 11403 10854 9123 12115
Total EA objections made on flood risk grounds
N/A 2500 4523 5077 4634 4201 4750 6232 5198
Rate of EA objection on flood risk grounds
N/A 10.4% 22.1% 23.0% 33.2% 36.8% 43.8% 68.3% 42.9%
Number of applications where EA sustained objections on flood risk grounds and LPA decision is known
629 758 1047 1437 1438 1160 1067 1264 1310
Number of those cases where LPA decision was in line with EA advice
397 (63.1%)
475ii (62.0%)
658 (62.8%)
931 (64.8%)
998 (69.4%)
889 (76.6%)
829 (77.7%)
1021 (80.8%)
1072 (81.8%)
Number of those cases where LPA decision was contrary to EA adviceiii
232 (36.9%)
283iv (38.0%)
221 (21.1%)
323 (22.5%)
248 (17.2%)
136 (11.7%)
110 (10.3%)
124 (9.8%)
115 (8.8%)
Number of those cases where the application was refused but not on flood risk grounds
14 (2.2%)
N/A 168 (16.0%)
183 (12.7%)
192 (13.4%)
135 (11.6%)
128 (12.0%)
119 (9.4%)
123 (9.4%)

33
Acknowledgements. We gratefully acknowledge funding support from the Economic and Social Research Council (PTA-030-2005-00142) and the European Commission’s KULTURisk project (www.kulturisk.eu). We would also like to thank the Environment Agency for giving its permission to use its map images, as well as the constructive comments of John Gardner, Joseph Hillier and Lea Lahnstein on an earlier draft; as well as the constructive comments of two anonymous referees. Any errors or deficiencies are of course ours alone. References Akrich M, 1992, “The De-Scription of Technical Objects”, in: Shaping Technology – Building
Society: Studies in Sociotechnical Change Eds W Bijker, J Law, (MIT Press: USA), 205-224.
Berg M, 1997, Rationalizing Medical Work: Decision-Support Techniques and Medical Practices, (MIT Press: USA).
Bickerstaff K, Simmons P, Pidgeon N, 2008, “Constructing responsibilities for risk: negotiating citizen-state relationships” Environment and Planning A 40 1312–1330
Brown J, Damery S, 2002, “Managing Flood Risks in the UK. : Towards an integration of social and technical perspectives” Transactions of the Institute of British Geographers 27(4) 412-426.
Butler C, Pidgeon N, 2011, “From `flood defence' to `flood risk management': exploring governance, responsibility, and blame”. Environment and Planning C 29 533-547.
Bye P, Horner M, 1998, “Easter 1998 floods: Report by the independent review team to the board of the Environment Agency. Volume 1”. (Bristol: Environment Agency).
Callon M, 1986, ``Some elements of a sociology of translation'', in Power, Action and Belief Ed. J Law (Routledge and Kegan Paul, London) 196-233
Crampton J, Krygier J, 2006, “An Introduction to Critical Cartography” ACME: An International E-Journal for Critical Cartographies 4(1) 11-33.
Cullingworth B, Nadin V, 2006 “Town and Country Planning in the UK”. 14th ed, (Routledge: London).
DCLG 2006b, Planning Policy Statement 25: Development and Flood Risk, Department for Communities and Local Government http://www.communities.gov.uk/planningandbuilding/planning/planningpolicyguidance/
DCLG 2006c, Planning Policy Statement 25: Development & Flood Risk – Full Regulatory Impact Assessment, Department for Communities and Local Government, http://www.communities.gov.uk/publications/planningandbuilding/pps25ria
Defra 2004/5, Making Space for Water: Developing a New Government Strategy for Flood and Coastal Erosion Risk Management in England, Department of the Environment, Food, and Rural Affairs, http://www.defra.gov.uk/
Defra 2009, Draft Flood and Water Management Bill, Department of the Environment, Food, and Rural Affairs, CM 7582 http://www.official-documents.gov.uk/document/cm75/7582/7582.pdf
Defra/EA 2009, Land Use Planning – Assessing the Quality and Influence of Strategic Flood Risk Assessments (SFRAs), Department of the Environment, Food, and Rural Affairs , Environment Agency, R&D Technical Report FD2610/TR. [Freedom of Information request]
Demeritt D, 1997, “Representing the ‘true’ St Croix: knowledge and power in the partition of the northeast” William and Mary Quarterly 54 515–48
Demeritt D, 2001, “Scientific Forest Conservation and the Statistical Picturing of

34
Nature’s Limits in Progressive-era USA” Environment & Planning D: Society & Space, 19 431-59.
Demeritt D, Nobert S, 2011, “Responding to early flood warning in the European Union”, In Forecasting, Warning, and Transnational Risks: Is Prevention Possible? Eds C Meyer, C. De Franco (Palgrave: London) 127-47
DCLG 2006a, Consultation on Planning Policy Statement 25: Development and Flood Risk, Department for Communities and Local Government, http://www.communities.gov.uk/archived/publications/planningandbuilding/consultationplanning3
DETR 2001, Planning Policy Guidance Note 25: Development and Flood Risk, Department for Environment, Transport and the Regions, (The Stationery Office, London)
EA 1999, Environment Agency Response to the Independent Report on the Easter 1998 Floods: Action Plan, November 1998, Environment Agency, (Environment Agency: Bristol)
EA 2001, Lessons Learned: Autumn 2000 Floods, Environment Agency, (Environment Agency: Britsol)
EA 2003, Strategy for Flood Risk Management 2003-2008, Version 1.2, Environment Agency, (Environment Agency: Bristol)
EA 2006, High-Level Targets 5: Development and Flood Risk in England, 2005/06, Environment Agency (Environment Agency: Bristol) [Freedom of Information request]
EA 2009a, High-Level Targets 5: Development and Flood Risk in England, 2007/08, Environment Agency, (Environment Agency: Bristol), http://www.environment-agency.gov.uk/cy/ymchwil/cynllunio/33704.aspx
EA 2009b, “Flood Map – Your Questions Answered”, Environment Agency, http://www.environment-agency.gov.uk/homeandleisure/floods/31662.aspx
EA 2010, Flood and Coastal Risk Management Risk Mapping Strategy: 2010-2015, Environment Agency, (Environment Agency: Bristol) [Freedom of Information request]
EA/LGA 2006, High-Level Target 5: Development and Flood Risk 2005/06. Environment Agency, Local Government Association, (The Stationery Office: London)
EC 2007, “Directive 2007/60/EC of the European Parliament and of the Council of 23 October 2007 on the Assessment and Management of Flood Risks”, Official Journal of the European Communities L 288 27-34 6 November (European Commission, Brussels)
Glaser BG, Strauss AL, 1967, The Discovery of Grounded Theory: Strategies for Qualitative Research. (Transaction Publishers: Piscataway NJ)
Hoggart K, Lees L, Davies A, 2002, Researching Human Geography, (Arnold: London)
House of Commons 1998, Sixth Report of the Select Committee of Agriculture on Coastal and Flood Defence, vols 1-2, (The Stationery Office: London) http://www.parliament.the-stationery-office.co.uk/pa/cm199798/cmselect/cmagric/707/70702.htm
House of Commons 2000, Second Report of the Select Committee on Environment, Transport and Rural Affairs on Development On, Or Affecting the Floodplain, vols 1-2, (The Stationery Office: London) http://www.publications.parliament.uk/pa/cm200001/cmselect/cmenvtra/64/6402.htm
Joerges B, 1999 “Do politics have artefacts?”, Social Studies of Science 29 411-32
Johnson C, Priest S, 2008 “Flood Risk Management in England: A Changing Landscape of Risk Responsibility?”, Water Resources Development 24(4) 513-25.
Krieger K, 2011, Putting Varieties of Risk-Based Governance into Institutional Context: The Case of

35
Flood Management Regimes in Germany and England in the 1990s and 2000s, PhD Thesis, Department of Geography, King’s College London.
Lampland M, Star S, (Eds) 2009, Standards and Their Stories: How Quantifying, Classifying, and Formalizing Practices Shape Everyday Life, (Cornell University Press: Ithaca)
Lane S, Landström C, Whatmore S, 2011, “Imagining Flood Futures: Risk Assessment and Management in Practice” Phil. Trans. R. Soc. A, 369 1784-1806
Lincolnshire County Council 2007, Strategic Flood Risk Assessment, Final Report by JBA Consulting Ltd [Available on Request].
Majone G, 1997, “From the Positive to the Regulatory State: Causes and Consequences of Changes in the Modern of Governance”, Journal of Public Policy, 17(2) 139-167.
Monmonier M, 1997, Cartographies of Danger: Mapping Hazards in America, (University of Chicago Press: USA)
Moran M, 2003, The British Regulatory State, (Oxford University Press: Oxford)
NAO 2001, Inland Flood Defence: Report by the Controller and Auditor General. HC 299, Session 2000-2001, March, National Audit Office (The Stationery Office: London)
Noble D, 1984, Forces of Production: A Social History of Industrial Automation, (Oxford University Press: New York)
Pitt M, 2008, Learning lessons from the 2007 floods: an independent review by Sir Michael Pitt. Final report, Cabinet Office (The Stationery Office: London)
Porter J, 2010, The Extreme Flood Outline: Co-Producing Flood Risk Mapping and Spatial Planning in England, PhD Thesis, Department of Geography, King’s College London.
Porter T, 1994, “Making Things Quantitative”, Science in Context 7(3) 389-407.
Porter T, 1995, Trust in Numbers: The Pursuit of Objectivity in Science and Public Life, (Princeton University Press: Princeton)
Power M, 2004, The Risk Management of Everything: Rethinking the Politics of Uncertainty, (DEMOS: London).
Priest S, Clark M, Colclough S, 2008, “Public Awareness of Flood Risk: The Role of Environment Agency Flood Map”, Economic and Social Research Council Final Report, RES-000-22-1710.
Richards J, White I, Carter J, 2008, “Local Planning Practice and Flood Risk Management in England: Is There A Collective Implementation Deficit?”, Urban Environment 2 11-20.
Rose N, Miller P, 1992, “Political Power Beyond the State: Problematics of Government”, British Journal of Sociology 43 173–205
Rothstein H, Huber M, Gaskell G, 2006, “A Theory of Risk Colonization: The Spiraling Regulatory Logics of Societal and Institutional Risk”, Economy & Society 35(1) 91-112
RTPI 2006, Draft PPS25: Development and Flood Risk, Royal Town and Planning Institute, https://secure.rtpi.org.uk/item/255/23/5/3
Scrase J, Sheate W, 2005 “Re-framing flood control in England and Wales”, Environmental Values 14 113–37
Soane E, Schubert I, Challenor P, Lunn R, Narendran S, Pollard S, 2010, “Flood perception and mitigation: the role of severity, agency, and experience in the purchase of flood protection, and the communication of flood information”, Environment and Planning A 42 3023-3038
Timmermans S, Epstein S, 2010 “A World of Standards but not a Standard World: Toward A Sociology of Standards and Standardization”, Annual Review of Sociology 36

36
69-89.
White G, 1942, Human Adjustment to Flood: A geographical approach to the flood problem in the United States, Chicago University Press: USA)
White I, Richards J, 2007, “Planning policy and flood risk: the translation of national guidance policy into local policy” Planning Practice and Research 22(4) 513-24
Winner L, 1986, The Whale and the Reactor, (University of Chicago: USA)
Wood D, 2010, Rethinking the Power of Maps, (Guilford: New York)
Wynn P, 2005 “Development control and flood risk: analysis of local planning authority and developer approaches to PPG25”, Planning Practice and Research 20(3) 241-261