Embed Size (px)
Citation preview
ICPDR / International Commission for the Protection of the Danube River / www.icpdr.org
Flood Hazard and Flood Risk Maps of the Danube River Basin District
Summary Report on implementation of Article 6 of the
European Floods Directive in the Danube River Basin District
Document number:
Version: Final
Date: April 2015
ICPDR / International Commission for the Protection of the Danube River / www.icpdr.org
Imprint
Published by:
ICPDR – International Commission for the Protection of the Danube River
© ICPDR 2015
Contact
ICPDR Secretariat
Vienna International Centre / D0412
P.O. Box 500 / 1400 Vienna / Austria
T: +43 (1) 26060-5738 / F: +43 (1) 26060-5895
[email protected] / www.icpdr.org
ICPDR / International Commission for the Protection of the Danube River / www.icpdr.org
Table of content
1 .. Introduction 5
2 .. Flood hazard maps in the DRBD Countries 6
2.1 Germany 6
2.2 Austria 7
2.3 Czech Republic 8
2.4 Slovakia 9
2.5 Hungary 9
2.6 Slovenia 10
2.7 Croatia 10
2.8 Serbia 11
2.9 Bosnia and Herzegovina 11
2.10 Romania 12
2.11 Bulgaria 13
3 .. Flood risk maps in the DRBD Countries 14
3.1 Germany 14
3.2 Austria 14
3.3 Czech Republic 15
3.4 Slovakia 15
3.5 Hungary 16
3.6 Slovenia 16
3.7 Croatia 16
3.8 Serbia 17
3.9 Bosnia and Herzegovina 17
3.10 Romania 18
3.11 Bulgaria 19
4 .. Flood maps for the DRBD 20
4.1 Transboundary cooperation in DRBD 20
4.2 Flood hazard map 20
4.3 Flood risk maps 21
5 .. Related international activities 23
5.1 Danube FLOODRISK project 23
5.2 CEframe 23
6 .. List of national links for finding more detailed information 24
6.1 Germany 24
6.2 Austria 24
6.3 Czech Republic 24
6.4 Slovakia 24
6.5 Hungary 24
6.6 Slovenia 24
ICPDR / International Commission for the Protection of the Danube River / www.icpdr.org
6.7 Bosnia and Herzegovina 25
6.8 Romania 25
7 .. Conclusions 25
Flood Hazard and Flood Risk Maps of the Danube River Basin District 5
ICPDR / International Commission for the Protection of the Danube River / www.icpdr.org
1 Introduction
Directive 2007/60/EC on the assessment and management of flood risks (Floods Directive, FD) requires Member States to assess if all water courses and coast lines are at risk from flooding, to map the flood extent and assets and humans at risk in these areas and to take adequate and coordinated measures to reduce this flood risk. This Directive also reinforces the rights of the public to access the information on flood risks and on related measures and to influence the planning process.
Member States shall coordinate their flood risk management practices with all countries sharing an international river basin, including non-Member States, and shall in solidarity not undertake measures that would increase the flood risk in neighbouring countries. In addressing the Directive 2007/60/EC the Member States shall take into consideration long term developments, including climate change and sustainable land use practices.
According to FD the Member States shall, at the level of the river basin district, or unit of management, prepare flood hazard maps and flood risk maps, at the most appropriate scale for the areas identified under Article 5(1).
The preparation of flood hazard maps and flood risk maps for areas identified under Article 5 which are shared with other Member States shall be subject to prior exchange of information between the Member States concerned.
Flood hazard maps shall cover the geographical areas which could be flooded according to the following scenarios:
(a) floods with a low probability, or extreme event scenarios;
(b) floods with a medium probability (likely return period ≥ 100 years);
(c) floods with a high probability, where appropriate.
For each scenario the following elements shall be shown:
(a) the flood extent;
(b) water depths or water level, as appropriate;
(c) where appropriate, the flow velocity or the relevant water flow.
Flood risk maps shall show the potential adverse consequences associated with flood scenarios referred to above and expressed in terms of the following:
(a) the indicative number of inhabitants potentially affected;
(b) type of economic activity of the area potentially affected;
(c) installations as referred to in Annex I to Council Directive 96/61/EC of 24 September 1996 concerning integrated pollution prevention and control which might cause accidental pollution in case of flooding and potentially affected protected areas identified in Annex IV(1)(i), (iii) and (v) to Directive 2000/60/EC;
(d) other information which the Member State considers useful such as the indication of areas where floods with a high content of transported sediments and debris floods can occur and information on other significant sources of pollution
Flood Hazard and Flood Risk Maps of the Danube River Basin District 6
ICPDR / International Commission for the Protection of the Danube River / www.icpdr.org
For coastal flooding where there is an adequate level of protection in place, and for groundwater flooding, Member States can decide to limit the preparation of flood hazard maps to low probability or extreme events (art 6.6 and 6.7).
To address the issue of flood risk management on a basin-wide the International Commission for the Protection of the Danube River (ICPDR) adopted the Action Programme for Sustainable Flood Prevention in the Danube River Basin at the ICPDR Ministerial Meeting on 13 December 2004.
The key milestone in the implementation of the ICPDR Action Programme was publication of 17 sub-basin flood action plans in 2009. These plans are based on 45 national planning documents and provide the first ever comprehensive overview of actions to reduce flood risk in the Danube Basin. They review the current situation and set targets and respective measures for reducing adverse impacts and the likelihood of floods, increasing awareness and level of preparedness and improving flood forecasting. The targets and measures are based on the regulation of land use and spatial planning; increase of retention and detention capacities; technical flood defenses; preventive actions (e.g. flood forecasting and flood warning systems); capacity building; awareness and preparedness raising and prevention and mitigation of water pollution due to floods.
At the ICPDR Ministerial Meeting in 2010 the Danube Declaration was adopted in which the Danube Ministers reaffirmed conviction that flood prevention and protection are not short term tasks but permanent tasks of highest priority and committed themselves to make all efforts to implement the EU Flood Risk Management Directive throughout the whole Danube River Basin and to develop one single international Flood Risk Management Plan or a set of flood risk management plans, based upon the ICPDR Action Programme for Sustainable Flood Protection and the sub-basin plans, coordinated at the level of the international river basin district by 2015 making full use of the existing synergies with the DRBM Plan.
This report informs the European Commission, the stakeholders and public on the achievements made in the international Danube River Basin District in response to the provisions of the Article 6 of FD. It has been prepared using information collected from the ICPDR Contracting Parties through the activities of the ICPDR Flood Protection Expert Group (FP EG).
In Ukraine, according to the Ukraine-EU Accession Agreement the timetable for the preparation of flood hazard and flood risks maps is 6 years from the entry into force of this Agreement. In Moldova the preparation of flood hazard and flood risk maps has not started yet. The major reasons are the lack of legal instruments requiring development of such maps and also financial constraints. No information about flood mapping was obtained from Montenegro.
2 Flood hazard maps in the DRBD Countries
2.1 Germany The FD was transposed into German national law in 2009 by means of the amended Federal Water Act (Gesetz zur Ordnung des Wasserhaushalts (Wasserhaushaltsgesetz) – WHG), with the relevant provisions being identical to those of the Directive. References below to provisions of the FD therefore relate also to the binding provisions of the Federal Water Act as amended.
Flood Hazard and Flood Risk Maps of the Danube River Basin District 7
ICPDR / International Commission for the Protection of the Danube River / www.icpdr.org
The German Working Group on Water Issues of the Federal States and the Federal Government (LAWA) adopted at the 139th LAWA General Meeting in Dresden on 25/26 March 2010 the “Recommendations for the Establishment of Flood Hazard Maps and Flood Risk Maps”. The Recommendations contain standards so that the process of establishing flood hazard maps and flood risk maps meets the requirements set out in the FD. The aim was to ensure that the content and design of the maps are standardized as far as possible, thus ensuring that the set of maps produced has nationwide coherence. For the maps in the German Part of the DRB some deviations are necessary, however, because the production of maps in Baden-Württemberg has started before the adoption of the Recommendations.
Flood hazard maps cover all areas of potential significant flood risk (APSFR) which could be flooded according to the following scenarios:
• extreme event scenarios, likely return period = 1000 year or 1.5x HQ100 (this very rare event can be defined because different scenarios are included such as a failure of flood protection infrastructure. The comparable localized conditions may also occur even with smaller flood events due to, e.g. relocation of bridges)
• floods with a medium probability (likely return period ≥ 100 years),
• floods with a high probability, likely return period = 10 years, according to the LAWA Recommendations for all areas where adverse consequences of flooding are expected.
To calculate the flooding extent digital terrain models based on laser scan data (high resolution on 1m*1m grids) are used in connection with a terrestrial measurement. The flooding models used for hydraulic simulations are 1-dimensional or 2-dimensional, with steady calculation (in an exceptional case unsteady calculation). As up-to-date hydrological statistics are used for the flood hazard maps, climate change impacts that have taken effect to date are included in the data. A specific “climate change” scenario is not included in the flood hazard maps.The maps refer to the flood extent and water depths. Water depth is represented in at least five-tone colour intensity scales with variable colour tone and brightness.
2.2 Austria According to §55k Water Act (1959) flood hazard maps have to be established until the 22 December 2013. The main goal is to have an effective tool to communicate flood hazards of different probabilities to the public. To provide easy access to the data available all maps will be published on the publicly available Water Information System Austria (http://wisa.bmlfuw.gv.at) as a web-GIS-service.
Flood hazard maps need to cover (§55k (2)) all areas of potential significant flood risk (APSFR) outlining inundation of low, medium and high probability of flooding. The maps refer to the flood extent, water depths and flow velocities. The flood extent of all scenarios will be displayed in one map and referred to by different shades of blue colour. Water depth will be categorised in clusters of <0.6 m; 0.6 – 1.5 m and > 1.5 m, respectively. Flow velocities will be categorised in clusters of < 0.6 m/s; 0.6 – 2.0 m/s and > 2.0 m/s, respectively.
On the national level methods have been agreed upon to obtain uniform maps for the Federal territory. For Austria’s APSFRs best available data has been consulted to calculate the flooding extend. Referring to the state-of-the-art digital terrain models based on laser scan data (high resolution on 1m*1m Grids; elevation errors of a few cm) are used in connection with terrestrial measurement in the river stem and two dimensional hydrodynamic models. In rare cases where these data were not available information based on 1D models or HORA (natural hazard overview and risk assessment Austria, www.hora.gv.at) had been used. Based on Austrian standards scenarios of a 30-years flood, 100-years flood and 300-years flood had been considered. Information on climate change had been
Flood Hazard and Flood Risk Maps of the Danube River Basin District 8
ICPDR / International Commission for the Protection of the Danube River / www.icpdr.org
taken into account based on state –of – knowledge studies published during recent years and will be considered in more detail in the frame of the following cycles.
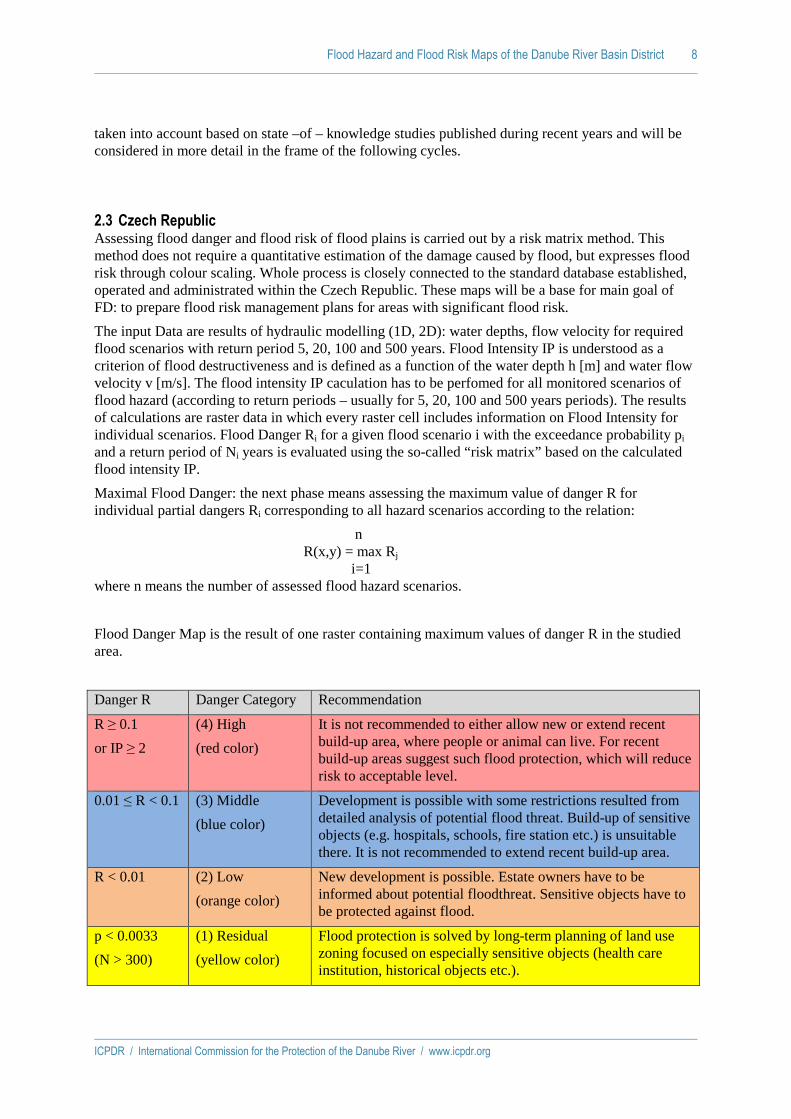
2.3 Czech Republic Assessing flood danger and flood risk of flood plains is carried out by a risk matrix method. This method does not require a quantitative estimation of the damage caused by flood, but expresses flood risk through colour scaling. Whole process is closely connected to the standard database established, operated and administrated within the Czech Republic. These maps will be a base for main goal of FD: to prepare flood risk management plans for areas with significant flood risk.
The input Data are results of hydraulic modelling (1D, 2D): water depths, flow velocity for required flood scenarios with return period 5, 20, 100 and 500 years. Flood Intensity IP is understood as a criterion of flood destructiveness and is defined as a function of the water depth h [m] and water flow velocity v [m/s]. The flood intensity IP caculation has to be perfomed for all monitored scenarios of flood hazard (according to return periods – usually for 5, 20, 100 and 500 years periods). The results of calculations are raster data in which every raster cell includes information on Flood Intensity for individual scenarios. Flood Danger Ri for a given flood scenario i with the exceedance probability pi and a return period of Ni years is evaluated using the so-called “risk matrix” based on the calculated flood intensity IP.
Maximal Flood Danger: the next phase means assessing the maximum value of danger R for individual partial dangers Ri corresponding to all hazard scenarios according to the relation:
n R(x,y) = max Rj i=1 where n means the number of assessed flood hazard scenarios.
Flood Danger Map is the result of one raster containing maximum values of danger R in the studied area.
Danger R Danger Category Recommendation
R ≥ 0.1
or IP ≥ 2
(4) High
(red color)
It is not recommended to either allow new or extend recent build-up area, where people or animal can live. For recent build-up areas suggest such flood protection, which will reduce risk to acceptable level.
0.01 ≤ R < 0.1 (3) Middle
(blue color)
Development is possible with some restrictions resulted from detailed analysis of potential flood threat. Build-up of sensitive objects (e.g. hospitals, schools, fire station etc.) is unsuitable there. It is not recommended to extend recent build-up area.
R < 0.01 (2) Low
(orange color)
New development is possible. Estate owners have to be informed about potential floodthreat. Sensitive objects have to be protected against flood.
p < 0.0033
(N > 300)
(1) Residual
(yellow color)
Flood protection is solved by long-term planning of land use zoning focused on especially sensitive objects (health care institution, historical objects etc.).
Flood Hazard and Flood Risk Maps of the Danube River Basin District 9
ICPDR / International Commission for the Protection of the Danube River / www.icpdr.org
2.4 Slovakia Slovak Republic transposed FD into national legislation in a frame of the act no. 7/2010 Coll. on flood protection. Article 6 of the Flood Protection Act defines the obligation to present flood hazards caused by floods with return periods of 1000 years (as a flood with a low probability), 100 years (as a flood with a medium probability), 50, 10 and 5 years as floods with a high probability. Flood hazard maps delineate flood extent, water depths or water level and flow velocity or discharge distribution.
The Flood Protection Act sets a rule whereby differences of flood extent shown at the flood hazard map compared to the real flood extent in the event of flood of a comparable probability does not constitute a right for claiming compensation to the damages. The areas of potentially significant flood risks caused by groundwater are given low probability on flood hazard maps. The Act complies with the requirements of the Flood Directive that it imposes an obligation to issue the flood hazard maps in transboundary river basin close to state borders following to previous mutual data exchange of bordering countries.
The water management authority responsible for flood risk maps production submits these to state administration and municipal authorities. The flood hazard maps made available to the public through the Ministry of Environment of the Slovak Republic. Municipality and state administration have a duty to display the flood extent lines at spatial plans in the next update cycle.
Specific rules of processing the flood hazard maps in a framework of the Flood protection Act are set by the Decree of the Ministry of Environment of the Slovak Republic no. 419/2010 Coll.
2.5 Hungary The EU Flood Directive was implemented into the national legislation in 2010 by the 178/2010 (V.13.) governmental act. For the fulfilment of the requirements a national project started with a name “Flood risk mapping and development of strategic risk management plan (KEOP-2.5.0.B)”, also called as “ÁKK”.
The flood inundation analyses are based on a GIS platform-based fully integrated water management tool, where the digital terrain model has a 10x10 m resolution as a raster, but the specific objects (e.g. rivers, dikes, localization roads etc.) are presented as vectors.
The probable failure points of the dikes were investigated and the specific flood curves were calculated from the available 80-120 years long data sets to the certain sections of the water outtake. Climate change effects were interpreted in the low probability events. The transport on the field was calculated with 2D numerical models for each floodplain. The hazard maps were exported to 50x50 meter raster layers for visualization, the boundaries were transformed to shape files. The mapping results were constructed in an aggregated form for the (national) Danube, Tisza, Balaton and Dráva sub-basins in line with the river basin management plans. The reporting format is a 1:2.000.000 scale map, but the appropriate view is 1:100.000.
The scenarios for fluvial flooding were likely 30/100/1000 year return probability. The inundation contours represent the three events’ maximum extents, the water depth categories are 0-0.5 m, 0.5-1 m, 1-2 m, 2-3 m, 3-5 m, >5 m. The velocities were quite low and considered not important in regard with the inundation hazard, so they were not indicated. The risk analysis is based on the water depth.
The effects of the groundwater floods are represented by the low probability events (Article 6.7) that have been extracted from the real observed inundations in the last decades.
The recent flood events and especially the Danube flood in June 2013 pointed out the necessity of a new statistical calculation of the design flood events. Furthermore new terrain data is being incorporated into the existing surface models. The hazard and risk maps will be fine-tuned based on the new data sets during the flood risk management planning in 2014-2015.
Flood Hazard and Flood Risk Maps of the Danube River Basin District 10
ICPDR / International Commission for the Protection of the Danube River / www.icpdr.org
2.6 Slovenia FD requirements concerning flood hazard and risk maps were transposed with a Decree on establishment of flood risk management plans (Official Gazette of the RS, No. 7/2010). This Decree refers to the Rules on methodology to define flood risk areas and erosion areas connected to floods and classification of plots into risk classes (Official Gazette of the RS, No. 60/2007), which define standard flood hazard scenarios by discharges with a 10-, 100- and 500-year return period, and since 2007 those scenarios are used in the process of flood modelling and hazard mapping for defining the spatial conditions and limitations for constructions and activities on flood risk areas. Preliminary flood risk assessment specified 61 APSFR in Slovenia, and already available mapping data had to be collected for approximately half of the APSFRs and the remaining hazard maps had to be created afterwards.
According to the methodological rules there are two types of hazard maps (scale >1:5000), the first one being a flood hazard intensity map, and another one the flood hazard classes map. Intensity map shows three types of flood extent (high, medium and low probability flood), and for the medium probability flood also three water depth classes (<0,5m; 0,5 - 1,5m; >1,5m) and three water depth times velocity classes (<0,5m2/s; 0,5 - 1,5m2/s; >1,5m2/s). Flood mapping is generally based on one-dimensional hydrologic models for simulation of the rainfall-runoff processes, requiring meteorological, basin and controlling input components, and two-dimensional hydrodynamic models using mainly DTM1 derived from LiDAR survey data with the elevation accuracy of about 5 cm, as well as terrestrial survey of the river stream and hydraulically significant objects. On the other hand, the map of flood hazard classes is made by combining the flood return period and intensity for the purpose of defining the spatial conditions and limitations, which is an ongoing preventive measure to follow the objective of avoidance of new risks. Raising awareness objective is being achieved by publishing both flood hazard cartographic layers, flood hazard indication map and past flood events in the national Environmental Atlas (gis.arso.gov.si/atlasokolja/ ), and flood hazard intensity maps for APSFRs (mko.gov.si/si/delovna_podrocja/voda/poplavna_direktiva/). Trends in high flows are not significant and were not considered in the first implementation cycle, but the next cycles will include the results of the ongoing research on climate projections and relations to the future floods. Despite the watershed size criteria (>4000 km2) two nationally most important APSFRs were added, even though they are not situated along three major rivers, meaning that 21 out of 61 flood hazard maps are reported to ICPDR.
2.7 Croatia Flood hazard maps are primarily designed for clear communication of flood hazards to the public. For each APSFR, four maps will be delivered. First map will show flood extents of all three scenarios overlapping. Other three maps will display water depths for three scenarios as required by FD. Water depths will be grouped in four categories (0-0.5, 0.5-1.5, 1.5-2.5 and >2.5 m) and areas protected by flood control structures will be shown. Displaying of flow velocities, where data available, is still under discussion. On all four maps areas which are not designed in this planning cycle as APSFR will be shaded. Maps will be formatted in A3 landscape sheets with a scale of 1: 25 000 and available to the public free of charge from the web. The extent of each flood hazard map sheet and related flood risk map sheet will be the same in order to achieve a better comparability and comparison. The layout and contents of the maps was developed in the frame of a Twinning project “Development of Flood Hazard Maps and Flood Risk Maps” (http://twinning.voda.hr/). Flood hazards will be defined by use of 1D and 1D-2D hydraulical models and by other means in certain cases. For modelling purposes DTM is provided by State Geodetic Administration of the Republic of Croatia. It is foreseen that maps will be finished by the end of year 2014.
Flood Hazard and Flood Risk Maps of the Danube River Basin District 11
ICPDR / International Commission for the Protection of the Danube River / www.icpdr.org
2.8 Serbia Till mid 2013, flood extent mapping was mainly done within some international projects, but with the deep involvement of national competent authorities and experts. Although 99 APFRs were identified, flood hazard maps were computed for 27 of those: the Danube (Danube FLOODRISK and SoFPAS projects), rivers in the Morava River Basin (Velika Morava, Južna Morava, Zapadna Morava and 20 of their tributaries, SoFPAS project), the Tamnava and Ub rivers in the Sava River Basin (project financed by Swedish EPA, 2010).
The methodology for flood hazard mapping in these projects was almost the same, and flooding extent for medium (Q100) and low probability flood scenario (Q1000) was determined. These scenarios were previously used in many national studies including the Water Management Master Plan (2001).
In all projects, 1D steady-state hydraulic models were applied to compute water levels, taking into account the existing flood protection infrastructure. The projection of water levels over the terrain gave the maximal extent of “flood-prone” areas. In the Danube FLOODRISK project, the extent of Q100 is determined by the existing levees. If flood protection structures are adequately designed and maintained, this area is specially marked as a “protected area”.
Due to financial constraints, lidar surveys were not possible and DTM was produced by digitalisation of topographic maps 1:25,000 scale, and than adjusted using the available aerial or satellite data, digitalized maps of 1:5,000 scale, additional ground surveys and the like. Thus, DTM has vertical accuracy of app. 0.50 m at the 95% confidence level or RMSE of 0.25 m.
Q100 and Q1000 were defined using one flood peak data per year, in the period 1950-2006, and LP III distribution. Climate change investigations are still on-going, and thus they have not been taken into account.
2.9 Bosnia and Herzegovina This information was prepared only for a part of the Sava River Basin in Federation B&H because in the Republic of Srpska the data collection for the PFRA is still ongoing. According to the legislation of the Federation of Bosnia and Herzegovina, the deadline for preparation of flood hazard and risk maps is 2015.
First step for the preparation of flood hazard maps and risk maps was adopting the areas with extremely significant and significant risk of flooding, defined as Areas for further assessment (AFA´s). Previous flood defence projects were based on the existing geodetic maps. 16 flood polygons were identified out of which 11 were for the rivers with a catchment area size > 4000 km2. Flooding areas (maps) defined in those project are planned to be updated. The maps described floods with a high probability (1/20), floods with a medium probability (1/100) and floods with a low probability, or extreme event scenarios (1/500), but there were no data on velocities and depths. For those areas a risk index was estimated.
Hydrodynamics flow models (1D) that included velocities and depths were prepared for:
• river Bosna (6 flooded areas from municipalities Ilidža to Doboj with total length of 29,6 km)
• river Una with Sana ( river stretch is about 10 km of flooded areas through Kulen Vakuf municipality on Una river, on Sanica is 11 km and on Sana river 13,5 km)
Geodetic survey (cross sections) was available for main river channel. Inundation areas were extended with Digital model of terrain (DMT). Resolutions for the main channel were 1x1m and for inundation areas 50 x50 m. Hydrological models were also available for the above mentioned river sub basins. Statistic calculations were done for the reference period 1961-1990. The maximum discharges with probability of occurrence 1/20, 1/100 and 1/500 were indicated.
Flood Hazard and Flood Risk Maps of the Danube River Basin District 12
ICPDR / International Commission for the Protection of the Danube River / www.icpdr.org
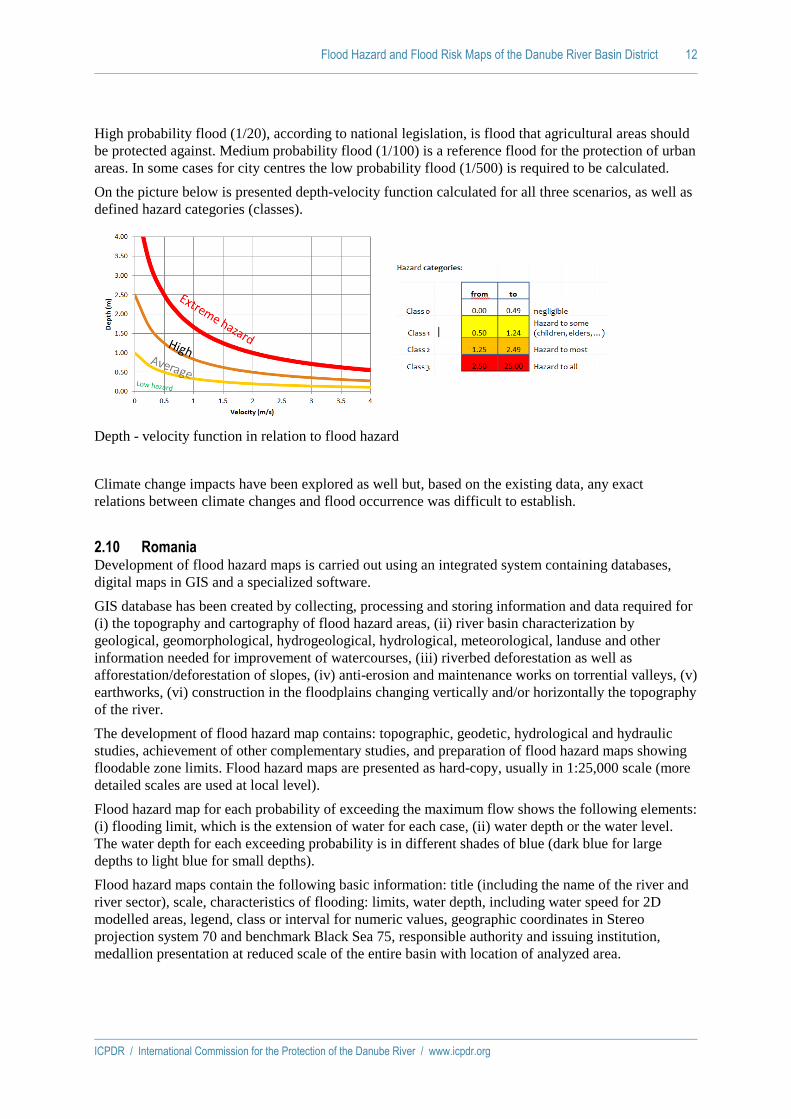
High probability flood (1/20), according to national legislation, is flood that agricultural areas should be protected against. Medium probability flood (1/100) is a reference flood for the protection of urban areas. In some cases for city centres the low probability flood (1/500) is required to be calculated.
On the picture below is presented depth-velocity function calculated for all three scenarios, as well as defined hazard categories (classes).
Depth - velocity function in relation to flood hazard
Climate change impacts have been explored as well but, based on the existing data, any exact relations between climate changes and flood occurrence was difficult to establish.
2.10 Romania Development of flood hazard maps is carried out using an integrated system containing databases, digital maps in GIS and a specialized software.
GIS database has been created by collecting, processing and storing information and data required for (i) the topography and cartography of flood hazard areas, (ii) river basin characterization by geological, geomorphological, hydrogeological, hydrological, meteorological, landuse and other information needed for improvement of watercourses, (iii) riverbed deforestation as well as afforestation/deforestation of slopes, (iv) anti-erosion and maintenance works on torrential valleys, (v) earthworks, (vi) construction in the floodplains changing vertically and/or horizontally the topography of the river.
The development of flood hazard map contains: topographic, geodetic, hydrological and hydraulic studies, achievement of other complementary studies, and preparation of flood hazard maps showing floodable zone limits. Flood hazard maps are presented as hard-copy, usually in 1:25,000 scale (more detailed scales are used at local level).
Flood hazard map for each probability of exceeding the maximum flow shows the following elements: (i) flooding limit, which is the extension of water for each case, (ii) water depth or the water level. The water depth for each exceeding probability is in different shades of blue (dark blue for large depths to light blue for small depths).
Flood hazard maps contain the following basic information: title (including the name of the river and river sector), scale, characteristics of flooding: limits, water depth, including water speed for 2D modelled areas, legend, class or interval for numeric values, geographic coordinates in Stereo projection system 70 and benchmark Black Sea 75, responsible authority and issuing institution, medallion presentation at reduced scale of the entire basin with location of analyzed area.
Flood Hazard and Flood Risk Maps of the Danube River Basin District 13
ICPDR / International Commission for the Protection of the Danube River / www.icpdr.org
2.11 Bulgaria The flood hazard maps in Bulgaria are being prepared according to a national methodology, developed by the National Institute of Meteorology and Hydrology and have been endorsed by the Minister of Environment and Water in April 2013.
In line with the national legislation, flood-hazard maps include flood-scenarios with return periods 20, 100 and 1000 years.
The methodology defines the requirements for all type of data used for the mapping: hydrological data and methods of calculation; cross-section’s measurement; terrain models. For the water-level calculation most commonly 1D-modelling is used, but for some river sections (where it is appropriate) 2D-modelling could be applied.
For each APSFR, a flood-extent map indicating the inundated areas for all three scenarios shall be prepared. A flood depth map, showing the water depth by shades of blue colour in classification-boundaries 0; 0.5; 1; 1,5; 2; 2.5; 3 and 4 m shall also be prepared for each scenario. A flood-danger map presenting the level of the flood–danger in different colours depending of the flood depth is to be prepared for each flood-scenario. Four levels of flood danger are determined:
Depth [m] Danger-level Map-colour
< 0.5 Low green
0.5 ÷ 1.5 Middle yellow
1.5 ÷ 2.5 Significant orange
> 2.5 Very high red
Additionally, where it was considered as appropriate (i.e. when 2D-modeling has been applied), a map representing the flow-direction and the flow-velocity shall be prepared. The flood-velocity is to be displayed by colour arrows in three classes: 0.2 - 0.5 m/s (green) ; 0,5 - 2 m/s (yellow); >2m/s (red)
Flood hazard maps shall be presented in a scale 1: 2500 ÷ 1:10000 depending on the specifics of the mapped area.
The flood maps for all APSFR in Bulgaria (except The Danube) are being prepared in the frame of an ongoing project “Development of Flood Risk Management Plans” funded by the Operational Program “Environment”. The tender procedure is in preparation. The project-activities include also the creation of precise digital elevation model by LIDAR-scanning, which is to be used in the flood-hazard mapping.
The flood-hazard maps for the Danube River have been developed under the DanubeFloodrisk project according to the commonly agreed methodology and in close coordination with the Romanian partners.
Flood Hazard and Flood Risk Maps of the Danube River Basin District 14
ICPDR / International Commission for the Protection of the Danube River / www.icpdr.org
3 Flood risk maps in the DRBD Countries
3.1 Germany Flood risk maps are prepared for the same flood scenarios on the basis of the flood hazard maps. They show not only the flood hazards (extent of flooding) but also the adverse consequences of flooding.
The basic data for the number of potentially affected inhabitants are the number of inhabitants in each municipality (statistical data) and land use data (ATKIS-DLM or ALK/ALKIS). As a general rule, inhabitants’ affectedness can be taken as a given if the inundation area overlaps with an area of housing or mixed use. The indicative number of inhabitants potentially affected can be determined by assuming that the inhabitants of a municipality are evenly distributed throughout the specified areas.
The type of economic activity can be derived from the ATKIS-Basis-DLM object types. The individual areas, groups and types of object must be summarized in categories. At least following categories are used, in addition to areas of water:
• housing and mixed use:
• industrial and commercial areas, areas of a special functional character
• all types of object of relevance to transport
• agriculture
• forestry
• all water-related object types
• all other object types
Installations of the types listed in Council Directive 2010/75/EU of 24th November 2010 that are located in inundation areas are included on the maps. Where this data are not available, the installations that are listed in E- PRTR or in Annex I of Council Directive 96/61/EC are used.
Bodies of water which, pursuant to Article 7 of the Water Framework Directive (WFD), are used for the abstraction of water intended for human consumption, bathing waters and protected areas under the Habitats Directive and bird sanctuaries are shown as protected areas.
Sites of particular cultural relevance (UNESCO world heritage data and if applicable museums, archives and cultural heritages from specific importance) are also included in the flood risk maps.
3.2 Austria The main goal is to provide flood risk maps to communicate the risk to the public. Therefore, the maps need to be understandable and interpretable based on the information displayed in connection with the legend provided.
The indicative number of inhabitants affected had been assessed by means of building register data which is available on a daily basis considering inhabitants and employees. People exposed are displayed on municipality level in clusters of <50; 50 – 500; 500 – 5000 and > 5000, respectively. The type of economic activity affected is assessed based on Corine Land Cover (2006) data, NAVTEQ data, data on infrastructure and UNESCO world heritage data. The location of IPPC installations are outlined based on the E-PRTR register and information on relevant landfills. The impact on WFD protected areas is assessed for protected areas, Natura2000 areas, national parks and bathing freshwater. Other information considered relevant are areas with floods with increased sediment transport (e.g. Alpine areas) or debris flow.
Flood Hazard and Flood Risk Maps of the Danube River Basin District 15
ICPDR / International Commission for the Protection of the Danube River / www.icpdr.org
3.3 Czech Republic Risk maps combine information about hazard and about vulnerability of objects in floodplains. Information about vulnerability is obtained from land use zoning plans, general maps and field work. Based on this information classes of functional land use are set (see the column „Functional regulation“ in the Table below). The value of maximum acceptable risk is determined for each of the classes. Risk maps show areas where the maximum acceptable risk is exceeded. In these areas the values of hazard are expressed based on the classification and description of hazard in floodplains using the Risk Matrix method.
Table: Classes of functional land use according to land use zoning plans
Notation
Functional regulation Maximal
acceptable hazard
BY Living Low
DO Transport and technical infrastructure Low
OV Civic amenities Low
VY Production Low
ZV Agricultural production Low
SR Sport and collective recreation Middle
LE Forests, greenery High
OP Arable land, meadows, grazing High
The methodology is focused on risk analysis in floodplains. It determinates the usable source of data in the Czech Republic, the procedures and methods for the assessment of flood hazard consequences. The methodology will be included in a Directive of the Ministry of Environment of the Czech Republic and in some other legislative and economic directives.
3.4 Slovakia The legal framework for the elaboration flood risk maps is defined by the Flood protection Act no. 7/2010 Coll. The Article 7 thereof sets the content of the flood risk maps i.e. the flood extent of modelled scenarios, the number of affected inhabitants, types of economy activities, localities with industrial activities that potentially could cause water pollution accidence, localities of water use for consumption and recreation, localities of bathing waters, information about potential contamination of waters on a case of flooding and localities of the national nature conservation and those under NATURA 2000. The flood risk maps are elaborated following to a previous mutual exchange of data between neighbouring countries for the areas of potentially significant flood risks located close to the state border. Specific rules of the flood risk maps elaboration and processing are set by the Decree of the Ministry of Environment of the Slovak Republic no. 419/2010 Coll. The Flood protection Act and the Decree define as subsequent type of flood hazard map the inundation maps, that are issued by the water management authority and provided to the state administration and municipality with the aim to define the areas of potential flood extent and applied inundation areas in a frame of spatial planning. For these areas the Flood protection Act very strictly defines the prohibited and permitted activities as a tool for elimination of potential damages.
Flood Hazard and Flood Risk Maps of the Danube River Basin District 16
ICPDR / International Commission for the Protection of the Danube River / www.icpdr.org
3.5 Hungary Based on the different scenarios’ extents the necessary risk evaluation was carried out in separate maps for proper visualization.
• Population affected: estimated number of inhabitants who live in settlements that are spatially overlapping with the inundation (2001 data). The indication of the value is the size of the dot mark.
• Economic activity: the classification is based on the CORINE land cover data set. The important roads and railways, SEVESO objects, power plants, sewage treatment plants, harbours, airports and other industrial facilities were added from the river basin management plans.
• IED installations: the E-PRTR facilities were taken in account on the maps with harmonized classification.
• WFD protected areas: updated data from the river basin management plans were used, such as freshwater sources, recreational areas and protected landscapes. The surface water affected groundwater is also presented.
3.6 Slovenia FD requirements concerning flood hazard and risk maps were transposed with a Decree on establishment of flood risk management plans (Official Gazette of the RS, No. 7/2010). This Decree refers to the Rules on methodology to define flood risk areas and erosion areas connected to floods and classification of plots into risk classes (Official Gazette of the RS, No. 60/2007), which define the flood risk map as a detailed map (scale >1:5000) showing the risk classes for areas containing groups of endangered elements regarding their vulnerability and flood hazard class. Risk classes (low, medium and high risk) are calculated from a matrix relating four vulnerability classes of different types of endangered elements and four hazard classes of an area. Damage potential data are derived from Land use data for agricultural and forest plots (2013), Central population register (2010) and Business Register of Slovenia (2010) combined with Register of spatial units (2010), Building cadastre (2013) and Real estate register (2013), Cultural heritage register (2011), Register of Natura2000 areas (2009), Register of protected areas (2009), Register of ecologically important areas (2009), Register of natural values (2009), Register of water protection zones (2009), Register of bathing water areas (2012), IPPC and SEVESO register (2011), Cadastre of public infrastructure (2011) and other relevant national databases defining locations of schools, kindergartens; hospitals, health resorts, retirement homes; archives, museums, libraries; emergency and rescue services. Finally, the statistic data of risk areas and endangered elements are calculated, and results are used for determination of flood protection objectives, as well for the cost-effectiveness analysis of possible risk reduction measures.
3.7 Croatia The main purpose of flood risk maps is to enable as clear communication to the public as possible. For each APSFR three maps, one for each scenario, will be delivered. Potentially affected people will be displayed on settlement level as a symbols, grouped in four categories (0, 1-100, 100-1000, >1000 inhabitants). Places with a significant number of more vulnerable population such as hospitals, elementary schools, pre-school institutions and homes for elderly will be marked as symbols. Economic activities and land cover will be displayed in flooded areas only and grouped in five categories (residential areas; significant economic activities and industry; agriculture; forests and other natural areas; water). Additionally, areas which are designated for building in spatial plans will be shown. The way of presentation of the protected areas is still under discussion due to their overlapping with other contents such as the contaminated areas they are covering which would make
Flood Hazard and Flood Risk Maps of the Danube River Basin District 17
ICPDR / International Commission for the Protection of the Danube River / www.icpdr.org
maps less comprehensible to the public. Potential significant polluters, the IPPC and SEVESO II installations, waste dumps and waste water treatment plants will be displayed as symbols. Significant transport infrastructure and other landmarks are included being not only risk receptors but also serving as an aid for the orientation for general public. Maps will be formatted in A3 landscape sheets in a scale of 1: 25 000 and available to the public free of charge from the web. The layout and contents of the maps was developed in the frame of a Twinning project “Development of Flood Hazard Maps and Flood Risk Maps” (http://twinning.voda.hr/). Main data sources for flood risk maps are the population census 2011, Corine land cover, municipal spatial plans, Register of protected areas and other official spatial databases with national coverage. Additional data collection will be performed if required. It is foreseen that maps will be finished by the end of year 2014.
3.8 Serbia Slightly different methodologies for flood risk assessment were used in the flood mapping projects in Serbia mentioned in 2.8. SoFPAS project recognized five groups of risk receptors:
• Population. Spatial data on municipalities (polygons) and settlements (points), results of 2002 census, and CLC data on continuous and discontinuous urban fabric were used to determine a number of inhabitants in the flood-prone area. Also data on specially vulnerable categories (hospitals, elementary schools, kindergartens and homes for the elderly) were collected from respective ministries.
• Economic activities. CLC data were used to distinguish industry, agriculture, service activities, or mixed economic activities.
• Environment. "Risk emitters" and "risk receptors" were differentiated. Data on "risk emitters" (as IPPC installations and waste landfills) were provided by Serbian Environmental Protection Agency. Data on "risk receptors" (areas sensitive to pollution as spaces used for abstraction of water intended for human consumption, recreational and bathing waters, protected habitats) were taken from Spatial plan of the Republic of Serbia.
• Cultural heritage (monuments, monasteries, fortress, castles and archaeological sites).
• Infrastructure (road and railroad network, river ports and airports, river training and flood protection structures, other water infrastructure) was recognized as a special class of risk receptors. Namely, these are structures of significant value, and by their destruction or flooding indirect large-scale damages can be caused (such as: preventing the movement and evacuation of the population, the interruption of telecommunications, the suspension of supply of goods and services, etc.).
Summary data on flood risk in Serbia, presented on DRB maps, are related only to the processed 27 APFRs.
3.9 Bosnia and Herzegovina
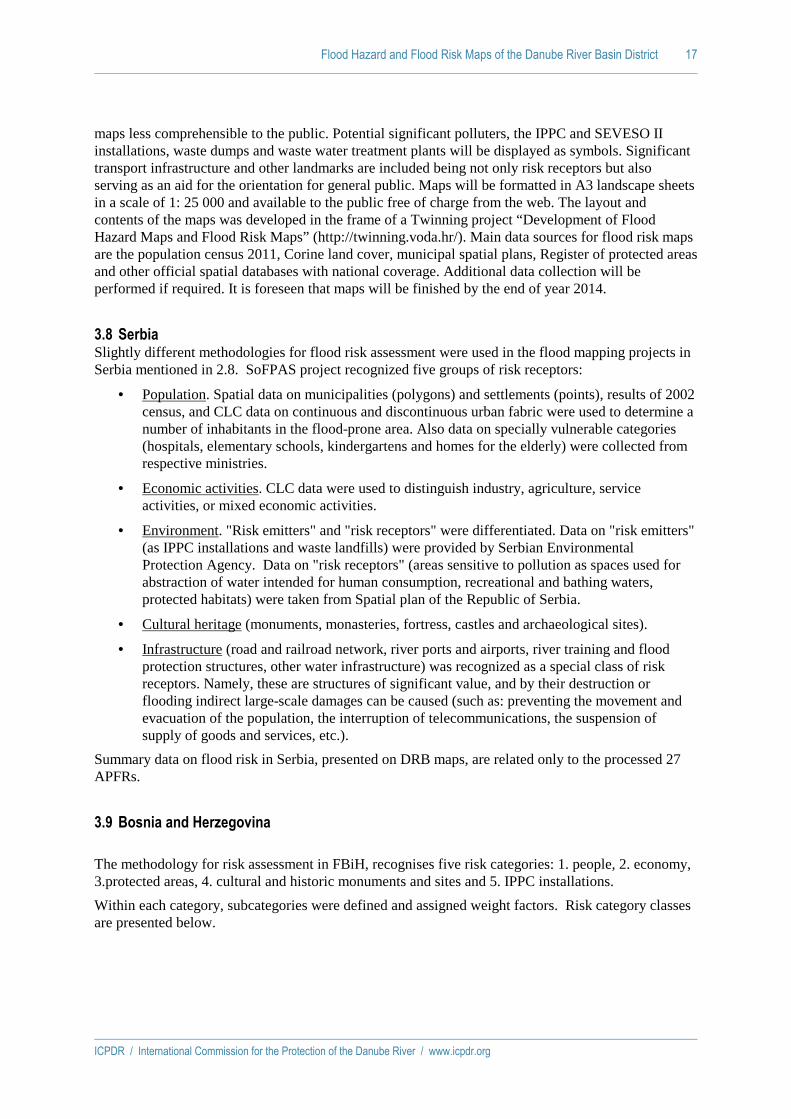
The methodology for risk assessment in FBiH, recognises five risk categories: 1. people, 2. economy, 3.protected areas, 4. cultural and historic monuments and sites and 5. IPPC installations.
Within each category, subcategories were defined and assigned weight factors. Risk category classes are presented below.
Flood Hazard and Flood Risk Maps of the Danube River Basin District 18
ICPDR / International Commission for the Protection of the Danube River / www.icpdr.org
So five thematic risk maps can be prepared.
Risk = ∑n • Weight • Hazard
Where n is subcategory. The calculated risk is normalized, where minimal, or no risk is 0 value and maximal risk is 1.
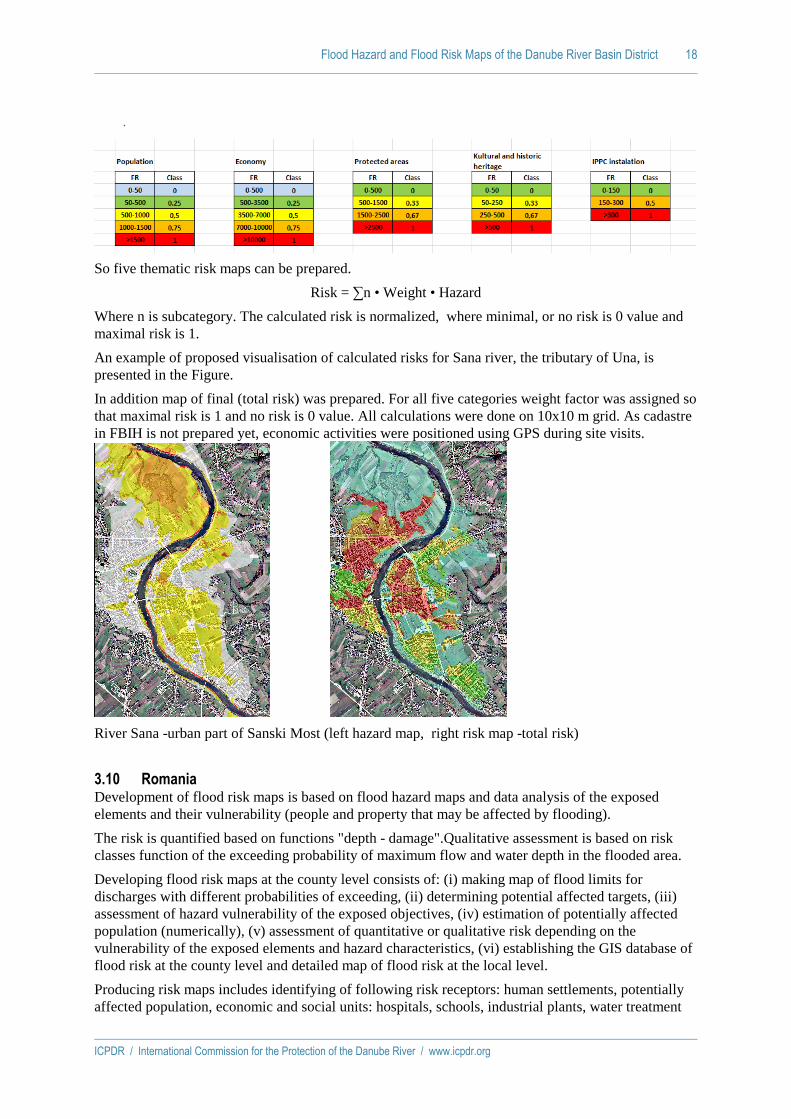
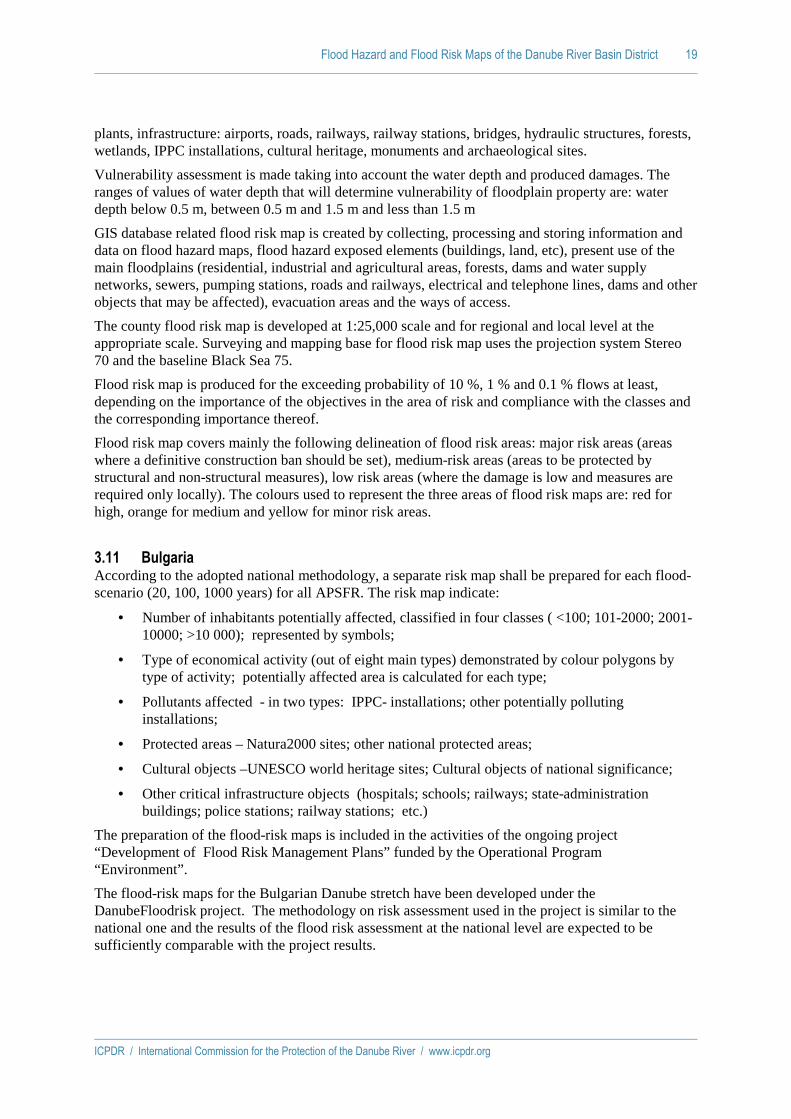
An example of proposed visualisation of calculated risks for Sana river, the tributary of Una, is presented in the Figure.
In addition map of final (total risk) was prepared. For all five categories weight factor was assigned so that maximal risk is 1 and no risk is 0 value. All calculations were done on 10x10 m grid. As cadastre in FBIH is not prepared yet, economic activities were positioned using GPS during site visits.
River Sana -urban part of Sanski Most (left hazard map, right risk map -total risk)
3.10 Romania Development of flood risk maps is based on flood hazard maps and data analysis of the exposed elements and their vulnerability (people and property that may be affected by flooding).
The risk is quantified based on functions "depth - damage".Qualitative assessment is based on risk classes function of the exceeding probability of maximum flow and water depth in the flooded area.
Developing flood risk maps at the county level consists of: (i) making map of flood limits for discharges with different probabilities of exceeding, (ii) determining potential affected targets, (iii) assessment of hazard vulnerability of the exposed objectives, (iv) estimation of potentially affected population (numerically), (v) assessment of quantitative or qualitative risk depending on the vulnerability of the exposed elements and hazard characteristics, (vi) establishing the GIS database of flood risk at the county level and detailed map of flood risk at the local level.
Producing risk maps includes identifying of following risk receptors: human settlements, potentially affected population, economic and social units: hospitals, schools, industrial plants, water treatment
Flood Hazard and Flood Risk Maps of the Danube River Basin District 19
ICPDR / International Commission for the Protection of the Danube River / www.icpdr.org
plants, infrastructure: airports, roads, railways, railway stations, bridges, hydraulic structures, forests, wetlands, IPPC installations, cultural heritage, monuments and archaeological sites.
Vulnerability assessment is made taking into account the water depth and produced damages. The ranges of values of water depth that will determine vulnerability of floodplain property are: water depth below 0.5 m, between 0.5 m and 1.5 m and less than 1.5 m
GIS database related flood risk map is created by collecting, processing and storing information and data on flood hazard maps, flood hazard exposed elements (buildings, land, etc), present use of the main floodplains (residential, industrial and agricultural areas, forests, dams and water supply networks, sewers, pumping stations, roads and railways, electrical and telephone lines, dams and other objects that may be affected), evacuation areas and the ways of access.
The county flood risk map is developed at 1:25,000 scale and for regional and local level at the appropriate scale. Surveying and mapping base for flood risk map uses the projection system Stereo 70 and the baseline Black Sea 75.
Flood risk map is produced for the exceeding probability of 10 %, 1 % and 0.1 % flows at least, depending on the importance of the objectives in the area of risk and compliance with the classes and the corresponding importance thereof.
Flood risk map covers mainly the following delineation of flood risk areas: major risk areas (areas where a definitive construction ban should be set), medium-risk areas (areas to be protected by structural and non-structural measures), low risk areas (where the damage is low and measures are required only locally). The colours used to represent the three areas of flood risk maps are: red for high, orange for medium and yellow for minor risk areas.
3.11 Bulgaria According to the adopted national methodology, a separate risk map shall be prepared for each flood-scenario (20, 100, 1000 years) for all APSFR. The risk map indicate:
• Number of inhabitants potentially affected, classified in four classes ( <100; 101-2000; 2001-10000; >10 000); represented by symbols;
• Type of economical activity (out of eight main types) demonstrated by colour polygons by type of activity; potentially affected area is calculated for each type;
• Pollutants affected - in two types: IPPC- installations; other potentially polluting installations;
• Protected areas – Natura2000 sites; other national protected areas;
• Cultural objects –UNESCO world heritage sites; Cultural objects of national significance;
• Other critical infrastructure objects (hospitals; schools; railways; state-administration buildings; police stations; railway stations; etc.)
The preparation of the flood-risk maps is included in the activities of the ongoing project “Development of Flood Risk Management Plans” funded by the Operational Program “Environment”.
The flood-risk maps for the Bulgarian Danube stretch have been developed under the DanubeFloodrisk project. The methodology on risk assessment used in the project is similar to the national one and the results of the flood risk assessment at the national level are expected to be sufficiently comparable with the project results.
Flood Hazard and Flood Risk Maps of the Danube River Basin District 20
ICPDR / International Commission for the Protection of the Danube River / www.icpdr.org
4 Flood maps for the DRBD
4.1 Transboundary cooperation in DRBD The technical cooperation in implementation of FD at the level of DRBD is carried out by the ICPDR Flood Protection Expert Group (FP EG). The FP EG meets twice a year to discuss the modalities of FD implementation. The preparation of flood hazard and risk maps on the level A according to the FD Art. 6 has been discussed by the FP EG since 2010 and it was a follow-up process to the concept of minimum recommendations for flood risk mapping in the Danube River Basin agreed by the ICPDR in 2007 in the frame of implementation of the ICPDR Action Programme for Sustainable Flood Protection in DRB adopted in 2004. In September 2012 an ICPDR Workshop on Flood Hazard and Flood Risk Maps for the Danube River Basin District was organized having the following objectives:
• To present the views of the European Commission and international river basin commissions in responding to the requirements of the Art. 6. of the Directive 2007/60/EC.
• To review the current status of the preparation of flood hazard and flood risk maps at the national level.
• To discuss the modalities of reporting to EC by the international river basin commissions in relation to Art 6. of the Directive 2007/60/EC.
• To further discuss the flood hazard and flood risk maps for the Danube River Basin District (level A) proposed at the 21st FP EG meeting and the availability of the necessary data.
• To examine the modalities of collection of the national data for preparation of flood hazard and flood risk maps for the Danube River Basin District.
• To agree upon the time plan for map preparation and for reporting to EC.
At this workshop the general design of the flood hazard and flood risk maps has been agreed by the FP EG which was then adopted by the ICPDR at the 15th Ordinary Meeting in December 2012.
4.2 Flood hazard map
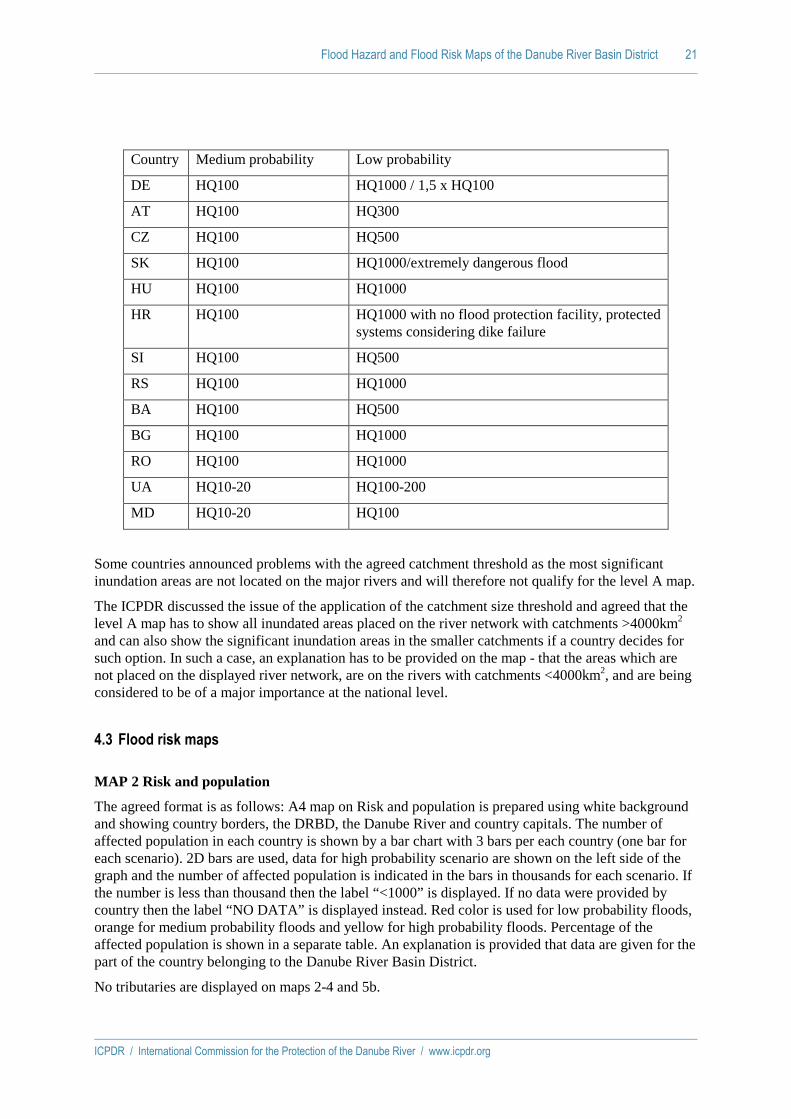
MAP 1 Hazard and flooding scenarios
The agreed format is as follows: A3 map of flood hazard and flooding scenarios, showing the DRBD and rivers with catchment areas >4000km2, lakes >100km2, transitional and coastal waters. The large flood hazard areas are reported and displayed as polygons, while smaller areas are reported as lines or points (the same criteria as used for the APSFR map1). The map shows the flood hazard area polygons using zero outline thickness.
The ICPDR agreed that two scenarios (flood hazard areas with medium and low probabilities) are relevant for the level of the international river basin district. Red color is used on the map for the low probability floods (extreme events) and orange color for the medium probability floods. Medium probability scenario is shown on top of the low probability scenario, so in some cases it can overlay the low probability scenario. If no information is available, the whole country’s area is displayed with a grey overlay.
The national definitions of floods with medium and low probability are as follows:
1 Areas >=100km² as polygons, areas < 100km² and river stretches >= 50 river-km as lines, and areas < 100km² and river stretches < 50 river-km as points
Flood Hazard and Flood Risk Maps of the Danube River Basin District 21
ICPDR / International Commission for the Protection of the Danube River / www.icpdr.org
Country Medium probability Low probability
DE HQ100 HQ1000 / 1,5 x HQ100
AT HQ100 HQ300
CZ HQ100 HQ500
SK HQ100 HQ1000/extremely dangerous flood
HU HQ100 HQ1000
HR HQ100 HQ1000 with no flood protection facility, protected systems considering dike failure
SI HQ100 HQ500
RS HQ100 HQ1000
BA HQ100 HQ500
BG HQ100 HQ1000
RO HQ100 HQ1000
UA HQ10-20 HQ100-200
MD HQ10-20 HQ100
Some countries announced problems with the agreed catchment threshold as the most significant inundation areas are not located on the major rivers and will therefore not qualify for the level A map.
The ICPDR discussed the issue of the application of the catchment size threshold and agreed that the level A map has to show all inundated areas placed on the river network with catchments >4000km2
and can also show the significant inundation areas in the smaller catchments if a country decides for such option. In such a case, an explanation has to be provided on the map - that the areas which are not placed on the displayed river network, are on the rivers with catchments <4000km2, and are being considered to be of a major importance at the national level.
4.3 Flood risk maps
MAP 2 Risk and population
The agreed format is as follows: A4 map on Risk and population is prepared using white background and showing country borders, the DRBD, the Danube River and country capitals. The number of affected population in each country is shown by a bar chart with 3 bars per each country (one bar for each scenario). 2D bars are used, data for high probability scenario are shown on the left side of the graph and the number of affected population is indicated in the bars in thousands for each scenario. If the number is less than thousand then the label “<1000” is displayed. If no data were provided by country then the label “NO DATA” is displayed instead. Red color is used for low probability floods, orange for medium probability floods and yellow for high probability floods. Percentage of the affected population is shown in a separate table. An explanation is provided that data are given for the part of the country belonging to the Danube River Basin District.
No tributaries are displayed on maps 2-4 and 5b.
Flood Hazard and Flood Risk Maps of the Danube River Basin District 22
ICPDR / International Commission for the Protection of the Danube River / www.icpdr.org
MAP 3 Risk and economic activity
The agreed format is as follows: Three A4 maps are presented (one for each scenario) using white background and showing country borders, the DRBD, the Danube and country capitals. Each map shows a 2D pie chart for each country displaying the share of inundated area by class of economic activity. If no data were provided by country then the label “NO DATA” is displayed instead. The size of the affected total area in thousand km² is shown below each pie chart. Corine LC colors are used in the chart. An explanation is provided that data are given for the part of the country belonging to the Danube River Basin District.
ICPDR agreed on the following aggregation of Corine Land Cover classes to be used for reporting of economic activities:
• Agriculture: 2.1.1 - 2.4.4 (all agricultural areas)
• Industry: 1.2.1 (industrial and commercial units)
• Infrastructure: 1.2.2 - 1.2.4, 1.3.1 - 1.3.2 (road and rail networks, sea ports, airports, mineral extraction sites, dumps)
• Urban areas: 1.1.1, 1.1.2, 1.4.1, 1.4.2 (urban fabric, green urban areas, sport and leisure facilities)
• Others: all other classes
MAP 4 Risk and installations with the potential to cause pollution
ICPDR agreed that this map should have the same layout as the Map 2. The charts show the number of IPPC and Seveso installations in each country.
MAP 5 WFD protected areas
ICPDR agreed on two maps: One is based on the available Danube RBMP map of areas designated for the protection of habitats or species where the maintenance or improvement of the status of water is an important factor in their protection, including relevant NATURA 2000 sites designated under Directive 92/43/EEC and Directive 79/409/EEC. The other map of affected areas designated for the abstraction of water intended for human consumption under WFD Article 7 and of the affected bodies of water designated as recreational waters, including areas designated as bathing waters under Directive 76/160/EEC follows the layout of the other risk maps as indicated above.
MAP 5a
This is an A3 map, showing protected areas (based on DRBMP Map 9) superposed by the flood hazard areas (for low probability floods scenario). Only the overlapping flood hazard areas are displayed (in red). The different types of protected areas (Bird, Habitat and other protected areas) are not distinguished.
MAP 5b
This is an A4 map with the same layout as the map 2. The number of affected protected areas in each country is shown by a bar chart - with 3 bars per each country (one bar for each scenario). The total numbers of affected areas designated for the abstraction of water intended for human consumption under WFD Article 7, and of the affected bodies of water designated as recreational waters, including areas designated as bathing waters under Directive 76/160/EEC, is indicated in the bars.
The ICPDR agreed that the >4000km2 catchment threshold has to be applied also for all risk maps, to keep the consistence between the hazard and risk maps.
All maps are shown in the ANNEX 1.
Flood Hazard and Flood Risk Maps of the Danube River Basin District 23
ICPDR / International Commission for the Protection of the Danube River / www.icpdr.org
5 Related international activities
5.1 Danube FLOODRISK project The Danube FLOODRISK was a three-year project focusing on the most cost-effective measures for flood risk reduction: risk assessment, risk mapping, involvement of stakeholders, risk reduction by adequate spatial planning. The project brought together scientists, public servants, NGOs and stakeholders who developed jointly a scalable system of flood risk maps for the Danube River floodplains. Transnational methodology and models have been defined and implemented for flood risk assessment and mapping.
The overall objective of the FLOODRISK project was to develop and produce high quality, stakeholder oriented flood hazard and risk maps for the transnational Danube river floodplains to provide adequate risk information for spatial planning and economic requests. Risk information was the basis for sustainable development along the Danube River. The goal was to link scientific progress in harmonization of approaches and data with practically oriented stakeholder and end user involvement. The project’s single objectives were:
• Development of a joint mapping method for flood risk and harmonization of data sources.
• Production and provision of risk maps and risk information.
• Integration of relevant stakeholders and users on different levels into the definition and realization processes.
• Involvement of different economic aspects of land use in the river basin like spatial planning, recreation and agriculture as well as energy supply or health service.
• Linkage of flood risk mapping and provision of maps as basis for planning, e.g. within the EU Floods Directive.
• Development and distribution of exemplary procedures within the Danube countries and beyond.
• Reflection of the EU Directives, e.g. WFD, Floods Directive, providing feedback based on the experiences of the project cooperation by using the platform of the ICPDR Flood Protection Expert Group.
The project contributed with these objectives to the improvement of the institutional cooperation of the ICPDR and further towards the realization of measures within the existing international cooperation structure. It supported decisions for investments on political and administrative levels by allowing the assessment of investments and land use decisions taking into account the Joint Program of Measures, based on the risk reduction aspects.
More information can be received at http://www.danube-floodrisk.eu/
The maps in PDF format are also available on the ICPDR web site: http://www.icpdr.org/main/activities-projects/danube-floodrisk-project.
5.2 CEframe Austria, Czech Republic, Hungary and Slovakia participated in the transnational project CEframe. The project partners were the ministries and regional authorities responsible for flood protection, the project lead was conducted by the Water Management Administration of the Regional Government of Lower Austria.
For a successful flood management in the region with many transboundary rivers a well coordinated approach is essential. The aim of the project was the harmonization of the existing and future flood
Flood Hazard and Flood Risk Maps of the Danube River Basin District 24
ICPDR / International Commission for the Protection of the Danube River / www.icpdr.org
protection strategies in the CENTROPE-Region, focusing on the cross-border rivers March (Morava), Thaya (Dyje), Leitha (Lajta) and Danube.
For the first time the relevant institutions of the four countries were jointly working on a multilateral plan for prospective flood management in the project region comprising:
• the documentation of current flood protection including an Inventory of hydrologic and hydraulic conditions and harmonized flood maps;
• documentation of existing land uses and potential flood damage, flood risk assessment and calculation of residual risk;
• flood management strategies including recommendations for transregional cooperation;
• proposals for future joint action including a catalogue of risk management strategies and a charta of flood protection.
The results provided by the CEframe project are compliant with the EU Floods Directive. They support decision makers in the regional administrations and in the transboundary commissions. The project duration was May 2010 - March 2013. It was funded by the European Regional Development Fund. More information on: http://www.ceframe.eu/
6 List of national links for finding more detailed information
6.1 Germany www.hochwasser.baden-wuerttemberg.de
www.lfu.bayern.de/hochwasserrisikomanagement
6.2 Austria http://wisa.bmlfuw.gv.at / Wasser Karten / Hochwasser
6.3 Czech Republic http://hydro.chmi.cz/cds
6.4 Slovakia http://www.minzp.sk/oblasti/voda/ochrana-pred-povodnami/
6.5 Hungary http://www.vizugy.hu/index.php?module=content&programelemid=62
6.6 Slovenia mko.gov.si/si/delovna_podrocja/voda/poplavna_direktiva/
Flood Hazard and Flood Risk Maps of the Danube River Basin District 25
ICPDR / International Commission for the Protection of the Danube River / www.icpdr.org
6.7 Bosnia and Herzegovina http://www.voda.ba/loc/ (Sava River Watershed Agency, Sarajevo)
6.8 Romania http://www.rowater.ro/EPRI/EPRI.aspx (preliminary risk assessment).
http://www.rowater.ro/HH%20si%20HRI/HH%20si%20HRI.aspx (hazard and risk maps).
7 Conclusions
FD stipulates that in order to have available an effective tool for information, as well as a valuable basis for priority setting and further technical, financial and political decisions regarding flood risk management, it is necessary to provide for the establishing of flood hazard maps and flood risk maps showing the potential adverse consequences associated with different flood scenarios, including information on potential sources of environmental pollution as a consequence of floods.
The ICPDR Contracting Parties make joint efforts to implement the FD on the level of the Danube River Basin District and they use the ICPDR as the cooperation platform for this purpose. The Summary Report on implementation of Article 6 of the European Floods Directive in the Danube River Basin District demonstrates the practical outcomes of the commitment of the ICPDR Contracting Parties to cooperate towards a joint flood risk management policy in the Danube River Basin.
The report provides an overview of methods used at the national level for preparation of flood hazard maps in the DRBD Countries focusing on the approaches to identify, assess or calculate the flooding extent and flooding probabilities or return periods. A summary is also provided of methods (including criteria) used to prepare flood risk maps in the DRBD Countries. The available links to flood hazard and risk maps available electronically in the ICPDR Contracting Parties as well as to other relevant documents are given in a separate chapter. The key item of the report is presentation of flood hazard and flood risk maps for the Danube River Basin District including a detailed description of the applied criteria.
This report is an important step in the preparation of the flood risk management plan for the Danube River Basin District by 2015. It presents the first ever set of flood hazard and flood risk maps for the entire Danube catchment demonstrating to the public and stakeholders the results of cooperation of the Danube countries towards minimizing the risks from flooding.
This version of the report still lacks data from several countries in which the flood maps are still under preparation. The updated version of the maps will be presented in the flood risk management plan for the Danube River Basin District.