Embed Size (px)
Citation preview

Flonet
User Guide
Flonet User Guide
ii
NOTICE
The information in this document is subject to change without notice and should not be construed
as a commitment by ABB. ABB assumes no responsibility for any errors that may appear in this
document.
In no event shall ABB be liable for direct, indirect, special, incidental or consequential damages of
any nature or kind arising from the use of this document, nor shall ABB be liable for incidental or
consequential damages arising from use of any software or hardware described in this document.
This document and parts thereof must not be reproduced or copied without written permission from
ABB, and the contents thereof must not be imparted to a third party nor used for any unauthorized
purpose.
The software described in this document is furnished under a license and may be used, copied, or
disclosed only in accordance with the terms of such license.
TRADEMARKS
Microsoft, Windows, Excel and Visio are either registered trademarks or trademarks of Microsoft
Corporation in the United States and/or other countries. All other trademarks are the property of
their respective owners.
COPYRIGHT
Copyright © 2015-2016 ABB Limited. All Rights Reserved.
Document: Flonet User Guide
Revision: 1.0
Published: April 2016
Software: Flonet 2016
Version: 1.0.0
SUPPORT INFORMATION
This program is developed, maintained and supported by PEL Support Services, ABB. We run a
Hotline telephone and email service to answer any queries about Flonet.
Please let us have any suggestions on how you feel we could improve Flonet. You can contact us
by any of the following routes:
By Telephone: +44 (0)1925 74 1126 By Post: PEL Support Services
ABB Limited.
Daresbury Park
Daresbury
Warrington
Cheshire WA4 4BT
United Kingdom.
By Fax: +44 (0)1925 74 1265
By email: [email protected]

iii
Contents
Preface ........................................................................................................................ 1
About this guide ...................................................................................................... 1 Who should read this guide ............................................................................. 1 What is in this guide ........................................................................................ 1 How this guide is structured ............................................................................ 1 Conventions .................................................................................................... 2
Chapter 1 – Introduction ...................................................................................... 3
Introduction to Flonet .............................................................................................. 3 Flonet network properties ................................................................................ 3 Flonet network configurations ......................................................................... 3 Flonet calculation assumptions ....................................................................... 4
Overview of PEL ..................................................................................................... 5 Programs for fluid flow ..................................................................................... 5
Chapter 2 – Getting started ................................................................................ 7
Starting Flonet ......................................................................................................... 7 Starting Flonet from a drawing file .................................................................. 7
Quitting Flonet ......................................................................................................... 7 User interface .......................................................................................................... 8
Editor (data entry) dialogs ............................................................................... 9 Standard calculator dialogs ............................................................................. 9
User assistance..................................................................................................... 10 Online help .................................................................................................... 10 Online documentation ................................................................................... 11 PEL Support Services ................................................................................... 11
Chapter 3 – Quick Tour ...................................................................................... 13
Part 1 – Calculating pressure drops or flows ........................................................ 13 Part 2 – What’s new .............................................................................................. 16
Chapter 4 – Flonet basics ................................................................................. 19
Calculation overview ............................................................................................. 19 Creating a new diagram or drawing ...................................................................... 20
Creating a new diagram ................................................................................ 20 Opening an existing diagram file ................................................................... 20
Creating a Flonet piping diagram .......................................................................... 20 Managing the dockable windows .......................................................................... 23
Resizing dockable windows .......................................................................... 24 Showing/hiding the dockable windows .......................................................... 24 Auto-hiding the dockable windows ................................................................ 24 Working with multiple display monitors ......................................................... 25 Reverting to the original arrangement ........................................................... 25
Working with multiple diagrams ............................................................................ 26 Adding a blank diagram................................................................................. 26 Adding a connected diagram ........................................................................ 27 Connecting/disconnecting diagram connectors ............................................ 27

Flonet User Guide
iv
Removing a diagram ..................................................................................... 27 Renaming a diagram ..................................................................................... 28 Using tab groups ........................................................................................... 28 Showing or hiding a diagram ......................................................................... 29
Zooming in or out of a drawing ............................................................................. 29 Entering and editing data fields............................................................................. 30
Entering data fields ........................................................................................ 30 Converting units and values .......................................................................... 30 Copying and pasting cells ............................................................................. 31 Using standard calculators with a grid .......................................................... 31
Viewing information on your diagrams .................................................................. 31 Showing/hiding labels on the diagram .......................................................... 31 Showing alerts ............................................................................................... 32
Saving your Flonet diagram .................................................................................. 33 Printing your Flonet diagram ................................................................................. 33
Printing large diagrams ................................................................................. 33
Chapter 5 – Drawing features .......................................................................... 35
Add, Copy, Delete shapes .................................................................................... 35 Adding a shape (fitting) ................................................................................. 35 Connecting fittings ......................................................................................... 35 Copying shapes and connectors ................................................................... 35 Deleting shapes and connectors ................................................................... 36
Select, move, resize, and rotate shapes ............................................................... 36 Selecting shapes ........................................................................................... 36 Moving shapes .............................................................................................. 37 Resizing shapes ............................................................................................ 37 Rotating or flipping shapes ............................................................................ 37 Aligning shapes ............................................................................................. 38 Grouping shapes ........................................................................................... 38 Ordering shapes ............................................................................................ 39
Chapter 6 – Running a calculation ................................................................ 41
Entering inlet conditions ........................................................................................ 41 Entering data for an Inlet Tank ...................................................................... 41 Entering data for an inlet node ...................................................................... 42 Entering data for an inlet fitting ..................................................................... 42 Specifying the fluid in the network ................................................................. 43
Entering data for nodes and junctions .................................................................. 45 Entering data for multiple nodes ................................................................... 45 Entering data for an individual internal node ................................................. 46 Entering data for a tee junction ..................................................................... 46 Entering data for a node as a tee junction .................................................... 47 Entering data for an individual outlet node .................................................... 48
Entering data for pipes and fittings ....................................................................... 49 Entering data for multiple pipes ..................................................................... 49 Entering data for a single pipe ...................................................................... 50 Entering data for a heat exchanger ............................................................... 51 Entering data for a restriction orifice ............................................................. 51 Entering data for a diameter changer ............................................................ 52 Entering data for a block valve ...................................................................... 53 Entering data for a relief valve ...................................................................... 53 Entering data for a non return valve .............................................................. 54
Entering data for pumps ........................................................................................ 54 Entering data for multiple pumps .................................................................. 54 Entering data for an individual pump ............................................................. 55
Defining flow/pressure specifications .................................................................... 58 Changing flow/pressure specifications .......................................................... 59
Running the solver and viewing the results .......................................................... 59

Contents
v
Viewing the results ........................................................................................ 60 Filtering your results data .............................................................................. 60 Exporting your results data to Microsoft Excel .............................................. 61
Chapter 7 – Advanced features ...................................................................... 63
Special editor dialogs ............................................................................................ 63 Entering data for all elements ....................................................................... 63 Entering data by stream position ................................................................... 64
Generic fittings ...................................................................................................... 64 Entering data for a K Value fitting ................................................................. 65 Entering data for a Delta-P fitting .................................................................. 66
Using controllers ................................................................................................... 69 Flow Controller .............................................................................................. 69 Pressure Controller ....................................................................................... 70
Chapter 8 – Standard calculators .................................................................. 71
PPDS calculator .................................................................................................... 71 Saving the current stream ............................................................................. 73
Pipe inner diameter calculator .............................................................................. 73 Pipe roughness calculator ..................................................................................... 74 K-value calculator.................................................................................................. 74
Adding tee junctions ...................................................................................... 76 Adding bends ................................................................................................ 76 Adding valves ................................................................................................ 77 Adding expansions/contractions ................................................................... 78 Adding User Defined (Process Equipment) items ......................................... 78
Chapter 9 – Library facilities ............................................................................ 81
Library fluid definitions .......................................................................................... 81 Adding a fluid definition to the library ............................................................ 81 Editing a fluid definition ................................................................................. 82 Copying a fluid definition ............................................................................... 82 Deleting a fluid definition ............................................................................... 83
Library diagrams ................................................................................................... 83 Saving diagram sections to the library .......................................................... 83 Inserting a diagram from the library .............................................................. 84 Renaming a diagram ..................................................................................... 84 Deleting a diagram ........................................................................................ 85
Library pump and pressure curves ....................................................................... 86 Adding pump curves to the library ................................................................. 86 Adding pressure curves to the library ............................................................ 87 Editing a curve ............................................................................................... 88 Copying a curve definition ............................................................................. 88 Deleting a curve definition ............................................................................. 89
Chapter 10 – Graph Reader .............................................................................. 91
Graph Reader tool window ................................................................................... 91 Using the Graph Reader ....................................................................................... 92
Chapter 11 – Flonet Options ............................................................................ 95
Solver Settings ...................................................................................................... 95 Display Settings .................................................................................................... 96
Changing the pipe labels ............................................................................... 96 Changing the default pipe colour .................................................................. 97 Changing the shape label font ...................................................................... 98 Making changes at application level ............................................................. 98
Configuring Alerts.................................................................................................. 98

Flonet User Guide
vi
Setting significant or decimal places ................................................................... 100 Changing units .................................................................................................... 101
Creating your own set of units ..................................................................... 102 Changing default values ..................................................................................... 102 Setting your system library location .................................................................... 103
Quick reference ................................................................................................... 105
Shortcuts ................................................................................................................ 111
Glossary ................................................................................................................. 113
Index ......................................................................................................................... 117

1
Preface
Welcome to Flonet, the calculation tool for fluid flow in networks. One of a suite of
fluid flow programs for process engineers, Flonet calculates the flows and pressure
drops throughout your gas or liquid network.
About this guide This guide is designed to assist you in becoming quickly familiar with the capabilities
of Flonet, its interface and how the program is used.
Who should read this guide
This guide is written for users of Flonet to help you take full advantage of its
calculation tools. If you are new to this product, we recommend that you first read The
60 Second Guide to Flonet.
The guide assumes you are familiar with the Windows operating system. If you are
new to Windows, you can find help, tutorials and support information by clicking
Start > Help and Support.
What is in this guide
The guide contains descriptions and step-by-step instructions for all the tasks involved
in using Flonet.
How this guide is structured
The chapters are organised as follows:
1. Introduction Introduces the product, outlining the
database.
2. Getting started Shows how to start Flonet, introducing the
user interface for the application.
3. Flonet Quick Tour Tutorial for a typical session using Flonet,
emphasising the commonly used features.
4. Flonet basics Describes the overall process for running a
calculation, shows how to create a basic
piping diagram and how to enter data.
5. Drawing features Describes the Visio-like features of the
drawings tool.
6. Running a calculation Shows how to enter data and calculate results
for your piping diagram in Flonet.
Flonet User Guide
2
7. Advanced features Describes special editor dialogs and using
generic fittings to represent non-standard
devices.
8. Standard Calculators Describes the standard PEL piping
calculators.
9. Library facilities Shows how to use the Library to save
detailed parts of the work flow to avoid
repetition.
10. Graph Reader Shows you how to capture performance data
from a manufacturer’s pump curve supplied
as a graph.
11. Flonet options Describes the various option settings in
Flonet.
The guide also includes a quick reference section and a glossary.
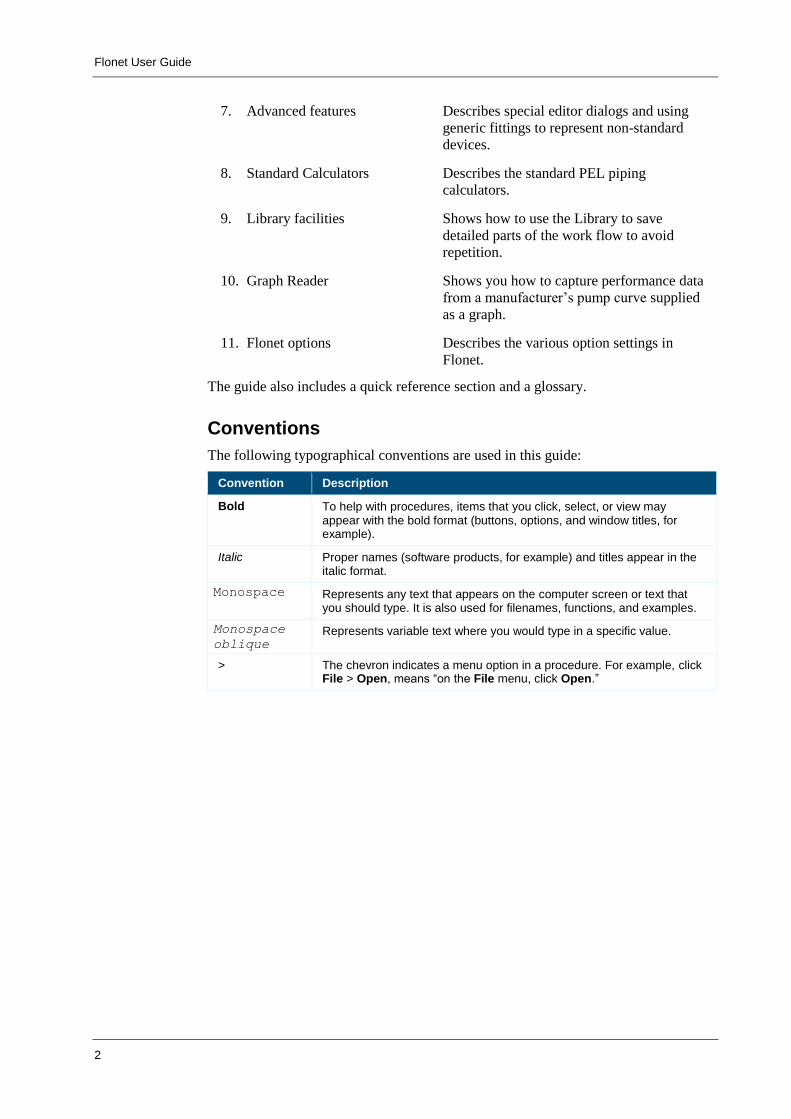
Conventions
The following typographical conventions are used in this guide:
Convention Description
Bold To help with procedures, items that you click, select, or view may appear with the bold format (buttons, options, and window titles, for example).
Italic Proper names (software products, for example) and titles appear in the italic format.
Monospace Represents any text that appears on the computer screen or text that you should type. It is also used for filenames, functions, and examples.
Monospace
oblique Represents variable text where you would type in a specific value.
> The chevron indicates a menu option in a procedure. For example, click File > Open, means “on the File menu, click Open.”

3
Chapter 1 – Introduction
Introduction to Flonet Flonet brings speed and reliability to the process of modelling liquid and gas
distribution networks.
This guide explains how to use Flonet to set up a Flonet model. It provides an example
of how to use the capabilities of the program while pointing out suggestions for best
practice in both constructing and validating a model.
Flonet brings speed and reliability to the process of modelling liquid and gas
distribution networks. The network is drawn with a Visio-like drawing application
using specially designed shapes to represent nodes, pumps, pipes and other fittings in
the layout.
It calculates single phase liquid or vapour flow rates and pressure drops in piping
systems. These may consist or piping loops or be "tree-like" in form. Pumps and non-
return valves can be included in the system.
This guide explains how to use Flonet to set up a model. It provides an example of
how to use the capabilities of the program while pointing out suggestions for best
practice in both constructing and validating a model.
Flonet network properties
A Flonet network can contain:
Compressible or incompressible fluids.
Loops and tree-like structures.
Pumps and non-return valves.
Turbulent, transitional and laminar flow regimes.
Pipes of any dimension and reasonable roughness.
Pressure loss data due to fittings.
Moderate temperature variations.
Gravity heads due to sloping pipes.
Flonet network configurations
A Flonet network consists of nodes and pipes. Nodes are points where pipes begin or
end, including inlets to and outlets from the network, and any junctions and vessels

Flonet User Guide
4
within the network. Pipes run between nodes and include fittings such as valves and
restriction orifices.
In the Flonet window, a node is represented by a plain circle, with other fittings as a
circle containing a symbol. As you add nodes or pumps to the drawing grid and
connect them, the connecting lines between them represent the pipes in the network.
The following information is required to specify a Flonet network:
A name, length, inner diameter and roughness, for each pipe.
A label, height or elevation and inlet temperature for each node.
Details of pressure losses due to fittings in the form of K-values.
Details of the capability of any pumps in the system in the form of Head (m)
versus Flow (m3/s) characteristics. The pump curve can be defined using any
number of points (see the curve in the Quick tour for an example).
Density, viscosity and heat capacity data for the fluid in the network.
A datum pressure at some point in the network.
Flonet calculation assumptions
The following assumptions are made in Flonet calculations:
1) The flow/pressure equations in Flonet work on an isothermal basis.
2) Flonet calculations are only valid for low Mach numbers, that is, around 0.2 Ma.
At high Mach numbers the internal energy changes become important and the
isothermal model is less valid.
3) The network description is not directed (unlike the VisualAdrian program). This
means that, even though a particular pipe starts at node A and ends at node B, it
does not follow that the fluid can only flow in the direction of A to B.

Chapter 1 – Introduction
5
Overview of PEL PEL is a collection of tools to enable process engineers to carry out their day-to-day
tasks more quickly and reliably. The software includes purpose built programs to
generate datasheets, perform engineering calculations of liquid and / or gas flow,
investigate physical properties and create fault tree diagrams. Designed by engineers
for engineers, the tools are intuitive and easy to use. They can be used to work out
every day calculations, for troubleshooting issues such as bottlenecks, or when making
plant modifications. This low cost solution will enable engineers to design processes
more quickly and reliably with up-to-date and permanently available design data.
Benefits
Allows engineers to be more efficient and productive. With fewer manual
calculations to do, tasks are carried out quicker;
Improves QA and standardises procedures, through everyone using same set of
data and calculations;
Human errors in calculations are reduced;
Improves production as bottlenecks can be identified quickly so a solution can be
sought;
Allows operators to get the best out of their existing assets by carrying out
modifications rather than designing new ones.
Programs for fluid flow
Flonet is one of a suite of fluid flow applications built on the drawing functionality of
Microsoft Visio. Together with the calculations provided by PEW, these Visual
applications allow you to quickly and reliably calculate the correct size of every part
of pipelines, equipment and pressure relief systems.
VisualFlonet – for fluid flow in networks
VisualFlonet calculates the flows and pressure drops throughout your gas or liquid
network.

Flonet User Guide
6
VisualAdrian – for pressure relief
VisualAdrian calculates flows and pressures for high velocity, compressible gases
allowing the capacity of relief streams and sizing of associated equipment to be
assessed.
VisualPiper – for two-phase fluid flow
VisualPiper calculates the pressure change or flowrate of a liquid, two-phase mixture,
or gas through an unbranched closed conduit system.

7
Chapter 2 – Getting started
This chapter shows you how to start Flonet and introduces the user interface for the
application.
Starting Flonet The most common way of starting Flonet is from the Windows Start menu, but you
can also run it from a desktop shortcut.
Flonet uses a Visio-like drawing tool to create a diagram of your piping network.
To start Flonet from the Start menu:
Click Start > All Programs > PEL > FLONET 2016.
If using the classic Start menu or earlier versions of Windows, click Start >
Programs...
The application opens with a blank drawing template.
Starting Flonet from a drawing file
Once you have saved your piping network diagram as a (.flnt) drawing file, you can
start Flonet by double-clicking the drawing file in Windows Explorer, or in the most
recent versions of Windows from the Documents Library.
To start Flonet with a drawing file:
Double-click your drawing file in Windows Explorer or your Documents Library.
Note In more recent versions of Windows if you point at Flonet in the Start menu,
you can select your drawing file from the list of recent files.
You can also open a recent file from the File menu in Flonet.
Quitting Flonet
To quit Flonet:
1) Do one of:
On the File tab, click Exit.
Click the Close (X) button.
If you haven't saved any data on the current drawing, a message asks if you want
to save your changes.
2) Click Save.

Flonet User Guide
8
User interface Once you have started Flonet, you see the following, or similar, user interface.
The following main features are apparent:
Quick access toolbar. Above the ribbon you see a small toolbar containing buttons
for accessing the most common Windows commands. Move the mouse pointer over a
button to see its name.
Flonet ribbon. The ribbon interface contains the various Flonet commands.
Fittings window. This Visio like feature shows the various Flonet nodes and fittings
that you can drag onto the drawing page.
Titlebar buttons. The titlebar buttons include a Help (F1) command, as well as
Maximize, Minimize and Close.
Drawing page. The main area of the screen contains your piping network diagram.
Specifications window. This quick access window lets you change the inlet or
outlet fixed pressures or flow rates so that you can quickly rerun the solver.
Results window. This is one of a group of four separate windows grouped as tabs
that are docket to the bottom edge of the user interface. The Results window is
initially blank, but after successfully running the solver shows a series of tables with
all the results produced by the solver. The Messages window lists progress messages
for the solver together with any warnings or error messages. The Solver Input
window lists the full data set sent to the Solver, while the Solver Output window
shows messages from the Solver.

Chapter 2 – Getting started
9
Editor (data entry) dialogs
The various editor dialogs let you add or change the modelling data for your piping
network diagram. The dialogs are called up from commands on the Flonet ribbon.
The topological data (that is the vessels, nodes, pipes, pumps and any other fittings)
are automatically picked up from the diagram. You use the forms to enter physical
data, such as pipe lengths, and conditions, such as temperature and pressures.
Many of the dialogs let you enter values for all the nodes, pipes and pumps on your
diagram: other dialogs let you enter or change values for a single component. These
are called by double-clicking the component.
Standard calculator dialogs
Secondary to the editor dialogs are a number of standard piping calculator dialogs.
These are standard tools provided in all the PEL programs to complete various piping
parameters. The dialogs are generally called by right-clicking the field that will
contain the value in the editor dialog. The editor dialogs for individual components

Flonet User Guide
10
have one or more buttons for calling the calculator next to the appropriate field. The
calculator then returns a single resultant value to the field.
There are standard calculators for pipe inner diameters, pipe roughness and for
calculating the fittings loss (k-value).
User assistance Flonet has the following forms of user assistance:
Online help
Online documentation
PEL Support Services
Online help
Flonet has an integrated online help system, which provides clear reference
information and step-by-step instructions for tasks. This is an online help version of
this guide.
To open the help system:
Do one of:
Click the Help button (?) (on the top right of the Flonet window).
Press F1.
The help opens in a separate window.

Chapter 2 – Getting started
11
Online documentation
Documentation is provided for PEL products on the website. The documents are
provided as PDF files for you to download and print. These include:
60 second guides
Online user guides
PEL Support Services
This program is developed, maintained and supported by PEL Support Services, ABB.
We run a Hotline telephone and email service to answer any queries about Flonet.
Please let us have any suggestions on how you feel we could improve Flonet. You can
contact us by any of the following routes:
By Telephone: +44 (0)1925 74 1126
By Fax: +44 (0)1925 74 1265
By email: [email protected]
By Post: PEL Support Services
ABB Limited.
Daresbury Park
Daresbury
Warrington
Cheshire WA4 4BT
United Kingdom.


13
Chapter 3 – Quick Tour
This chapter provides tutorials to get you started with the application. The tutorial,
which is divided into two parts, is available separately in print form (or as a PDF file)
entitled 60 Second Guide.
Part 1 – Calculating pressure drops or flows
This short self-paced tutorial will show you how
to begin to use Flonet to calculate pressure drops
and flow rates for liquids or gases in piping
networks.
Within seconds from now you will have learned
how to use Flonet to calculate the pressures and
flowrates in the network given the inlet and exit
pressures shown on the right:
Flow diagram
Pipe data
Pipe Length Bore Fittings
P1 50 m 2” 4 x 90° bend, radius 500mm
P2 50 m 2” 1 x T-junction type 2
P3 50 m 1” 1 x 1” globe valve – cast
P4 30 m 1.5” 7 x 90° bend, radius 300mm
P5 50 m 1” 1 x 1” globe valve – forged
P6 30 m 1.5” 2 x T-junction type 3
All pipes are Schedule 40, mild steel, slightly
corroded.
Pump curve
Starting Flownet
1) Click Start > All Programs > PEL > Flonet.
2) Using the flow diagram, drag the tank TNK1, pump PMP1, and nodes N1 to N5.
As you drag the shapes guides appear to help you align them. Flonet
automatically names them as you add them.
3) Click the Pipe Orth control in the Pipe/Drawing group on the ribbon and drag
between TNK001 and the pump to add pipe 001. Click the Pipe control and drag
between the pump and the other nodes in turn to complete the network diagram.
We now need to add the process data to the tank and nodes. Let’s start by adding
the inlet and outlet pressures and temperatures.
4) Select the tank and nodes 2 to 5 (using Ctrl-click) and click Selected Nodes on
the ribbon to open the Edit Input Values dialog. Enter the pressures and
P2
TNK1
N1
N2 N3
N5N4
1.0 bar
40°C
P3
P6
P4
P1
pmp1
P5
0.4 bar
30°C
0.6 bar
30°C
0 0.002 0.004 0.006 0.008 0.01 0.012 0.014
20
21
22
23
24
25
26
Flow [m3/s]
Head [m
]

Flonet User Guide
14
temperatures shown in the flow diagram: 1.0 bar and 40°C for the Inlet Tank, 0.4
bar and 30°C at N3, and 0.6 bar and 30°C at N5. In the Elevation column, enter 5
for each of the nodes N2, N3, N4 and N5. Also set the temperature at nodes N2
and N4 to 40°C. The data is automatically saved so you can just close the dialog.
The outlet pressures we have entered will be treated as estimates unless we set
them as fixed values.
5) Double-click Node 3 to open the Edit Node dialog. Select the Fix check box next
to the Pressure value and click OK. Repeat for Node 5.
We now need to specify the pipe data. Let’s start by adding the data for the first
pipe and find out about the various tools for helping us. There are calculators for
Pipe Inner Diameters, Pipe Roughness, and Fitting Loss (K-values).
6) Click All Pipes on the ribbon to open the Edit Input Values dialog for pipes.
Click the Length cell for P1 and enter 50. Click the Diameter cell for P1, right-
click and click Pipe Diameter. When the calculator appears select a 2” Schedule
40 / STD / 40S pipe and click OK to return the result to the cell.
Click the Roughness cell, right-click and click Roughness. Select Mild Steel
(slightly corroded) and click OK to return the value to the cell.
Now close the Edit Input Values dialog and we’ll add the Fittings Loss
Coefficient by opening the individual Edit dialog.
7) Double-click pipe 001 and on the Edit dialog click the button next to Fittings
Loss Coefficient. Click the Bends tab, type 500 in the radius box, 4 for the
Quantity and click Add. Click OK to return the result.
That’s the first pipe done. Now add the data for the other five pipes using the
information in the table at the start of the tutorial. Try using the Copy and Paste
commands on the shortcut menu to paste the Roughness into all the pipe
roughness cells.
We’ve entered a lot of data now so it’s a good idea to save the drawing at this
stage.
8) Click the Save button on the Quick Access toolbar and save the data as
Tutorial-1.flnt in your Documents library.
Next we need to specify the pump characteristics.
9) Double-click the pump in the drawing to open the Edit Pump dialog. Under
Defined By click Curve. In the Curve tab, set the Number of points to 3 so we
can enter the values for Head and Flow given in the graph at the beginning.
Notice that the flow values given are in m3/s whereas the dialog requires m3/h.
We could change the units in the application, but for now we can enter the values
and units and let the program convert them.
10) Enter the pump curve values, entering the flows in the format value<space>units:
Flow, Head: 0.0 m3/s, 25.0 (m) 0.006 m3/s, 24.0 0.012 m3/s, 21.0
Enter the speed as 1800 rpm and the diameter 0.06 m. Then click OK.
Finally we need to specify the fluid in the network.
11) Double-click the tank and click Set Fluid. Enter Ethanol-Water as the name.
Select Liquid as the Phase then enter the following 3 pairs of temperatures and
pressures: 0.1bar & 10°C, 1bar & 20°C, 2bar & 40°C. Next click Physical
Properties to calculate density, viscosity and heat capacity.
The PPDS Calculator opens.

Chapter 3 – Quick Tour
15
12) First select the components. (If some are already present, click Clear Worksheet
to remove them.) Click Add Component and type W in the Search for Name
box. Four components are found beginning with the letter W. Click Water and
then click Add to Stream. Next, delete W from the Search box and type in ET
for Ethanol. Select Ethanol from the results and click Add to Stream then Close.
The last thing we need to do for the physical properties is to specify the
composition. You can use the spreadsheet to specify the stream composition, both
in terms of moles or mass, and as quantities or fractions.
13) Click the Mass Fraction cell for Water to give it “focus”. Enter 0.5 for both
Ethanol and Water. The PPDS Calculator updates the spreadsheet. If you wish,
the it will also normalise the values if they do not add up to 1.
All that’s all the input we need to calculate the physical property data so …
14) Click Calculate to calculate the liquid densities and viscosities at each of the 3
sets of pressure and temperature. Click OK to close the calculator and
automatically transfer the results back to the Fluid dialog. Finally, click OK twice
to close the Fluid and Edit Inlet Tank dialogs.
That’s it for the input data for Flonet. We’ll just specify the output units before
running the solver.
15) Click Options on the ribbon and then the Units tab. Change the Mass Flow units
to kg/s. Then click the Input/Output tab and set the output to use Decimal Places,
with the number of places as 2.
16) Click the Solve button on the ribbon to calculate the flow rates.
You will see that the calculated flowrates are 2.55 kg/s at the inlet, and 1.33 kg/s
and 1.22 kg/s at the outlets N3 and N5 respectively.
That’s it! Now try out Part 2 of the 60 Second Guide and see how easy is it to use
some of the more advanced features of Flonet.

Flonet User Guide
16
Part 2 – What’s new
This second part of the tutorial builds on the
example in Part 1 and shows you how to
begin to use the advanced features of Flonet
to model piping networks.
These include commands to:
Set default lengths and diameters for
pipes
Add additional diagrams
Drop fittings into a piping network
Use libraries to store diagrams
Set up an Alert to highlight high or low
values
Use a controller fitting in ‘design mode’
to solve problems with pressures or
flows.
Within seconds from now you will have
learned how to use Flonet to calculate the
pressures and flowrates in the extended
network shown on the right:
Flow diagram 2
Pipe data
Pipe Length Bore Fittings
P7 50 m 2” 2 x 90° bend, radius 750mm
P8 30 m 2” 1 x T-junction type 1
P9 50 m 2” 1 x diaphram valve – Weir
P10 30 m 1.5” 4 x 90° bend, radius 250mm
P11 50 m 1.5” 1 x butterfly valve – d/4
All pipes are Schedule 40, mild steel, slightly corroded.
Starting NetFlonet
1) Click Start > All Programs > PEL > Flonet.
2) Open Tutorial-1 (from Part 1 of the tutorial).
Let’s add this diagram to the library to use it as a starting point.
3) Right-click in a blank area of the diagram and click Add Diagram/Selection to
Library. Enter the Asset name “Tutorial-1” and click Save.
We will now create a new diagram and add this library item to it
4) Click the New button on the Quick Access toolbar. On the File tab click Library,
click the Diagram tab, find the Tutorial-1 diagram and click Insert. Then close
the Library dialog.
First we will replace node 1 with a Tee fitting.
5) Drag a Tee fitting onto the diagram close to N1. Select the node and press delete.
Connect the 3 unconnected pipe ends(they are green) to the Tee. Click each pipe
in turn to check the pipes are connected. Finally drag the connected Tee into
position so it is aligned.
Now we want to extend the lower branch onto a second diagram.
6) Delete Node 5 and drag a diagram connector into its place,connecting Pipe 6 to it.
Double-click the diagram connector to add diagram 2.
Before we start to add fittings and pipes to the diagram, let’s specify some default
parameters for pipes, so that we don’t have to enter all the data manually.
7) Click Options on the ribbon. Click Defaults and set the Diameter for 2 inch,
schedule 40 (click the button to open the Diameter calculator), the Roughness as
P7Tee 2
N6 N7
N9N8
P8
P11
P9
P10
0.4 bar
30°C
0.5 bar
30°C
NC2

Chapter 3 – Quick Tour
17
“mild steel, slightly corroded” and the Length as 50m. Also click the Units tab
and change the Mass Flow units to kg/s. Then click OK.
Now add the fittings and pipes shown in Flow diagram 2.
8) Drag the Tee and then Nodes 6-9. Click the Pipe tool in the ribbon and connect
the fittings to add the pipes. When you have finished, click the Select tool.
9) Drag a selection rectangle to select everything on Diagram 2 (or press Ctrl+A).
Then click Selected Pipes on the ribbon.
Notice that the diameters, lengths and roughness values are set to the defaults.
10) Change the lengths for pipes P8 and P10 and the diameters for P10 and P11 to
match the information in the table at the start of the tutorial. When you have
finished, close the dialog.
11) Again using the information in the table, specify the Fitting Loss Coefficient for
each pipe in turn.
12) Select everything on Diagram 2 again, but this time click Selected Nodes.
13) For Tee2, set the elevation to 5m and the temperature to 30°C. Click the Node tab
and set the elevations – N6 and N7 at 25ft and N8 and N9 at 10ft. (Enter in the
form nn<space>units.) Set the pressures for N7 and N9 to 0.4 bar and 0.5 bar
respectively. Set the temperature for all four nodes to 30°C. Then close the
dialog.
Finally we need to set the outlet pressures as fixed values.
14) Double-click Node 7 to open the Edit Node dialog. Select the Fix check box next
to the Pressure value and click OK. Repeat for Node 7.
We’ve entered a lot of data now so it’s a good idea to save the drawing.
15) Click the Save button on the Quick Access toolbar and save the data as
Tutorial-2.flnt in your Documents library.
16) Click the Solve button on the ribbon to calculate the flow rates.
Now lets specify an alert, which shows threshold alarms.
17) Click Alerts and Setup (or Options and click the Alerts tab). Select Flow rate as
the Property, add a Theshold Value/units of 0.25 kg/s. Set the type of alert as
“Alert if <” (less than). Click Add. Then click OK to close the Options dialog.
We can see that the flow in the branch from the Tee2 to N7 is flagged as an alert
(it appears red) as the value is less that our threshold – in fact it is negative.
Let’s now add a flow controller to the network to solve the problem of negative
flow through the branch from Tee2 to Node 7.
18) Drag a Flow Controller fitting to a blank part of the diagram. Then drop it onto
pipe 11.
19) Double click the fitting and on the Edit Flow Controller dialog enter a Flow Set
Point of 1 kg/s. Then click OK.
20) Click Solve again to recalculate the pressures and flow rates through the system.
The flow through the upper branch is now positive. If you click on the Results tab
in the bottom pane, you will see all the calculated pressures and flowrates. And
that’s it!


19
Chapter 4 – Flonet basics
This chapter describes the overall process in running a calculation, shows you how to
create a basic piping network diagram and tells you how to enter data in Flonet.
Calculation overview The overall process in running a Flonet calculation involves creating a piping network
diagram using the Visio-like drawing facilities, entering data using the various editor
dialogs and then using the solver to generate the results.
The main steps in the process are as follows:
Create the diagram. Drag the various shapes from the Fittings window to form
your piping diagram. See “Creating a Flonet piping diagram” on page 20.
Enter inlet conditions. Enter the inlet conditions for the node or vessel, namely the
inlet pressure and flow rate. Specify the fluid either from the Library or using the
PPDS calculator tool to provide the physical properties, such as the molecular weight
and the viscosity. See “Entering inlet conditions” on page 41.
Enter data for nodes and junctions. Enter the estimated pressure for any internal
nodes and junctions in the network. See “Entering data for nodes and junctions” on
page 45.
Enter data for pipes and fittings. Enter physical data for each pipe or fitting, such
as pipe length, inner diameter, roughness and fittings loss coefficient. The parameters
vary for the different fittings. Use the standard piping calculators to enter these values.
See “Entering data for pipes and fittings” on page 49.
Enter data for pumps. For each pump in your system, either select a pump curve
from the Library or enter the number of points on the manufacturer’s pump curve,
specifying the head and flow rate for each point. See “Entering data for pumps” on
page 54.
Add flow/pressure specifications. Enter fixed flow and/or pressure values for the
model. See “Defining flow/pressure specifications” on page 58.
Solve. Click the Solve button on the ribbon to generate the results for the network.
On completion, the Results window opens automatically. See “Running the solver and
viewing the results” on page 59.

Flonet User Guide
20
View the results. The Results window shows the calculated pressures and flow rates
for each node, pipe, fitting and pump in the network. Commands on the window let
you refine or extend the results before exporting them to an Excel speadsheet.
Creating a new diagram or drawing
Creating a new diagram
When you open Flonet it automatically opens with a blank diagram.
To create a new diagram:
Do one of
Click the File tab and then click New.
Click the New button on the Quick Access toolbar.
Press Ctrl + N.
Opening an existing diagram file
To open an existing diagram file:
1) Do one of:
Click the File tab, and then click My Computer in the middle pane.
Click the Open button on the Quick Access toolbar.
Press Ctrl + O.
2) In the left pane of the Open dialog box, click the drive or folder that contains the
drawing.
3) In the right pane of the Open dialog box, open the folder that contains the
drawing that you want.
4) Click the drawing and then click Open.
To open a recent file:
Click the File tab, and then double-click the pathname of the file in the right
pane.
Creating a Flonet piping diagram Basic Flonet diagrams show the primary pieces of your piping system and how those
pieces are connected. This article describes how to quickly create a basic Flonet
diagram in theVisio-like drawing application.
To add and connect shapes on your diagram:
1) Open a new drawing file.
2) Drag the first shape you want from the Flonet palette onto your drawing page.

Chapter 4 – Flonet basics
21
The shape will be selected in the drawing with selection handles around it.
3) Drag a second shape onto your drawing page.
As you drag the shape guides appear when the shape is horizontally (or vertically)
aligned with the first shape. When you release the mouse button the second shape
is selected as before.
4) Now click the Pipe tool then click the first shape and (without releasing the
pointer) drag toward the second shape. A blue selection box appears round the
shape and a connecting line appears as you drag away from it.
5) As you drag to the second shape a blue selection box appear around it.
6) Release the pointer to connect the two shapes.
The connecting line has a red connector at each end. A green connector at one
end tells you the pipe is not properly connected.
7) Continue to add shapes to complete your diagram.

Flonet User Guide
22
To add extra shapes to your diagram:
1) Drag a new shape onto a blank part of the drawing page.
2) Then drag the shape onto the pipe you want to intersect.
As you drag it the shape over a pipe a red selection box appears.
3) Release the pointer to connect the shape.
The pipe length is automatically halved and the elevation is picked up from the
upstream node.

Chapter 4 – Flonet basics
23
Managing the dockable windows The six dockable windows in the user interface can are not permanently fixed in the
positions in which they are installed. In general windows can have the ability to be
floating or docked. A window can be either docked to the overall application window
(parent docking) or docked within a parent (child docking).
As you drag a window to be docked, docking controls appear. Individual controls at
the centre of each edge of the overall application window are for parent docking with
a cluster of controls for child docking. The control at the centre of the cluster of child
docking controls lets you attach several windows to the parent as a tab group.
All the windows apart from the drawing page can be floating or docked and can be
included in a tab group. The drawing page is fixed in the overall application window,
but the individual diagrams can be grouped into one or more tabs, while other
dockable windows can be docked within it as a child.
To set a window or tab group as floating:
Click the title bar of the window or tab group and drag to where you want it.
To float an individual window in a tab group:
Do one of:
Click the tab title and drag to where you want it.
Right-click either the title bar of the window (if the tab is on focus) or the
tab title and click Floating.
You can then drag the floating window to where you want it.
To dock a window or tab group:
1) Right-click the title bar of the window and click Dockable.
2) Drag the window towards where you want to dock it.
3) As the docking controls appear, release the cursor over the docking or tab control
you want.

Flonet User Guide
24
Note When you drag a window over the drawing area, only the docking controls
appear. The is no tab control in the centre of the cluster.
Resizing dockable windows
All the six dockable windows are resizeable using standard windows features both
when they are floating or when they are docked.
To resize a docked window:
Move the pointer over the boundary between windows so that the pointer changes
to a double-headed arrow with a line through ( ↕ ). Then drag to move the
boundary.
To resize a floating window:
Move the pointer over one of the edges or the corners so that the pointer changes
to a double-headed arrow. Then drag to resize the window.
Showing/hiding the dockable windows
The Dock Windows section on the Flonet ribbon lets you select which of the six
dockable windows appear.
Select the check box to show the window; clear the check box to hide.
You can also hide a dockable window by right clicking the title bar of the window and
then click Hide.
Auto-hiding the dockable windows
You can also auto-hide one or more of the dockable windows to allow more space for
your diagram.
To auto-hide a window or tab group of windows:
Click the pin icon at the right end of the title bar

Chapter 4 – Flonet basics
25
You can also right click the title bar of the window and then click Auto-Hide.
To set open an auto-hidden window:
Point to the tab for the auto-hidden window on the left or bottom edge of the
application window and when the window appears click the pin icon.
A tab set of window all appear. If windows are docked within each other, only the
selected window opens.
Working with multiple display monitors
If you are working with a large diagram and have more than one display monitor you
can group all the dockable windows on a separate monitor. The arrangement is
remembered the next time you start Flonet.
The above examples hows all six dockable windows in a single floating window. This
can be positioned on the extended part of the desktop on a separate monitor.
To do this:
1) Drag the tab group of four windows as a floating window onto a second monitor.
2) Drag the Fittings window over the floating window and when the docking
controls appear, release over the right child docking control.
3) Drag the Specifcations window over the Fittings window and release the
pointer over the bottom child docking control.
4) Adjust the boundaries between the windows. as required.
Reverting to the original arrangement
When you move, resize or re-position the dockable windows, the arrangement is
remembered for the next time you start Flonet.
The orginal installed arrangement has the Specifications window parent docked to the
left edge of the application, with the Fittings window docked as a child to its top edge.
The Results, Messages, Solver Input and Solver Output are linked together as a tab
group which is then docked as a child to the bottom edge of the drawing area.

Flonet User Guide
26
To restore the original arrangement:
1) Drag either the Fittings window to the left edge of the application window and
release the pointer over the left edge docking control.
2) Drag the Specifications window over the Fittings window and release the
pointer over the bottom child docking control.
You can docks these window in the reverse order, in which can you dock the
second window to the top child docking control.
3) Adjust the boundary between the two windows. as required.
4) Drag one of the remaining four dockable windows over the fixed drawing area
and release the pointer over the bottom child docking control.
Note The cluster of child docking controls for the drawing area doesn’t have a
tab control in the centre.
5) Drag each of the remaining three dockable windows over the window just docked
and release the pointer over the Tab child docking control.
6) Drag the tabs to order as Results – Messages – Solver Input – Solver Output.
7) Adjust the boundary between the tabbed windows and the drawing area as
required.
Working with multiple diagrams For a large network you can draw your diagram in sections on multiple connected
diagrams. Additional controls let you add or remove diagrams from the group and
change how the diagrams are viewed with options for tab group and to show and hide
individual diagrams.
Adding a blank diagram
To add a blank diagram:
1) Do one of:
On the ribbon click Add.
Right-click the diagram tab bar and click Add Diagram.
2) Enter a new name for the dialog, if required, or just leave the default. Then click
OK.
A new blank diagram opens with an extra tab appearing on the diagram tab bar.

Chapter 4 – Flonet basics
27
Adding a connected diagram
You can create a large network diagram as a series of connected sections with all the
sections held in a single project file.
To add a connected diagram:
1) Drag a Diagram Connector shape onto your diagram and connect it to the last
(output) fitting on the diagram.
2) Double-click the diagram connector.
A new diagram is added as a extra tab in the drawings area. It opens containing a
second diagram connector linked back to the first diagram.
You can double-click the diagram to jump back to the first diagram. You can also
move between diagrams by clicking on the tabs at the top of the drawing area.
Connecting/disconnecting diagram connectors
If your network extends over multiple diagrams, you can change the arrangement by
connecting and disconnecting pairs of diagram connectors manually.
To disconnect two diagram connectors:
1) Select the first diagram connector, then click the tab for the second diagram and
select the second diagram connector of the pair.
Tip: You may find this easier to do if both diagram are visible using tab groups.
2) Right-click (anywhere in the diagram), point to Diagram Connector and then
click Disconnect.
A message confirms that the networks have been disconnected.
3) Click OK.
To connect two diagram connectors:
1) Select the first diagram connector, then click the tab for the second diagram and
select the second diagram connector of the pair.
Tip: You may find this easier to do if both diagram are visible using tab groups.
2) Right-click (anywhere in the diagram), point to Diagram Connector and then
click Connect.
A message confirms that the networks have been connected.
3) Click OK.
Removing a diagram
To remove a diagram:
1) Click the diagram tab (so that it is on focus). Then right-click the diagram tab bar
and click Close.
2) If the diagram contains (or has contained) shapes, you are promped to confirm
that you want to remove the diagram from the project.

Flonet User Guide
28
3) Click Yes.
If the diagram is a new blank diagram it is removed directly when you click Close.
Renaming a diagram
By default your diagrams are named Diagram 1, Diagram 2, etc. If you have a large
number of diagrams in your project, you may wish to give them meaningful names to
reflect their position in the network.
To rename a diagram:
1) Click the diagram tab (so that it is on focus). Then right-click the diagram tab bar
and click Rename.
2) Enter a new name in the dialog and click OK.
Using tab groups
As you create multiple diagrams in your project you may wish to view more than one
diagram concurrently. The windows handling features in Flonet that allow the
dockable windows to be arranged in a tab group is also available (in a slightly
different form) for the fixed drawing area. By moving a diagram into a new vertical or
horizontal tab group you can split the drawing area into sections, with one or more
diagrams in each group.
To move a diagram into a new vertical tab group:
Right-click the title bar of the diagram and click New Vertical Tab Group.

Chapter 4 – Flonet basics
29
The current diagram area is split into two sections side by side. You can drag the
boundary to resize te two areas.
To move a diagram into a new horizontal tab group:
Right-click the title bar of the diagram and click New Horizontal Tab Group.
The current diagram area is split into two sections vertically.
To move a diagram from one tabbed area to another:
Right-click the title bar of the diagram and click Move Previous or Move Next.
The diagram is moved into a different tab group. If the diagram was the last tab
in the group, the group is removed.
Showing or hiding a diagram
You can show or hide individual diagrams in your project set.
To hide a diagram:
Do one of:
Click the diagram tab (so that it is on focus). Then right-click the diagram
tab bar and click Hide.
Click the Diagrams control in the ribbon and in the dropdown list clear the
checkmark against the diagram you want to hide.
The diagram will disappear from view and the tab will no longer appear on the tab bar.
To show a hidden diagram:
Click the Diagrams control in the ribbon and in the dropdown list select the
hidden diagram (without a checkmark).
The diagram will reappear in the drawng area.
Zooming in or out of a drawing As your network diagrams become more complex you will want to zoom in and out of
the diagram to view details more easily. You can do this in several ways.
To zoom using the ribbon controls:
Click the + magnifying glass button to zoom in.
Click the – magnifying glass button to zoom out.
To Zoom using the mouse
1) Right-click in the diagram and click Zoom.
The pointer turns into a magnifying glass.
2) Do one of the following:
Click the left mouse button to enlarge the view.
Flonet User Guide
30
Click the right mouse button to reduce the view.
Click the left mouse button and drag. The resulting magnification depends
on the size of the box that you create as you drag ―the smaller the box, the
greater the magnification.
You can return to the pointer tool by clicking the Pointer (Select) tool in the
ribbon, by right-clicking and clicking Pointer or by pressing Ctrl+Shift+P.
To zoom using the mouse scroll wheel:
Hold down the Ctrl key as you rotate the scroll wheel forward or backward.
Rotating the scroll wheel without holding down the Ctrl key scrolls the diagram
up or down.
To reset the zoom:
Right-click in the diagram and click Zoom Reset.
The diagram returns to the default magnification.
Entering and editing data fields The Edit dialogs contain a grid of small data fields. A few of these will be text fields,
but most are for entering numeric values, with or without units.
Entering data fields
To enter text or a value:
1) Double-click the field you want to change. Type the new text or number and then
click on another cell.
An alert appears if numeric data is not entered in the correct format. Click OK
and correct the entry.
2) Repeat for other fields as required.
Converting units and values
The units for any field appear on the dialog. These are defined on the Flonet options
dialog. Sometimes the source data to be entered may be in different units. For
example, if a pressure is shown in bar, while the source data is in psi. Rather than have
to convert the value in another application, you can enter the value with the units and
Flonet will do the conversion inline.
To convert a value inline:
Enter the data in the format:
Value <space> units
and then press Enter (or click another field).
The value is converted to the units shown on the dialog.
Example:
For a pressure in bar, entering “50 psi” converts to 3.4474.

Chapter 4 – Flonet basics
31
Copying and pasting cells
Copy and Paste commands on the grid dialogs let you replicate a value from one cell
to one or more others. Note You can only paste to a contiguous group of cells.
To copy a cell value:
Click the cell whose value you want to copy, and do one of:
Right click and click Copy.
Press Ctrl+C.
The value is copied to the clipboard.
To paste the copied cell value:
1) Select the cells you want to copy the value to. You can drag down to select a
contiguous set of cells in a column or use click and Shift+click to do the same.
You can also click on the column heading to select the whole column.
2) Do one of:
Right click and click Paste.
Press Ctrl+V.
The value is pasted to the selected cells.
Using standard calculators with a grid
You can use the standard PEL piping calculators to populate multiple cells in any of
the Edit Input Values dialogs that show pipes. The individual calculators are only
available on their respective columns. Note You can only apply the calculator to a
contiguous group of cells.
To use a calculator with multiple cells:
1) Select the cells you want to populate. You can drag down to select a contiguous
set of cells in a column or use click and Shift+click to do the same. You can also
click on the column heading to select the whole column.
2) Right click and click the calculator command.
Viewing information on your diagrams You can control what appears on your diagrams. You can declutter th diagram by
showing or hide labels. You can also set up alerts to highlight values calculated to be
above or below a defined threshold.
Showing/hiding labels on the diagram
The Model section on the Flonet ribbon lets you show or hide the labels on your
diagram. These are the results information above each pipe, the label below each pipe
and the label above each node or fitting.

Flonet User Guide
32
Select the check box to show the label; clear the check box to hide.
You can also configure what appears in each label using the Options feature. See
“Display Settings” on page 96.
Showing alerts
As you learn to configure alerts your diagram will show values that fall above or
below a defined threshold appearing with an alert marker (for a node or fitting) and
with both a maker and the line in red for a flow in a pipe.
Setting up alerts is described as part of the Option feature. See “Configuring Alerts”
on page 98.
A popup window lets you view detailed information on the alert parameter.
You can set this window to appear either when you double-click the alert symbol
(default) or when the pointer hovers over the symbol.
To set the window to appear on hover:
Click the dropdown arrow next the Alerts button on the ribbon and click Show
Alerts window.

Chapter 4 – Flonet basics
33
Saving your Flonet diagram When you have completed your Flonet diagram(s), you will need to save your work as
a Flonet Project (.flnt) file. When you have added data to the diagram, you will need
to save the file again to save the data.
To save your diagram(s):
1) Do one of:
Click the Save button on the Quick Access toolbar.
On the File tab, click Save.
Press Ctrl+S.
2) Browse to where you want to save the file, enter a file name and click Save.
Printing your Flonet diagram
To print your diagram:
1) Do one of:
Click the Print button on the ribbon anad then click Print.
Press Ctrl + P.
2) In the Print dialog box, do the following:
In the Name box, select the printer that you want (if it is not already
selected).
Under Page range, specify the pages in the drawing that you want to print.
3) Click OK when you are ready to print.
Printing large diagrams
For large diagrams you may want to adjust the page setup parameters, especially if the
diagram page size is larger than the largest paper size your printer can hold. Flonet
provides options to tile the printout.
To adjust the page and print settings:
1) Click the Print button on the ribbon anad then click Page Setup.
The Page Setup dialog appears. By default Flonet assumes the page size of the
diagram is the same as the printer page size.
2) Click the Page Size tab and define the page size of your drawing.

Flonet User Guide
34
3) Now, click the Print Setup tab and define the printer paper size.
4) When you have adjusted the setup as required, click OK to save the settings.
To preview a page before printing:
1) Click the Print button on the ribbon anad then click Print Preview.
2) Use the buttons the the toolbar to preview the page or make changes before you
print.

35
Chapter 5 – Drawing features
Flonet gets you started in creating network diagrams. Using a Microsoft Visio-like
drawing interface, it lets you create complex piping network diagrams using graphical
objects to represent the various different fittings and the connecting lines between
those objects to represent all the pipes.
Add, Copy, Delete shapes
Adding a shape (fitting)
Along the side of the drawing page is a panel, or window, named Fittings. The
Fittings window contains all the various fittings commonly used in a piping network.
To add a fitting to your diagram or drawing:
1) In the Fittings window, click and hold the fitting that you want.
2) Drag the fitting onto the diagram page.
Connecting fittings
In piping diagrams, the shapes or fitting are connected by pipes. You connect your
fittings using either of the two Pipe controls.
To connect fittings (add a pipe):
1) On the Flonet ribbon click the Pipe tool.
2) Click and hold the pointer over the fitting at one end of the pipe. A blue selection
box appears around the fitting and a connector arrow appears.
3) Drag the connector arrow to the fitting at the end of the pipe. As the pointer
moves over the fitting a blue box appears around it.
4) Release the pointer. The pipe appears in the diagram connecting the two fittings.
Copying shapes and connectors
You can copy individual shapes, but this is the same as dragging a new shapes from
the Fittings window.
To copy a selection of shapes and connectors:
1) Drag round the shapes and connectors to select them. You can also use Ctrl-click
to select both shapes and connectors.
2) Do one of:
Holding down the Ctrl key, drag the selection to a new part of the drawing
page and release the pointer.

Flonet User Guide
36
Press Ctrl-C to copy the selection and then Ctrl-V to paste. You will need to
drag the copied selection to a new area of the page.
The copied shape and connector names are automatically renamed with the next
available numbers.
Deleting shapes and connectors
To delete a shape or connector:
Select the shape or connector, and then do one of the following:
Press Delete.
Right-click and click Cut, or press Ctrl+X.
Select, move, resize, and rotate shapes
Selecting shapes
Most often, you have to select shapes before you can do other things, such as move or
rotate shapes.
To select a single shape:
1) On the Flonet ribbon click the Select (Pointer) tool.
2) Point to the shape on the drawing until it becomes a four-headed arrow, and then
click the shape.
To select multiple shapes by dragging:
1) On the Flonet ribbon click the Select (Pointer) tool.
2) Place the pointer above and to the left of the shapes that you want to select, and
then drag to create a selection net around the shapes.
After you select the shapes, you'll see green selection handles around the shapes
that you selected.
To select multiple shapes using a keyboard shortcut:
Press and hold Ctrl while clicking shapes to select multiple shapes one at a time.
Tip You can also use the Ctrl key to add shapes to a current selection. For
example, if you want to add a shape to a selection that you created by dragging,
you can hold down Ctrl and then click the shape.
To deselect a shape from a selection:
Press Ctrl and click the shape to remove it from the selection.
To deselect all shapes:
Click a blank area on your drawing.
Chapter 5 – Drawing features
37
Moving shapes
Flonet offers several ways to help you position shapes exactly where you want them.
To move shapes using your mouse:
1) Select all the shapes that you want to move.
2) Rest the pointer on one of the shapes. A four-headed arrow appears.
3) Drag the shapes to their new positions.
Tip To constrain the movement of the shapes to vertical or horizontal, hold
down Shift while you drag the shapes.
To nudge shapes by using the arrow keys:
1) Select all the shapes that you want to move.
2) Do the following:
To move the shapes to the next position to which they can snap, such as a
grid position, press an arrow key.
To move the shapes one pixel, hold down Shift while pressing an arrow key.
Resizing shapes
In Flonet, you can resize drawing shapes by dragging them until they are the size that
you want. Equipment shapes (fitting) cannot be resized. When you select a fitting
shape the resize handles appear grey and cannot be dragged.
To resize 2-dimensional shapes (such as a rectangle):
1) Select all the shapes that you want to resize.
2) Drag a selection handle until the shape is the size that you want. To resize the
shape proportionally, drag a corner handle.
To resize a 1-dimensional shape, such as a line:
1) Select the shape that you want to resize.
2) Drag an endpoint to the length you want.
Rotating or flipping shapes
You can rotate shapes by 90 degrees, flip them vertically, flip them horizontally, or
rotate them using the rotation handle.
Note You may often need to rotate the T-junction fitting to fit in with the topology
of your network.
To rotate a shape 90 degrees:
1) Select the shapes that you want to rotate.
2) Do one of the following:
To rotate the shape clockwise, right-click, point to Rotate and click Rotate
Right.

Flonet User Guide
38
To rotate the shape counterclockwise, point to Rotate and click Rotate Left.
To rotate a shape using the rotation handle:
1) Select the shapes that you want to rotate.
2) Point to the rotation handle (so that the pointer changes to a rotation cursor) and
drag the handle to rotate the selection.
The shape rotates around the pin. To move the pin, rest the pointer over the
rotation handle, and then move the pointer over the pin and drag it to a new
location.
The further you move the cursor from the selection while dragging the rotation
handle, the finer (smaller) the rotation increment.
To flip a shape vertically:
1) Select the shapes that you want to flip.
2) Right-click, point to Flip and click Flip Vertical.
To flip a shape horizontally:
1) Select the shapes that you want to flip.
2) Right-click, point to Flip and click Flip Horizontal.
To flip a shape both vertically and horizontally:
1) Select the shapes that you want to flip.
2) Right-click, point to Flip and click Flip Both.
Aligning shapes
You can align two or more shapes in a number of directions – left, center, right or top,
middle and bottom.
To align a group of shapes:
1) Select the (primary) shape to which you want to align other shapes, and then
press Ctrl and either click the shapes you want to align to it or drag a selection
rectangle over them.
2) Right-click, point to Align and click the alignment option you want.
The selected shapes are aligned with the position of the primary shape.
Grouping shapes
Standard grouping controls let you group and ungroup shapes.
To group shapes:
1) Select the shapes that you want to group.
2) Right-click, point to Grouping and click Group.

Chapter 5 – Drawing features
39
To ungroup shapes:
1) Select the group of shapes that you want to ungroup.
2) Right-click, point to Grouping and click Ungroup.
Ordering shapes
Standard ordering controls let you change the order of shapes on the diagram.
To change the order of shapes:
1) Select the one or more shapes whose order you want to change.
2) Right-click, point to Order and click the order option you want.

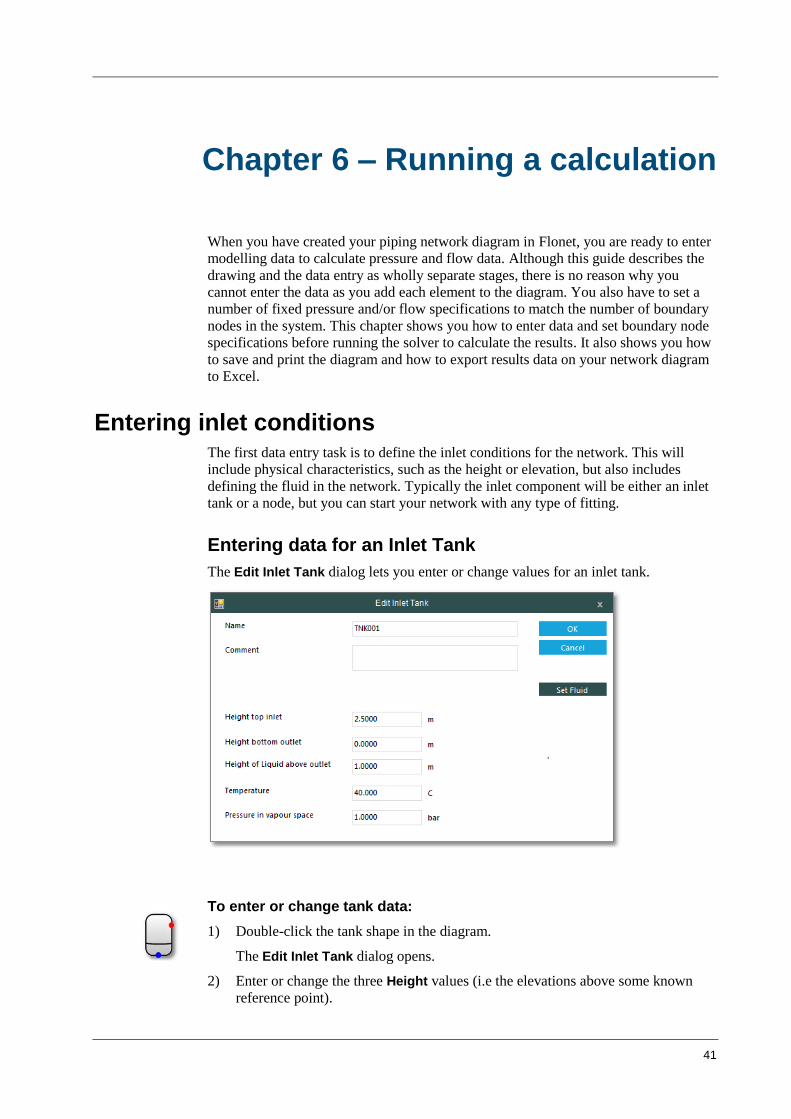
41
Chapter 6 – Running a calculation
When you have created your piping network diagram in Flonet, you are ready to enter
modelling data to calculate pressure and flow data. Although this guide describes the
drawing and the data entry as wholly separate stages, there is no reason why you
cannot enter the data as you add each element to the diagram. You also have to set a
number of fixed pressure and/or flow specifications to match the number of boundary
nodes in the system. This chapter shows you how to enter data and set boundary node
specifications before running the solver to calculate the results. It also shows you how
to save and print the diagram and how to export results data on your network diagram
to Excel.
Entering inlet conditions The first data entry task is to define the inlet conditions for the network. This will
include physical characteristics, such as the height or elevation, but also includes
defining the fluid in the network. Typically the inlet component will be either an inlet
tank or a node, but you can start your network with any type of fitting.
Entering data for an Inlet Tank
The Edit Inlet Tank dialog lets you enter or change values for an inlet tank.
To enter or change tank data:
1) Double-click the tank shape in the diagram.
The Edit Inlet Tank dialog opens.
2) Enter or change the three Height values (i.e the elevations above some known
reference point).

Flonet User Guide
42
The best values to use are the elevation levels from the piping isometrics.
Note The Height of the top inlet (if connected) must be greater than the bottom
outlet height plus the liquid height or you will get an error.
3) Enter or change the Temperature and the Pressure in the tank.
4) To specify the fluid in the network, click Set Fluid to open the PPDS calculator.
5) Click OK.
Entering data for an inlet node
The Edit Node dialog lets you define an individual node in the system. You enter the
pressure at the node and the height above a fixed reference point. For an external
node, that is a mode with inlet or outlet flow, you can also add an estimated flow in or
out of the system. The direction of flow is picked up from the diagram topology.
To enter or change node data:
1) Double-click the inlet node shape in the diagram.
2) Enter or change the Height (above some known reference point).
The best values to use are the elevation levels from the piping isometrics.
3) Click Set Fluid to define the fluid in the network.
4) To set a boundary specification:
Select the Fix check box and then enter or change the Flow rate, click In or
Out in the list to set the flow direction. A flow out will show as a negative
value in the Specifications window.
Enter or change the Pressure and select the Fix check box.
Note You can set both a flow and a pressure on a single node, as long as the
number of specifications in the network matches the number of boundary nodes.
5) Click OK.
Entering data for an inlet fitting

Chapter 6 – Running a calculation
43
In some circumstances you may use a specific fitting, such as a restriction orifice, as
the inlet point of your network rather than a node or inlet tank.
To specify inlet data for an inlet fitting:
1) Double-click the inlet fitting shape in the diagram.
Flonet creates associated in and out nodes for every fitting other that a node.
2) Click the In button on the dialog.
3) Click Set Fluid to define the fluid in the network.
4) To set a boundary specification:
Select the Fix check box and then enter or change the Flow rate, click In or
Out in the list to set the flow direction. A flow out will show as a negative
value in the Specifications window.
Enter or change the Pressure and select the Fix check box.
Note You can set both a flow and a pressure on a single node, as long as the
number of specifications in the network matches the number of boundary nodes.
5) Click OK.
Specifying the fluid in the network
The Fluid dialog lets you specify one or more separate temperature/pressure points to
span the operating range of the pipe network. The Physical Properties command
calls the PPDS calculator tool to compute the density and viscosity of the fluid for
each of these points. You can retrieve the data for a particular fluid from the Library

Flonet User Guide
44
or copy data from the Library to the model so you can modify the data without
needing to save it back to the Library.
To retrieve physical properties data:
1) On either the Edit Inlet Tank dialog or the Edit Node dialog for an inlet node or
fitting, click Set Fluid.
2) Select the fluid in the Library Fluid list.
The Library data appears in the dialog.
3) Click OK.
To retain a local copy of physical properties data:
1) On either the Edit Inlet Tank dialog or the Edit Node dialog for an inlet node or
fitting, click Set Fluid.
2) Select the fluid in the Library Fluid list.
3) Click Copy.
The Library data is copied locally to the model with the name appearing as <local
fluid>. Any changes you make will be saved with the project without changing
the Library data.
4) Click OK.
To enter physical properties data:
1) On either the Edit Inlet Tank dialog or the Edit Node dialog for an inlet node or
fitting, click Set Fluid.
2) In the Properties box, enter how many temperature/pressure points span the
operating range of the pipe network.
3) Enter each of the temperatures and pressures combinations.

Chapter 6 – Running a calculation
45
4) Click Physical Properties to open the PPDS Calculator. See “PPDS calculator”
on page 71.
The density and viscosity for each pressure/temperature pair are added to the
table.
5) Click OK.
Entering data for nodes and junctions Once you have set the inlet conditions you have to define the conditions for the
internal nodes in the system. You can do this in either of two ways: use a single dialog
to enter all the conditions, or double-click each node to define in turn.
Entering data for multiple nodes
The Edit Input values dialog lets you define conditions for all or selected nodes in the
network.
To enter node data:
1) Do one of:
In the Model ribbon, click All Nodes.
Select the nodes in the diagram, either by Ctrl+click or by dragging over
them, and then on the Model ribbon click Selected Nodes.
The Edit Input values dialog opens listing the nodes from your piping diagram.
2) Specify the pressures for each node.
3) For the Elevation, enter the height of each node above some known reference
point.
The best values to use are the elevation levels from the piping isometrics.
Note Remember that ground level may not be constant if using it as a datum.
This is especially true with networks spread over a large area.
4) Enter the Temperature for each node.
5) The data is saved as you go. Click Close (X) to close the dialog.

Flonet User Guide
46
Entering data for an individual internal node
The Edit Node dialog lets you enter or change values for an individual node. You can
also use the dialog to change the node name or to add a comment or description.
To enter or change node data:
1) Double-click the internal node shape in the diagram.
2) Enter or change the Height (above some known reference point).
The best values to use are the elevation levels from the piping isometrics.
3) Click OK.
Entering data for a tee junction
The Edit Node dialog lets you enter or change values for an individual tee junction.
You can also use the dialog to change the name or to add a comment or description to
the node.
Note Unlike other fittings, a tee junction is a special version of a node.

Chapter 6 – Running a calculation
47
To enter or change tee junction data:
1) Double-click the tee shape in the diagram.
The Edit Node dialog opens.
2) Enter or change the Height (above some known reference point).
The best values to use are the elevation levels from the piping isometrics.
3) Specify whether the junction is a T or a Y shape. For a Y junction enter the angle.
For a curved junction enter the corner radius.
4) Click OK.
Entering data for a node as a tee junction
Although there is a specific tee-junction fitting, you can set up your diagram with the
standard node fitting instead. The Edit Node dialog lets you enter or change values for
the tee junction. You can also use the dialog where there are three pipes into the node,
but you don’t want it classed as a tee.
To enter or change tee junction data:
1) Double-click the node shape in the diagram.
The Edit Node dialog opens.
2) Enter or change the Height (above some known reference point).
The best values to use are the elevation levels from the piping isometrics.
3) If the junction is to be specified as a T-junction, click the Tee-Leg Pipe in the
list. If the junction is not a tee (the default) the solver will not calculate a pressure
drop across the junction.
4) For a tee junction, specify whether the junction is a T or a Y shape. For a Y
junction enter the angle. For a curved junction enter the corner radius.
5) Click OK.

Flonet User Guide
48
Entering data for an individual outlet node
The Edit Node dialog lets you define an individual node in the system. You enter the
pressure at the node and the height above a fixed reference point. For an external
node, that is a mode with inlet or outlet flow, you can also add an estimated flow in or
out of the system. The direction of flow is picked up from the diagram topology.
To enter or change node data:
1) Double-click the boundary node shape in the diagram.
The Edit Node dialog opens.
2) Enter or change the Height (above some known reference point).
The best values to use are the elevation levels from the piping isometrics.
3) To set a boundary specification:
Select the Fix check box and then enter or change the Flow rate, click In or
Out in the list to set the flow direction. A flow out will show as a negative
value in the Specifications window.
Enter or change the Pressure and select the Fix check box.
Note You can set both a flow and a pressure on a single node, as long as the
number of specifications in the network matches the number of boundary nodes.
4) Click OK.

Chapter 6 – Running a calculation
49
Entering data for pipes and fittings
Entering data for multiple pipes
The Edit Input values dialog lets you enter physical data for all or selected pipes in
the system. The parameters include pipe length, inner diameter, roughness and fittings
loss coefficient. Use the standard piping calculators to enter many of these values.
To enter data for multiple pipes:
1) Do one of:
In the Model ribbon, click All Pipes.
Select the pipes in the diagram, either by Ctrl+click or by dragging over
them, and then on the Model ribbon click Selected Pipes.
The Edit Input values dialog opens listing the pipes from your piping diagram.
2) To specify the Diameter, select one or more cells in the column, right-click and
click Pipe Diameter to open the Pipe Inner Diameter calculator. See “Pipe inner
diameter calculator” on page 73.
3) To specify a Fittings Loss Coefficient (K value), select one or more cells in the
column, right-click and click KValue Calculator to open the calculator. See “K-
value calculator” on page 74.
4) Enter the Length of each pipe.
5) To specify the Roughness, select one or more cells in the column, right-click
and click Roughness to open the Roughness calculator. See “Pipe roughness
calculator” on page 74.
6) The data is saved as you go. Click Close (X) to close the dialog.

Flonet User Guide
50
Entering data for a single pipe
The Edit Pipe dialog lets you enter or change values for an individual pipe. You can
also use the dialog to change the name or to add a comment or description.
To enter or change pipe data:
1) Double-click the connecting line in the diagram.
The Branch - Edit Pipe dialog opens.
2) Enter or change the length of the pipe, if required.
3) To specify the pipe inner diameter, click the button on the right to open the
calculator. See “Pipe inner diameter calculator” on page 73.
4) To specify the pipe roughness, click the button on the right to open the calculator.
See “Pipe roughness calculator” on page 74.
5) To specify the Fittings loss coefficient, click the button on the right to open the
calculator. See “K-value calculator” on page 74.
6) Click OK.

Chapter 6 – Running a calculation
51
Entering data for a heat exchanger
The Edit Heat Exchanger dialog lets you enter or change values for an individual
heat exchanger. You can also use the dialog to change the fitting name or to add a
comment or description.
To enter or change Heat Exchanger data:
1) Double-click the Heat Exchanger shape in the diagram.
2) Enter or change the Mode.
3) Enter or change the Pressure Drop, as required.
4) Click OK.
Entering data for a restriction orifice
The Edit Restriction Orifice dialog lets you enter or change values for an individual
restriction orifice. You can also use the dialog to change the fitting name or to add a
comment or description.
To enter or change restriction orifice data:
1) Double-click the restriction orifice (R/O) shape in the diagram.
2) Enter or change the Orifice Diameter.
3) Enter or change the Plate Thickness (the thickness from the upstream to the
downstream side).

Flonet User Guide
52
4) Click OK.
Entering data for a diameter changer
The Edit Diameter Changer dialog lets you enter or change values for an individual
enlargement or contraction. You can also use the dialog to change the fitting name or
to add a comment or description.
To enter or change Diameter Changer data:
1) Double-click the Diameter Changer shape in the diagram.
2) The name is set when you drag the shape onto your diagram. You can change it
here, if required.
3) Select the Type as one of:
ABRUPT – immediate right angle change in diameter
CONICAL – assumes cone of total angle ≤ 60°
CHAMFER – tapered change in diameter
ROUND – smoothly rounded change in diameter
4) If Conical specify the angle, if chamfer set the Depth, if round set the radius.
5) Click OK.

Chapter 6 – Running a calculation
53
Entering data for a block valve
The Edit Block Valve dialog lets you enter or change values for an individual block
valve. You can also use the dialog to change the fitting name or to add a comment or
description.
To enter or change Block Valve data:
1) Double-click the Block Valve shape in the diagram.
2) Select the State of the valve as Open or Closed.
3) Click OK.
Entering data for a relief valve
The Edit Relief valve dialog lets you enter or change values for an individual relief
valve. You can also use the dialog to change the fitting name or to add a comment or
description.
To enter or change relief valve data:
1) Double-click the relief valve shape in the diagram.
2) Enter or change the Set Pressure (the pressure at which the safety valve starts to
lift).
3) Click OK.
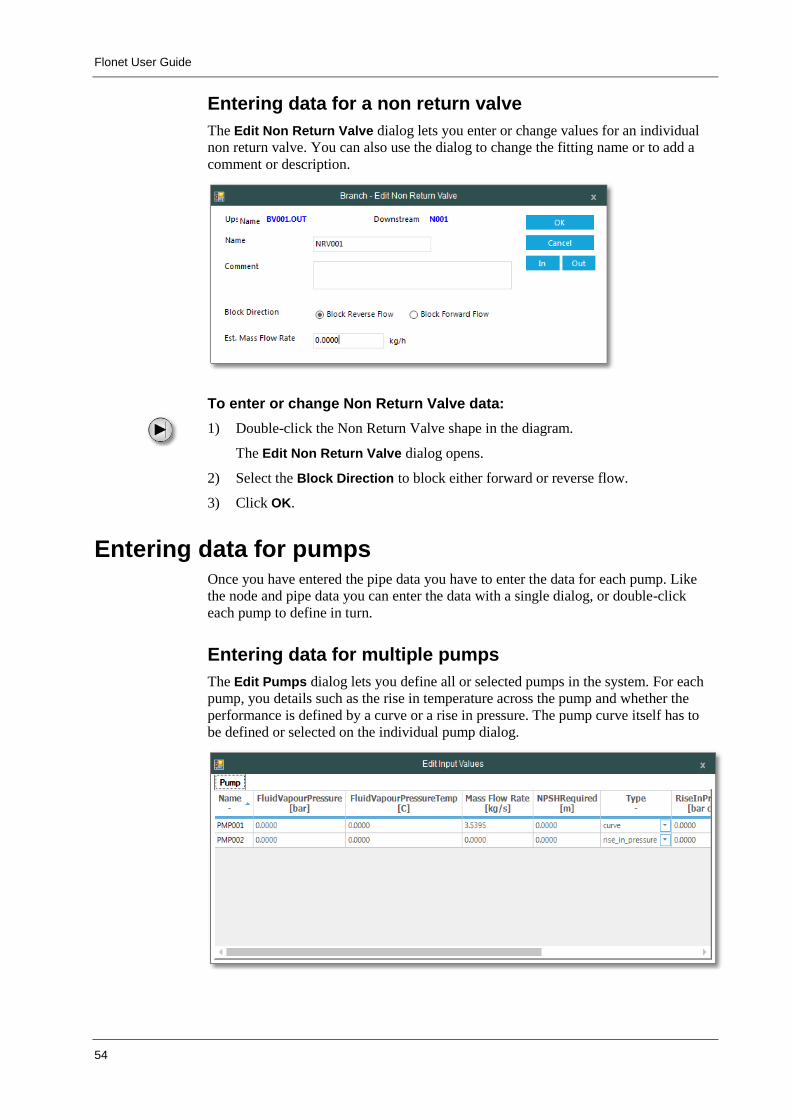
Flonet User Guide
54
Entering data for a non return valve
The Edit Non Return Valve dialog lets you enter or change values for an individual
non return valve. You can also use the dialog to change the fitting name or to add a
comment or description.
To enter or change Non Return Valve data:
1) Double-click the Non Return Valve shape in the diagram.
The Edit Non Return Valve dialog opens.
2) Select the Block Direction to block either forward or reverse flow.
3) Click OK.
Entering data for pumps Once you have entered the pipe data you have to enter the data for each pump. Like
the node and pipe data you can enter the data with a single dialog, or double-click
each pump to define in turn.
Entering data for multiple pumps
The Edit Pumps dialog lets you define all or selected pumps in the system. For each
pump, you details such as the rise in temperature across the pump and whether the
performance is defined by a curve or a rise in pressure. The pump curve itself has to
be defined or selected on the individual pump dialog.

Chapter 6 – Running a calculation
55
To edit pump data:
1) Do one of:
In the Model ribbon, click All Pumps.
Select the pumps in the diagram, either by Ctrl+click or by dragging over
them, and then on the Model ribbon click Selected Pumps.
The Edit Input values dialog opens listing the pumps from your piping diagram.
2) In NPSHRequired, enter the minimum pressure required at the suction port of the
pump to keep the pump from cavitating.
3) In Type, specify whether the pump performance is defined by a pressure drop or
a pump curve. For a pressure drop enter the RiseInPressure across the pump.
For a curve you will need to specify the pump curve on the individual dialog.
4) In Temp rise, enter the rise in temperature across the pump.
5) The data is saved as you go. Click Close (X) to close the dialog.
Entering data for an individual pump
The Edit Pump dialog lets you enter or change values for an individual pump.
To enter (or change) pump data as a fixed pressure rise:
To enter or change pump data:
1) Double-click the pump shape in the diagram.
2) Enter the rise in temperature across the pump.
3) The pump inlet and outlet heights are automatically taken from the previous
upstream node. To change click the button next the field (or the In button)on the
dialog.

Flonet User Guide
56
4) On the Edit Node dialog that opens, select the Override upstream height check
box and enter the new height.
5) Click the Rise in pressure across the pump and enter the pressure difference.
6) Click the NPSH tab to enter the NPSH pressure data. See “Entering NPSH data
for a pump” on page 56.
Entering NPSH data for a pump
The NPSH tab on the Edit Pump dialog lets you enter or change NPSH pressure data
for the pump.
Net Positive Suction Head (NPSH)
The NPSH Available (NPSHa) is the absolute pressure at the suction port of the pump.
The NPSH Required (NPSHr) is the minimum pressure required at the suction port of
the pump to keep the pump from cavitating.
NPSHa is a function of the netwoek and is calculated, whereas NPSHr is a function of
the pump and must be provided by the pump manufacturer. NPSHa must be greater
than NPSHr for the pump system to operate without cavitating.
To enter or change NPSH data:
1) Click the NPSH tab.
2) Enter or change the various parameters as required
The Inlet Pressure and the NPSH available (NPSHa) are calculated by the Solver.
3) In NPSHr enter the NPSH required. This is provided by the pump manufacturer.
The NPSHr must be greater thean NPSHa. If you enter a larger value a red
warning box appears round the NPSHa value.

Chapter 6 – Running a calculation
57
4) In @ Temp, enter the rise in temperature across the pump.
5) Click OK.
Defining a pump’s performance with a pump curve
The Edit Pump dialog lets you represent your pump’s performance with a pump
curve. This can be entered manually, retrieved from a previous saved library curve or
captured using the Graph Reader. You can also copy curve data from the Library to
the model so you can modify the data without needing to save it back to the Library.
To retrieve pump curve data from a library:
1) Double-click the pump shape in the diagram.
2) Under Defined By click Curve to specify the performance as a pump curve.
The Curve tab appears.
3) Select the pump curve you want in the Library Curve list.
The dialog is populated from the library data.
4) Click OK.
To retain a local copy of Library curve data:
1) Double-click the pump shape in the diagram.
2) Under Defined By click Curve to specify the performance as a pump curve.

Flonet User Guide
58
The Curve tab appears.
3) Select the pump curve you want in the Library Curve list.
4) Click Copy.
The Library data is copied locally to the model with the name appearing as <local
pump curve>. Any changes you make will be saved with the project without
changing the Library data.
5) Click OK.
To enter or change pump data manually:
1) Double-click the pump shape in the diagram.
2) Under Defined By click Curve to specify the performance as a pump curve.
The Curve tab appears.
3) Enter a name in the Name box.
4) Enter the pump speed (in rpm) and the impeller diameter.
5) In Points, select the number of points on the manufacturer’s pump curve.
6) For each point, enter the head and the flow rate.
7) Click OK.
To enter a curve using the graph reader:
1) Double-click the pump shape in the diagram.
2) Under Defined By click Curve to specify the performance as a pump curve.
The Curve tab appears.
3) In the Curve tab click Graph Reader to open the tool. See “Using the Graph
Reader” on page 92
On return, the dialog is populated by the Graph Reader.
4) Click OK.
Defining flow/pressure specifications The model requires as many fixed flow and/or pressure values as there are boundary
nodes. When you define a flow rate, you can specify whether the flow is into or out of
the network.Typically these are likely to be at the inlet or outlet nodes, but they don’t
have to be. Also the fixed values need to make sense. For example, a model for a
network with a single inlet that divides into two outlet branches would require three

Chapter 6 – Running a calculation
59
fixed values. If you define inlet and outlet pressures and a flow rate through one of the
branches, the solver would fail and give you an error messge.
Changing flow/pressure specifications
The Specifications window lets you add or change the values for the fixed pressures
and/or flow rates easily so that you can quickly rerun the solver with a changed fixed
value without needing to open an edit dialog.
To add a flow/pressure specification:
1) Click the drop-down arrow next to Select and click the node for the specification.
2) Under Type click Pressure or Flow as appropriate.
3) Enter the fixed value.
The Fix check box in the Edit Node dialog is selected.
To edit a specification:
Click in the Value field and edit or retype.
You can also change the type, if required.
To delete a flow/pressure specification:
1) Click the X button (at the end of the row)
A prompt asks you to confirm the action.
2) Click Yes. To remove the row from the grid.
The Fix check box in the Edit Node dialog is cleared.
Running the solver and viewing the results When you have entered all the data for your calculation, you are ready to run the
solver and view your results.
To run the solver:
Do one of:
Click the Solve button on the ribbon.
Click in the Results window.
Press F9.
When the calculations are complete, the results appear in the Results window.

Flonet User Guide
60
Viewing the results
The Results window shows the computed inlet and outlet pressures and flow rates for
each pipe and each pump in the network. The Results tab let you see values for pipes,
such as inlet and outlet pressure, flowrate and mean velocity of the flow. The Pumps
tab shows values for pumps, such as mass / volumetric flowrates and differential
head/pressure.
The toolbar at the bottom provides options for exporting the results to Excel and to
add or remove columns from the results.
Filtering your results data
Flonet contains a large number of properties that are calculated by the Solver. The
results that appear in each of the tabs in the Results window is set by default. You can
add or remove columns in a specific tab to.
To add or remove columns in a results tab:
1) In the Results window, click the tab you want to filter.
2) Click Add/Remove Columns.
3) Select or clear the check boxes for the various properties, as required. You can
clear the whole selection by clicking Clear Selected.
4) Click OK to save your selection.
The selection you make is saved with the model when you save the file.
To reset a results tab to the default setting:
1) In the Results window, click the tab you want to reset.

Chapter 6 – Running a calculation
61
2) Click Add/Remove Columns.
3) Click Reset to defaults.
4) Click OK to save your selection.
The reset command only reset the current tab. Changes made to other tabs are
unaffected.
Exporting your results data to Microsoft Excel
The Results window contains a command to let you export the results data into an
Excel spreadsheet.
To export the results to Excel:
1) In the Results window, click Export Results to Excel.
2) Enter a name for your results file.
3) Browse to where you want to save the file and click Save.
A message confirms the export.
Note Each tab in the Results window is exported as a separate worksheet.


63
Chapter 7 – Advanced features
Flonet provides various advanced features to let you view data in special editor
dialogs, use generic fittings to represent non-standard devices and use controllers to
solve sizing problems, such as for relief values.This chapter shows you how to use
these features.
Special editor dialogs Two extra versions of the Edit Input values dialogs can be called from the Model
ribbon – a full (All) version that lets you enter or edit all the data from a single dialog
and two options for selecting data according to its position in the stream.
Entering data for all elements
The full version of the Edit Input values dialog provides multiple tabs that let you
define conditions for all nodes, pumps, pipes and other fittings in the network.
To enter or edit data:
1) In the Model ribbon, click All.
The Edit Input values dialog opens listing all the components in your piping
diagram.
2) Click a tab to enter data values for a particular category, such as Pipe to edit all
the pipes in the network.
Note that as pumps and other fittings have associated inlet and outlet nodes, they
generate an extra node tab. There is also an extra node tab if you have used
diagram connectors to link multiple diagrams.
3) The data is saved as you go. Click Close (X) to close the dialog.

Flonet User Guide
64
Entering data by stream position
The stream versions of the Edit Input values dialog provide a single tab that lets you
enter or edit data according to its position in the fluid stream. You can select either
upstream or downstream from a particular node.
To enter or edit data:
1) Click a node in the diagram and in the Model ribbon, click either Node & Up or
Node & Down.
The Edit Input values dialog opens listing the nodes, pumps, pipes and other
fittings in the order they occur in the stream. The nodes include associated inlet
and outlet nodes for pumps and other fittings
Cells in the grid are only available to enter data if applicable. For example, the
Diameter column only applies to pipes while the Elevation column only applies
to nodes.
2) The data is saved as you go. Click Close (X) to close the dialog.
Generic fittings Flonet provides two generic fittings that can be used to specify non-standard devices.
The K Value fitting lets you represent a device as a fittings loss coefficient. The Delta-
P fitting lets you specify a device whose performance cannot be represented by a

Chapter 7 – Advanced features
65
simple K-value. The device is represented by either a fixed pressure drop or by a
pressure curve similar to a pump curve.
Entering data for a K Value fitting
The Edit K Value dialog lets you enter or change values for a generic K value fitting.
You can also use the dialog to change the fitting name or to add a comment or
description.
To enter or change K Value data:
1) Double-click the K Value shape in the diagram.
2) Change the name if required.
3) Enter or change the Inner Diameter, or click the button on the right to open the
calculator. See “Pipe inner diameter calculator” on page 73.
4) Enter or change the Fittings loss coefficient, or click the button on the right to
open the calculator. See “K-value calculator” on page 74.
5) Click OK.

Flonet User Guide
66
Entering data for a Delta-P fitting
The Edit Delta P dialog lets you enter or change values for a generic Delta-P fitting.
You can also use the dialog to change the fitting name or to add a comment or
description.
To enter (or change) Delta-P data as a fixed pressure drop:
1) Double-click the Delta-P shape in the diagram.
2) Under Defined By enter the fixed pressure drop.
3) Click OK.
Defining a Delta-P fitting with a pressure curve
The Edit Delta P dialog has a secondary option, which lets you represent your device
with a pressure curve. This can be entered manually, retrieved from a previous saved
library curve or captured using the Graph Reader.You can also copy curve data from

Chapter 7 – Advanced features
67
the Library to the model so you can modify the data without needing to save it back to
the Library.
To retrieve pressure curve data from the library:
1) Double-click the Delta-P shape in the diagram.
2) Under Defined By click Curve to specify the performance as a curve.
The Curve tab appears.
3) Select the pressure curve you want in the Library Curve list.
The dialog is populated from the library data.
4) Click OK.
To retain a local copy of Library curve data:
1) Double-click the Delta-P shape in the diagram.
2) Under Defined By click Curve to specify the performance as a curve.
The Curve tab appears.
3) Select the pressure curve you want in the Library Curve list.
4) Click Copy.
The Library data is copied locally to the model with the name appearing as <local
pressure curve>. Any changes you make will be saved with the project without
changing the Library data.
5) Click OK.

Flonet User Guide
68
To enter or change pressure curve data manually:
1) Double-click the Delta-P shape in the diagram.
2) Under Defined By click Curve to specify the performance as a curve.
The Curve tab appears.
3) In Points, select the number of points on the pressure curve.
4) For each point, enter the flow rate and the pressure .
5) Click OK.
To capture the curve data using the graph reader:
1) Double-click the Delta-P shape in the diagram.
2) Under Defined By click Curve to specify the performance as a curve.
The Curve tab appears.
3) Click Graph Reader to open the tool. See “Using the Graph Reader” on page 92
On return, the dialog is populated by the Graph Reader.
4) Click OK.

Chapter 7 – Advanced features
69
Using controllers Flonet provides two controllers that allow you model the effects of a pressure or flow
control valve.
Flow Controller
The flow controller lets you model the performance of a flow control valve in your
network.
To enter (or change) a flow controller:
1) Double-click the Flow Controller shape in the diagram.
2) Enter the flow set point.
3) Specify the action of the valve – whether it opens or closes if the measured flow
is too high.
4) Specify the reference branch (for the measured flow). This can be the current
branch or a different branch. In this case select the reference node in the
dropdown list.
5) Click OK.
To test your control valve
You can also use the controller to enter the flow coefficient (Cv) or the Flow Factor
(Kv) of the control valve.
When you run the solver the results will tell you what percentage of its capacity is
used.

Flonet User Guide
70
Pressure Controller
The pressure controller lets you model the performance of a pressure control valve in
your network.
To enter (or change) a pressure controller:
1) Double-click the Pressure Controller shape in the diagram.
2) Enter the pressure set point.
3) Specify the action of the valve – whether it opens or closes if the measured
pressure is too high.
4) Specify the reference node (the node for the measured pressure). This can be the
node immediately upstream or downstream or a node in a different branch. In this
case select the reference node in the dropdown list.
5) Click OK.
To test your control valve
You can also use the controller to enter the flow coefficient (Cv) or the Flow Factor
(Kv) of the control valve.
When you run the solver the results will tell you what percentage of its capacity is
used.

71
Chapter 8 – Standard calculators
Flonet contains a number of calculators that are used to complete various process
values for you. The PPDS calculator provides extensive physical properties data for
fluids, performing process calculations involving this data. The standard piping
calculators provide physical data and calculations for standard pipes and fittings. This
chapter shows you how to use these calculators. They are common to all of the PEL
applications.
PPDS calculator The PPDS calculator helps you complete physical characteristics (namely the density
and viscosity) of the fluid (liquid or gas) in your network.
The upper part of the dialog contains a stream composition worksheet, which lets you
define the constituent parts of the process stream. Whenever you open the calculator
the table always contains the last values used. This lets you run multiple calculations
on the same fluid without having to specify or load the stream each time.
You can add components to the stream and then specify the molar and/or mass
quantities in the stream.
To calculate physical characteristics fields:
1) On the Physical Properties dialog, click Calculate.
2) Add the various components, as described in “Adding Components” on page 72.
The molecular weight of each component and the average molecular weight for
the stream appear in the Mol Wt column on the worksheet.

Flonet User Guide
72
If you want to remove a component from the worksheet, click the component
name to select the whole row, right-click the row and click Remove Selected
Components.
3) Specify the quantities or relative amounts of each component in one of the other
four columns:
Molar – the molar quantity of each component.
Mol Fraction –the mole fraction of each component.
Mass – the mass of each component
Mass Fraction – the mass fraction of each component
The worksheet calculates the values in the other three columns and the totals. If
you enter fraction values, you must ensure that they total to 1.
If you need to restart the calculation, right-click the worksheet and click Zero All
Cells.
4) Click Calculate.
The density and viscosity values for each pressure/temperature pair are
completed. You can click on any calculated value to see its accuracy.
5) Click OK to return the values to the Physical Properties dialog.
To clear all components:
Click Clear Worksheet.
All of the components are removed from the table.
Adding Components
To add a component:
1) Click Add Component.
The Select Components dialog opens.
2) Click the Databank in the list and start typing a search string.
Matching entries appear in the Search Results pane as you type.
3) Select the component you want and click Add to Stream.

Chapter 8 – Standard calculators
73
4) Add all the components you want and then click Close.
Saving the current stream
The Files tab lets you save the current stream on the Feeds tab as a file or recall a
previously saved stream file. The saved file (.psm) contains the components and the
calculated molar/mass quantities, fractions and totals.
To save the current stream:
1) Do one of:
On the File menu, click Save Stream File.
Right click the worksheet and click Save current Feed.
2) Change the file name and location, if required, and click Save.
To open a saved stream:
1) On the File menu, click Open Stream File.
2) Browse to select the stream file and click Open.
The recalled stream now appears on the Feeds tab.
Pipe inner diameter calculator This calculator returns a pipe’s inner diameter (in mm) based on the standard pipe size
and the available pipe schedules for that pipe size. The calculator supports both the
American (ANSI/ASME/API) pipe sizes standard, which is in imperial units, and the
European (DIN) system which uses metric units. The calculator also derives the
external diameter and the wall thickness.
The American standard pipe sizes range from 1/8 inch up to 36 inch. The schedules,
which give the pipe thickness, range from 5S up to XXS (Double Extra Strong).
To calculate a pipe internal diameter:
1) Do one of:

Flonet User Guide
74
On the Edit Input Values dialog, click the field that is to contain the pipe
inner diameter. Right-click the field and click Pipe Inner Diameter.
On a component editor dialog, click the button next to the field.
2) Click the required standard in the drop-down list, select the required pipe size in
the left pane and then select the schedule in the right pane.
The calculated values appear in the three boxes at the bottom of the dialog, with
the inner diameter selected for return.
3) Click OK.
The inner diameter value is returned to the calling dialog field.
Pipe roughness calculator This calculator is used to return an absolute roughness value for a pipe’s internal
surface. A smooth surface such as glass or plastic has a low roughness value, while
badly corroded metal or brick has a high roughness. The values are in millimeters.
To calculate a pipe roughness:
1) Do one of:
On the Edit Input Values dialog, click the field that is to contain the
absolute roughness. Right-click the field and click Pipe Roughness.
On a component editor dialog, click the button next to the field.
2) Select the required Surface Type in the list and click OK.
The absolute roughness value is returned to the calling dialog field.
K-value calculator The Fittings Loss (K-value) calculator is a multi-stage tool that enables a process
engineer to enter details of all the various fittings, such as bends, valves and T-

Chapter 8 – Standard calculators
75
junctions, that contribute to pressure drop in a piping system. The total loss calculation
appears on the Summary tab, which is the default view when you call the calculator.
To calculate the fittings loss (K-value):
1) Do one of:
On the Edit Input Values dialog, click the field that is to contain the fittings
loss. Right-click the field and click K Value Calculator.
On a component editor dialog, click the button next to the field.
2) Add the various fittings on the other tabs as defined in the following sections.
As you add details on a tab, the total loss for that tab appears on the summary tab.
3) If you need to enter any Manual Adjustment, enter the value and add a reason
for the adjustment (optional).
The manual adjustment field is for entering miscellaneous fittings not covered on
the other tabs. You can also use it to manually adjust the model in the validation
stage or for studying the effect of changes, such as a control valve position.
4) When you have completed the calculation click OK.
The total loss value is returned to the calling dialog field.
Note As the calculator retains the values last used, you can click OK to save the
calculation at any stage and then restart the calculator to continue.

Flonet User Guide
76
Adding tee junctions
The Tee Junctions calculation takes into account any blanked off junctions. This can
also be a line where the dead leg is isolated at a valve further downstream.
To add tee junctions:
1) On the Fittings Loss Calculator dialog, click the Tee Junctions tab.
2) Click the Tee Junction Type in the list, enter the Quantity and click Add.
The items are added to the table at the bottom of the tab, with the loss shown for
each addition. The total for all junctions appears on the Summary tab.
To delete tee junctions:
Select the entry in the table and click Delete.
The entry is removed from the calculation.
Adding bends
Bends are added in a similar way to tee-junctions.
To add bends:
1) On the Fittings Loss Calculator dialog, click the Bends tab.
2) Click the Bend Type in the list, enter the Radius (of the bend) and the Diameter
(of the pipe), enter the Quantity and click Add.

Chapter 8 – Standard calculators
77
Note You can enter any two of the radius, the diameter and the ratio of the two.
If you enter the radius and the diameter, the ratio is calculated. If you enter the
ratio and one other parameter, the omitted parameter appears as “unspecified”.
The items are added to the table at the bottom of the tab, with the loss shown for
each addition. The total for all bends appears on the Summary tab.
To delete bends:
Select the entry in the table and click Delete.
The entry is removed from the calculation.
Adding valves
Valves are defined by type and by one or more categories within the type. For
example, the Globe Valve type has two categories – cast valves and forged valves.
To add valves:
1) On the Fittings Loss Calculator dialog, click the Valves tab.
2) Double-click the Valve Type in the list and select the category you want.
3) Click the Pipe Size in the list, enter the Quantity and click Add.
The items are added to the table at the bottom of the tab, with the loss shown for
each addition. The total for all valves appears on the Summary tab.
To delete valves:
Select the entry in the table and click Delete.
The entry is removed from the calculation.

Flonet User Guide
78
Adding expansions/contractions
This tab is for adding expansion and contraction joints to the calculation.
For exit losses: Select an expansion with a small/large area ratio of zero.
For entry losses: Select a contraction with a small/large area ratio of zero.
To add expansions or contractions:
1) On the Fittings Loss Calculator dialog, click the Expansions/contractions tab.
2) Click Contraction or Expansion, as appropriate, enter the Large Area, the
Small Area, enter the Quantity and click Add.
Note You can enter any two of the large area, the small area and the ratio of the
two. If you enter the two areas, the ratio is calculated. If you enter the ratio and
one other parameter, the omitted parameter appears as “unspecified”. You can
also edit the calculated ratio for entry and exit losses.
The items are added to the table at the bottom of the tab, with the loss shown for
each addition. The total for all expansions appears on the Summary tab.
To delete expansions or contractions:
Select the entry in the table and click Delete.
The entry is removed from the calculation.
Adding User Defined (Process Equipment) items
The easiest way to model process equipment (for example, heat exchangers and
filters) is as a section of pipe with a fitting loss coefficient. The pipe length needs to be
short so that the pressure drop is solely due to the fittings –1m is generally used.

Chapter 8 – Standard calculators
79
The values for mass flow, pressure drop etc. can be obtained from the process data
sheet. Static head changes between inlet and outlet should not be taken into account as
the node information deals with this.
To add process equipment:
1) On the Fittings Loss Calculator dialog, click the User Defined tab.
2) Enter a name for the item and specify the following items:
Pipe Inner Diameter
Flow Rate
Density
Pressure drop
3) Enter the Quantity and click Add.
The items are added to the table at the bottom of the tab, with the loss shown for
each addition. The total for all process equipment appears on the Summary tab.
To delete a process equipment item:
Select the entry in the table and click Delete.
The entry is removed from the calculation.


81
Chapter 9 – Library facilities
Flonet provides a Library that allows you to save various detailed parts of the work
flow to avoid repetition. You can save fluid definitions, sections of diagrams,
manufacturer’s pump curves and pressure curves. This chapter shows you how to
build up and use your Library.
Library fluid definitions The Fluids tab on the Library dialog lets you set up and save properties for commonly
used fluids to the Library. These definitions can then be copied, amended or deleted as
required.
Adding a fluid definition to the library
To specify a fluid in the library:
1) Click the File tab and then click Library.
2) Enter a name in the Name box.
3) In Phase, click either Liquid or Gas.
4) In the Properties box, enter how many temperature/pressure points span the
operating range of the pipe network.
5) Enter each of the temperatures and pressures combinations.

Flonet User Guide
82
6) Click Physical Properties to open the PPDS Calculator. See “PPDS calculator”
on page 71.
The density, viscosity and heat capacity for each pressure/temperature pair are
added to the table.
7) Click Save.
A message confirms that the fluid definition has been saved to the Library.
8) Click OK and then click the Close button (X) to close the Library dialog.
Editing a fluid definition
At times you may want to edit a fluid definition by, for example, adding more
temperature/pressure points.
To copy a fluid definition:
1) Click the File tab and then click Library.
2) Select the fluid definition you want in the Library Fluid list.
3) Change the definition as required. If you add any pressure/temperature pairs,
click Physical Properties to open the PPDS Calculator. See “PPDS calculator”
on page 71.
4) When you have finished your definition, click Update.
A message confirms that the fluid has been saved.
5) Click OK and then click the Close button (X) to close the Library dialog.
Copying a fluid definition
The Library facilities for fluids lets you copy a definition as the start of a more
detailed definition. For example, you could copy the definition a single component
fluid and then add components to define a fluid mixture. You can also use the copy
facility to copy a Library fluid locally to a model, so that any modifications don’t have
to be saved to the Library. You can do this more easily from the Fluid dialog when
setting up your calculation. See “Specifying the fluid in the network” on page 43.
To copy a fluid definition:
1) Click the File tab and then click Library.
2) Select the fluid definition you want in the Library Fluid list.
3) Click Copy.
4) Enter a new name in the Name box.
5) If you want to add another component to the definition, click Physical
Properties to open the PPDS Calculator. See “PPDS calculator” on page 71.

Chapter 9 – Library facilities
83
6) When you have finished your definition, click Save.
A message confirms that the fluid has been saved.
7) Click OK and then click the Close button (X) to close the Library dialog.
Deleting a fluid definition
To delete a fluid definition:
1) Click the File tab and then click Library.
2) Select the fluid definition you want in the Library Fluid list.
3) Click Delete.
A message warns you that the fluid may be in use and prompts you to continue.
4) Click Yes and then click the Close button (X) to close the Library dialog.
Library diagrams Flonet lets you save selected sections from your piping diagrams to the Library, from
where they can be inserted into new network diagrams.
Saving diagram sections to the library
The Library facility for diagrams lets you save all or part of a diagram for reuse. This
starts from the diagram itself and not from the Library dialog.
To save a part of your diagram to the library:
1) Drag over the part of the diagram to select the part you want to save. You can use
Ctrl+click to add or remove individual elements from the selection.
2) Right-click in a blank area of the diagram and click Add Diagram/Selection to
Library.
3) In the Library dialog, enter a name for the diagram and either click the check
mark () button or click Save.
A message confirms that the diagram has been added to the Library.
4) Click OK.
Note You can save your diagram with the default name, <new>, and then rename it
later.
To save your whole diagram to the library:
1) Click in a blank part of the diagram so that nothing is selected.
2) Right-click in a blank area of the diagram and click Add Diagram/Selection to
Library.

Flonet User Guide
84
3) In the Library dialog, enter a name for the Diagram and either click the check
mark () button or click Save.
A message confirms that the diagram has been added to the Library.
4) Click OK.
Note You can save your diagram with the default name, <new>, and then rename it
later.
Inserting a diagram from the library
The Diagrams tab on the Library dialog lets you insert saved reusable diagram
sections into your current diagram. There are also commands to rename or delete
items from the Library.
To insert a diagram from the Library:
1) Click the File tab and then click Library.
2) Click the Diagrams tab.
3) Select the diagram you want in the Diagram Name list.
4) Click Insert.
A Message tells you the diagram has been inserted.
5) Click OK and then click the Close button (X) to close the Library dialog.
The inserted diagram section appears selected in your diagram. If you are
inserting into an existing diagram, you can then drag the selection to a suitable
position.
Renaming a diagram
When you save a diagram initially you can save the diagram with the default name
with a single- click of the check mark () or Save button.

Chapter 9 – Library facilities
85
To rename a diagram:
1) Click the File tab and then click Library.
2) Click the Diagrams tab.
3) Select the diagram you want in the Diagram Name list.
4) Click Rename.
5) Type the new name and click the check mark () button.
Deleting a diagram
To delete a diagram:
1) Click the File tab and then click Library.
2) Click the Diagrams tab.
3) Select the diagram you want in the Diagram Name list.
4) Click Delete.
A message prompts you to confirm the deletion.
5) Click Yes and then click the Close button (X) to close the Library dialog.

Flonet User Guide
86
Library pump and pressure curves The Pump Curves tab let you build up a library of pump curves for the centrifugal
pumps most commonly used in your piping networks. The Pressure Curves tab
allows you to set up equivalent curves that define the performance of fittings, such as
a heat exchanger, whose performance cannot be represented by a simple K-value.
Adding pump curves to the library
The Pump Curves tab on the Library dialog lets you set up and save a manufacturer’s
pump curve to the Library. A Library curve can then be linked to a pump in a diagram
without needing to enter all the data each time.
To add a pump curve to the Library manually:
1) Click the File tab and then click Library.
2) Click the Pump Curves tab.
3) Enter a name in the Name box.
4) Enter the pump speed (in rpm) and the impeller diameter.
5) In Points, select the number of points on the manufacturer’s pump curve. Then
for each point, enter the head and the flow rate.
6) When you have entered all the data, click Save.
A message confirms that the curve has been saved to the Library.
7) Click OK and then click the Close button (X) to close the Library dialog.
To add a pump curve using the graph reader
1) Click the File tab and then click Library.
2) Click the Pump Curves tab.

Chapter 9 – Library facilities
87
3) Enter a name in the Name box.
4) Enter the pump speed (in rpm) and the impeller diameter.
5) Click Graph Reader to open the Graph Reader. See “Using the Graph Reader”
on page 92.
6) When you have entered all the data, click Save.
Adding pressure curves to the library
The Pressure Curves tab on the Library dialog lets you set up and save a pressure
curve to the Library. A curve can then be linked to a Pressure Drop in a diagram
without needing to enter all the data each time.
To add a pressure curve to the Library manually:
1) Click the File tab and then click Library.
2) Click the Pressure Curves tab.
3) Enter a name in the Name box.
4) In Points, select the number of points on the pressure curve. Then for each point,
enter the flow rate and pressure.
5) When you have entered all the data, click Save.
A message confirms that the curve has been saved to the Library.
6) Click OK and then click the Close button (X) to close the Library dialog.
To add a pressure curve using the graph reader
1) Click the File tab and then click Library.
2) Click the Pump Curves tab.
3) Enter a name in the Name box.

Flonet User Guide
88
4) Enter the pump speed (in rpm) and the impeller diameter.
5) Click Graph Reader to open the Graph Reader. See “Using the Graph Reader”
on page 92.
6) When you have entered all the data, click Save.
Editing a curve
At times you may need to edit a pump or pressure curve to reflect changes in data.
To copy a curve definition:
1) Click the File tab and then click Library.
2) Click the Pump Curves (or Pressure Curves) tab.
3) Select the curve you want in the Library Curve list.
4) Change the data as required.
5) When you have finished your changes, click Update.
A message confirms that the curve has been saved.
6) Click OK and then click the Close button (X) to close the Library dialog.
Copying a curve definition
The Library facilities lets you copy a curve as the start of a similar curve. For
example, you could copy a manufacturer’s pump curve and then edit the parameters
for a different impeller diameter. You can also use the copy facility to copy a Library
curve locally to a model, so that any modifications don’t have to be saved to the
Library. You can do this more easily from the Edit Pump dialog when setting up your
calculation. See “Defining a pump’s performance with a pump curve” on page 57.
To copy a curve definition:
1) Click the File tab and then click Library.
2) Click the Pump Curves (or Pressure Curves) tab.
3) Select the curve definition you want in the Library Curve list.
4) Click Copy.
5) Enter a new name in the Name box.
6) Change or add to the data as required.
7) When you have entered all your data, click Save.
A message confirms that the curve has been saved.
8) Click OK and then click the Close button (X) to close the Library dialog.

Chapter 9 – Library facilities
89
Deleting a curve definition
To delete a curve definition:
1) Click the File tab and then click Library.
2) Click the Pump Curves (or Pressure Curves) tab.
3) Select the curve definition you want in the Library Curve list.
4) Click Delete.
A message warns you that the curve may be in use and prompts you to continue.
5) Click Yes and then click the Close button (X) to close the Library dialog.


91
Chapter 10 – Graph Reader
The Graph Reader is an image tool that typically lets you capture performance data
from a manufacturer’s pump curve, where that data is provided as a graph. It can also
be used to capture pressure drop data for any fitting whose performance cannot be
represented by a simple K-value. This chapter shows you how to capture the curve
data from a graphic image.
Graph Reader tool window With a graph loaded, the Graph Reader has the following, or similar, user interface.
The following main features are apparent:
Graph reading controls The controls for the tool appear at the top of the window,
with standard Open and Cancel buttons at the bottom right. The controls are:
Load Graph Opens dialog to select graph image to be loaded.
Reset Extents Resets selected origin and extent points.
Reset Resets Graph Reader entirely.
Points Shows list of selected points on the graph that plot the curve.
Clear Last Clears the last point selected on the graph.
Clear All Clears all the points selected on the graph.
Loaded curve graph The main part of the window shows the loaded graph image.

Flonet User Guide
92
Cross hairs Blue cross hairs let you select each point on the curve. A zoom window
lets you select points more accurately.
Calibration controls Controls let you define maximum and minimum values and
units for both the x and y axes to define the graph scale. You can also allow for a
logarithmic scale.
Using the Graph Reader When you first call the Graph Reader, a warning message banner prompts you to load
the graph image file. Subsequent messages, either as a popup or at the top of the
drawing area, prompt you at each stage of the process. When you have completed
defining the curve, the image and the selected data will appear if you open the Graph
Reader tool subsequently.
Load a graph image file
1) Click Load Graph, browse to the image file and click Open.
By default the Windows Open dialog expects a graphics file in one of the
following formats: .jpg, .gif, .png.
Tip If the graph is embedded in a PDF document, you can use the Windows
Snipping Tool to capture an image. (Click Start > All Programs > Accessories
> Snipping Tool.) Save the captured image as .jpg or .png.
Set the scale
2) A message prompts you to set the scale. Click OK.
3) Entering values for Y Min, Y Max, X Min and X Max along the axes, and enter
units for each axis.
4) If a log scale is required, select the log scale check box, and enter the base.
Set the origin and extent
5) Move the red cross hairs to the point corresponding to (X Min, Y Min) and click.
A message prompts you to set the extent.
6) Click OK. Then move the cross hair to the point corresponding to (X Max, Y
Max) and click.
Select the points on the curve
A message prompts you to select the points.
7) Click OK. Move the blue cross hairs to each point in turn that defines the required
curve and click.
Tip If you select the Show Zoom Window check box, a pop-up window shows
a small zoomed image to help you plot the points more accurately.
A blue bullet marks each point.
Check the points and finish
8) Click Points to check the table of the selected points. You will need to close this
popup before you can complete the task.

Chapter 10 – Graph Reader
93
You can click Clear Last to clear the last point you defined, or Clear All to clear
all the points and start selecting the points again.
9) When an appropriate numbers of points have been selected, click OK.
The Graph Reader dialog closes and the pairs of points are returned to the calling
dialog.


95
Chapter 11 – Flonet Options
This chapter describes how you can change the various options that determine how
Flonet works. With the exception of the Folders option, which sets the location of the
System Library, you can set options at either project level or for the application as a
whole. Changes you make at project level are kept with the diagram and its data and
are only fully saved when you save the diagram to a project file. Changes made at
application level appear next time you start the application.
Solver Settings The Solver tab on the Options dialog lets you specify how the solver works, letting
you define how many iterations to attempt in trying to solve the flow.
To change the settings for the project:
1) On the Flonet ribbon click the Options button.
The Options dialog opens.
2) Click the Solver tab.
3) Change the settings as follows:
Max iterations the maximum number of attempts the solver will make to solve
the network before
Pipe Friction Factor Correlation is the fluid dynamics equation used for
calculating the friction factor in pipe flow. Select Churchill or Serghides.
Convergence Tolerance you can change from the default of 1e-06.
Calculate Tee pressure drop set to on or off.
4) Click OK to save the changes.

Flonet User Guide
96
To change the settings at application level:
1) Click the File tab and then click Options.
2) Click the Solver tab.
3) Make the changes as at project level.
4) Click OK to save the changes.
Display Settings The Display tab on the Options dialog lets you configure how your diagrams look,
letting you define what parameters to show as labels, the colours for both text and pipe
lines and the fonts to use for text labels.
Note Settings you change at project level are only properly saved when you save the
file.
Changing the pipe labels
By default Flonet displays the flow rate above each pipe line on your diagram and the
name below the line. You can change which parameter is used for each label.
To customise the label text:
1) On the Flonet ribbon click the Options button.
2) Click the Display tab.
3) Click the Change button to the right of the label.
4) On the Select Values dialog, select and clear the parameters as required. You can
show more than one value. Then click OK to return to the Display tab.
5) Click OK again to save your settings.

Chapter 11 – Flonet Options
97
To customise the label colour:
1) On the Flonet ribbon click the Options button.
2) Click the Display tab.
3) Click the Colour button to the right of the With format field to open the color
picker.
4) Do one of:
Select the colour on the color palette.
Click the Web tab and select the web-safe colour you want.
Click the System tab and select the colour you want.
5) Click OK again to save your settings.
To customise the pipe label font:
1) On the Flonet ribbon click the Options button.
2) Click the Display tab.
3) Click the Font button to the right of the Pipe label font field to open the standard
Windows Font dialog.
4) Select the Font, style and size as required and then click OK.
5) Click OK again to save your settings.
Changing the default pipe colour
By default Flonet displays each pipe line in black (unless an alert is configured). You
can change this if required.
To customise the pipe colour:
1) On the Flonet ribbon click the Options button.
2) Click the Display tab.
3) Click the Colour button to the right of the Pipe line colour field to open the
color picker.
4) Do one of:
Select the colour on the color palette.
Click the Web tab and select the web-safe colour you want.
Click the System tab and select the colour you want.
5) Click OK again to save your settings.

Flonet User Guide
98
Changing the shape label font
By default Flonet displays the text label for each shape on the diagram in Segoe UI
8pt. You can change this if required.
To customise the shape label font:
1) On the Flonet ribbon click the Options button.
2) Click the Display tab.
3) Click the Font button to the right of the Node/Branch font field to open the
standard Windows Font dialog.
4) Select the Font, style and size as required and then click OK.
5) Click OK again to save your settings.
Making changes at application level
You can makes the same displays changes at application level so that it configures all
your diagrams.
To change the settings at application level:
1) Click the File tab and then click Options.
2) Click the Display tab.
3) Make the changes as at project level.
4) Click OK to save the changes.
Configuring Alerts The Alerts tab on the Options dialog lets you define threshold values for various
properties, so that a visual indication (an alert) is triggered if the Solver calculates that

Chapter 11 – Flonet Options
99
the property is above (or below) the threshold. A control on the ribbon lets you show
or hide alerts on the diagram.
To set up an alert:
1) Do one of:
On the Flonet ribbon click the drop-down arrow next to Alerts and click
Setup.
On the Flonet ribbon click the Options button.
The Options dialog opens.
2) Click the Alerts tab.
3) Select the property to monitor in the first column. The next column shows the
units for the property (as defined on the Units tab). Add the threshold values and
units, select whether the alert is triggered by the value going over (>) or under (<)
the threshold and then click Add.
4) Add further alerts, as required.
5) Click OK to save the changes.
To remove an alert:
1) Open the Options dialog and click the Alerts tab.
Existing alerts appear with the Add button changed to X.
2) Click X to delete the row.
3) Click OK to save the changes.

Flonet User Guide
100
Setting significant or decimal places The Input/Output tab on the Options dialog lets you specify the number of significant
figures or the number of decimal places to be shown for various process values on all
the editor and results dialogs.
To change the settings for the project:
1) On the Flonet ribbon click the Options button.
The Options dialog opens.
2) Click the Input/Output tab.
3) Change the number of decimal places for a particular parameter as required.
4) Click OK to save the changes.
To change the settings at application level:
1) Click the File tab and then click Options.
2) Click the Input/Output tab.
3) Make the changes as at project level.
4) Click OK to save the changes.

Chapter 11 – Flonet Options
101
Changing units The Units tab on the Options dialog lets you select the units for process values to
appear in all the editor and results dialogs. Three predefined set of units are provided:
Engineering units – the units most commonly used in the chemical process
industries. They are mostly SI units, but with a few variants, such as
Parameter SI unit Engineering unit
Temperature K (Kelvin) C (Celsius)
Pressure N/m2 bar
Dynamic viscosity N.s/m2 cP (centipoise)
Other units differ just by degree, such as mm for short length (instead of m).
SI units – the international system of units, the standard metric system
British units – standard UK (Imperial) or US units
Engineering units are the default set when you install Flonet. You can set one of the
other predefined sets as the default or create your own set.
To change the units to a predefined set:
1) On the Flonet ribbon click the Options button.
The Options dialog opens.
2) Click the Units tab.
3) Click the button for the set you want to use, such as SI.
The selected set appears in the dialog.
4) Click OK to save the changes.

Flonet User Guide
102
Creating your own set of units
The Units tab on the Options dialog lets you compile your own set of units. For
example, you might mostly engineering units, but with flow rates shown as per minute
rather than per hour.
To create a new set of units:
1) On the Units tab on the Options dialog, click the unit you want to change to
select the cell in the table.
2) Right-click the cell and click one of the alternative units in the context menu. You
can also enter the units by typing them in the cell.
3) Repeat for other units as required to complete your set.
4) Click OK to save the changes.
Note If you make changes on model options, the changed units are only fully saved
when you save the project file. Changes made at application level appear next time
you start the application.
Changing default values The Default Values tab on the Options dialog lets you set default values for common
pipe parameters, such as diameter and roughness.
To change the settings for the project:
1) On the Flonet ribbon click the Options button.
The Options dialog opens.
2) Click the Default Values tab.
3) To change the default for Diameter, click the button on the right to open the
calculator. See “Pipe inner diameter calculator” on page 73.

Chapter 11 – Flonet Options
103
4) To change the default for Roughness, click the button on the right to open the
calculator. See “Pipe roughness calculator” on page 74.
5) To change the default (pipe) length, double-click the value to select and type the
new default.
6) Click OK to save the changes.
To change the settings at application level:
1) Click the File tab and then click Options.
2) Click the Default Values tab.
3) Make the changes as at project level.
4) Click OK to save the changes.
Setting your system library location The Folders tab on the application level Options dialog lets you specify where the
System Library is located. By default the file is located in your documents library
within a PEL.Config folder. You could share a library with other users by locating it
on a network drive.
Note This feature is only available at application level.
To connect to an existing shared library:
1) Click the File tab and then click Options.
The system level Options dialog opens.
2) Click the button on the right and browse to the library. Select the library folder
and click OK.
3) Back in the options dialog, click OK to save the changes.

Flonet User Guide
104
To set up a new library:
1) Click the File tab and then click Options.
2) Click the button on the right and browse to where you want to locate the library.
3) Click Make New Folder, name the folder Flonet, then select the folder and click
OK.
4) Back in the options dialog, click OK to save the changes.

105
Quick reference
The following tables define the commands on the Flonet ribbon, with the ribbon
divided into six groups and the File tab. It also defines the commands available on the
various right-click menus.
Flonet Model ribbon
Command Action See
Model group
Add Add a diagram to the model “Adding a blank diagram” on page 26
Diagrams Show/hide individual diagrams in the model
“Showing or hiding a diagram” on page 29
Solve Run the solver “Running the solver and viewing the results” on page 59
Options Open the Options dialog for the
model “Flonet Options” on page 95
Pipe top line Show/hide the labels above each pipe in your diagrams
“Showing/hiding labels on the diagram” on page 31
Pipe bottom line Show/hide the labels below each pipe in your diagrams
“Showing/hiding labels on the diagram” on page 31
Object names Show/hide the names of objects in your diagrams
“Showing/hiding labels on the diagram” on page 31
Alerts group
Setup Configure Alerts “Configuring Alerts” on page 98
Show Alerts Window
If selected the Alerts window
appears on hover. If not double-click Alert marker to view.
“Showing Alerts” on page 32
Grid Edit group
All Open the Edit Input Values
dialog for all entities (nodes, pumps and pipes)
“Entering data for all elements” on page 63
Selected Pipes Open the Edit Input Values
dialog for selected pipes “Entering data for multiple pipes” on page 49
Selected Nodes Open the Edit Input Values
dialog for selected nodes “Entering data for multiple nodes” on page 45
Selected Pumps Open the Edit Input Values
dialog for selected pumps “Entering data for multiple pumps” on page 54
All Pipes Open the Edit Input Values
dialog for all pipes “Entering data for multiple pipes” on page 49
All Nodes Open the Edit Input Values
dialog for all nodes “Entering data for multiple nodes” on page 45

Flonet User Guide
106
Command Action See
All Pumps Open the Edit Input Values dialog for all pumps
“Entering data for multiple pumps” on page 54
Node downstream
Open the Edit Input Values
dialog for all entities downstream of a selected object
“Entering data by stream position” on page 64
Node upstream Open the Edit Input Values
dialog for all entities upstream of a selected object
“Entering data by stream position” on page 64
Pipes/Drawing group
Select Select the cursor
Pipe Select the (straight) pipe drawing tool
Pipe Orth Select the orthognal pipe drawing tool
Zoom In, Out Zoom controls for the diagram on focus
“Zooming in or out of a drawing” on page 29
Dock Windows group
Fittings, Specifications Solver Input, Solver Output, Messages, Results
Show/Hide the six dockable windows
“Showing/hiding the dockable windows” on page 24
Print group
Page Setup Adjust the page and print settings
“Printing large diagrams” on page 33
Print Preview Preview a page before printing “Printing large diagrams” on page 33
Print Print a Flonet diagram “Printing your Flonet diagram” on page 33
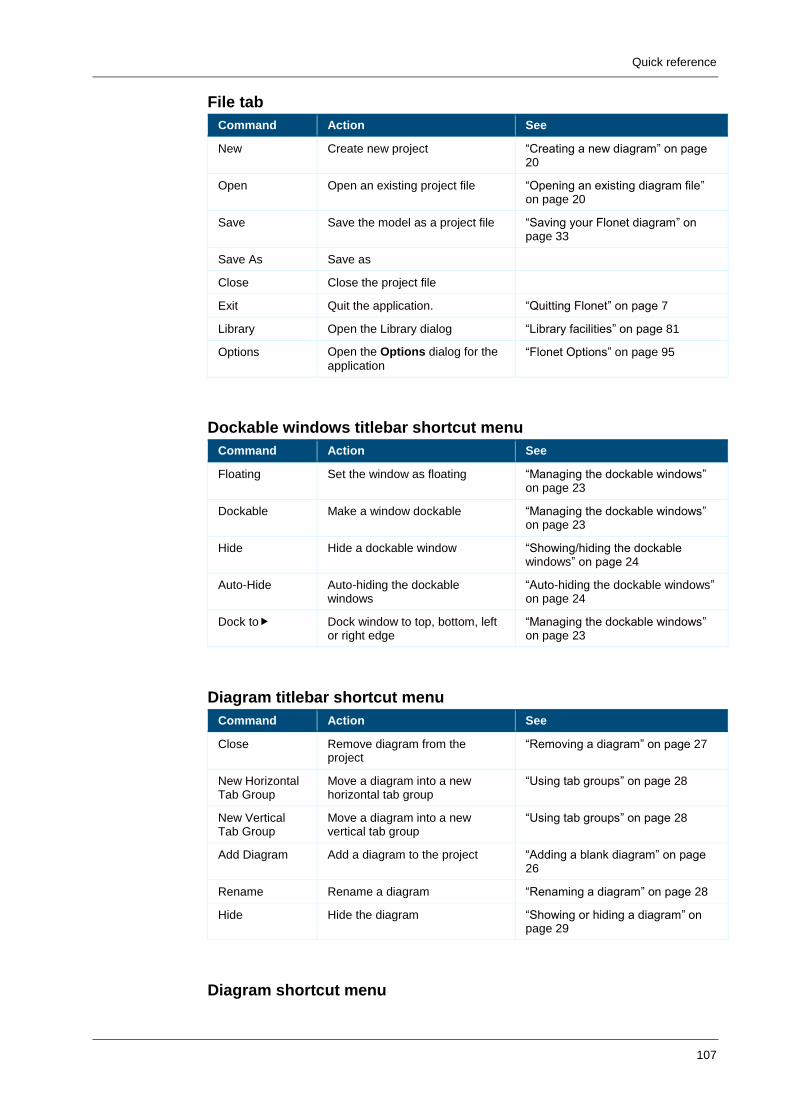
Quick reference
107
File tab
Command Action See
New Create new project “Creating a new diagram” on page 20
Open Open an existing project file “Opening an existing diagram file” on page 20
Save Save the model as a project file “Saving your Flonet diagram” on page 33
Save As Save as
Close Close the project file
Exit Quit the application. “Quitting Flonet” on page 7
Library Open the Library dialog “Library facilities” on page 81
Options Open the Options dialog for the
application “Flonet Options” on page 95
Dockable windows titlebar shortcut menu
Command Action See
Floating Set the window as floating “Managing the dockable windows” on page 23
Dockable Make a window dockable “Managing the dockable windows” on page 23
Hide Hide a dockable window “Showing/hiding the dockable windows” on page 24
Auto-Hide Auto-hiding the dockable windows
“Auto-hiding the dockable windows” on page 24
Dock to Dock window to top, bottom, left or right edge
“Managing the dockable windows” on page 23
Diagram titlebar shortcut menu
Command Action See
Close Remove diagram from the project
“Removing a diagram” on page 27
New Horizontal Tab Group
Move a diagram into a new horizontal tab group
“Using tab groups” on page 28
New Vertical Tab Group
Move a diagram into a new vertical tab group
“Using tab groups” on page 28
Add Diagram Add a diagram to the project “Adding a blank diagram” on page 26
Rename Rename a diagram “Renaming a diagram” on page 28
Hide Hide the diagram “Showing or hiding a diagram” on page 29
Diagram shortcut menu

Flonet User Guide
108
Command Action See
Add Diagram/Selection to Library
Add diagram or selection to the Library
“Saving diagram sections to the library” on page 83
Diagram Connector
Connect Connect diagram connectors “Connecting/disconnecting diagram connectors” on page 27
Disconnect Disconnect diagram connectors “Connecting/disconnecting diagram connectors” on page 27
Zoom Reset Zoom reset “Zooming in or out of a drawing” on page 29
Pointer Select pointer tool
Zoom Select zoom tool “Zooming in or out of a drawing” on page 29
Shapes
Pencil
Line
etc.
Add standard shapes
(Not currently used)
Cut Cut selection to the clipboard
Copy Copy selection to the clipboard
Paste Paste from the clipboard
Delete Delete
Select All Select All
Align
Align Left
Align Center
Align Right
Align Top
Align Middle
Align Bottom
Align shapes “Aligning shapes” on page 38
Flip
Flip Horizontally
Flip Vertically
Flip Both
Flip shapes “Rotating or flipping shapes” on page 37
Grouping
Group
Ungroup
Group/ungroup shapes “Grouping shapes” on page 38
Order
Bring to Front
Bring Forward
Send Backward
Send to Back
Order shapes “Ordering shapes” on page 39

Quick reference
109
Command Action See
Rotate
Rotate Right
Rotate Left
Rotate shapes “Rotating or flipping shapes” on page 37


111
Shortcuts
The following table shows the keyboard shortcuts that let you perform commands
quickly.
Command Action Ribbon/menu equivalent
Ctrl+N New File > New
Ctrl+O Open File > Open
Ctrl+S Save File > Save
Ctrl+P Print Print > Print
Ctrl+F1 Minimize/restore the ribbon To minimize, click ˄ control at end of ribbon
To restore, click Model tab and then pin ribbon
Ctrl+X Cut Right click > Cut
Ctrl+C Copy Right click > Copy
Ctrl+V Paste Right click > Paste
Del Delete Right click > Delete
Ctrl+A Select All Right click > Select All
Ctrl+R Rotate selected shape to the right
Right click > Rotate > Rotate Right
Ctrl+Z Undo the last command
Ctrl+Y Redo the last command
Alt+F4 Close application File > Exit
Ctrl+L Open Library File > Library
F1 Open Flonet Help Help button (?)
Ctrl+Shift+P Pointer (Select) tool Select tool


113
Glossary
60 Second Guide
A short self-paced tutorial that takes you through the main features of a PEL
application.
ANSI
American National Standards Institute – a voluntary organization in the U.S. that
creates standards for the computer industry.
API
American Petroleum Institute – U.S trade association for the oil and gas industry.
Provides over 500 operating standards for the industry, many of them adopted by ISO
as international standards.
ASME
American Society of Mechanical Engineers. One of the oldest standards organisations
in the world, providing over 600 standards and codes covering areas such as boiler
components and the measurement of fluid flow in closed systems.
BIP
Binary Interaction Parameters. Interactions between components in the mixture which
cause deviations from ideal behaviour.
CSV file
A Comma-separated values file stores tabular data in plain text form.
Cv
See Flow Coefficient.
Discharge coefficient
In fluid mechanics, the ratio of actual flow rate to the theoretical discharge for an ideal
liquid.
Flow factor
The flow factor (Kv) is the metric equivalent of Flow coefficient. Kv is the rate of
flow of cold water in cubic metres per hour at a pressure drop of one kilogram per
square centimetre across the valve.

Flonet User Guide
114
Flow coefficient
The flow coefficient Cv is the volume (in US gallons) of water at 60°F that will flow
per minute through a valve with a pressure drop of 1 psi across the valve.
Head
A way of representing pressure for a pump. The head is the equivalent height in
meters of water with specific gravity of 1.
IGE
Ideal gas enthalpy.
insert mode
Normal text entry mode for large description fields – text is added from the insertion
point as you type.
Kv
See Flow Factor.
LLE
Liquid-Liquid Equilibrium.
Mach number
In fluid mechanics, Mach number is a dimensionless number representing the speed of
the fluid divided by the speed of sound, that is 𝑀 = 𝑣/𝑐.
NB
Nominal Bore. Alternative term for Nominal Pipe Size.
ND
Nominal Diameter. The term used to classify pipe sizes accord to it diameter used in
European (DIN) standards.
NPS
Nominal Pipe Size. The term used to classify pipe sizes accord to it diameter used in
American standards (ANSI, ASME, API).
NPSH
Net Positive Suction Head.
orthognal
At right angles.

Glossary
115
pipe schedule
The thickness of a standard pipe
PPDS
Physical Properties Data Service. A software suite used extensively in the chemical
production, oil & gas, pharmaceutical, fine chemical, power generation and process
industries. It allows users to perform calculations and simulations across a wide range
of process and engineering applications. PPDS facilities are included in Flonet.
The software is maintained by NEL (formerly the National Engineering Laboratory),
part of the German-owned TÜV SÜD group.
VLE
Vapour-Liquid Equilibrium. A condition for a two-phase fluid, where the rate of
evaporation (liquid to vapour) is the same as the rate of condensation (vapour to
liquid).


117
Index
A
Adding a blank diagram 26
Adding a connected diagram 27
Adding a shape (fitting) 35
Adding User Defined (Process Equipment) items 70,
78
Alerts
Configuring alerts 99
Showing alerts 32
Aligning shapes 38
Auto-hiding the dockable windows 24
C
Changing default values 102
Changing flow/pressure specifications 59
Changing units 101
Configuring Alerts 99
Connecting fittings 35
Connecting/disconnecting diagram connectors 27
Controllers
Flow controller 69
Pressure controller 70
Converting units and values 30
Copying and pasting cells 31
Copying shapes and connectors 35
Creating a new diagram 20
Creating your own set of units 102
curves
pressure 67, 87, 88, 89
pump 57, 86, 88, 89
D
Defining a Delta-P fitting with a pressure curve 67
Defining a pump’s performance with a pump curve
57
Deleting shapes and connectors 36
Diagram shortcut menu 107
Diagram titlebar shortcut menu 107
diagrams,
adding a blank 26
adding a connected 27
connecting 27
creating a new 20
disconnecting 27
displaying in tab groups 28
removing 27
renaming 28
show or hiding 29
Display Settings 96
Dockable windows titlebar shortcut menu 107
E
Editor (data entry) dialogs 9
Edit Block Valve 53
Edit Delta P 66
Edit Diameter Changer 52
Edit Flow Controller 69
Edit Heat Exchanger 51
Edit Inlet Tank 41
Edit K Value 65
Edit Node 42, 46, 47, 48
Edit Non Return Valve 54
Edit Pipe 50
Edit Pressure Controller 70
Edit Pump 55, 56, 57
Edit Relief Valve 53
Edit Restriction Orifice 51
Entering and editing data fields 30
Entering data by stream position 64
Entering data fields 30
Entering data for a block valve 53
Entering data for a Delta-P fitting 66
Entering data for a diameter changer 52
Entering data for a heat exchanger 51
Entering data for a K Value fitting 65
Entering data for a node as a tee junction 48
Entering data for a non return valve 54
Entering data for a relief valve 53
Entering data for a restriction orifice 51
Entering data for a single pipe 50
Entering data for a tee junction 47
Entering data for all elements 63
Entering data for an individual internal node 46
Entering data for an individual outlet node 48
Entering data for an individual pump 55
Entering data for an inlet fitting 42
Entering data for an inlet node 42
Entering data for an Inlet Tank 41
Entering data for multiple nodes 45
Entering data for multiple pipes 49
Entering data for multiple pumps 54
Entering inlet conditions 41
Entering NPSH data for a pump 56
Exporting your results data to Microsoft Excel 61

Flonet User Guide
118
F
File tab 107
Filtering your results data 60
Fittings
block valve 53
Delta-P 66
diameter changer 52
Flow controller 69
heat exchanger 51
inlet tank 41
K-value 65
node 42, 45, 46, 48
non-return valve 54
Pressure controller 70
pump 54, 56, 57
relief valve 53
restriction orifice 51
tee junction 47
Flonet Model ribbon 105
Flow Controller 69
G
Graph reader 91
Graph reader tool window 91
using 92
Grouping shapes 38
K
K-value calculator 75
adding bends 76
Adding tee junctions 76
adding user defined items 78
adding valves 77
assing expansions/contractions 78
Library facilities 81
Diagrams 83
deleting a diagram 85
inserting a diagram from the library 84
renaming a diagram 84
saving diagrams to the library 83
Fluid definitions 81
adding 81
copying 82
deleting 83
editing 82
pump and pressure curves 86
adding pressure curve 87
adding pump curve 86
copying 88
deleting 89
editing 88
L
Library diagrams
inserting from the library 84
saving to the library 83
Library fluid definitions 81
adding 81
copying 82
deleting 83
editing 82
Library pump and pressure curves 86
adding pressure curve 87
copying 88
deleting 89
editing 88
M
Making changes at application level 98
Moving shapes 37
O
Online documentation 11
Online help 10
Opening an existing diagram file 20
Options
Alerts 99
default values 102
Display settings 96
changes at application level 98
default pipe colour 97
pipe labels 96
shape label font 98
Input/output tab 100
Solver settings 95
system library location 103
Units 101
Ordering shapes 39
P
PEL calculators
K-value calculator 75
Pipe inner diameter calculator 73
Pipe roughness calculator 74
PPDS calculator 71
PEL Support Services 11
Pipe inner diameter calculator 73
Pipe roughness calculator 74
PPDS calculator 71
Pressure Controller 70
Printing large diagrams 33
Printing your Flonet diagram 33
Programs for fluid flow 5
Q
Quitting Flonet 7
R
Removing a diagram 27
Renaming a diagram 28
Resizing dockable windows 24
Resizing shapes 37

Index
119
results data
exporting to Excel 61
filtering 60
running the solver 59
viewing 60
Reverting to the original arrangement 25
Rotating or flipping shapes 37
S
Saving your Flonet diagram 33
Selecting shapes 36
Setting significant or decimal places 100
Setting your system library location 103
shapes
adding shapes (fittings) 35
aligning 38
connecting fittings 35
copying shapes and connectors 35
deleting shapes and connectors 36
grouping 38
moving 37
ordering 39
resizing 37
rotating 37
shortcuts 111
Showing alerts 32
Showing or hiding a diagram 29
Showing/hiding labels on the diagram 31
Showing/hiding the dockable windows 24
Solver Settings 95
specifications
flow 59
pressure 59
Specifying the fluid in the network 44
Standard calculator dialogs 10
Starting Flonet 7
Starting Flonet from a drawing file 7
U
Units
changing 101
converting 30
creating your own 102
Using standard calculators with a grid 31
Using tab groups 28
Using the Graph Reader 92
V
Viewing the results 60
W
Working with multiple display monitors 25
Z
Zooming in or out of a drawing 29

Flonet User Guide
120


ABB Limited
PEL Support Services Daresbury Park, Daresbury, Warrington, Cheshire, WA4 4BT United Kingdom Tel: +44 (0) 1925 741126 Fax: +44 (0) 1925 741265 Email: [email protected] www.pelsoftware.com