Embed Size (px)
Citation preview

Flocculation Causes Inhibitor Tolerance in Saccharomyces cerevisiaefor Second-Generation Bioethanol Production
Johan O. Westman,a,b Valeria Mapelli,b Mohammad J. Taherzadeh,a Carl Johan Franzénb
School of Engineering, University of Borås, Borås, Swedena; Department of Chemical and Biological Engineering, Division of Life Sciences–Industrial Biotechnology,Chalmers University of Technology, Gothenburg, Swedenb
Yeast has long been considered the microorganism of choice for second-generation bioethanol production due to its fermenta-tive capacity and ethanol tolerance. However, tolerance toward inhibitors derived from lignocellulosic materials is still an issue.Flocculating yeast strains often perform relatively well in inhibitory media, but inhibitor tolerance has never been clearly linkedto the actual flocculation ability per se. In this study, variants of the flocculation gene FLO1 were transformed into the genome ofthe nonflocculating laboratory yeast strain Saccharomyces cerevisiae CEN.PK 113-7D. Three mutants with distinct differences inflocculation properties were isolated and characterized. The degree of flocculation and hydrophobicity of the cells were corre-lated to the length of the gene variant. The effect of different strength of flocculation on the fermentation performance of thestrains was studied in defined medium with or without fermentation inhibitors, as well as in media based on dilute acid sprucehydrolysate. Strong flocculation aided against the readily convertible inhibitor furfural but not against less convertible inhibi-tors such as carboxylic acids. During fermentation of dilute acid spruce hydrolysate, the most strongly flocculating mutant withdense cell flocs showed significantly faster sugar consumption. The modified strain with the weakest flocculation showed ahexose consumption profile similar to the untransformed strain. These findings may explain why flocculation has evolved as astress response and can find application in fermentation-based biorefinery processes on lignocellulosic raw materials.
Despite the fact that the first large-scale lignocellulosic ethanolplants are under development or have recently become oper-
ational (1, 2), there are still major hurdles to overcome before thissecond-generation biofuel can become economically competitive.First, lignocellulosic feedstocks contain significant amounts ofpentose sugars originating from hemicelluloses, and second, theharsh pretreatment methods that are often necessary lead to thecreation of inhibitors that slow down or even stop the subsequentfermentation (3). There are a number of different recombinantyeast strains that can utilize the pentoses xylose and/or arabinose,as reviewed previously (4). However, most of these strains cannotefficiently coutilize hexoses and pentoses, due to Saccharomycescerevisiae’s strong preference for glucose (5). In northern regionsof the world, a lot of attention is focused on ethanol productionfrom spruce, since it is abundantly available. Spruce is often steampretreated with addition of SO2 or H2SO4, which can result indegradation products that will inhibit the fermentation (6). Theinhibitors are usually divided into the categories carboxylic acids,furan aldehydes, and phenolic compounds, and the respectiveamounts of these depend on both the source of the raw materialand its pretreatment and hydrolysis (3, 7, 8). The effects of theinhibitors on the fermenting cells include, e.g., direct inhibition ofcatabolic enzymes, generation of reactive oxygen species, de-creased intracellular pH, ATP depletion, toxic anion accumula-tion, and disturbance of membrane integrity (8). This can lead toincreased lag time, slower fermentation rate, decreased viabilityand, ultimately, stuck fermentation. Inhibitory compounds canbe further categorized into those that can be rapidly converted toless inhibitory compounds, such as the furan aldehydes (9, 10),and those that are not converted, such as carboxylic acids underanaerobic conditions (11). In the wide array of phenolic com-pounds there are both convertible and nonconvertible inhibitors(12). For in situ detoxification, it is necessary that the inhibitorsare kept at a low level, at least relative to the amount of metabol-
ically active cells: yeast at a high cell density using a membranebioreactor could tolerate high concentrations of furfural (13).Other strategies to handle the toxicity of lignocellulosic hydroly-sates involve, e.g., fed-batch processes, where the inhibitors can bekept at a low concentration inside the reactor (14). Evolutionaryengineering, as well as the overexpression of specific genes, hasalso been shown to increase the tolerance of yeast to toxic hydro-lysates. The evolutionary engineering strategies likely lead to ben-eficial mutations in genes important for the performance of thecells in the hydrolysates (15). As a recent example of metabolicengineering, the overexpression of genes leading to increased glu-tathione biosynthesis led to better performance of the cells in si-multaneous saccharification and fermentation of pretreatedspruce (16).
It has recently been shown that the tolerance can be improvedalso at a low average cell concentration without changes to theyeast cells. This happens if the cells are encapsulated inside a semi-permeable membrane, giving a high local cell density (11). In thiscase, the increased tolerance to inhibitors has two reasons. First,the cells experience a certain stress level due to the encapsulatedstate where inner lying cells become nutrient limited (11, 17). Theslight stress response increases the ability of the cells to cope withthe stress deriving from inhibitory compounds (11) and even
Received 10 June 2014 Accepted 25 August 2014
Published ahead of print 29 August 2014
Editor: D. Cullen
Address correspondence to Carl Johan Franzén, [email protected].
Supplemental material for this article may be found at http://dx.doi.org/10.1128/AEM.01906-14.
Copyright © 2014, American Society for Microbiology. All Rights Reserved.
doi:10.1128/AEM.01906-14
6908 aem.asm.org Applied and Environmental Microbiology p. 6908 – 6918 November 2014 Volume 80 Number 22
on April 1, 2020 by guest
http://aem.asm
.org/D
ownloaded from

increases the thermotolerance of the cells (18). Second, it wasshown that conversion of the inhibiting compounds is necessaryfor the increased robustness, and a model was proposed in whichthe cells close to the capsule membrane convert inhibitors, leavingsubinhibitory levels for inner lying cells (11). As an extension ofthis, it has also been shown that the simultaneous glucose andxylose utilization by a recombinant S. cerevisiae was improved byencapsulation (19). Glucose is presumably consumed by cellsclose to the membrane, while xylose is consumed by cells closer tothe core (19). With this reasoning, the protective effect does notmainly come from the membrane of the capsule, and hypotheti-cally it would be observed also if the cells were kept tightly togetherby other means.
Such tight agglomeration of cells can be achieved by floccula-tion, where cells are kept together by lectin-like cell wall proteins,so-called flocculins, that attach to carbohydrates in the cell wall ofneighboring cells (20). Flocculation has since long been used inbreweries and other ethanol industries as a means of easy separa-tion of the yeast at the end of the fermentation. In this case theyeast cells do not flocculate during the batch, mainly due to thepresence of sugars which competitively inhibit the flocculation bybinding to the flocculins (21). For microbiologists, flocculationhas often been considered a nuisance due to the difficulties ofworking with heterogeneous cell suspensions rather than the ho-mogenous ones given by nonflocculating cells. Common labstrains, such as the sequenced S. cerevisiae S288c, do not flocculate.This can be due to different reasons, such as a defective transcrip-tion factor controlling the flocculation genes (22), or that the floc-culation genes are simply missing. The latter is the case for therecently sequenced S. cerevisiae CEN.PK 113-7D, where the majorflocculation genes FLO1, FLO5, and FLO9 are missing (23). How-ever, naturally flocculating strains have been shown to be good atfermenting inhibitory hydrolysates (24–26), and flocculation hasalso been shown to increase the ethanol tolerance of S. cerevisiae(27, 28). Therefore, it is plausible that flocculation can indeed be abeneficial trait in second-generation bioethanol production.
In this study, we tested the hypothesis that strong flocculationwould lead to improved fermentation performance in lignocellu-lose-derived inhibitory media, by generation of clustered cells. Tothis end, we constructed strains constitutively expressing variantsof FLO1 in CEN.PK 113-7D, resulting in different flocculation
strengths, and investigated the effects on fermentation of inhibi-tory media.
MATERIALS AND METHODSSaccharomyces cerevisiae strains. The three recombinant mutants usedin the present study all originated from CEN.PK 113-7D (MATaMAL2-8C SUC2) (29) (kindly provided by Peter Kötter, Biozentrum,Frankfurt, Germany), which was used as reference strain. Inoculations ofprecultures were done by picking a colony from fresh yeast extract-pep-tone-dextrose (YPD) agar plates (i.e., 10 g/liter of yeast extract [Scharlau],20 g/liter of soy peptone [Fluka], and 20 g/liter of glucose [Fisher Scien-tific]), prepared using cells stored in glycerol at �80°C.
Construction of the flocculating yeast strains. The TDH3 promoter(TDH3p) was amplified from genomic DNA of S. cerevisiae CEN.PK113-7D by PCR using the primers EcoRV_TDH3p_FW and SpeI_TDH3p-RV (Table 1) and cloned in the pUG6 vector (30). The resultingvector was used as the template for amplification of the kanMX-TDH3pcassette using the primers SphI_KAN_FW and SalI_TDH3p-RV (Table1). The cassette was cloned in Yiplac211 (31) and thereafter amplified byPCR using the primers HO_KAN-FW and TDH3p_FLO1-RV (Table 1),giving flanking ends homologous to the HO locus in S. cerevisiae CEN.PK113-7D and to FLO1 from S. cerevisiae S288c (GenBank accession numberNM_001178230.1), respectively. FLO1 was amplified from S288c chro-mosomal DNA using the primers FLO1-FW and FLO1_HO-RV (Table 1),giving a region homologous to the HO-locus in S. cerevisiae CEN.PK113-7D. By fusion PCR the kanMX-TDH3p cassette and the FLO1 genewere merged together and amplified using the primers HO-FW andHO-RV (Table 1) in two PCRs. Specifically, in the first step the FLO1 geneand the kanMX-TDH3p cassette were mixed in a single PCR for PCR-based fusion, using the Phusion polymerase (Thermo Scientific). TheDNA fragment resulting from the fusion was used as the template for thesecond PCR using the primers HO-FW and HO-RV. This yielded a PCRproduct with flanking regions homologous to the HO locus that was usedfor homologous recombination in CEN.PK 113-7D using the lithium ac-etate-based transformation method (32). Transformants were selected onYPD plates containing G418 (Sigma-Aldrich) at 200 �g/ml, after replicaplating once, and were tested for flocculation ability in 4 ml of YPD me-dium in 12-ml tubes, with shaking overnight. The correct integration intothe HO locus was confirmed by PCR using the primers SapI_KAN-RVand Ctrl_HO-FW (Table 1). The nucleotide sequences of the recombinantgenes were determined by cycle sequencing (Eurofins MWG Operon,Ebersberg, Germany).
Media. Aerobic cultures for cell propagation were grown in 250-mlcotton-plugged conical flasks in a shaker bath (125 rpm) at 30°C. The
TABLE 1 PCR primers
Primer Nucleotide sequence (5=–3=)a
Ctrl-HO-FW CAGAAAGGGTTCGCAAGTCEcoRV_TDH3p-FW ATGATATCCAGTTCGAGTTTATCATTATCFLO1-FW ATGACAATGCCTCATCGCTATATGTTTTTGGCFLO1-HO-RV TTAGCAGATGCGCGCACCTGCGTTGTTACCACAACTCTTATGAGTTAAATAATTGCCAGCAATAAGFLO1-RV CTGCATTCGAATATGTGGAGGHO-FW TACTTTGAATTGTACTACCGCTGGGCHO-KAN-FW TACTTTGAATTGTACTACCGCTGGGCGTTATTAGGTGTGAAACCACGAGCTTCGTACGCTGCAGGTAGHO-RV TTAGCAGATGCGCGCACCTGCGTTGSalI_TDH3p-RV TACGTCGACGTGTGTTTATTCGAAACTAAGSapI_KAN-RV CAGCTCTTCCGCTCCTAATAACTTCGTATAGSpeI_TDH3p-RV TACTAGTGTGTGTTTATTCGAAASphI_KAN-FW ATAATGCATGCTTCGTACGCTGCAGGTAGACAACTDH3p-FLO1-RV CATATAGCGATGAGGCATTGTCATGTGTGTTTATTCGAAACTTAF10-FW ATATTCCAGGATCAGGTCTTCCGTAGCTAF10-RV GTAGTCTTCTCATTCTGTTGATGTTGTTGTTGa Boldface type indicates restriction sites.
Inhibitor Tolerance through Flocculation
November 2014 Volume 80 Number 22 aem.asm.org 6909
on April 1, 2020 by guest
http://aem.asm
.org/D
ownloaded from
growth medium used for cell propagation for the flocculation trials andthe “microbial adhesion to hydrocarbons” (MATH) test was YPD me-dium containing 20 g/liter glucose. The growth medium used for thebatch cultivations was a defined glucose medium (DGM) as previouslyreported (33), with the additional supplementation of CaCl2 at 1 g/liter toensure that the degree of flocculation was not limited by possible Ca2�
shortage.The media for the anaerobic batch cultivations were designed to in-
clude both readily convertible and nonconvertible inhibitors found inlignocellulosic hydrolysates, namely, furan aldehydes and carboxylic ac-ids. The defined inhibitory media contained the same composition as theDGM described above, with the addition of either 5 g/liter furfural (Sig-ma-Aldrich) or 200 mM acetic (Sigma-Aldrich), formic (Sigma-Aldrich),and levulinic acid (Aldrich) at 12.0, 9.2, and 23.2 g/liter, respectively.DGM was used for comparison, as well as a hydrolysate medium, dilutedto ca. 60% due to the addition of salts, vitamins, trace metals, and ergos-terol (Sigma) as in DGM, and the cell suspension from the precultivation.A more inhibitory hydrolysate medium was achieved by adding 1.5 g/literfurfural to the spruce hydrolysate medium.
All of the media, with the exception of the hydrolysate medium, had afinal glucose concentration of �20 to 21 g/liter. The pH of all media wasadjusted to 5.5 with concentrated NaOH.
The hydrolysate was produced from spruce chips treated at pH 2.0 (bySO2 addition) under 18-bar pressure for 5 to 7 min. The hydrolysate wasstored refrigerated at low pH (�pH 2) until use. Before use, the pH wasadjusted to 5.5 with 10 M NaOH, and the hydrolysate was autoclaved,followed by centrifugation to remove solid particles. The hydrolysate me-dium used for anaerobic fermentations contained the following: glucose,9.0 � 0.2 g/liter; mannose, 11.9 � 0.1 g/liter; galactose, 2.5 � 0.2 g/liter;xylose, 5.3 � 0.1 g/liter; arabinose, 1.9 � 0.1 g/liter; acetic acid, 2.4 � 0.1g/liter; furfural, 1.78 � 0.05 g/liter; and 5-hydroxymethyl furfural (HMF),0.69 � 0.03 g/liter (n � 16).
Flocculation trials. The flocculation trials were performed with sta-tionary-phase yeast cells harvested 48 h after inoculation in YPD mediumaccording to a previously reported protocol (26), with slight modifica-tions. In short, EDTA-deflocculated cells were heat killed and mixed at aconcentration of �108 cells/ml in citrate buffer (50 mM, pH 4.5) contain-ing 4 mM CaCl2 and various concentrations of the sugars tested in a totalvolume of 2 ml placed in a 12-ml round-bottom tube. The tubes wereplaced on an orbital shaker and agitated at 160 rpm at 25°C at an angle of�30° for 4 h to ensure equilibrium. A sample of 150 �l was taken from justbelow the meniscus after the tubes had been left stationary in a verticalposition for 30 s. The sample was dispersed in 850 �l of 100 mM EDTAsolution, and the cell concentration was measured as the optical density at600 nm (OD600). The flocculation was expressed as the percentage of freecells and was calculated as follows: % free cells � [(OD600 of sample)/(OD600 of reference without CaCl2)] 100.
Hydrophobicity test. The hydrophobicity of cells was tested by theMATH assay according to the method of Westman et al. (26). The hydro-phobicity is reported as the relative difference between the absorbance ofthe aqueous phase before and after vortexing with octane and was calcu-lated as follows: hydrophobicity � [1 � (OD600 after vortexing/OD600
before vortexing)] 100.Quantitative PCR. Yeast cells grown aerobically in YPD medium were
harvested in the exponential phase, and the total RNA was immediatelyisolated using an RNeasy kit (Qiagen) with DNase treatment according tothe manufacturer’s protocol. The RNA was subjected to reverse transcrip-tion to cDNA with a RevertAid H Minus First Strand cDNA synthesis kit(Thermo Scientific), with 500 ng of RNA in 20-�l reactions. The expres-sions of the FLO1 variants and the reference gene TAF10, which showed astable expression in all samples, were analyzed by quantitative PCR usinga Brilliant II SYBR green QPCR master mix (Stratagene), 0.5 �M concen-trations of forward and reverse primers, and 1 �l of cDNA. The experi-ments were performed on a Stratagene Mx3005P instrument, with aninitial denaturation for 10 min at 95°C and amplification using 40 cycles
of 30 s at 95°C and 1 min at 60°C. A denaturation curve analysis wasincluded at the end of the program to verify the specificity of the primers.The primers used were FLO1-FW and FLO1-RV for the FLO gene variantsand TAF10-FW and TAF10-RV for the TAF10 gene (34) (Table 1). Therelative expression was calculated from the threshold cycle (CT) according tothe following formula: relative gene expression � 2CT(TAF10) � CT(FLO1).
Batch cultivations with inhibitors. Due to the inherent difficulties ofcultivating a flocculating yeast strain reproducibly (growth cannot bemonitored by OD600 measurements or withdrawal of samples for dryweight determination), a previously developed cultivation method wasused (26) in order to avoid deflocculation of the cells, e.g., with EDTA.Hence, the entire precultivations were used as inocula for the batch culti-vations in order to get reproducible data. Separate precultivations wereperformed for analysis of the initial biomass amounts. Yields were calcu-lated from data at the end of the cultivations, where all biomass could besubjected to dry weight determination.
The batch cultivations were carried out in 250-ml conical flasks, cot-ton plugged for aerobic cultivation, and equipped with rubber stoppersfitted with stainless steel capillaries and a glass tube with a loop trap foranaerobic cultivations as previously described (35). Sterile water was usedin the loop traps to permit produced CO2 to leave the flasks. The cultiva-tions were started with a 36-h aerobic cultivation in 40 ml of DGM con-taining glucose at 25 g/liter in a shaker bath (125 rpm) at 30°C. Theanaerobic cultivations were subsequently started by addition of 80 ml offresh medium of different compositions, giving a total volume of �120 mland the desired concentrations. Samples of the medium for analysis ofextracellular medium by high-pressure liquid chromatography (HPLC)were taken through the steel capillaries.
Analytical methods. The concentrations of metabolites and inhibitorswere quantified by HPLC using an Aminex HPX-87H column (Bio-Rad)at 60°C with 5 mM H2SO4 as the eluent at a flow rate of 0.6 ml/min. Arefractive index detector was used for glucose, formic acid, acetic acid,levulinic acid, glycerol, ethanol, furfural, and HMF. For the hydrolysatesamples, an Aminex HPX-87P (Bio-Rad) column at 85°C with ultrapurewater as eluent at a flow rate of 0.6 ml/min was also used to analyze theglucose, xylose, arabinose, galactose and mannose concentrations, using arefractive index detector. The cell dry weight was measured in predriedand preweighed glass tubes. The cells were washed with ultrapure waterbefore drying for 24 h at 105°C.
Statistics, yields, rates, and elemental balance calculations. The bio-mass and metabolite yields were calculated from the concentrations de-termined at the beginning and the end of the anaerobic fermentations.Produced carbon dioxide was considered to be at the same molar ratio asethanol and acetate. The biomass composition CH1.76O0.56N0.17 (36) wasused in the carbon balance calculations. The consumption and produc-tion rates, qS, were calculated according to the formula:
qS �St1
� St2
X(t1�t2) � (t2 � t1)
where Stnis the concentration of substrate or product consumed or pro-
duced at the time point tn and X�t1�t2� is the estimated biomass concentra-tion in the middle of the time interval, assuming a linear relationshipbetween ethanol and biomass production.
Error intervals are expressed as �1 standard deviation unless other-wise noted. Statistical tests were performed using a two-tailed t test assum-ing unequal variance, which is a stricter criterion than assuming equalvariance.
Nucleotide sequence accession numbers. The nucleotide sequencesfor the weakly, intermediately, and strongly flocculating FLO1 vari-ants were deposited in the GenBank database under accession numbersKM366093, KM366094, and KM366095, respectively.
RESULTS AND DISCUSSIONFlocculating mutants constitutively expressing FLO1 variants.The major flocculation gene, FLO1 (20), and the TDH3 promoter
Westman et al.
6910 aem.asm.org Applied and Environmental Microbiology
on April 1, 2020 by guest
http://aem.asm
.org/D
ownloaded from

region were isolated from genomic DNA of S. cerevisiae S288c andCEN.PK 113-7D, respectively, and merged together with thekanMX selectable marker (37) cloned from pUG6 (30) to yield anintegration cassette flanked by regions homologous to the HOlocus, which would lead to integration of the recombinant con-struct into the HO locus. Despite numerous attempts, a PCR pro-tocol yielding a single PCR product of the kanMX-TDH3p cassettewith the native, full-length FLO1 could not be developed. Sub-cloning of the FLO1 gene in Escherichia coli was also unsuccessful,as has been observed before (38). Nevertheless, the obtained par-tial gene PCR products were used for transformation and integra-tion into the S. cerevisiae CEN.PK 113-7D genome. This resultedin several transformants that were selected and grown in liquidYPD medium, whereby mutants with different degrees of floccu-
lation could be isolated (Fig. 1A). Three mutants were chosen forfurther analysis. Below, these are referred to as weakly, intermedi-ately, and strongly flocculating, depending on the size of the flocsformed. The strongly flocculating mutant formed the largest andmost compact flocs.
Longer FLO genes lead to stronger flocculation. Amplifica-tion of the integrated TDH3p-FLO1 by PCR using the primersEcoRV_TDH3p-FW and HO-RV (Table 1) confirmed that thegene products in the three selected transformants were of differentlengths (Fig. 1B). The gene region(s) missing in the recombinantversions of FLO1 was narrowed down by restriction analysis of theTDH3p-FLO1 products using the enzymes AccI and ScaI (Fig. 1Cand D). Sequencing of the TDH3p-FLO1 products showed thatthe missing regions were different portions of the previously de-
FIG 1 Different flocculation characteristics depending on the size of the FLO gene. (A) The three chosen flocculating transformants showed distinct differences in theirflocculation strength, with the weakly flocculating mutant (A2) not forming flocs as dense as the ones of the intermediate (A3) and strongly (A4) flocculating mutants.A1 shows the nonflocculating untransformed CEN.PK 113-7D. (B) The PCR product, when amplified using the EcoRV_TDH3p-FW and HO-RV primers from thegenomic DNA of the different strains, showed that the inserts had different lengths, with longer inserts corresponding to stronger flocculation. (C) Restriction with AccIand ScaI, respectively, showed that the difference in the inserts localized to the middle region of the FLO1 gene. None of the inserts contained the entire FLO1 gene andthe difference in length of the FLO1 variants was in a 2809-bp region in the middle of the wild-type FLO1. (D) Schematic representation of the TDH3p-FLO1-HOrecombinant construct. The ScaI and AccI restriction sites are indicated. The full-length FLO1 is shown with the approximate regions present in the variants (A2-A4), asidentified through sequencing, represented by black lines below. An alignment of the full sequences is available in Fig. S1 in the supplemental material.
Inhibitor Tolerance through Flocculation
November 2014 Volume 80 Number 22 aem.asm.org 6911
on April 1, 2020 by guest
http://aem.asm
.org/D
ownloaded from

scribed internal repeats (39) and that a few point mutations oc-curred with only minor differences in the amino acid sequences(Table 2; see also Fig. S1 in the supplemental material). There wereno changes in the TDH3 promoter sequence between the threemutants. Quantitative PCR analysis showed that there were nosignificant differences in expression of the different flocculationgenes (Fig. 2).The only difference between the FLO genes in theN-terminal part of the sequence, which is responsible for the car-bohydrate binding (40), was a single silent mutation in the inter-mediately flocculating mutant (see Fig. S1 in the supplementalmaterial). The deleted regions were multiples of 135 bp, translat-ing to 45 amino acids (Table 2), which has been reported to be thelength of the repeats (41). These are strong indications that thedifferences in flocculation strength between the mutants de-pended solely on the number of repeats in the middle region of theproteins, which has also been suggested previously (39). Differ-ences in protein concentration and localization are also potentialreasons for the differences in flocculation strength, but analysis ofthis lay beyond the scope of the present study. Treating the mutantflocculating strains with the chelating agent EDTA effectively andreversibly deflocculated the cells by removal of Ca2�, showing theexpected Ca2� dependence of the flocculation (42).
The flocculation ability in the presence of different sugars was
studied for the constructed flocculating mutants (Fig. 3). With nosugars present, the levels of free cells (means � absolute standarddeviations, n � 4) were 54% � 6.0%, 5.7% � 2.5%, and 2.5% �1.7% for the weakly, intermediately, and strongly flocculatingmutants, respectively. The flocculation of the strongly flocculatingmutant was inhibited only by mannose, which was expected sincethe inserted gene was based on FLO1 (43). For the intermediatelyflocculating mutant, a slight inhibition was also observed at thehighest concentration of sucrose (Fig. 3). The flocculation of theweakly flocculating mutant was inhibited by all sugars tested.Mannose-dependent inhibition of the flocculation could poten-tially be a problem in high gravity spruce hydrolysates, which usu-
TABLE 2 Differences in the flocculation genes/proteins from thecharacterized mutants compared to FLO1a
Mutant typeDeleted region(s)(nt)
No. of deleted45-aa repeats Point mutation(s)
Weaklyflocculating
948–2297,2418–2822
10 � 3
Intermediatelyflocculating
1029–2243 9 H926T
Stronglyflocculating
1275–2219 7 I882V, I906V, S907T,H926T, V1361A
a nt, nucleotides; aa, amino acids.
FIG 2 Equal expression of flocculation genes. The expression of the FLO1gene variants was analyzed by quantitative PCR and was shown to be equal forthe different strains relative to the reference gene, TAF10. Averages of dupli-cate biological replicates with duplicate technical replicates are shown with �1standard deviation (n � 2).
FIG 3 Sugar inhibition of flocculation. The amount of free cells in the pres-ence of various sugars in different concentrations was measured by turbidim-etry. (A) Weakly flocculating mutant. (B) Intermediately flocculating mutant.(C) Strongly flocculating mutant. The flocculation of all strains was inhibitedby mannose and for the weakly flocculating strain to some degree also byvarious other sugars. Average values of duplicate experiments with duplicatetechnical replicates are shown with �1 standard deviation (n � 2).
Westman et al.
6912 aem.asm.org Applied and Environmental Microbiology
on April 1, 2020 by guest
http://aem.asm
.org/D
ownloaded from
ally contain relatively large amounts of mannose (7). However,this is not a major issue, since at 0.8 M (144 g/liter) mannose, thefraction of free cells was still below 50% for the strongly flocculat-ing mutant.
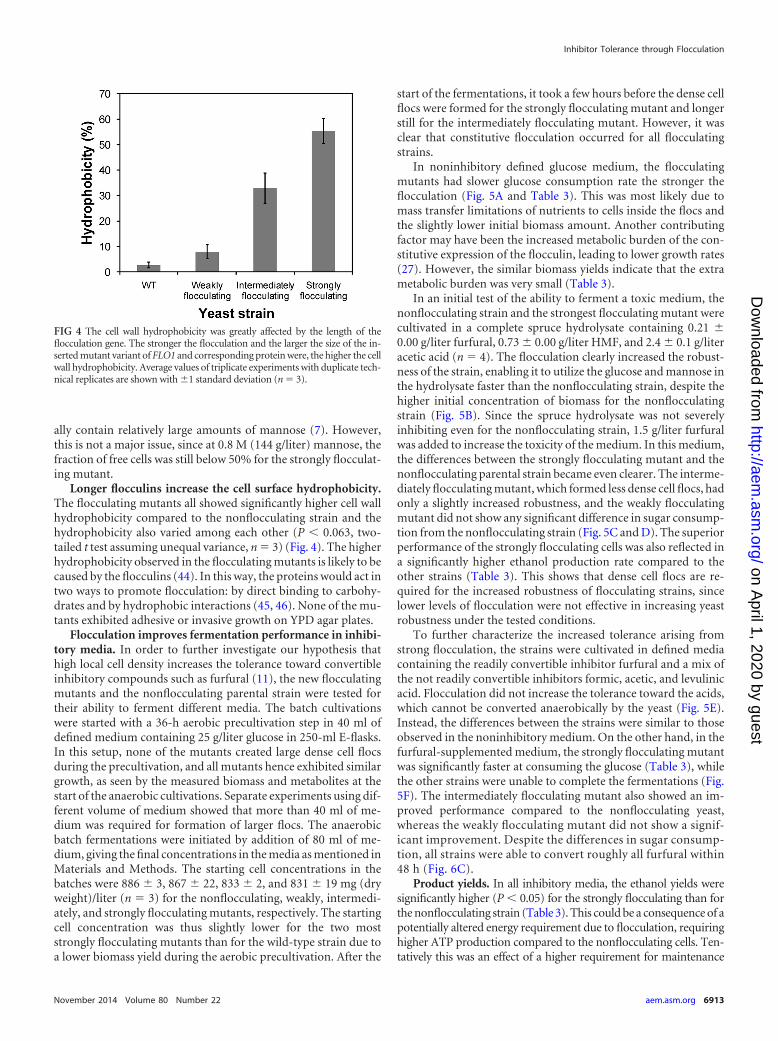
Longer flocculins increase the cell surface hydrophobicity.The flocculating mutants all showed significantly higher cell wallhydrophobicity compared to the nonflocculating strain and thehydrophobicity also varied among each other (P � 0.063, two-tailed t test assuming unequal variance, n � 3) (Fig. 4). The higherhydrophobicity observed in the flocculating mutants is likely to becaused by the flocculins (44). In this way, the proteins would act intwo ways to promote flocculation: by direct binding to carbohy-drates and by hydrophobic interactions (45, 46). None of the mu-tants exhibited adhesive or invasive growth on YPD agar plates.
Flocculation improves fermentation performance in inhibi-tory media. In order to further investigate our hypothesis thathigh local cell density increases the tolerance toward convertibleinhibitory compounds such as furfural (11), the new flocculatingmutants and the nonflocculating parental strain were tested fortheir ability to ferment different media. The batch cultivationswere started with a 36-h aerobic precultivation step in 40 ml ofdefined medium containing 25 g/liter glucose in 250-ml E-flasks.In this setup, none of the mutants created large dense cell flocsduring the precultivation, and all mutants hence exhibited similargrowth, as seen by the measured biomass and metabolites at thestart of the anaerobic cultivations. Separate experiments using dif-ferent volume of medium showed that more than 40 ml of me-dium was required for formation of larger flocs. The anaerobicbatch fermentations were initiated by addition of 80 ml of me-dium, giving the final concentrations in the media as mentioned inMaterials and Methods. The starting cell concentrations in thebatches were 886 � 3, 867 � 22, 833 � 2, and 831 � 19 mg (dryweight)/liter (n � 3) for the nonflocculating, weakly, intermedi-ately, and strongly flocculating mutants, respectively. The startingcell concentration was thus slightly lower for the two moststrongly flocculating mutants than for the wild-type strain due toa lower biomass yield during the aerobic precultivation. After the
start of the fermentations, it took a few hours before the dense cellflocs were formed for the strongly flocculating mutant and longerstill for the intermediately flocculating mutant. However, it wasclear that constitutive flocculation occurred for all flocculatingstrains.
In noninhibitory defined glucose medium, the flocculatingmutants had slower glucose consumption rate the stronger theflocculation (Fig. 5A and Table 3). This was most likely due tomass transfer limitations of nutrients to cells inside the flocs andthe slightly lower initial biomass amount. Another contributingfactor may have been the increased metabolic burden of the con-stitutive expression of the flocculin, leading to lower growth rates(27). However, the similar biomass yields indicate that the extrametabolic burden was very small (Table 3).
In an initial test of the ability to ferment a toxic medium, thenonflocculating strain and the strongest flocculating mutant werecultivated in a complete spruce hydrolysate containing 0.21 �0.00 g/liter furfural, 0.73 � 0.00 g/liter HMF, and 2.4 � 0.1 g/literacetic acid (n � 4). The flocculation clearly increased the robust-ness of the strain, enabling it to utilize the glucose and mannose inthe hydrolysate faster than the nonflocculating strain, despite thehigher initial concentration of biomass for the nonflocculatingstrain (Fig. 5B). Since the spruce hydrolysate was not severelyinhibiting even for the nonflocculating strain, 1.5 g/liter furfuralwas added to increase the toxicity of the medium. In this medium,the differences between the strongly flocculating mutant and thenonflocculating parental strain became even clearer. The interme-diately flocculating mutant, which formed less dense cell flocs, hadonly a slightly increased robustness, and the weakly flocculatingmutant did not show any significant difference in sugar consump-tion from the nonflocculating strain (Fig. 5C and D). The superiorperformance of the strongly flocculating cells was also reflected ina significantly higher ethanol production rate compared to theother strains (Table 3). This shows that dense cell flocs are re-quired for the increased robustness of flocculating strains, sincelower levels of flocculation were not effective in increasing yeastrobustness under the tested conditions.
To further characterize the increased tolerance arising fromstrong flocculation, the strains were cultivated in defined mediacontaining the readily convertible inhibitor furfural and a mix ofthe not readily convertible inhibitors formic, acetic, and levulinicacid. Flocculation did not increase the tolerance toward the acids,which cannot be converted anaerobically by the yeast (Fig. 5E).Instead, the differences between the strains were similar to thoseobserved in the noninhibitory medium. On the other hand, in thefurfural-supplemented medium, the strongly flocculating mutantwas significantly faster at consuming the glucose (Table 3), whilethe other strains were unable to complete the fermentations (Fig.5F). The intermediately flocculating mutant also showed an im-proved performance compared to the nonflocculating yeast,whereas the weakly flocculating mutant did not show a signif-icant improvement. Despite the differences in sugar consump-tion, all strains were able to convert roughly all furfural within48 h (Fig. 6C).
Product yields. In all inhibitory media, the ethanol yields weresignificantly higher (P � 0.05) for the strongly flocculating than forthe nonflocculating strain (Table 3). This could be a consequence of apotentially altered energy requirement due to flocculation, requiringhigher ATP production compared to the nonflocculating cells. Ten-tatively this was an effect of a higher requirement for maintenance
FIG 4 The cell wall hydrophobicity was greatly affected by the length of theflocculation gene. The stronger the flocculation and the larger the size of the in-serted mutant variant of FLO1 and corresponding protein were, the higher the cellwall hydrophobicity. Average values of triplicate experiments with duplicate tech-nical replicates are shown with �1 standard deviation (n � 3).
Inhibitor Tolerance through Flocculation
November 2014 Volume 80 Number 22 aem.asm.org 6913
on April 1, 2020 by guest
http://aem.asm
.org/D
ownloaded from

energy by cells in the interior of the flocs, leading to more of theglucose being directed to ethanol production.
In the noninhibitory defined glucose medium, flocculationcaused a slight increase in the glycerol yield. The reason for this isunknown and the effect was not observed in the other media. Adecreased yield has been reported for encapsulated yeast, wherethe cells are also packed tightly together, why the reason for theincreased yield in the current case remains elusive (17). The glyc-erol yields were significantly lower in the two furfural-containingmedia. Furfural is known to act as a redox sink and can replace
glycerol for reoxidation of excess NADH formed in, e.g., biosyn-thetic reactions or due to acid formation (47).
The biomass yields were lower in all inhibitory media than in thenoninhibitory medium (Table 3). In the inhibitory media, it couldalso be observed that the biomass yields were higher for the flocculat-ing than for the nonflocculating strain. However, because the floccu-lating cells were not equally dispersed in the medium, sampling dur-ing the fermentation caused a decrease in the volume withoutdecreasing the content of flocculating cells. Therefore, the cell yieldsof the strongly flocculating mutants were most likely overestimated.
FIG 5 The fermentation profiles of the flocculating strains in different media revealed distinct differences in inhibitor tolerance. The fermentation profiles of thedifferent strains were distinctly different in the different media tested: defined noninhibitory medium (A), spruce hydrolysate (B), glucose (C), and mannose (D)in spruce hydrolysate with 1.5 g/liter extra furfural, defined medium with 200 mM (each) formic, acetic, and levulinic acid (E), and defined medium with 5 g/literfurfural (F). With strong flocculation creating dense cell flocs, the tolerance toward the readily convertible inhibitor furfural, as well as the spruce hydrolysate, wasincreased, leading to faster fermentations. For the not readily convertible acids, as well as the noninhibitory medium, mass transfer limitations through the flocsplausibly decreased the fermentation rates, leading to longer fermentation times the stronger the flocculation. Average values of three to four experimentalreplicates (duplicates for panel B) are shown with �1 standard deviation.
Westman et al.
6914 aem.asm.org Applied and Environmental Microbiology
on April 1, 2020 by guest
http://aem.asm
.org/D
ownloaded from

High local cell density for increased robustness. The resultsobtained for the strongly flocculating yeast are similar to what hasbeen observed for a nonflocculating yeast strain which was encap-sulated in a semipermeable gel membrane of alginate and chitosan(11). In that study, it was concluded that the tightly packed cellcommunity created by the encapsulation of the cells increases theoverall robustness of the yeast by letting cells close to the mem-brane convert inhibitors, allowing inner lying cells to ferment sug-ars because of lower inhibitor concentrations. By computer sim-ulations, it has been shown that diffusion limitations in theencapsulated cell pellet lead to concentration gradients of bothnutrients and convertible inhibitors (19). It has also been shownthat encapsulation of yeast induces a starvation stress responsewhich increases the robustness of the yeast community (11, 17).The fact that the cells grow rather slowly inside the capsules mightalso aid in increasing the robustness, since slow-growing cells havebeen shown to have increased stress tolerance (48).
Strong flocculation is similar to encapsulation in the sense thatit also leads to high local cell concentrations. As in the case ofencapsulated yeast, genes involved in stress resistance are upregu-lated in cells flocculating strongly because of FLO1 expression(27). Furthermore, diffusion limitations in yeast flocs have beenobserved previously. For example, Ge and Bai (49) showed thatmass transfer limits the rates of growth and ethanol formation inflocs larger than 100 �m, i.e., significantly smaller than for thestrongly flocculating mutant in the present study. Therefore, it islikely that the increased robustness of the flocculating yeast ob-served here can be attributed to similar phenomena as were con-cluded for the encapsulated yeast. When the cells flocculatestrongly and form dense cell flocs up to several millimeters in
diameter, the cells closest to the surface of the floc face the harshestconditions in a medium containing inhibitors. With convertibleinhibitors, cells closer to the core experience lower levels, due tocoupled diffusion and conversion reactions that cause radial con-centration gradients in the floc. However, they also have access tosugars that the outer lying cells cannot utilize. As a whole, the cellcommunity will thus be able to ferment media that are too inhib-itory for nonflocculating strains, where all cells are exposed to thesame inhibitor concentrations. Moreover, even after completeconversion of the inhibitors, the whole nonflocculating cell pop-ulation may be severely affected by long-lasting effects of the in-hibitors, e.g., a lack of energy reserves. In contrast, flocculatingpopulations may contain cells that are still unaffected by the in-hibitors, and are able to ferment the medium. This is illustrated bythe significantly different fermentative performance of the differ-ent strains (Fig. 5F), despite very similar furfural conversion (Fig.6C). In a more complex medium, such as the spruce hydrolysateused, additional inhibitory compounds likely play a role in in-creasing the difference between the strains, so that the nonfloccu-lating and weakly flocculating cells cannot convert nearly as muchof the furan aldehydes as the mutants forming dense cell flocs (Fig.6A and B). However, flocculation does not protect against inhib-itors that are not converted. For example, carboxylic acids candiffuse through the cell flocs without being converted and willtherefore, eventually, be present at the same concentration aroundall cells. This also holds for encapsulated cells, unless the capsulemembrane itself can stop diffusion of the inhibitor, as in the caseof the hydrophobic inhibitor limonene (11, 50).
Another interesting observation made from the fermentationof the hydrolysate was that the rate of mannose consumption was
TABLE 3 Product yields and rates in anaerobic batch cultivationsa
Medium and strain
Mean product yield � SD Mean specific rate � SDMean CR (%) �SDYSE YSAce YSGly YSX qEtOH qGlu qMan
DGMWT 414 � 5 9 � 2 53 � 1 65 � 3 0.89 � 0.03 2.2 � 0.1 NA 95 � 2Weakly flocculating 412 � 5 13 � 0* 58 � 1* 67 � 4 0.85 � 0.04 2.1 � 0.1 NA 96 � 1Intermediately flocculating 412 � 4 13 � 2* 59 � 3* 69 � 3 0.82 � 0.04 2.0 � 0.1 NA 96 � 2Strongly flocculating 413 � 8 11 � 1 59 � 2* 69 � 2 0.77 � 0.03* 2.0 � 0.1* NA 96 � 2
FurfuralWT 415 � 13 22 � 4 61 � 8 –1 � 2 0.24 � 0.03 0.61 � 0.06 NA 90 � 2Weakly flocculating 435 � 16 22 � 2 59 � 5 –2 � 1 0.24 � 0.02 0.61 � 0.06 NA 93 � 3Intermediately flocculating 440 � 9* 25 � 2 52 � 3 5 � 3* 0.25 � 0.02 0.63 � 0.05 NA 94 � 2Strongly flocculating 445 � 5* 26 � 2 43 � 2* 8 � 0* 0.34 � 0.02* 0.81 � 0.05* NA 94 � 1
Carboxylic acidsWT 421 � 4 36 � 4 71 � 1 12 � 1 0.23 � 0.01 0.57 � 0.02 NA 94 � 0Weakly flocculating 420 � 1 47 � 4* 75 � 2 19 � 3* 0.19 � 0.01* 0.49 � 0.03* NA 96 � 1Intermediately flocculating 421 � 2 45 � 19 78 � 1* 25 � 3* 0.17 � 0.04 0.42 � 0.10 NA 98 � 1Strongly flocculating 430 � 3* 36 � 5 69 � 2 26 � 4* 0.20 � 0.02* 0.47 � 0.04* NA 98 � 1
Hydrolysate � furfural (1.5 g/liter)WT 431 � 16 42 � 8 20 � 3 –3 � 4 0.22 � 0.03 0.37 � 0.05 0.10 � 0.03 90 � 3Weakly flocculating 427 � 18 40 � 14 22 � 3 3 � 1* 0.20 � 0.03 0.35 � 0.01 0.10 � 0.02 90 � 2Intermediately flocculating 439 � 15 35 � 2 20 � 2 9 � 3* 0.23 � 0.02 0.39 � 0.02 0.11 � 0.03 94 � 2Strongly flocculating 468 � 15* 25 � 2* 23 � 2 7 � 3* 0.30 � 0.02* 0.44 � 0.04 0.20 � 0.06* 97 � 3
a Product yields are expressed as mg of product per g of consumed hexose. YSE, ethanol yield; YSAce, acetate yield; YSGly, glycerol yield; YSX, biomass yield. qEtOH, qGlu, and qMan, theaverage specific rates of ethanol production and glucose and mannose consumption during the first 15 h (6 h for DGM), are expressed as g (g biomass)�1 h�1. CR, carbon recovery;NA, not applicable; SD, standard deviation (n � 3); *, significantly different from the wild type (WT; P � 0.05) as determined by a two-tailed t test assuming unequal variance.
Inhibitor Tolerance through Flocculation
November 2014 Volume 80 Number 22 aem.asm.org 6915
on April 1, 2020 by guest
http://aem.asm
.org/D
ownloaded from

100% higher in the strongly flocculating mutant than in the non-flocculating strain (Fig. 5D and Table 3). Similar effects have re-cently been shown by encapsulation of a xylose-fermenting yeast,which led to improved simultaneous consumption of glucose,mannose, galactose, and xylose (19). This can be explained by thesame reasoning as for the increased inhibitor tolerance. Mannoseand glucose compete for the same transporter proteins, and be-cause the cells in the periphery of the flocs utilize glucose, thecompetitive inhibition of mannose uptake by glucose is relievedfor the cells closer to the core of the dense cell flocs (51).
In wild yeast strains, flocculation is an evolved trait that causesa large number of individual cells to form a community, mimick-ing multicellular organisms. As we have shown in our experi-ments, this enables fermentation of otherwise toxic media, likelythrough protection of part of the community of cells throughsacrifice of the outer layer of cells while cells can divide inside theflocs. Furthermore, it has been shown that in a mixture of FLO1-expressing cells and cells that do not express FLO1, the latter cellswill make up the outer layer of cells in the yeast flocs (27). Thisoccurs since all cells have the mannose residues in their cell wallsthat are necessary for binding by flocculins, but the cells lackingFLO1 expression lack the ability to bind to an additional layer ofnonflocculating cells. In a toxic medium, the strongest flocculat-ing cells will thus be even better protected in a mixture of cells withdifferent flocculation ability, driving evolution toward survival ofthe flocculin-expressing cells.
It has been shown previously that flocculation increases theethanol tolerance of the yeast (27, 28). That strong flocculation, initself, also increases fermentation rates of toxic lignocellulosic hy-drolysates and, specifically, limits the inhibitory effect of high con-centration of furfural on yeast fermentation performance is ofgreat potential importance for second-generation ethanol pro-duction. Since the occurrence of dense cell flocs proved necessaryfor increased robustness, it is important to consider the reactordesign and choice of operational parameters for good perfor-mance of a flocculating strain in such applications. Yeast flocs aresensitive to shear forces, and it is thus likely that too rapid stirringwould lead to disruption of the flocs and abolished inhibitor tol-erance. It is clear that further experiments are necessary for assess-ing the feasibility of using flocculation to improve the fermenta-tion of toxic lignocellulose hydrolysates in large-scale bioreactors.
ACKNOWLEDGMENTS
We thank Tomas Brandberg at SEKAB AB, Sweden, for providing thespruce hydrolysate. We are grateful to Oskar Henriksson for performinginitial trials.
This study was supported by the Swedish Research Council (grant2009-4514) and the Chalmers Energy Initiative (http://www.chalmers.se/en/areas-of-advance/energy/cei/).
We declare that we have no competing interests.
REFERENCES1. Brown TR, Brown RC. 2013. A review of cellulosic biofuel commercial-
scale projects in the United States. Biofuel Bioprod. Bioref. 7:235–245.http://dx.doi.org/10.1002/bbb.1387.
2. Larsen J, Haven MØ, Thirup L. 2013. Inbicon makes lignocellulosicethanol a commercial reality. Biomass Bioenergy 46:36 – 45. http://dx.doi.org/10.1016/j.biombioe.2012.03.033.
3. Klinke HB, Thomsen AB, Ahring BK. 2004. Inhibition of ethanol-producing yeast and bacteria by degradation products produced duringpretreatment of biomass. Appl. Microbiol. Biotechnol. 66:10 –26. http://dx.doi.org/10.1007/s00253-004-1642-2.
FIG 6 Furan aldehydes concentrations during batch cultivations. The furanaldehydes concentrations during batch cultivations of the different strainswere distinctly different in the spruce hydrolysate medium, with added fur-fural, for HMF (A) and furfural (B), where the more tolerant strains convertedthe inhibitors faster. (C) In the medium with 5 g/liter furfural, the profileswere, however, rather similar, with only a slightly different conversion profileof the nonflocculating strain. Average values of four experimental replicatesare shown with �1 standard deviation.
Westman et al.
6916 aem.asm.org Applied and Environmental Microbiology
on April 1, 2020 by guest
http://aem.asm
.org/D
ownloaded from

4. Laluce C, Schenberg ACG, Gallardo JCM, Coradello LFC, Pombeiro-Sponchiado SR. 2012. Advances and developments in strategies to im-prove strains of Saccharomyces cerevisiae and processes to obtain the ligno-cellulosic ethanol: a review. Appl. Biochem. Biotechnol. 166:1908 –1926.http://dx.doi.org/10.1007/s12010-012-9619-6.
5. Bertilsson M, Andersson J, Lidén G. 2008. Modeling simultaneous glu-cose and xylose uptake in Saccharomyces cerevisiae from kinetics and geneexpression of sugar transporters. Bioprocess Biosyst. Eng. 31:369 –377.http://dx.doi.org/10.1007/s00449-007-0169-1.
6. Stenberg K, Tengborg C, Galbe M, Zacchi G. 1998. Optimisation ofsteam pretreatment of SO2-impregnated mixed softwoods for ethanolproduction. J. Chem. Technol. Biotechnol. 71:299 –308. http://dx.doi.org/10.1002/(sici)1097-4660(199804)71:4�299::aid-jctb8583.0.co;2-z.
7. Taherzadeh MJ, Eklund R, Gustafsson L, Niklasson C, Liden G. 1997.Characterization and fermentation of dilute-acid hydrolyzates fromwood. Ind. Eng. Chem. Res. 36:4659 – 4665. http://dx.doi.org/10.1021/ie9700831.
8. Almeida JRM, Modig T, Petersson A, Hähn-Hägerdal B, Lidén G,Gorwa-Grauslund MF. 2007. Increased tolerance and conversion of in-hibitors in lignocellulosic hydrolysates by Saccharomyces cerevisiae. J.Chem. Technol. Biotechnol. 82:340 –349. http://dx.doi.org/10.1002/jctb.1676.
9. Taherzadeh MJ, Gustafsson L, Niklasson C, Lidén G. 1999. Conversionof furfural in aerobic and anaerobic batch fermentation of glucose bySaccharomyces cerevisiae. J. Biosci. Bioeng. 87:169 –174. http://dx.doi.org/10.1016/S1389-1723(99)89007-0.
10. Taherzadeh MJ, Gustafsson L, Niklasson C, Lidén G. 2000. Physio-logical effects of 5-hydroxymethylfurfural on Saccharomyces cerevisiae.Appl. Microbiol. Biotechnol. 53:701–708. http://dx.doi.org/10.1007/s002530000328.
11. Westman JO, Manikondu RB, Franzén CJ, Taherzadeh MJ. 2012. En-capsulation-induced stress helps Saccharomyces cerevisiae resist convert-ible lignocellulose derived inhibitors. Int. J. Mol. Sci. 13:11881–11894.http://dx.doi.org/10.3390/ijms130911881.
12. Klinke HB, Olsson L, Thomsen AB, Ahring BK. 2003. Potential inhib-itors from wet oxidation of wheat straw and their effect on ethanol pro-duction of Saccharomyces cerevisiae: wet oxidation and fermentation byyeast. Biotechnol. Bioeng. 81:738 –747. http://dx.doi.org/10.1002/bit.10523.
13. Ylitervo P, Franzén C, Taherzadeh M. 2013. Impact of furfural on rapidethanol production using a membrane bioreactor. Energies 6:1604 –1617.http://dx.doi.org/10.3390/en6031604.
14. Taherzadeh MJ, Niklasson C, Liden G. 1999. Conversion of dilute-acidhydrolyzates of spruce and birch to ethanol by fed-batch fermentation.Bioresour. Technol. 69:59 – 66. http://dx.doi.org/10.1016/S0960-8524(98)00169-2.
15. Koppram R, Albers E, Olsson L. 2012. Evolutionary engineering strate-gies to enhance tolerance of xylose utilizing recombinant yeast to inhibi-tors derived from spruce biomass. Biotechnol. Biofuels 5:32. http://dx.doi.org/10.1186/1754-6834-5-32.
16. Ask M, Mapelli V, Hock H, Olsson L, Bettiga M. 2013. Engineeringglutathione biosynthesis of Saccharomyces cerevisiae increases robustnessto inhibitors in pretreated lignocellulosic materials. Microb. Cell Fact.12:87. http://dx.doi.org/10.1186/1475-2859-12-87.
17. Westman JO, Taherzadeh MJ, Franzén CJ. 2012. Proteomic analysis ofthe increased stress tolerance of Saccharomyces cerevisiae encapsulated inliquid core alginate-chitosan capsules. PLoS One 7:e49335. http://dx.doi.org/10.1371/journal.pone.0049335.
18. Ylitervo P, Franzén CJ, Taherzadeh MJ. 2011. Ethanol production atelevated temperatures using encapsulation of yeast. J. Biotechnol. 156:22–29. http://dx.doi.org/10.1016/j.jbiotec.2011.07.018.
19. Westman JO, Bonander N, Taherzadeh MJ, Franzén CJ. 2014. Im-proved sugar co-utilization by encapsulation of a recombinant Saccharo-myces cerevisiae strain in alginate-chitosan capsules. Biotechnol. Biofuels7:102. http://dx.doi.org/10.1186/1754-6834-7-102.
20. Miki BLA, Poon NH, James AP, Seligy VL. 1982. Possible mechanism forflocculation interactions governed by gene FLO1 in Saccharomyces cerevi-siae. J. Bacteriol. 150:878 – 889.
21. Verstrepen KJ, Derdelinckx G, Verachtert H, Delvaux FR. 2003. Yeastflocculation: what brewers should know. Appl. Microbiol. Biotechnol. 61:197–205. http://dx.doi.org/10.1007/s00253-002-1200-8.
22. Liu H, Styles CA, Fink GR. 1996. Saccharomyces cerevisiae S288C has a
mutation in FLO8, a gene required for filamentous growth. Genetics 144:967–978.
23. Nijkamp J, van den Broek M, Datema E, de Kok S, Bosman L, Luttik M,Daran-Lapujade P, Vongsangnak W, Nielsen J, Heijne W, Klaassen P,Paddon C, Platt D, Kotter P, van Ham R, Reinders M, Pronk J, deRidder D, Daran J-M. 2012. De novo sequencing, assembly and analysis ofthe genome of the laboratory strain Saccharomyces cerevisiae CEN.PK113-7D, a model for modern industrial biotechnology. Microb. Cell Fact. 11:36. http://dx.doi.org/10.1186/1475-2859-11-36.
24. Sanchez i Nogue V, Bettiga M, Gorwa-Grauslund M. 2012. Isolation andcharacterization of a resident tolerant Saccharomyces cerevisiae strain froma spent sulfite liquor fermentation plant. AMB Express 2:68. http://dx.doi.org/10.1186/2191-0855-2-68.
25. Matsushika A, Inoue H, Murakami K, Takimura O, Sawayama S. 2009.Bioethanol production performance of five recombinant strains of labo-ratory and industrial xylose-fermenting Saccharomyces cerevisiae. Biore-sour. Technol. 100:2392–2398. http://dx.doi.org/10.1016/j.biortech.2008.11.047.
26. Westman JO, Taherzadeh MJ, Franzén CJ. 2012. Inhibitor tolerance andflocculation of a yeast strain suitable for second-generation bioethanolproduction. Electron. J. Biotechnol. 15 http://dx.doi.org/10.2225/vol15-issue3-fulltext-8.
27. Smukalla S, Caldara M, Pochet N, Beauvais A, Guadagnini S, Yan C,Vinces MD, Jansen A, Prevost MC, Latgé J-P, Fink GR, Foster KR,Verstrepen KJ. 2008. FLO1 is a variable green beard gene that drivesbiofilm-like cooperation in budding yeast. Cell 135:726 –737. http://dx.doi.org/10.1016/j.cell.2008.09.037.
28. Xue C, Zhao XQ, Bai FW. 2010. Effect of the size of yeast flocs and zincsupplementation on continuous ethanol fermentation performance andmetabolic flux distribution under very high concentration conditions.Biotechnol. Bioeng. 105:935–944. http://dx.doi.org/10.1002/bit.22610.
29. van Dijken JP, Bauer J, Brambilla L, Duboc P, Francois JM, Gancedo C,Giuseppin MLF, Heijnen JJ, Hoare M, Lange HC, Madden EA, Nieder-berger P, Nielsen J, Parrou JL, Petit T, Porro D, Reuss M, van Riel N,Rizzi M, Steensma HY, Verrips CT, Vindeløv J, Pronk JT. 2000. Aninterlaboratory comparison of physiological and genetic properties offour Saccharomyces cerevisiae strains. Enzyme Microb. Technol. 26:706 –714. http://dx.doi.org/10.1016/S0141-0229(00)00162-9.
30. Güldener U, Heck S, Fiedler T, Beinhauer J, Hegemann JH. 1996. A newefficient gene disruption cassette for repeated use in budding yeast. Nu-cleic Acids Res. 24:2519 –2524. http://dx.doi.org/10.1093/nar/24.13.2519.
31. Gietz RD, Akio S. 1988. New yeast-Escherichia coli shuttle vectors con-structed with in vitro mutagenized yeast genes lacking six-base pair re-striction sites. Gene 74:527–534. http://dx.doi.org/10.1016/0378-1119(88)90185-0.
32. Gietz RD, Woods RA. 2002. Transformation of yeast by lithium acetate/single-stranded carrier DNA/polyethylene glycol method. Methods Enzy-mol. 350:87–96. http://dx.doi.org/10.1016/S0076-6879(02)50957-5.
33. Taherzadeh MJ, Lidén G, Gustafsson L, Niklasson C. 1996. The effectsof pantothenate deficiency and acetate addition on anaerobic batch fer-mentation of glucose by Saccharomyces cerevisiae. Appl. Microbiol. Bio-technol. 46:176 –182. http://dx.doi.org/10.1007/s002530050801.
34. Teste M-A, Duquenne M, Francois JM, Parrou J-L. 2009. Validation ofreference genes for quantitative expression analysis by real-time RT-PCRin Saccharomyces cerevisiae. BMC Mol. Biol. 10:99. http://dx.doi.org/10.1186/1471-2199-10-99.
35. Taherzadeh MJ, Niklasson C, Lidén G. 1997. Acetic acid-friend or foe inanaerobic batch conversion of glucose to ethanol by Saccharomyces cerevi-siae? Chem. Eng. Sci. 52:2653–2659. http://dx.doi.org/10.1016/S0009-2509(97)00080-8.
36. Verduyn C, Postma E, Scheffers WA, van Dijken JP. 1990. Physiology ofSaccharomyces cerevisiae in anaerobic glucose-limited chemostat cultures.J. Gen. Microbiol. 136:395– 403. http://dx.doi.org/10.1099/00221287-136-3-395.
37. Wach A, Brachat A, Pohlmann R, Philippsen P. 1994. New heterologousmodules for classical or PCR-based gene disruptions in Saccharomycescerevisiae. Yeast 10:1793–1808. http://dx.doi.org/10.1002/yea.320101310.
38. Teunissen AW, van den Berg JA, Steensma HY. 1993. Physical localiza-tion of the flocculation gene FLO1 on chromosome I of Saccharomycescerevisiae. Yeast 9:1–10. http://dx.doi.org/10.1002/yea.320090102.
39. Verstrepen KJ, Jansen A, Lewitter F, Fink GR. 2005. Intragenic tandemrepeats generate functional variability. Nat. Genet. 37:986 –990. http://dx.doi.org/10.1038/ng1618.
Inhibitor Tolerance through Flocculation
November 2014 Volume 80 Number 22 aem.asm.org 6917
on April 1, 2020 by guest
http://aem.asm
.org/D
ownloaded from

40. Kobayashi O, Hayashi N, Kuroki R, Sone H. 1998. Region of Flo1proteins responsible for sugar recognition. J. Bacteriol. 180:6503– 6510.
41. Goossens K, Willaert R. 2010. Flocculation protein structure and cell-celladhesion mechanism in Saccharomyces cerevisiae. Biotechnol. Lett. 32:1571–1585. http://dx.doi.org/10.1007/s10529-010-0352-3.
42. Stratford M. 1989. Yeast flocculation: calcium specificity. Yeast 5:487–496. http://dx.doi.org/10.1002/yea.320050608.
43. Stratford M, Assinder S. 1991. Yeast flocculation: Flo1 and NewFlo phe-notypes and receptor structure. Yeast 7:559 –574. http://dx.doi.org/10.1002/yea.320070604.
44. Straver MH, Smit G, Kijne JW. 1994. Purification and partial character-ization of a flocculin from brewer’s yeast. Appl. Environ. Microbiol. 60:2754 –2758.
45. van Mulders SE, Christianen E, Saerens SMG, Daenen L, Verbelen PJ,Willaert R, Verstrepen KJ, Delvaux FR. 2009. Phenotypic diversity of Floprotein family-mediated adhesion in Saccharomyces cerevisiae. FEMS YeastRes. 9:178 –190. http://dx.doi.org/10.1111/j.1567-1364.2008.00462.x.
46. Smit G, Straver MH, Lugtenberg BJJ, Kijne JW. 1992. Flocculence ofSaccharomyces cerevisiae cells is induced by nutrient limitation, with cellsurface hydrophobicity as a major determinant. Appl. Environ. Microbiol.58:3709 –3714.
47. Sárvári Horváth I, Franzen CJ, Taherzadeh MJ, Niklasson C, Liden G.2003. Effects of furfural on the respiratory metabolism of Saccharomycescerevisiae in glucose-limited chemostats. Appl. Environ. Microbiol. 69:4076 – 4086. http://dx.doi.org/10.1128/aem.69.7.4076-4086.2003.
48. Zakrzewska A, van Eikenhorst G, Burggraaff JEC, Vis DJ, Hoefsloot H,Delneri D, Oliver SG, Brul S, Smits GJ. 2011. Genome-wide analysis ofyeast stress survival and tolerance acquisition to analyze the central trade-off between growth rate and cellular robustness. Mol. Biol. Cell 22:4435–4446. http://dx.doi.org/10.1091/mbc.E10-08-0721.
49. Ge XM, Bai FW. 2006. Intrinsic kinetics of continuous growth and eth-anol production of a flocculating fusant yeast strain SPSC01. J. Biotechnol.124:363–372. http://dx.doi.org/10.1016/j.jbiotec.2005.12.029.
50. Pourbafrani M, Talebnia F, Niklasson C, Taherzadeh MJ. 2007. Protec-tive effect of encapsulation in fermentation of limonene-contained mediaand orange peel hydrolyzate. Int. J. Mol. Sci. 8:777–787. http://dx.doi.org/10.3390/i8080777.
51. Reifenberger E, Freidel K, Ciriacy M. 1995. Identification of novel HXTgenes in Saccharomyces cerevisiae reveals the impact of individual hexosetransporters on glycolytic flux. Mol. Microbiol. 16:157–167. http://dx.doi.org/10.1111/j.1365-2958.1995.tb02400.x.
Westman et al.
6918 aem.asm.org Applied and Environmental Microbiology
on April 1, 2020 by guest
http://aem.asm
.org/D
ownloaded from


![[LECTURE] Coagulation and Flocculation](https://img.pdfslide.us/doc/110x75/577d2b6f1a28ab4e1eaac2f2/lecture-coagulation-and-flocculation.jpg)