Embed Size (px)
Citation preview

Flights of Fancy:
Corporate Jets, CEO Perquisites, and Inferior Shareholder Returns
David YermackDepartment of Finance
Stern School of BusinessNew York University
44 West 4th St., Suite 9-160New York, NY 10012
(212) [email protected]
September 2004
AbstractThis paper studies perquisites of major company CEOs, focusing on personal use of companyplanes. For firms that have disclosed this managerial benefit, average shareholder returns under-perform market benchmarks by more than 4 percent annually, a severe gap far exceeding thecosts of resources consumed. Around the date of the initial disclosure, firms’ stock prices dropby an average of 1.1 percent. Regression analysis finds no significant associations betweenCEOs’ perquisites and their compensation or percentage ownership, but variables related topersonal CEO characteristics, especially long-distance golf club memberships, have significantexplanatory power for personal aircraft use.
I thank Yakov Amihud, Eliezer Fich, Stuart Gillan, William Greene, Andrew Karolyi, Eli Ofek,Darius Palia, Charu Raheja, Robert Whitelaw, Julie Wulf, Jeffrey Wurgler, and seminarparticipants at the Duke-North Carolina Corporate Finance conference, the Federal ReserveBank of New York, the NBER Summer Institute Corporate Governance meeting, New YorkUniversity, and Vanderbilt University for helpful comments and data assistance.

1 The classic example is Burrough and Helyar’s (1990) account of management perks at RJR-Nabisco, whichbefore its 1991 leveraged buyout maintained an “RJR Air Force” of 10 aircraft. The planes were flown by a squad of 36company pilots, housed in “the Taj Mahal of corporate hangars,” and made available for use by CEO F. Ross Johnson toa range of friends, celebrities, golf instructors, and family pets (one of whom was listed on a passenger manifest as “G.Shepherd”). The authors write that “the jets were a symbol of the increasingly fuzzy line between what constitutedproper use of a corporate asset and what constituted abuse” (1990, pp. 93-94).
Former Occidental Petroleum CEO Armand Hammer attracted attention for his frequent personal use of thecompany’s Oxy One aircraft, flying the plane in and out of the former Soviet Union on numerous personal, charitable andpolitical trips.
In the 2004 Adelphia Communications securities fraud trial, prosecutors alleged that founding CEO John Rigastwice requisitioned company aircraft to deliver a Christmas tree to his daughter (the second flight became necessary afterthe first tree was rejected as unsuitable), while Rigas’s son Timothy, the company’s chief financial officer, repeatedlymade planes available to Australian actress-model Peta Wilson in a futile attempt to “impress” her. Wilson, who played afemme fatale assassin in a popular TV series, testified at the trial that she traveled approximately nine times on Adelphiaaircraft to destinations such as Jamaica but did not have a romantic relationship with the younger Rigas.
A representative example of a shareholder activist’s critique of CEOs’ corporate jet use appears in Minow(2001).
1
Flights of Fancy:
Corporate Jets, CEO Perquisites, and Inferior Shareholder Returns
I. Introduction
This paper studies perquisite consumption by executives of major corporations, with a
focus on CEOs’ personal use of company aircraft. Perks have long been identified as a source of
agency costs between shareholders and managers (Jensen and Meckling, 1976), and corporate
jets regularly inspire criticisms of managerial excess by journalists and shareholder activists.1
Data presented below indicate that personal aircraft use represents by far the most costly fringe
benefit enjoyed by major company CEOs.
The central result of this study is that CEOs’ personal use of company aircraft is
associated with severe and significant under-performance of their employers’ stocks. Firms that

2
permit personal aircraft use by the CEO under-perform market benchmarks by about 4 percent or
400 basis points per year, after controlling for a standard range of risk, size and other factors.
This result proves robust to a wide range of alternative performance measures and additional
controls.
I find that shareholders react negatively when firms first disclose that their CEO has been
awarded the aircraft perk, as stock prices fall by an abnormal 1.1 percent around the time of the
relevant SEC filings. While this reduction in market value is significant, it does not appear to
anticipate the full extent by which such companies’ stocks will on average under-perform the
market in the future.
The inverse relation between CEO aircraft use and company performance appears much
larger than could be explained by the direct cost of the resources consumed. One might
conjecture that CEOs who consume excessive perks may be less likely to work hard, less
protective of the company’s assets, or more likely to tolerate bloated or inefficient cost
structures. Some regression evidence, presented at the end of the paper, supports this last
possibility. High executive perks might also represent a symptom of weak corporate
governance, which in turn could cause firms to perform poorly over time.
To understand more clearly the role of perquisites in managerial compensation, the paper
presents regression models that show associations between CEO aircraft use and a range of
variables measuring corporate attributes and personal CEO characteristics. The results exhibit
only weak consistency with the leading financial theories of management perquisites, which
appear in classic studies of organizational structure by Jensen and Meckling (1976) and Fama

2 A branch of the Management literature also analyzes perquisites as motivational tools, based upon theirfunction as indicators of status within a firm. Rajan and Wulf (2004) test several empirical implications of this theory,using data that measures the depth and breadth of a firm’s organizational structure.
3 Jensen and Meckling state that in their analysis, perk consumption can be viewed as a representative exampleof the numerous ways in which agency problems can arise between a manager and shareholders, such as shirking or riskavoidance on the part of the manager.
3
(1980).2
Jensen and Meckling (1976) use perquisite consumption by managers as the basis for
their formal model of the agency costs of outside equity in a public corporation.3 They observe
that when an owner-manager sells stock to the public and reduces his ownership below 100%,
incentives increase for the manager to expend corporate resources for personal benefit. “As the
owner-manager’s fraction of the equity falls, his fractional claim on the outcomes falls and this
will tend to encourage him to appropriate larger amounts of corporate resources in the form of
perquisites,” the authors write (p. 313). This diversion of resources from the company to the
manager is viewed by the authors as a pure reduction in the value of the firm. A clear prediction
of Jensen and Meckling’s model is that perk consumption by a CEO should vary inversely with
his fractional ownership. Two further variables that should affect perk consumption, the authors
continue, are a manager’s personal tastes and the difficulty of monitoring the manager’s actions.
Fama (1980) views perquisites more benignly, essentially arguing that “consumption on
the job” by managers amounts to a form of compensation that can be offset through adjustments
in salary or other forms of pay. Fama describes the interaction between managers and their
boards of directors in terms of a dynamic of “ex post settling up,” in which the manager’s wage
is regularly revised to account for his performance and his personal consumption of company
resources. Fama’s model implies that perk consumption represents an agency cost only to the
4
extent that its value exceeds the subsequent penalties to the manager from ex post settling up
wage discounts. Fama’s theory, then, appears to predict an inverse association between perk
consumption and compensation, controlling for other attributes that affect compensation such as
industry, performance, and experience. Like Jensen and Meckling, Fama also suggests that
managerial tastes and the difficulty of monitoring will affect managers’ perquisites.
My regression analysis provides only modest support for either the Jensen-Meckling or
Fama theories of perk consumption. In certain regression models, I find a negative association
between CEOs’ personal aircraft use and their level of abnormal compensation, measured as the
residual from a typical compensation regression model. While this finding is consistent with
Fama’s ex post settling up perspective, its magnitude is quite small and it does not have
statistical significance. A CEO who consumes an extra $1,000 in perks, according to the
model’s estimates, will see his other compensation fall by about 8 cents. For the CEO’s
fractional stock ownership, I find a positive association with personal aircraft use. This result is
inconsistent with the predictions of the Jensen-Meckling model, but it is not significant and its
magnitude is again small. A test of the joint importance of both the compensation and ownership
variables also indicates no statistical significance. I obtain virtually identical results for a
regression analysis that uses all other perk consumption as the dependent variable.
Further regression results indicate that CEOs’ personal characteristics such as age,
education and political affiliation have significant explanatory power for patterns of personal
corporate jet use and other perk consumption. The CEO’s golfing habits have especially strong
associations with personal aircraft use; if the CEO belongs to a golf club that is located a long
distance from headquarters, his personal use of company aircraft increases significantly.

5
The remainder of the paper is organized as follows. Section II presents a description of
the data. Section III contains a regression analysis of patterns of CEO’s personal aircraft use.
Section IV analyzes the stock market performance of firms that do and do not permit personal
use of company planes by their managers, presenting both event-study and long-run portfolio
evidence. Section V briefly compares the study’s results for aircraft use and other perquisites.
Section VI concludes.
II. Data description
Data for this study is drawn from a panel of 237 large companies over the ten-year period
1993-2002. To qualify for the sample, a firm must be included in the 2002 Fortune 500 ranking
of largest U.S. companies and also be covered by the ExecuComp database for at least the seven
year period 1996-2002. This selection rule attempts to strike a balance between survivorship
bias and the need for sufficient observations for each firm to permit panel data analysis, while
keeping the costs of data collection reasonable. I collect data back to 1993 when available for
each firm. I delete observations for years in which a firm was not publicly traded for the entire
fiscal year. The final sample has 2,340 observations, with most firms appearing in the sample
for ten full years. Those observations cover 485 individual CEOs, a small handful of whom
serve more than one term with the same company.
I merge financial, stock market, governance, and compensation data from a variety of on-
line databases to create the paper’s data set. Financial statement data comes from Compustat,
stock market data from CRSP, institutional ownership data from Thomson Financial’s
CDA/Spectrum, governance data from IRRC, analyst data from I/B/E/S, board of directors data
6
from Standard & Poor’s Compact Disclosure, and compensation data from ExecuComp. When
necessary, I fill in missing data by using proxy statements.
Table I presents descriptive statistics about the sample. The sample firms have median
annual sales of close to $7 billion, median total assets above $10 billion, and median market
capitalization close to $8 billion. Governance parameters for sample firms are similar to those
found in other studies, with boards of about 12 directors having majorities of outside directors.
Institutional investors own about 60 percent of the stock of a typical firm. Institutional
ownership concentration is measured as the ratio of the five largest institutional positions divided
by total institutional ownership, a statistic found by Hartzell and Starks (2003) to have positive
associations with various measures of management incentives. The IRRC database’s governance
index counts the number of takeover defenses and other anti-shareholder provisions in a firm’s
charter and bylaws, following Gompers, Ishii, and Metrick (2003), who find this index to have
negative associations with a company’s stock market performance.
I tabulate data for aircraft ownership and companies’ proximity to airports from
databases maintained by the U.S. Federal Aviation Administration. For each company I record
whether headquarters lies within one hour’s drive of a Tier I, Tier II or Tier III airport, according
to FAA classifications of commercial airport use based on traffic for 2001. Tier I airports, the
largest “hub” facilities, are within an hour’s drive of nearly two-thirds of sample companies.
Hersch and McDougall (1992), in a study of corporate aircraft fleets, find that companies are less
likely to own or lease their own planes if headquarters is near a major commercial airport. The
dummy variable for coastal location, which equals one if the firm is near the east or west coast of
the continental U.S., is also tabulated because of results from that study, which found that firms

7
with geographically interior locations were more likely to acquire private aircraft.
A large majority of my sample firms have their own planes, according to a 2004 search of
the FAA’s civil aircraft registry. The frequency of 78.1% percent reported in Table I is based
upon this 2004 data, which unfortunately is not available for prior years. I code this variable 1 if
a firm appears in the FAA registry or if it reports personal use of company aircraft by at least one
of its executives at some point in the 1993-2002 sample period. This variable likely under-states
the incidence of corporate plane possession, since some companies might register their aircraft
under the name of a subsidiary different from the name of the corporate parent. Nevertheless the
78.1 percent frequency suggests that corporate jet ownership has risen slightly over time, as it is
higher than the 64 percent frequency reported by Hersch and McDougall (1992) for a 1984
sample of 516 large companies, as well as the 66 percent frequency reported by Rajan and Wulf
(2004) for a 1986-1999 sample of 300 large companies (the 66 percent figure in Rajan and Wulf
may also be un under-estimate, since it includes only companies that permit the CEO to schedule
use of company aircraft, although it’s not clear how any other company officer could have the
authority to overrule a CEO on such a decision).
The lower half of Table I presents information about individual company CEOs, who
appear very similar to those studied in other large-sample empirical work. The typical CEO is
about 58 years old, with a mean of seven years service (median of five) and mean ownership of
about 1.5% of the firm’s shares (median of 0.4%). I calculate ownership by adding shares
owned plus vested options and dividing the total by shares outstanding plus vested options.
CEOs receive mean cash salary and bonus compensation of about $2.1 million (median $1.6
million) and additional annual income from stock option and restricted stock awards. Stock

8
options, valued by ExecuComp’s modified Black-Scholes methodology, deliver a large, skewed
distribution of compensation, with a mean of $4.5 million, median of $1.6 million, and 75th and
90th percentile values of $4.0 and $9.3 million, respectively.
Theories of perquisite consumption stress the crucial role of tastes and preferences of
individual CEOs. It is impossible to measure such variables directly, but I am able to collect
several variables about the backgrounds of my sample’s 485 CEOs that one might expect to
exhibit correlations with their perk preferences. CEOs’ political affiliations can be observed
from databases of donations maintained by the U.S. Federal Election Commission and state voter
registration authorities. I classify CEOs as either Republicans or Democrats if a clear majority
of their donations are directed to one party’s candidates or organizations. If a CEO’s donations
are either ambiguous or zero, I consult voter registration data that is available on Lexis/Nexis for
a majority of U.S. states. Sixty-two percent of the CEOs appear to be Republicans and 21
percent Democrats, with the remainder either Independent or unknown.
CEOs’ educational backgrounds are provided by Forbes magazine’s annual executive
compensation surveys, supplemented when necessary by on-line news searches. Six percent of
the sample CEOs have no college degree, but a majority have attained a graduate degree of some
type, including 38 percent MBAs, 10 percent JD or LLB law degrees, and 5 percent PhD’s.
I tabulate publicly available data about CEOs’ golfing activities, if any, because of the
popularity of golf as a recreational activity for affluent Americans, especially business
executives. The U.S. Golf Association maintains an Internet database of the playing records of
millions of golfers who choose to register with the association in order to establish a sanctioned
handicap. The database also identifies golf clubs or country clubs where each individual is a
4 The nearest city to Augusta is Columbia, South Carolina, 70 miles away, and Atlanta is more than three hours’drive. Augusta membership data data is posted at www.usatoday.com/sports/golf/masters/2002-09-27-augusta-list.htm. The USGA handicap database can be accessed at www.ghin.com/lookup/index.html.
9
member. In my sample, 42.8 percent of the CEOs appear in the USGA database, and a
significant number – 17.2 percent of the overall sample -- have country club memberships in
locales very far from headquarters, mainly in the states of Florida, California, Colorado, or
Massachusetts. I define a “long-distance golf” dummy variable and set it equal to 1 if the CEO
is a member of a club that is located outside his home state or a contiguous state (many
Connecticut CEOs play locally in Westchester County, New York, for instance), or if the CEO is
a member of the Augusta (Georgia) National Golf Club, the country’s most famous and
exclusive, which is not located near any major corporations.4 The long-distance golf dummy
variable has a mean of 0.232.
Data on CEO perk consumption has not been tabulated by any on-line source, and for this
study I obtain it by reading annual proxy statements for each of the observations in the sample.
Perk data has been disclosed in proxy statements since 1993, generally in a footnote to column
(e) of the Summary Compensation Table, headed “Other Annual Compensation.” Following the
SEC’s proxy disclosure regulations, this column includes “the dollar value of other annual
compensation not properly classified as salary or bonus,” with “perquisites and other personal
benefits” as one of several mandatory items that are combined into an aggregate total. These
regulations became effective at the end of 1992, and most companies began applying them to
their proxy filings in 1993. The SEC’s EDGAR database, the central source for electronically
filed proxies, has coverage that begins one year later, for proxies filed in 1994 and after, which
accounts for the cutoff date for the sample in this study.

5 Disclosure regulations appear in 17 CFR 228.402, “Executive Compensation,” and the regulations for perkdisclosure are in §228.402(b)(2)(iii)(C). The original draft of the disclosure regulations set the overall threshold at thelesser of $25,000 or 10 percent of total cash compensation, and required itemization of every perk received, regardless ofamount, if the overall threshold were exceeded. See SEC Release No. 33-6940, 34-30851 (June 23, 1992). The overalllimit was raised to $50,000 “to reflect inflation,” while the requirement to itemize each category was dropped withoutexplanation. See SEC Release 33-6962, 34-31327 (October 16, 1992).
10
SEC regulations specify minimum thresholds for perk disclosure, and these thresholds
complicate data collection. The total value of perks must be disclosed based upon their
“aggregate incremental cost” to the company, but only if the total exceeds the lesser of $50,000
or 10 percent of the executive’s salary plus bonus (for all but 63 observations in my sample, the
CEO earns $500,000 or more in salary plus bonus). In such cases, the total cost of perks may not
be directly observed, because many companies disclose the perk total only after aggregating it
with other data items reportable in the same column of the table, such as above-market interest
on deferred compensation and income tax reimbursements. A further requirement is that the
company must itemize the cost of any individual perk, such as personal aircraft use, if it exceeds
25 percent of the overall perk total, assuming that the total exceeds the $50,000 threshold.5
Firms’ compliance with this itemization requirement provides the data used in this study.
The structure of the SEC’s disclosure rules cause data for CEOs’ personal aircraft use to
be censored. Assuming the CEO earns at least $500,000 salary plus bonus, firms never have to
disclose aircraft use if its cost lies below $12,500 (equal to 25 percent of the $50,000 overall
threshold), and will have to disclose values above $12,500 only to the extent that other perk
consumption is not large enough to reduce aircraft use to below 25 percent of the overall perk
total. Inspection of the data indicates that other categories of perks rarely exceed aircraft use, so
one can conclude that in the large majority of cases, values above $50,000 will be disclosed.
Values between $12,500 and $50,000 will be disclosed to the extent that the CEO receives

11
enough other perks to surpass the $50,000 overall threshold.
From reading a large number of proxy statements, it is evident that several disclosure
loopholes limit the transparency of perk consumption data. A CEO who makes significant use of
a corporate plane for personal travel may nevertheless avoid disclosure under one or more of the
following scenarios:
• The company may incur slightly less than $50,000 incremental cost for aircraftuse by the CEO and make no other perks available to the CEO, meaning that nodisclosure at all is required.
• The CEO may receive perks in five or more categories in roughly equalproportions, so that none accounts for 25 percent of the overall total. In this caseonly the total value of all perks must be disclosed.
• The CEO may receive very large perks in one category other than aircraft use, sothat only that category is disclosed. This is common when new CEOs receiverelocation expense reimbursements, which can be large.
• The company may aggressively classify certain types of income as “perquisites”and count it toward the overall threshold, allowing it to itemize only thosecategories if they are large enough and thereby obscure the consumption of otherperks. Some companies appear to have adopted this practice with such financialitems as retirement contributions and insurance policy payments, which are moreproperly viewed as tax and income deferral strategies rather than perquisites.
• The company may choose not to classify personal aircraft use as a perquisite if atleast some part of a plane trip involves business.
Table II presents data about disclosures of CEO perquisites, and the reader is reminded
again that the data are subject to censoring due to the SEC’s regulations. The SEC provides no
guidance about how companies should calculate the “incremental cost” of benefits such as
aircraft use, meaning that different firms likely use different methods to produce the data that are
disclosed to shareholders. Perks are rank-ordered in Table II according to the frequency of their
disclosure in the sample. Companies use certain euphemisms to describe personal aircraft use,

6 A few companies in the sample, apparently at a loss for how to measure the incremental cost of aircraft use,instead report the value of each executive’s plane use according to Internal Revenue Service guidelines for imputingtaxable personal income to an employee who travels for personal reasons on corporate aircraft. These complexregulations, known as the Standard Industry Fare Level or SIFL rules, appear in IRS Regulation §1.61-21(g) and arebased upon certain multiples of estimated cost per mile flown. The SEC rarely acts against companies for failing tocomply with perquisite and other compensation disclosure requirements. In probably the only such case to date, theCommission’s staff in August 2004 recommended sanctioning Tyson Foods Inc. for not disclosing a wide range of perks,including air travel, obtained between 1997 and 2003 by founder and former CEO Don Tyson. Even if Tyson did notcompletely disclose perquisites, its executives still ranked among the most prolific personal aircraft users in the samplefor this paper.
7 Some idea of the scale of censoring of the perquisite data in Table II can be inferred by a comparison of thetable with confidential survey data summarized in Rajan and Wulf (2004, p. 13, footnote 15). Those authors study acomparable sample of 300 large firms that have mean annual sales of $7.8 billion. A consulting firm’s survey of CEOperks in those companies found that 38 percent of CEOs had access to company cars while 47 percent had clubmemberships paid for by the firm. In my sample only 6 perecent of CEOs have disclosed company cars while 2 percent
12
such as “travel expense” and “corporate transportation.” I generally assume that such language
refers to airplane or helicopter travel rather than limousines, trains, or boats, unless disclosures
indicate otherwise. In some cases the company lists travel expenses for the CEO’s spouse or tax
reimbursements for income imputed to the CEO related to corporate aircraft use; I tabulate these
as part of the CEO’s overall aircraft use totals. The minimum values for items listed in each row
of Table II indicate that some firms voluntarily disclose perk costs even when they fall below the
SEC’s thresholds, but these disclosures represent only a small part of the sample. Since the
disclosures are based upon the incremental cost of perks, they would not capture the full cost of
providing certain services to CEOs, as items such as amortization of an aircraft’s acquisition cost
wouldn’t properly be viewed as incremental.6
Data in Table II indicate that aircraft use is by far the largest disclosed CEO perk,
appearing more than twice as often as the next most popular item, financial counseling, which
includes tax preparation, estate planning, and the cost of representation in contract negotiations.
Company cars, country club memberships, medical reimbursements (above the firm’s regular
health insurance), and personal security also appear on the list of perks in Table II.7 I do not

have disclosed club memberships. The median value of these perks was $17.6 and $3.7 thousand, repsectively, in theRajan and Wulf sample, compared to median values of $16.0 and $24.7 in my sample. One could therefore infer thatcountry club dues are almost always too small to trigger disclosure in proxy statements (most disclosures appear to be forinitiation fees and not annual dues), while company cars are generally disclosed only if another, larger perk such asaircraft use is also reported. Unfortunately the Rajan and Wulf data for CEO aircraft use reflects a combined value forbusiness and personal use and not personal use by itself, so it cannot be compared with the data in this paper.
13
tabulate moving and relocation expenses, which can be very large and exceed aircraft use for
some firms. Inspection of the data indicate that moving expenses are overwhelmingly
concentrated among executives who are posted overseas for temporary assignments or who
relocate after being recruited from outside the firm (some also relocate if headquarters is shifted
due to a merger or other event). I also do not tabulate data for perks that are strictly financial
and appear to represent tax deferral strategies, such as split-dollar life insurance or pension plan
contributions.
Figure 1 shows a sharp increase in the frequency of disclosed personal aircraft use over
the ten-year sample period, with the annual rate having risen from 9 percent in 1993 to above 30
percent in 2002. The rise of fractional aircraft ownership occurred during the sample period,
reducing dramatically the up-front costs of access to corporate jets and probably contributing
importantly to the increasing use shown in Figure 1. The sample selection design may also
affect this pattern, as membership in the 2002 Fortune 500 is one criteria for inclusion, and firms
on the 2002 Fortune list probably performed well in the years prior to 2002. However, aircraft
use data look extremely similar for the subset of firms that were listed in the Fortune 500 at the
beginning of the sample period. The terrorist attacks of September 11, 2001, also appear to have
played a role in increased corporate aircraft use, at least at the tail end of the sample period.
Since that time commercial air travel has become more costly and less convenient, and some

8 Such a perception would probably be misplaced. Data tabulated by the National Business AviationAssociation indicate that while the total accident rate per flight hour is comparable for corporate and commercial flights,corporate aviation has a much higher fatal accident rate. If the data were recalculated per passenger mile flown, theywould skew more dramatically in favor of commercial aviation, since commercial aircraft carry more passengers andtravel at greater speeds. See www.nbaa.org/basics/safety/background.htm and Carley (1997).
14
CEOs or their boards may perceive corporate jets as safer than commercial ones.8 A handful of
proxy statement disclosures, even some before the terrorist attacks, indicate that for security
reasons, the board requires the CEO to use corporate aircraft for personal travel (this
“requirement” is sometimes negotiated as part of a CEO’s employment contract).
Table II indicates that the mean (median) cost to the company of CEO’s personal aircraft
use, when disclosed, is a little above $65,000 ($52,000). Costs of operating different aircraft
vary greatly. Maynard (2001) uses data from Executive Jet Inc., the leading time-share
company, to estimate the hourly cost of leasing an eight-person Cessna Citation V aircraft as
$10,000, or $2,500 per person if the CEO on average travels with three other passengers. A
CEO with $65,000 in reportable aircraft use would therefore spend about 26 hours per year in
the sky, enough for perhaps four round-trips between New York and Florida, for example.
III Determinants of CEOs’ personal use of aircraft
Data for CEOs’ personal aircraft use has many zero-valued observations, since not every
firm has a corporate jet or permits its executives to use it as a perk. Additionally, the previous
section describes how the SEC’s proxy regulations lead to censoring of the data for actual
aircraft use when it falls below the threshold required for disclosure. Given these properties of
the data, I rely on a Tobit regression model to analyze how the cost of CEO aircraft use in each
firm-year is related to a range of explanatory variables. The main purpose of this analysis is to

15
evaluate whether perquisite data conform to the Jensen and Meckling (1976) and Fama (1980)
theories of perk consumption.
The Jensen-Meckling model predicts an inverse association between CEOs’ perks and
their fractional ownership, and I therefore use percent ownership of the firm’s equity (including
vested options) as an explanatory variable. Fama’s theory of perk consumption implies a
downward adjustment in compensation when perks are high. To evaluate this possibility, I first
fit an ordinary least squares regression model of expected compensation for each CEO-year
observation. The regression has total compensation as the dependent variable, equal to the sum
of salary, bonus, restricted stock awards, and stock option awards. Option awards are valued
using ExecuComp’s Black-Scholes approach. Explanatory variables in the compensation
regression include industry dummy variables, year dummy variables, firm size (the log of sales),
the CEO’s years of service, and abnormal stock performance (the firm’s annual stock return
minus the return on the relevant CRSP beta decile, both compounded continuously). I save the
residuals from the estimation and include them in the Tobit perk regression as a measure of
abnormal or excess compensation. If the CEO’s pay is adjusted downward when perk
consumption is high, this variable should exhibit a negative coefficient estimate.
A range of variables might represent proxies for the amount of monitoring that constrains
CEO perk consumption. The regression models include five different measures of potential
monitoring strength: the log of board size, the percentage of outside directors, the log of the
number of analysts following the company (according to I/B/E/S earnings surveys), total
ownership by institutional investors, and the concentration of institutional ownership. As
discussed above, this last variable follows the definition of Hartzell and Starks (2003) as the

16
ratio of the five largest institutional owners’ positions over total institutional ownership.
CEO tastes and preferences also should affect perk consumption. I include in regressions
CEO age and a dummy variable for membership in the company’s founding family, both
standard variables that have been found by many authors to have associations with patterns of
ownership and compensation. In addition, I tabulate information about CEOs’ education, relying
mostly on data published in Forbes magazine’s annual compensation surveys. The model
includes dummy variables for CEOs with no college degree, and for a range of graduate degrees
including MBAs, JD or LLB law degrees, PhDs, and all other. Finally, I use information about
CEOs’ political donations and voter registrations to construct dummy variables for Republican
and Democrat CEOs. Executive compensation has become a political issue in the U.S. over the
past decade, and it is plausible that Republican and Democrat CEOs have different attitudes
about perk consumption.
Finally, the regression models include control variables for company size, measured as
the log of sales; leverage, measured as long-term debt over total assets; and a time trend,
measured as the difference between the year and 1993. Company size is used by Rajan and Wulf
(2004) as one proxy for the extent to which perks might be used as indicators of status within an
organization. Leverage might be important if it creates performance pressure that leads to
agency cost reduction such as lower perk consumption by managers.
Table III presents estimates for Tobit models of the cost of CEOs’ perquisites. The left
column shows estimates with CEO personal aircraft use as the dependent variable, while the
right column has estimates based upon the value of all other disclosed CEO perks. Both models
include firm fixed effects, equivalent to assigning a separate intercept term to each firm that has

17
at least one nonzero observation.
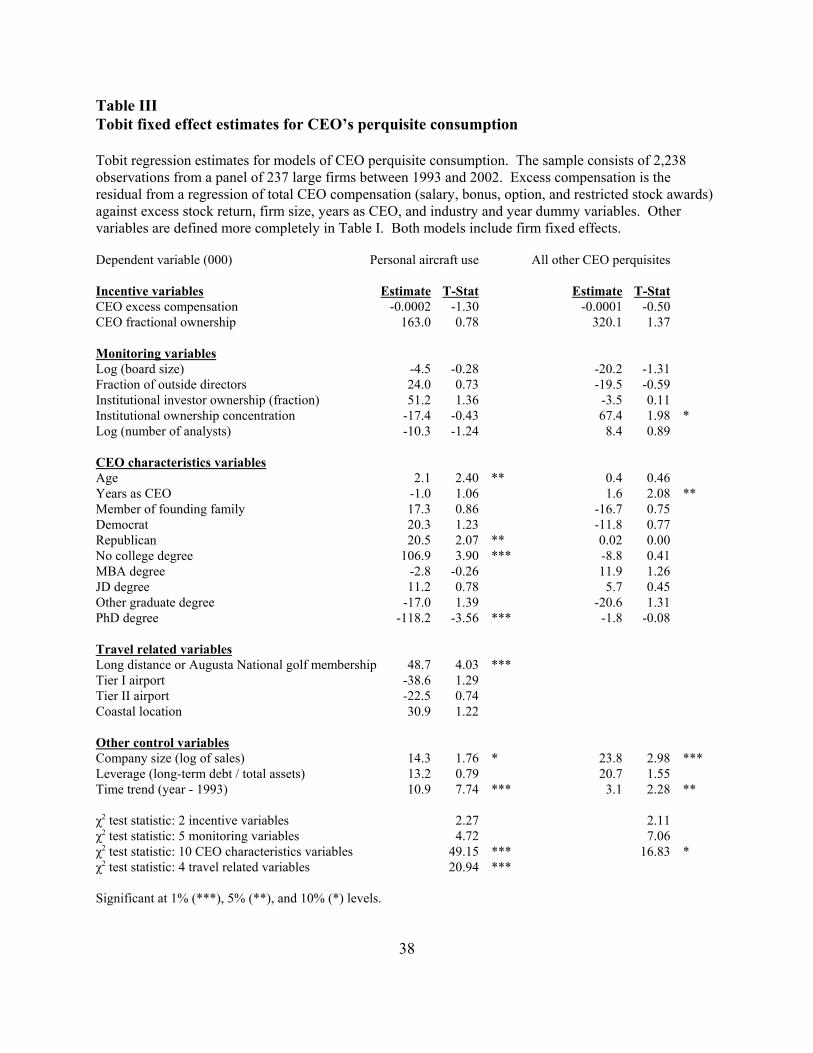
Estimates for the excess compensation residual are negative for both dependent variables
but without statistical significance. The negative signs provide some support for Fama’s (1980)
theory about perk consumption, since they imply that a CEO’s compensation is adjusted
downward when his perk consumption increases. However, the marginal effect of the estimated
coefficient is small. Based upon the partial derivative of the likelihood function, the marginal
effect is very close to
-0.00008, implying that an additional $1,000 in personal aircraft use by the CEO leads to a
reduction in compensation of 8 cents, an economically negligible amount; the estimate for all
other types of perk consumption has even lower magnitude. These estimates are far too small to
support explanations for perk consumption that rely on marginal tax differentials between the
firm and CEO (a theory also rejected by Rajan and Wulf (2004)) or the CEO placing a personal
value on perks that exceeds the firm’s cost of providing them.
The CEO ownership variable has positive rather than negative estimates in both models,
providing no evidence of the predicted negative association with perk consumption. As a
sensitivity check of the results I use an alternative piecewise ownership specification with two
breakpoints, following Mørck, Shleifer and Vishny (1988) and other studies. I find insignificant
ownership estimates over different ranges with no consistent pattern of sign switches. I conclude
that, as is the case with compensation, no clear association exists between CEO ownership and
perquisites. A likelihood ratio test of the joint significance of compensation and ownership
yields low values with no statistical significance, as shown by the chi-squared statistic at the
bottom of Table III.

18
Variables measuring monitoring difficulty also have little success in explaining CEOs’
patterns of aircraft use. For the five monitoring variables tabulated in the two models of Table
III, only one coefficient estimate among the ten has statistical significance. A likelihood ratio
test for each model indicates that collectively these variables have no significant association with
perquisite consumption.
In contrast to the results for incentive and monitoring variables, CEO tastes and
preferences have clear impacts upon patterns of corporate aircraft use, as shown by the many
statistically significant estimates in the left column of Table III. Older CEOs are more likely
than younger ones to make personal use of company aircraft. This pattern may arise due to
increasing frailty of CEOs as they age, or it may represent opportunism by CEOs who consume
perks heavily near the end of their careers with reduced fears that ex post settling up wage
revisions will permanently impact their compensation; the latter possibility is not supported in
the right column, in which the estimate for this variable is positive but not significant for non-
aircraft perk consumption. Political affiliation has some association with personal aircraft use,
but in a non-partisan way. Both Democrat and Republican CEOs are heavier users of corporate
aircraft than unaligned CEOs, and the difference is statistically greater than zero for
Republicans. Finally, a striking pattern of CEOs’ personal aircraft use and their education is
suggested by Table III. Those CEOs with the least education (no college degree) are the
heaviest aircraft users., while those with the highest advanced degrees (Ph.D.s) are the lightest.
CEOs who hold MBAs or other masters degrees are somewhere in between, and CEO-lawyers
have significantly higher aircraft use than normal, though not as high as non-college graduates.
As is the case with CEO age, neither the political nor education patterns of CEO aircraft use are

19
duplicated in the model for all other perks. However, a likelihood ratio test for the collective
importance of all CEO characteristics is significant in both models, below the 1 percent level for
aircraft use and below the 10 percent level for other perks.
Perhaps the strongest result in either model is the impact of the long-distance golf
indicator variable in the model for personal aircraft use. This variable, which equals 1 if the
CEO belongs either to Augusta National or to a golf club not near headquarters, has a significant
estimate with a t-statistic exceeding 4. Other travel-related variables do not exhibit statistical
significance, but a likelihood test for the collective significance of all such variables is highly
significant. I do not include the travel variables in the model for all other perk consumption, as
no a priori reason suggests that other perks should be associated with air travel variables.
Finally, company size and the time trend variable each have positive and significant
estimates for both models. The result for company size is consistent with the theory that large
perks are used to indicate status in large organizations. It also may reflect the general tendency
of all types of executive compensation to increase in line with firm size.
I check the importance of the choice of estimation framework by fitting a variety of
alternative regression models. These include ordinary least squares, OLS with both fixed effects
and random effects, and a probit-Tobit two stage sample selection model. Apart from minor
differences in the sign and significance of certain control variables, the basic results are
unchanged from those shown in Table III. The estimates for the compensation and ownership
variables are insignificant and close to zero in every model, and the significant association of
aircraft use with CEO age, education, and golfing persists across all models.

20
IV CEO aircraft use and company stock returns
This section studies the association between CEOs’ personal use of company aircraft and
firms’ stock returns. Section A presents event study evidence of how stock prices react when a
CEO’s aircraft use is first disclosed. Section B presents long-term stock return evidence about
the performance of firms that permit personal CEO aircraft use. Section C contains sensitivity
tests of the results in Section B. .Section D presents evidence about the operating performance
of these firms.
A. Event study evidence
To evaluate shareholder reactions to CEOs’ personal use of corporate aircraft, I study
abnormal stock price changes when proxy statements are published disclosing that companies
have begun granting this fringe benefit. Abnormal stock returns are calculated using standard
market-model methodology. The event date for the analysis is the day on which a proxy
statement is posted on the SEC’s EDGAR website, where corporate filings are available for
public inspection. A few firms file preliminary proxy statements several weeks in advance of
their final filings, and I use the posting dates for these preliminary documents if they occur. In
my 1993-2002 sample of 237 firms, 104 companies disclose personal aircraft use at some point
for either the CEO or another executive. Of this group, 19 made their first disclosure for the year
1992, which lies beyond my sample period because the relevant proxy statements are not
available on the SEC’s EDGAR website (the proxies can be retrieved from Lexis/Nexis, but their
date of posting on EDGAR is unclear). I focus on the remaining 85 companies and study the
stock price reactions when the aircraft perk is first disclosed to shareholders.

21
Figure 2 illustrates mean cumulative abnormal stock returns for the sample of 85 firms
beginning two weeks or 10 trading days prior to the proxy statement posting date. I extend the
graph until one week after the filing day because some firms may post their documents after the
market closes. For comparison purposes, the graph also includes a plot of the cumulative
abnormal returns for all 2,217 other observations, which are weakly positive over the same
interval, consistent with Brickley’s (1986) study of a randomly chosen sample of proxy
statement release dates. Stock prices exhibit essentially zero change until one week before the
event day, at which point they begin to trend downward. It is possible that some firms begin
printing and mailing hard copies of their proxies within the week prior to the document’s posting
at the SEC, accounting for the gradual one-week decline of the sample average CAR. As shown
in Table IV, the mean CAR over the event window [t -4, t +1] is -1.13 percent, with a t-statistic of
1.90, significant below the 6 percent level.
A loss of 1.1 percent in market capitalization is worth about $75 million for the median
firm in the sample, far in excess of the disclosed incremental cost to the company of a CEO’s
personal aircraft use. However, the incremental cost does not include amortization of the aircraft
itself, and a top-of-the-line corporate jet can cost $35 million or more. If shareholders view the
entire corporate aviation activity of a firm as a deadweight cost that yields no compensating
benefits, and if one factors in additional costs for storage, maintenance, fuel, and operation of the
plane, then the dollar loss in shareholder wealth could approximate the true present value cost to
the firm of acquiring an aircraft and making it available to the CEO for both business and
personal travel.
The CAR results indicate that shareholders do not welcome the news that firms permit

22
CEOs to use corporate aircraft for personal travel. Table IV includes two decompositions of the
results. In Panel A, the result for the overall sample of 85 firms is divided into two pieces: 54
firms for which the aircraft disclosure was the first executive perk ever disclosed to shareholders,
and the remaining 31 firms, all of which had previously disclosed other perks such as company
cars or country club memberships. Though the difference is not statistically significant, the
CARs have much greater magnitude for the sub-sample that had not previously disclosed any
perks, consistent with an interpretation that earlier perk disclosures by a company signal some
probability of future personal aircraft use. Abnormal returns for the earlier, initial disclosures of
other types of perks by the 31 firms were not significantly different from zero, however.
Panel B in the lower half of Table IV presents a simple regression analysis that shows an
association between stock price reactions and the compensation and ownership levels for each
CEO. I regress the CAR for [t -4, t +1] against an intercept, the excess compensation residual
described above in Section III, and the CEO’s percentage stock ownership. A significantly
negative estimate emerges for the compensation variable, indicating that shareholder reactions to
CEOs’ corporate jet use are mitigated if the CEO earns lower compensation. This pattern is
consistent with the Fama (1980) perspective that perks are benign if offset by reductions in other
forms of compensation.
B. Long-term stock performance: Basic result
I use the standard Fama-French (1993) three-factor analysis of annual stock returns to
assess the ongoing market performance of firms that permit their CEOs to have personal use of
corporate aircraft. Results for the analysis appear in Table V, with the basic Fama-French model

23
in the left column.
Coefficient estimates for a dummy variable for personal aircraft use appear in the last
row of the table. These coefficients represent the differential annual returns to stockholders of
firms that permit executives to use corporate aircraft for personal travel. Companies disclose
personal CEO aircraft use for 15.4 percent of the sample observations. In another 3.6 percent of
cases, a different top 5 executive has disclosed aircraft use while the CEO does not. I assume
that the board is unlikely to make a perk available to other managers without also awarding it to
the CEO, so I also code those observations as 1, raising the sample mean to 19.0 percent. In
these cases, I reason that the CEO is likely using the aircraft as well but at a level that falls below
the SEC’s disclosure thresholds. Other explanatory variables in the regression include an
intercept, the return on the CRSP value-weighted market index, differential returns on portfolios
of growth stocks compared to value stocks, and the differential returns on portfolios of small
capitalization stocks compared to large cap stocks. Data for these market factors are obtained
from Ken French’s web site. The risk-free rate is subtracted from both the dependent variable
and the market index.
Table V reports Beck and Katz (1995) panel corrected standard errors which take account
of heteroskedasticity and cross-correlations between firms. Because the standard error
calculations require a balanced panel, I base the calculations on the 220 firms (out of 237 in the
sample) than have ten full years of trading data available. This sub-sampling requires me to
discard 136 observations, about 6 percent of the total, but basic OLS regressions show that
coefficient estimates and standard errors for the full unbalanced panel exhibit almost no
difference compared to estimates for the balanced subsample.

24
In the left column of Table V, the aircraft dummy variable has a coefficient of -4.54
percentage points with a t-statistic significant at levels below 1 percent. This result indicates that
firms with CEO aircraft use under-perform the market by more than 400 basis points per year,
equal to a shortfall of about $300 million in market capitalization each year for the median
sample firm.
Figure 3 shows abnormal stock returns for companies before and after the first year in
which personal CEO aircraft use is disclosed. The figure shows that firms adopting a policy that
permits CEO aircraft use perform well prior to awarding this perk, and exceptionally well in the
year just before the perk is granted, with abnormal stock performance of almost +5 percent.
These data suggest that perhaps the aircraft use is provided as a reward to the managers of
strongly performing firms. In the first year in which CEOs are permitted to use aircraft for
personal travel, company performance plummets, to an abnormal return of -8 percent. It
improves somewhat but remains poor in all subsequent years.
C. Long-term stock performance: Sensitivity tests
(i) Additional controls
In the other columns of Table V, I add to the model explanatory variables that might have
correlations with the aircraft variable. In the second column, I introduce Carhart’s (1997)
momentum factor, representing the differential return on portfolios of rising stocks and falling
stocks. In the third column, I add the Gompers-Ishii-Metrick (2003) governance index. If CEO
perk consumption arises as a consequence of weak corporate governance, the aircraft variable
might merely be a proxy for broader governance problems in the firm. In the fourth column, I

25
add a dummy variable for firms that were members of the Fortune 500 in 1996 as well as 2002.
This variable represents a control for sample selection bias; those firms that joined the Fortune
500 at some point after 1996 must have performed well in the late 1990s in order to grow large
enough to enter the index. In the final column, I include all three additional control variables at
once.
The impact of the additional control variables, either individually or together, is
negligible, as aircraft firms continue to exhibit under-performance on the order of 400 basis
points with high levels of significance. Two of the three controls have statistical significance,
though together they increase the model’s adjusted R2 only from 0.132 to 0.146. The governance
index has a negative estimate, as expected, indicating lower returns for firms with takeover
defenses and anti-shareholder bylaws or charter provisions in line with the findings of Gompers
et. al (2003). However, its estimate is not significant. The dummy variable for older Fortune
500 firms is also negative as expected, indicating that other sample firms that rose up to join the
Fortune 500 after 1996 were superior market performers compared to firms that remained in the
index for the entire period.
(ii) Alternate variable definitions and estimation methods
Table VI presents results from robustness tests to verify the persistence of the negative
estimates for the CEO aircraft use variable across a wide range of alternative specifications.
Each additional cell of the table contains the coefficient estimate and t-statistic for the aircraft
variable from a different estimation.
The four rows of the table provide estimates based upon different measures of the overall

26
market return. Estimates in the second row use the equal-weighted market return used in place
of the value-weighted market return with the remaining Fama-French controls retained as in the
left column of Table V. In the third and fourth rows, value-weighted and equal-weighted
industry-specific indexes are used in place of market-wide indexes. Industry assignments follow
Fama and French’s grouping of SIC codes into 48 industry portfolios, returns for which are
posted on French’s web site.
The table has into four vertical sections based upon different definitions of the personal
aircraft use variable. The first three columns of the table use an indicator variable that is coded 1
if personal aircraft use is disclosed for the CEO for that year. In the second three columns, the
definition of the aircraft indicator is expanded to take account of possible censoring of perquisite
data below certain monetary thresholds. In these columns, I code as 1 all observations for a
company following the first annual disclosure of personal aircraft use by the CEO, thereby
raising the sample average for the aircraft use variable from 15.4 percent to 21.4 percent. The
right half of the table is based upon similar definitions of the aircraft use variable, except that
perk data is tabulated with respect to disclosures for any top 5 executive instead of the CEO
only.
Three different estimation procedures are used for each of the 16 unique combinations of
the various aircraft and market return variables. Columns labeled “Panel” contain estimates
produced by the same methods used in Table V. Columns labeled “F-M” are Fama-MacBeth
estimates, based upon summary statistics for annual estimations of the regressions for each of the
ten years in the sample. Columns labeled “Diff.” represent the difference in intercept terms
estimated by regressions in the sub-samples for which the aircraft variable takes the values 0 and

27
1 (this approach is used by Gompers, Ishii and Metrick (2003) in their study of the effect of anti-
takeover provisions upon firms’ stock performances).
The main conclusions of the paper are little affected by this range of alternative models.
Estimated coefficients for the aircraft variable in Table VI are uniformly negative, ranging from
-0.0215 to -0.0607, with most of the estimates clustered near 400 basis points (the mean value of
the 48 estimates is -0.0368). Thirty-seven of the 48 estimates are statistically significant at the
10 percent level or better, and nearly all of the remaining 11 estimates have significance levels in
the neighborhood of 15 percent. Fama-MacBeth estimates are slightly closer to zero than
estimates from the other two methods.
In further analysis that is untabulated, I estimate weighted least squares regressions of the
same models in Table V, using market capitalization at the start of the year as the weight.
Coefficient estimates are even more negative than for these weighted least squares estimates than
for the equal weighted OLS models. I also examine whether results are sensitive to replacing the
dummy variable for CEOs’ personal aircraft use with a continuous variable. If the natural log of
the dollar value of aircraft use is substituted for the dummy variable (with zero-valued
observations set equal to zero), it has a negative coefficient estimate that is statistically
significant. Using a linear instead of a logged measure of personal aircraft use yields a negative
but insignificant estimate, though a model with both linear and squared terms indicates a
negative and significant relation between aircraft use and stock returns up to a level of about
$200,000 annually, but a positive and significant relation thereafter (only a small handful of
sample firms report values this high).

28
(iii) Corporate aircraft not available for perquisite use
It is possible that the results in Tables V and VI may not be due to management patterns
associated with executives’ perquisite consumption. Instead, factors associated with the
possession of corporate aircraft (whether through lease or ownership), such as firm size or
industry, may have had systematic associations with company performance during the sample
period. This conjecture seems somewhat unlikely to affect the overall results, however, due to
the very high propensity of the sample firms to operate their own aircraft (see the 78.1 percent
mean in Table I).
In Table VII I re-estimate the regressions from Table V and include an indicator variable
for firms that are aircraft operators but have never disclosed personal use by the CEO or another
executive. Results are shown in the second column; for comparison purposes, the first column
shows the model estimated with a dummy variable that equals 1 for years in which personal
aircraft use is disclosed for an executive. In contrast to the negative and significant estimate in
the left column, the estimate the second column is positive though not significant. The
difference between the estimates for the dummy variables in columns 1 and 2 is significant
below the 1 percent level.
(iv) Other perquisite categories
The third column of Table VII includes regression estimates that investigate the relation
between company performance and other executive perks. The indicator variable in the third
column is set equal to 1 for years in which at least one executive has other disclosed perks, such
as a company car or country club membership, but no disclosed aircraft use. The estimate for

29
this variable is negative but not significant. I also estimate separate regressions using dummy
variables for each of the five perquisites listed in Table II. Four of the five dummy variables
have negative estimates, with country club memberships the most negative.
D. Operating performance
Results above highlight the under-performance in the stock market of firms that permit
CEOs to use company aircraft for personal travel. Given that these performance shortfalls equal
hundreds of millions of dollars per company per year, it would be difficult to argue that the
direct costs of perk consumption alone could explain the gap.
Although many explanations could account for the poor performance of firms with CEOs
who exhibit high perk consumption, one clear possibility is that these managers run their firms
inefficiently, tolerating waste, excess overhead, or uncompetitive cost structures. Table VIII
presents regression estimates that provide some evidence consistent with this possibility. I
regress firms’ sales per employee against the aircraft dummy variable from Table V, as well as
dummy variables for industries and years. Both random effects and fixed effects estimates are
reported. The results show a strong, significant negative association between the aircraft
variable and sales per employee, indicating that firms with high CEO perquisites tend to be over-
staffed relative to the competition, achieving about $25,000 less in sales per employee.
However, similar regressions using return on assets as the dependent variable do not yield
significant results.

30
V Personal aircraft use compared to other perquisites
Table 9 presents a summary of evidence about the personal aircraft perquisite, in the left
column, compared to all other types of perks, which are analyzed as a group in the right column.
Together, the evidence suggests that the incidence and stock price associations of other perks
occur in patterns reasonably similar, albeit not as dramatic, as the effects associated with
personal aircraft use.
The top rows of the table indicate that other perquisites rose in frequency at a fast rate,
just slightly below the growth rate of personal aircraft use between 1993 and 2002. The second
section summarizes the regression results from Table III. It shows that certain explanatory
variables or groups of variables have statistically significant associations with perk values in
similar patterns for aircraft use and all other perks. The third section of the table tabulates stock
market reactions to all proxy statement filings in which perks are disclosed, whether or not for
the first time, and compares the reactions with those for which proxy statement filings indicate
no perk consumption (the same one-week event window analyzed in Table IV is used).
Abnormal stock price reactions are lower in each column when perks are disclosed, though the
differences with non-disclosures are not statistically significant. Finally, the bottom row of the
table reproduces the regression coefficient estimates and t-statistics from the first and third
columns of Table VII. These indicate negative stock performance in years in which executives
receive either type of perk, though the estimate for aircraft use is larger in magnitude than for all
other perks.
Two possible explanations might account for the disparities in stock price associations
for aircraft use compared to other perks. First, data for other perks is almost certainly censored

31
more heavily than for aircraft use, since cars, club memberships, and the like are not as
expensive as jet airplanes. If so, the perk indicator variable in the annual stock performance
regressions may be measured with greater error, leading to an estimate with a magnitude that is
too low. Additionally, aircraft use may be associated with more serious management or
governance problems than other perks, due to its sheer expense and degree of conspicuousness;
an executive who has the company acquire an automobile for his use may not be shirking or
sending adverse signals to other workers to quite the same degree as when has the company
acquire an aircraft.
VI Conclusions
This paper studies perquisite consumption by CEOs in major companies, focusing on
personal use of company aircraft, the most costly and frequently disclosed managerial fringe
benefit. Data indicate that more than 30 percent of Fortune 500 CEOs in 2002 were permitted to
use company planes for personal travel, up from a frequency below 10 percent a decade earlier.
The most striking results in the paper concern the association between CEO perk
consumption and company performance. When personal aircraft use by CEOs is first disclosed
to shareholders, company stock prices drop by about 1.1 percent. However, this value loss does
not fully anticipate the future poor performance of such companies. Regression analysis
indicates that firms permitting CEO aircraft use under-perform market benchmarks by about 400
basis points per year, a severe shortfall that cannot be explained simply by the costs of the
resources consumed. Further analysis indicates that firms in this category have excess staffing
relative to their counterparts.

32
Regression models of CEO personal aircraft do not show significant associations with
compensation, ownership, or monitoring variables as predicted by theory. However, variables
measuring personal characteristics of CEOs, such as age, political affiliation, and education,
have marked associations with perk consumption. Especially strong associations appear to exist
between personal aircraft use and a CEO’s golfing activity, as an indicator variable for long-
distance golf club memberships has strong magnitude and significance.

33
References
Beck, Neal, and Jonathan N. Katz, 1995, What to do (and not to do) with time-series-cross-section data in comparative politics, American Political Science Review 89, 634-647.
Brickley, James, 1986, Interpreting common stock returns around proxy statement disclosuresand annual shareholder meetings, Journal of Financial and Quantitative Analysis 21, 343-349.
Burrough, Bryan, and John Helyar, 1990, Barbarians at the Gate (New York: Harper & Row).
Carhart, Mark M., 1997, On persistence in mutual fund performance, Journal of Finance 52, 57-82.
Carley, William M., 1997, Despite a safe record, corporate jets have higher fatality rates, TheWall Street Journal, April 18, A1.
Fama, Eugene F., 1980, Agency problems and the theory of the firm, Journal of PoliticalEconomy 88, 288-307.
Fama, Eugene F., and Kenneth R. French, 1993, Common risk factors in the returns on stocksand bonds, Journal of Financial Economics 33, 3-56.
Gompers, Paul A., Joy L. Ishii, and Andrew Metrick, 2003, Corporate governance and equityprices, Quarterly Journal of Economics 118, 107-155.
Hartzell, Jay C., and Laura T. Starks, 2003, Institutional investors and executive compensation,Journal of Finance 53, 2351-2374.
Hersch, Philip L., and Gerald S. McDougall, 1992, Separation of ownership from control and thedemand for corporate aircraft, Journal of Economics and Business 44, 223-236.
Jensen, Michael C., and William H. Meckling, 1976, Theory of the firm: Managerial behavior,agency costs, and ownership structure, Journal of Financial Economics 3, 395-360.
Maynard, Micheline, 2001, Corporate planes: Perks or necessities? The New York Times,September 23, 3:6.
Minow, Nell, 2001, The use of company aircraft, unpublished manuscript,www.thecorporatelibrary.com/special/misc/aircraft.html.
Mørck, Randall, Andrei Shleifer, and Robert Vishny, 1988, Management ownership and marketvaluation: An empirical analysis, Journal of Financial Economics 20, 293-315.
Rajan, Raghuram G., and Julie Wulf, 2004, Are perks purely managerial excess? Unpublished

34
working paper, University of Pennsylvania.

35
Table IDescriptive statistics
Descriptive statistics for a data set of 237 large firms during the 1993-2002 period. The sampleincludes companies listed in the 2002 Fortune 500 and also covered by ExecuComp for the period1996-2002. If available, data is tabulated from 1993 forward. Data is obtained from the Compustat,CRSP, IRRC, Compact Disclosure, FAA, and CDA/Spectrum databases, as well as company proxystatements. Leverage equals long-term debt over total assets. Institutional ownership concentrationequals the ownership of the five largest institutions divided by total institutional ownership. Thenumber of analysts equals the annual earnings estimates listed by the I/B/E/S database at the start ofeach year. Governance index is a count variable measuring takeover defenses and other anti-shareholder provisions. Abnormal stock return equals the raw return minus the return on the CRSPbeta decile portfolio for each firm-year. CEO ownership equals common stock plus vested optionsover shares outstanding. Stock option award values are based upon ExecuComp’s Black-Scholesmethodology. Political affiliations for CEOs are obtained from databases of the Federal ElectionCommission and state voter registrations, and education backgrounds are obtained primarily fromForbes magazine compensation surveys. Golf club membership data are obtained from the handicapdatabase of the U. S. Golf Association and from news reports.
Individual firmsIndividual CEOsCEO-firm-year observations
237485
2,340
Std.Dev.
Percentiles
Firm variables Mean 10th 25th 50th 75th 90th
Sales (bn)Total assets (bn)Market capitalization (bn)Leverage
Board sizeFraction of outside directorsInstitutional ownershipInstitutional concentrationNumber of analystsGovernance index
Stock return (raw, annual)Stock return (abnormal)
Tier I hub airport within 1 hourTier II mid-sized airportCoastal location
Firm owns or leases aircraft
$10.98$30.98$20.06
0.40
12.10.79
0.5890.3519.0
9.7
0.1690.005
0.6620.1380.567
0.781
$13.09$77.29$40.23
0.25
3.60.11
0.1550.10
8.12.7
0.4120.319
$2.21$2.05$2.09
0.09
80.64
0.3810.23
96
-0.242-0.330
$3.73$4.09$3.79
0.22
100.73
0.4870.28
138
-0.071-0.186
$6.75$10.40
$7.700.38
120.82
0.6040.34
1810
0.118-0.025
$13.22$24.90$17.83
0.54
140.88
0.6970.41
2412
0.3610.146
$24.01$67.54$45.58
0.68
160.92
0.7790.48
3013
0.6070.358

36
Table Icontinued
Std.Dev.
Percentiles
CEO variables Mean 10th 25th 50th 75th 90th
AgeYears as CEOOwnership fraction
Founding family member
Salary (mm)Annual bonus (mm)Stock option award (mm)Restricted stock award (mm)
RepublicanDemocrat
No college degreeCollege onlyMBA graduate degreeJD or LLB graduate degreePhD graduate degreeOther graduate degree
Golf club - localGolf club - long distanceGolf club - Augusta National
57.46.9
0.0148
0.146
$0.87$1.24$4.48$0.71
0.6170.206
0.0610.3140.3770.0990.0480.100
0.3600.1720.089
6.37.1
0.0361
$0.38$1.85
$16.72$2.74
490
0.0007
$0.48000
532
0.0016
$0.67$0.37$0.34
0
585
0.0039
$0.84$0.80$1.59
0
629
0.0087
$1.00$1.45$4.03$0.16
6416
0.0323
$1.20$2.50$9.28$1.77

37
Table IIPerquisites reported for CEOs
Perquisite consumption data for CEOs in a sample 2,340 observations for 237 large companiesbetween 1993 and 2002. Data is obtained from annual company proxy statements. Accordingto SEC rules, companies must report perquisites for individual categories if the CEO’s totalbenefits exceed $50,000 and an individual category represents more than 25% of the total. Asmall number of companies elect to report lesser-valued perquisites whose disclosure is notmandatory, and their data is included in the table. Perquisite values are reported according toincremental cost to the company. The table includes only non-financial perquisites involvingtangible items or personal services and excludes deferred compensation, life insurance, andother tax deferral arrangements. Tabulations below exclude four observations dropped fromthe analysis due to missing values. All dollar values are in thousands.
Statistics for observationswith perquisite value disclosed
Number of Disclosures Freq. Obs. Mean
Std.Dev. Min. Med. Max.
Personal use ofcompany aircraft
357 14.6% 345 $65.2 $48.1 $0.5 $52.8 $360.0
Financialcounseling
212 9.1% 172 $38.4 $45.5 $1.0 $25.0 $330.5
Company car andlocal transportation
137 5.9% 108 $24.4 $26.7 $3.0 $16.0 $139.8
Country club dues 51 2.2% 50 $32.6 $30.1 $0.1 $24.7 $130.5
Medical careexceeding co. plans
37 1.6% 28 $15.1 $14.3 $0.8 $9.5 $73.2
Personal or homesecurity
7 0.3% 6 $40.4 $29.5 $1.0 $37.7 $94.0
38
Table IIITobit fixed effect estimates for CEO’s perquisite consumption
Tobit regression estimates for models of CEO perquisite consumption. The sample consists of 2,238observations from a panel of 237 large firms between 1993 and 2002. Excess compensation is theresidual from a regression of total CEO compensation (salary, bonus, option, and restricted stock awards)against excess stock return, firm size, years as CEO, and industry and year dummy variables. Othervariables are defined more completely in Table I. Both models include firm fixed effects.
Dependent variable (000) Personal aircraft use All other CEO perquisites
Incentive variables Estimate T-Stat Estimate T-StatCEO excess compensation -0.0002 -1.30 -0.0001 -0.50CEO fractional ownership 163.0 0.78 320.1 1.37
Monitoring variablesLog (board size) -4.5 -0.28 -20.2 -1.31Fraction of outside directors 24.0 0.73 -19.5 -0.59Institutional investor ownership (fraction) 51.2 1.36 -3.5 0.11Institutional ownership concentration -17.4 -0.43 67.4 1.98 *Log (number of analysts) -10.3 -1.24 8.4 0.89
CEO characteristics variablesAge 2.1 2.40 ** 0.4 0.46Years as CEO -1.0 1.06 1.6 2.08 **Member of founding family 17.3 0.86 -16.7 0.75Democrat 20.3 1.23 -11.8 0.77Republican 20.5 2.07 ** 0.02 0.00No college degree 106.9 3.90 *** -8.8 0.41MBA degree -2.8 -0.26 11.9 1.26JD degree 11.2 0.78 5.7 0.45Other graduate degree -17.0 1.39 -20.6 1.31PhD degree -118.2 -3.56 *** -1.8 -0.08
Travel related variablesLong distance or Augusta National golf membership 48.7 4.03 ***Tier I airport -38.6 1.29Tier II airport -22.5 0.74Coastal location 30.9 1.22
Other control variablesCompany size (log of sales) 14.3 1.76 * 23.8 2.98 ***Leverage (long-term debt / total assets) 13.2 0.79 20.7 1.55Time trend (year - 1993) 10.9 7.74 *** 3.1 2.28 **
χ2 test statistic: 2 incentive variables 2.27 2.11χ2 test statistic: 5 monitoring variables 4.72 7.06χ2 test statistic: 10 CEO characteristics variables 49.15 *** 16.83 *χ2 test statistic: 4 travel related variables 20.94 ***
Significant at 1% (***), 5% (**), and 10% (*) levels.

39
Table IVAbnormal stock returns for initial disclosures of managers’ personal aircraft use
Mean cumulative abnormal stock returns for a sample of firms around the dates of proxystatement filings. The sample includes 85 firms that for the first time report personal use ofcompany aircraft by the CEO or other executive. The observations are drawn from a data set of237 large firms between 1993 and 2002. Abnormal stock returns are calculated using standardmarket model methodology. The event date, day 0, is the date on which the proxy statement isfiled electronically with the SEC. Cumulative abnormal returns are calculated over the intervalbeginning four days prior to the event day and continuing until one day after. Panel A showsmean cumulative abnormal returns in this event window, for the entire sample and forsubsamples based upon whether the aircraft disclosure represents the company’s first reportedexecutive perquisite. Panel B presents regression analysis of the CARs from panel A, as afunction of the CEO’s excess compensation and fractional stock ownership. Excesscompensation is the residual from a regression of total CEO compensation (salary, bonus, stockoptions, and restricted stock awards) against excess stock return, firm size, years as CEO, andindustry and year dummy variables.
Panel A: Mean cumulative abnormal returns
Observations Mean CAR T-StatisticAll initial disclosures 85 -1.13% -1.90 *of personal aircraft use
Company’s first disclosure of any perk 54 -1.65% -2.55 **Preceded by disclosure of other perks 31 -0.23% 0.22
Panel B: OLS regression analysis of cumulative abnormal returns
Estimate T-StatisticIntercept -0.0091 -1.36CEO excess compensation x 10-3 -0.0010 -2.40 **CEO fractional ownership -0.2594 -1.28
Observations 85R2 0.080Adjusted R2 0.058
Significant at 1% (***), 5% (**), and 10% (*) levels.

40
Table VRegression estimates of stock performance as function of executives’ personal aircraft use
Ordinarily least squares regression of companies’ annual stock returns. The sample includes 220large firms between 1993 and 2002. The dependent variable is the raw stock return minus therisk-free rate. The principal explanatory variable is an indicator for whether the company makesaircraft available for personal use by the CEO or another top 5 executive and discloses thisbenefit in the proxy statement filed at the end of the fiscal year. Other explanatory variablesinclude the Fama-French (1993) factors for excess return on the stock market (value-weighted),excess return for value stocks compared to growth stocks, excess return for small stockscompared to large stocks; the Carhart (1997) factor for excess return of rising stocks comparedto falling stocks; the Gompers-Ishii-Metrick (2003) governance index, and a dummy variable forfirms that were in the Fortune 500 in both 1996 and 2002. All returns and factors arecompounded continuously. T-statistics appear below each estimate in parentheses, based uponstandard errors robust to heteroskedasticity and cross-firm correlations.
Estimate Estimate Estimate Estimate Estimate
Intercept -0.0074(0.32)
0.0259(1.01)
0.0301(0.89)
0.0334(1.34)
0.0964(1.97)
*
Market excess return
0.8005(6.47)
*** 0.8127(7.24)
*** 0.7964(6.47)
*** 0.8022(6.49)
*** 0.8110(7.27)
***
Value - growthexcess return
0.5309(2.85)
*** 0.5552(3.47)
*** 0.5315(2.87)
*** 0.5340(2.87)
*** 0.5587(3.53)
***
Small - largeexcess return
-0.0929(0.50)
-0.2039(1.23)
-0.0939(0.51)
-0.0940(0.51)
-0.2058(1.25)
Up - downexcess return
-0.2953(2.28)
** -0.2953(2.30)
**
Governance index -0.0038(1.23)
-0.0031(1.07)
Indicator for 1996Fortune 500 firms
-0.0511(1.89)
* -0.0499(1.92)
*
CEO personal useof company plane
-0.0454(2.65)
*** -0.0413(2.46)
** -0.0473(2.76)
*** -0.0424(2.43)
** -0.0399(2.34)
**
ObservationsR2
Adjusted R2
2,2200.1320.130
2,2200.1410.139
2,2200.1330.131
2,2200.1360.134
2,2200.1460.143
Significant at 1% (***), 5% (**), and 10% (*) levels.

41
Table VICoefficient estimates for aircraft use variable under alternative models
Alternative specifications of regression models of companies’ annual stock returns as a function of executives’ personal use of corporate aircraft. The table shows the estimated coefficient and t-statistic for the aircraft use indicator in 48 different models, with four different specifications of themarket index variable, four different definitions of the aircraft use variable, and three different estimation methods. The top lines of the tabledescribe criteria for the aircraft use indicator variable, the mean value of which is shown in the bottom row. All regressions include the sameFama-French factors used in the left column of Table V, except for the alternate definitions of the market index variable. Industry excess returnsare based on industry portfolios tabulated by Fama and French. Columns labeled “Panel” represent panel data estimates using the same approachas in Table V. Columns labeled “F-M” are Fama-MacBeth estimates based on ten annual regressions for each model. Columns labeled“Diff.”show the difference in intercept estimates for regressions in subsamples partitioned according to the value of the aircraft use variable. ThePanel estimates used the balanced panel of 2,200 observations, while the other two models use the full sample of 2,236 observations.
Definition of aircraft indicator variable:
Personal use by CEO Personal use by CEO or any top 5 executive
Measurement of market index:
This year This year or past years This year This year or past years
Panel F-M Diff. Panel F-M Diff. Panel F-M Diff. Panel F-M Diff.
Market return, value-weighted -0.0361(2.01)
-0.0224(1.62)
-0.0305(1.19)
-0.0305(1.87)
-0.0265(2.22)
-0.0391(1.69)
-0.0454(2.65)
-0.0359(2.16)
-0.0401(1.65)
-0.0295(1.91)
-0.0217(1.77)
-0.0337(1.54)
Market return, equal-weighted -0.0455(2.40)
-0.0215(1.60)
-0.0433(1.53)
-0.0421(2.29)
-0.0250(2.18)
-0.0545(2.13)
-0.0541(2.99)
-0.0349(2.10)
-0.0533(1.98)
-0.0409(2.32)
-0.0273(2.51)
-0.0496(2.05)
Industry return, value-weighted -0.0307(1.92)
-0.0253(1.79)
-0.0297(1.39)
-0.0229(1.60)
-0.0246(1.61)
-0.0306(1.63)
-0.0415(2.74)
-0.0394(2.25)
-0.0371(1.89)
-0.0227(1.73)
-0.0213(1.51)
-0.0248(1.41)
Industry return, equal-weighted -0.0475(2.59)
-0.0274(1.95)
-0.0607(2.67)
-0.0392(2.39)
-0.0264(2.04)
-0.0604(3.03)
-0.0569(3.37)
-0.0409(2.43)
-0.0554(2.60)
-0.0413(2.59)
-0.0249(1.78)
-0.0490(2.58)
Mean of aircraft variable 0.154 0.214 0.190 0.247

42
Table VIIRegression estimates of stock performance as a function of executives’ perquisites
Ordinarily least squares regression of companies’ annual stock returns. The sample includes 220large firms between 1993 and 2002. The dependent variable is the raw stock return minus therisk-free rate. The principal explanatory variables are indicators for management perquisiteconsumption. In the left column, an indicator equals 1 if the company discloses personal aircraftuse by any executive in the proxy statement filed at the end of the fiscal year. In the secondcolumn, an indicator equals 1 if the company owns or leases a plane, according to 2004information in the FAA’s aircraft registry, and no prior personal aircraft use is disclosed for anycompany executive in the 1993-2002 sample period. In the third column, an indicator equals 1 ifan executive has any other perquisites disclosed in the proxy statement in the categories ofautomobiles, country clubs, personal security, financial counseling, or medical benefits, while nopersonal aircraft use is disclosed. Other explanatory variables are the same Fama-French factorsfrom Table V. All returns and factors are compounded continuously. T-statistics appear beloweach estimate in parentheses, based upon standard errors robust to heteroskedasticity and cross-firm correlations.
Estimate Estimate Estimate Estimate
Intercept -0.0074(0.32)
-0.0228(0.96)
-0.0155(0.67)
0.0007(0.03)
Market excess return
0.8005(6.47)
*** 0.8077(6.52)
*** 0.8126(6.54)
*** 0.8007(6.48)
***
Value - growthexcess return
0.5309(2.85)
*** 0.5295(2.82)
*** 0.5307(2.82)
*** 0.5317(2.86)
***
Small - largeexcess return
-0.0929(0.50)
-0.0901(0.48)
-0.0916(0.49)
-0.0959(0.52)
Personal use of company aircraft -0.0454(2.65)
*** -0.0536(2.69)
***
Company has aircraft but nodisclosed personal use
0.0124(1.10)
-0.0083(0.75)
Any other disclosed perquisite,and no disclosed personalaircraft use
-0.0095(0.39)
-0.0201(0.81)
ObservationsR2
Adjusted R2
2,2200.1320.130
2,2200.1290.128
2,2200.1290.128
2,2200.1320.130
Significant at 1% (***), 5% (**), and 10% (*) levels.

43
Table VIIIRegression analysis of operating performance variables
Regression estimates of firms’ sales per employee. Explanatory variables include dummyvariables for industry and year, and a dummy variable for whether corporate aircraft is madeavailable to the firm’s executives for personal use. The aircraft variable takes the value 1 in thefirst year in which the company discloses personal aircraft use by a top 5 executive and in allsubsequent years The sample is a panel of 237 large firms between 1993 and 2002. T-statisticsappear below each estimate in parentheses.
Dependent variable: Sales per employee (000)
Random Effects Fixed EffectsEstimate Estimate
Personal use of aircraft by CEO -27.8 ** -25.1 *(1.96) (1.83)
Year dummy variables Yes YesIndustry dummy variables Yes n.a.Observations 2,296 2,296R2 n.a. 0.758Adjusted R2 n.a. 0.724
Significant at 1% (***), 5% (**), and 10% (*) levels.

44
Table IXPersonal aircraft use compared to other perquisites
Comparisons of a variety of summary statistics for executive perquisites in a sample of 237 largecompanies between 1993 and 2002. The left column contains information for years in whichpersonal aircraft use is disclosed for any company executive. The right column containsinformation for years in which any other perquisite is disclosed according to the classificationsshown in Table II. The top section of the table shows annual disclosure frequencies for the years1993 and 2002. The second section summaries results from the regression analysis in Table III,with Yes indicating that a group of variables had statistical significance in the regression model,and No indicating no significance. The third section reports main abnormal stock returns aroundthe dates of proxy statement filings, with the data partitioned according to whether the companydid or did not disclosure perk consumption by an executive. The bottom section reproducescoefficient estimates and t-statistics for the indicator variables in the first and third columns ofTable VII.
Frequency of disclosure Personal aircraft use All other perquisites1993 0.113 0.1472002 0.333 0.266
Variables associated with perk valuesCompensation No NoOwnership No NoMonitoring indicators No NoOther personal attributes of CEO Yes YesFirm size Yes YesLeverage No No
Market reaction to perk disclosures (all events)Proxy statement indicates perk -0.11% 0.10%(t-statistic) (0.38) (0.42)
Proxy statement indicates no perk 0.27% 0.22%(t-statistic) (0.47) (0.89)
Association with annual stock returnIndicator variable coefficient -0.0454 -0.0095(t-statistic) (2.65) (0.39)

45
0%
5%
10%
15%
20%
25%
30%
35%
CEO
s with
dis
clos
ed p
erso
nal u
se o
f airc
raft
1993 1994 1995 1996 1997 1998 1999 2000 2001 2002
Figure 1Firms with personal use of corporate aircraft by CEOs: 1993-2002
Annual frequency of personal use of corporate aircraft use disclosed for CEOs in 237 Fortune500 companies between 1993 and 2002. Data is obtained from annual company proxystatements. According to SEC rules, companies must report personal aircraft use if thecompany’s incremental cost of an executive’s total perquisites exceeds $50,000 and personalaircraft use represents more than 25% of the total. A small number of companies elect to reportlesser-valued personal aircraft use whose disclosure is not mandatory, and their data is includedin the figure. If the variable’s definition were expanded to cover personal aircraft use by anycompany executive, it would be about three percentage points higher per year.

46
-1.50%
-1.00%
-0.50%
0.00%
0.50%
1.00%
Days Relative to Proxy Filing
Mea
n C
umul
ativ
e A
bnor
mal
Ret
urn
-10 -5 Filing Day 5
Figure 2Cumulative abnormal stock returns for initial disclosures of managers’ personal aircraft use
Mean cumulative abnormal stock returns for a sample of firms around the dates of proxystatement filings. The darker line shows CARs for 85 firms that for the first time report personaluse of company aircraft by the CEO or another company executive in proxy statements filedelectronically with the SEC. The lighter line shows CARs for the remaining 2,217 observationsin the sample for which proxy statement filing dates could be identified. Observations are drawnfrom a data set of 237 large firms between 1993 and 2002. Abnormal stock returns arecalculated using standard market model methodology.

47
-10%
-5%
0%
5%
10%
Year relative to first personal aircraft use by any manager
Mea
n ab
norm
al st
ock
retu
rn p
er y
ear
-2 and before -1 First Disclosed Use +1 +2 and after
Figure 3Abnormal stock returns of companies and CEOs’ personal aircraft use
Annual abnormal stock returns for firms that permit personal use of company aircraft by theCEO, in a sample of 237 large companies between 1993 and 2002. Abnormal stock returns aremeasured as coefficient estimates for dummy variables in Fama-French (1993) regressionsidentical to the left column of Table V. The dotted line shows mean abnormal returns for 104companies that begin permitting personal use of aircraft during the sample period, with datatabulated for different periods relative to the first year of disclosed use.

![Advance learning on perquisites Theory [1]… · ADVANCE LEARNING ON PERQUISITES (THEORY) Meaning of perquisite In general perquisite means any benefit. In the context of salary income](https://img.pdfslide.us/doc/110x75/611d8143772ca23f2f501cf2/advance-learning-on-perquisites-theory-1-advance-learning-on-perquisites-theory.jpg)