Embed Size (px)
Citation preview
American Institute of Aeronautics and Astronautics
1
Flight Test Results for a Fuel Cell Unmanned Aerial Vehicle
Thomas H. Bradley*, Blake A. Moffitt†, David E. Parekh‡ and Dimitri N. Mavris§ Georgia Institute of Technology, Atlanta, Georgia, 30332-0405
Fuel cell-powered aircraft are an emerging and important application of fuel cell and advanced aircraft technologies. This paper presents and analyzes test results for a fuel cell-powered unmanned aerial vehicle. The aircraft under analysis is a fully functional technology demonstrator that uses a polymer electrolyte fuel cell system fueled by compressed hydrogen. The tested performance of the fuel cell system, propulsion system and aircraft is critically evaluated using data from flight and laboratory testing.
I. Introduction nmanned Aerial Vehicles (UAVs) are a promising new application for fuel cell technologies. Several fuel cell-powered aircraft have recently been built by researchers in the US and Europe, proving the near-term viability
of aircraft powered by this new technology [1-5]. Despite these successful demonstrations, little data is available regarding the detailed performance of these aircraft and their fuel cell powerplants.
The Georgia Institute of Technology designed and constructed a fuel cell-powered unmanned aerial vehicle in the period 2005-2006. Flight and laboratory testing of the aircraft and powerplant was completed in 2006. This paper presents an overview of the components and system architecture of the aircraft and powerplant. Flight test results are presented and analyzed to characterize the aircraft and to determine means for performance improvement.
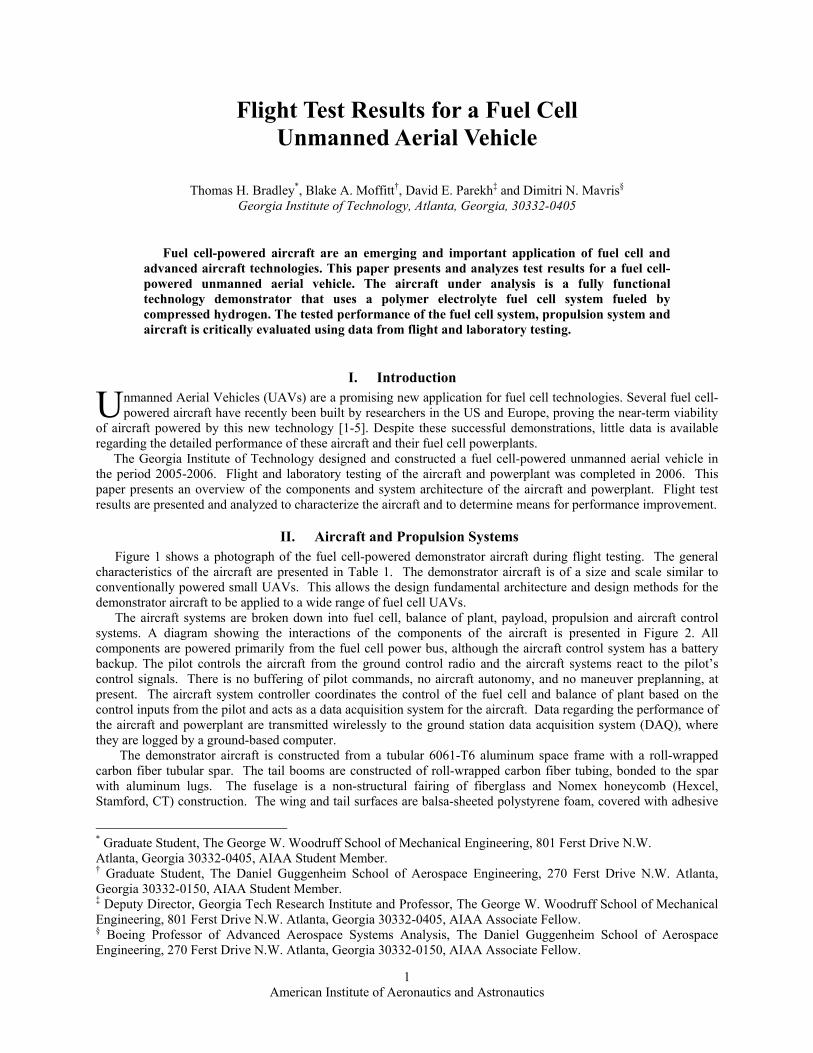
II. Aircraft and Propulsion Systems Figure 1 shows a photograph of the fuel cell-powered demonstrator aircraft during flight testing. The general
characteristics of the aircraft are presented in Table 1. The demonstrator aircraft is of a size and scale similar to conventionally powered small UAVs. This allows the design fundamental architecture and design methods for the demonstrator aircraft to be applied to a wide range of fuel cell UAVs.
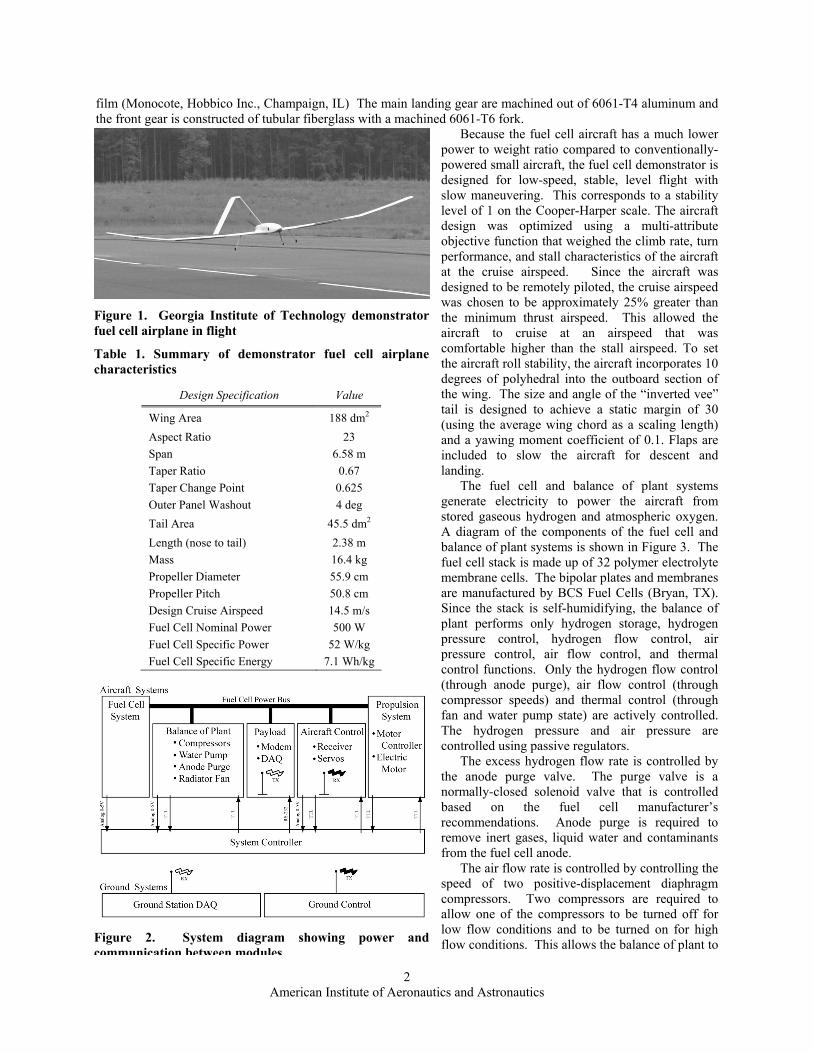
The aircraft systems are broken down into fuel cell, balance of plant, payload, propulsion and aircraft control systems. A diagram showing the interactions of the components of the aircraft is presented in Figure 2. All components are powered primarily from the fuel cell power bus, although the aircraft control system has a battery backup. The pilot controls the aircraft from the ground control radio and the aircraft systems react to the pilot’s control signals. There is no buffering of pilot commands, no aircraft autonomy, and no maneuver preplanning, at present. The aircraft system controller coordinates the control of the fuel cell and balance of plant based on the control inputs from the pilot and acts as a data acquisition system for the aircraft. Data regarding the performance of the aircraft and powerplant are transmitted wirelessly to the ground station data acquisition system (DAQ), where they are logged by a ground-based computer.
The demonstrator aircraft is constructed from a tubular 6061-T6 aluminum space frame with a roll-wrapped carbon fiber tubular spar. The tail booms are constructed of roll-wrapped carbon fiber tubing, bonded to the spar with aluminum lugs. The fuselage is a non-structural fairing of fiberglass and Nomex honeycomb (Hexcel, Stamford, CT) construction. The wing and tail surfaces are balsa-sheeted polystyrene foam, covered with adhesive
* Graduate Student, The George W. Woodruff School of Mechanical Engineering, 801 Ferst Drive N.W. Atlanta, Georgia 30332-0405, AIAA Student Member. † Graduate Student, The Daniel Guggenheim School of Aerospace Engineering, 270 Ferst Drive N.W. Atlanta, Georgia 30332-0150, AIAA Student Member. ‡ Deputy Director, Georgia Tech Research Institute and Professor, The George W. Woodruff School of Mechanical Engineering, 801 Ferst Drive N.W. Atlanta, Georgia 30332-0405, AIAA Associate Fellow. § Boeing Professor of Advanced Aerospace Systems Analysis, The Daniel Guggenheim School of Aerospace Engineering, 270 Ferst Drive N.W. Atlanta, Georgia 30332-0150, AIAA Associate Fellow.
U
American Institute of Aeronautics and Astronautics
2
film (Monocote, Hobbico Inc., Champaign, IL) The main landing gear are machined out of 6061-T4 aluminum and the front gear is constructed of tubular fiberglass with a machined 6061-T6 fork.
Because the fuel cell aircraft has a much lower power to weight ratio compared to conventionally-powered small aircraft, the fuel cell demonstrator is designed for low-speed, stable, level flight with slow maneuvering. This corresponds to a stability level of 1 on the Cooper-Harper scale. The aircraft design was optimized using a multi-attribute objective function that weighed the climb rate, turn performance, and stall characteristics of the aircraft at the cruise airspeed. Since the aircraft was designed to be remotely piloted, the cruise airspeed was chosen to be approximately 25% greater than the minimum thrust airspeed. This allowed the aircraft to cruise at an airspeed that was comfortable higher than the stall airspeed. To set the aircraft roll stability, the aircraft incorporates 10 degrees of polyhedral into the outboard section of the wing. The size and angle of the “inverted vee” tail is designed to achieve a static margin of 30 (using the average wing chord as a scaling length) and a yawing moment coefficient of 0.1. Flaps are included to slow the aircraft for descent and landing.
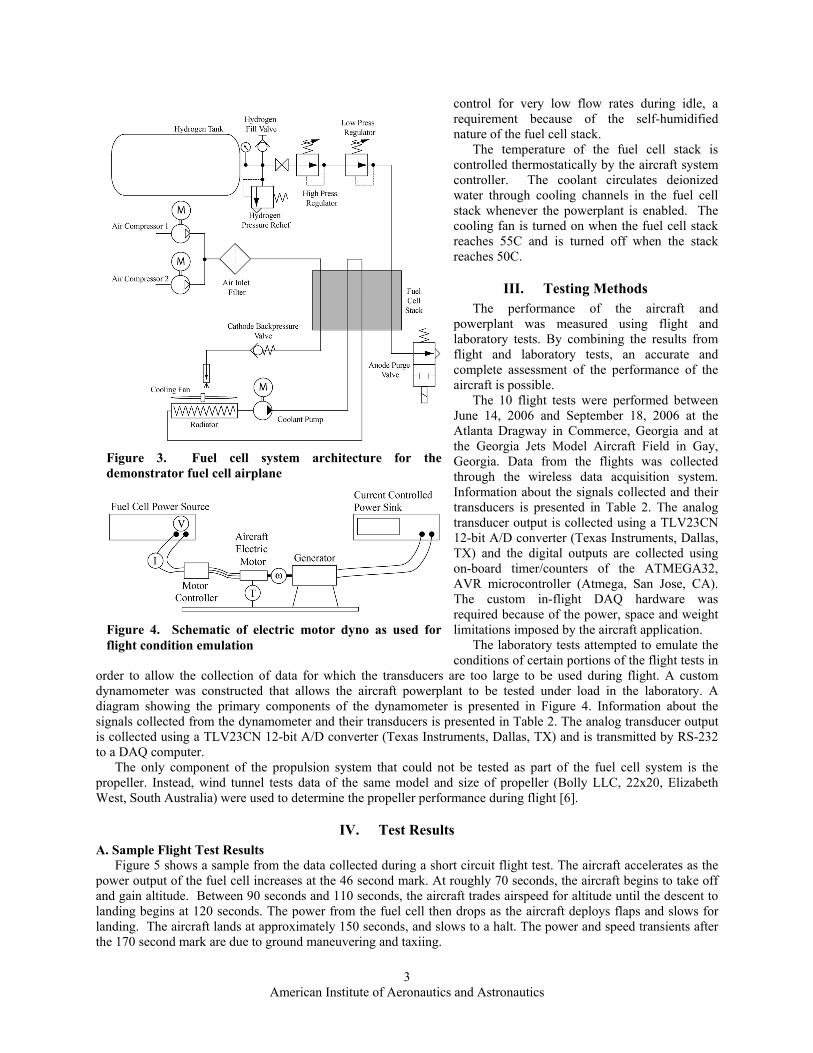
The fuel cell and balance of plant systems generate electricity to power the aircraft from stored gaseous hydrogen and atmospheric oxygen. A diagram of the components of the fuel cell and balance of plant systems is shown in Figure 3. The fuel cell stack is made up of 32 polymer electrolyte membrane cells. The bipolar plates and membranes are manufactured by BCS Fuel Cells (Bryan, TX). Since the stack is self-humidifying, the balance of plant performs only hydrogen storage, hydrogen pressure control, hydrogen flow control, air pressure control, air flow control, and thermal control functions. Only the hydrogen flow control (through anode purge), air flow control (through compressor speeds) and thermal control (through fan and water pump state) are actively controlled. The hydrogen pressure and air pressure are controlled using passive regulators.
The excess hydrogen flow rate is controlled by the anode purge valve. The purge valve is a normally-closed solenoid valve that is controlled based on the fuel cell manufacturer’s recommendations. Anode purge is required to remove inert gases, liquid water and contaminants from the fuel cell anode.
The air flow rate is controlled by controlling the speed of two positive-displacement diaphragm compressors. Two compressors are required to allow one of the compressors to be turned off for low flow conditions and to be turned on for high flow conditions. This allows the balance of plant to
Figure 1. Georgia Institute of Technology demonstrator fuel cell airplane in flight
Table 1. Summary of demonstrator fuel cell airplane characteristics
Design Specification Value
Wing Area 188 dm2 Aspect Ratio 23 Span 6.58 m Taper Ratio 0.67 Taper Change Point 0.625 Outer Panel Washout 4 deg Tail Area 45.5 dm2 Length (nose to tail) 2.38 m Mass 16.4 kg Propeller Diameter 55.9 cm Propeller Pitch 50.8 cm Design Cruise Airspeed 14.5 m/s Fuel Cell Nominal Power 500 W Fuel Cell Specific Power 52 W/kg Fuel Cell Specific Energy 7.1 Wh/kg
Figure 2. System diagram showing power and communication between modules
American Institute of Aeronautics and Astronautics
3
control for very low flow rates during idle, a requirement because of the self-humidified nature of the fuel cell stack.
The temperature of the fuel cell stack is controlled thermostatically by the aircraft system controller. The coolant circulates deionized water through cooling channels in the fuel cell stack whenever the powerplant is enabled. The cooling fan is turned on when the fuel cell stack reaches 55C and is turned off when the stack reaches 50C.
III. Testing Methods The performance of the aircraft and
powerplant was measured using flight and laboratory tests. By combining the results from flight and laboratory tests, an accurate and complete assessment of the performance of the aircraft is possible.
The 10 flight tests were performed between June 14, 2006 and September 18, 2006 at the Atlanta Dragway in Commerce, Georgia and at the Georgia Jets Model Aircraft Field in Gay, Georgia. Data from the flights was collected through the wireless data acquisition system. Information about the signals collected and their transducers is presented in Table 2. The analog transducer output is collected using a TLV23CN 12-bit A/D converter (Texas Instruments, Dallas, TX) and the digital outputs are collected using on-board timer/counters of the ATMEGA32, AVR microcontroller (Atmega, San Jose, CA). The custom in-flight DAQ hardware was required because of the power, space and weight limitations imposed by the aircraft application.
The laboratory tests attempted to emulate the conditions of certain portions of the flight tests in
order to allow the collection of data for which the transducers are too large to be used during flight. A custom dynamometer was constructed that allows the aircraft powerplant to be tested under load in the laboratory. A diagram showing the primary components of the dynamometer is presented in Figure 4. Information about the signals collected from the dynamometer and their transducers is presented in Table 2. The analog transducer output is collected using a TLV23CN 12-bit A/D converter (Texas Instruments, Dallas, TX) and is transmitted by RS-232 to a DAQ computer.
The only component of the propulsion system that could not be tested as part of the fuel cell system is the propeller. Instead, wind tunnel tests data of the same model and size of propeller (Bolly LLC, 22x20, Elizabeth West, South Australia) were used to determine the propeller performance during flight [6].
IV. Test Results A. Sample Flight Test Results
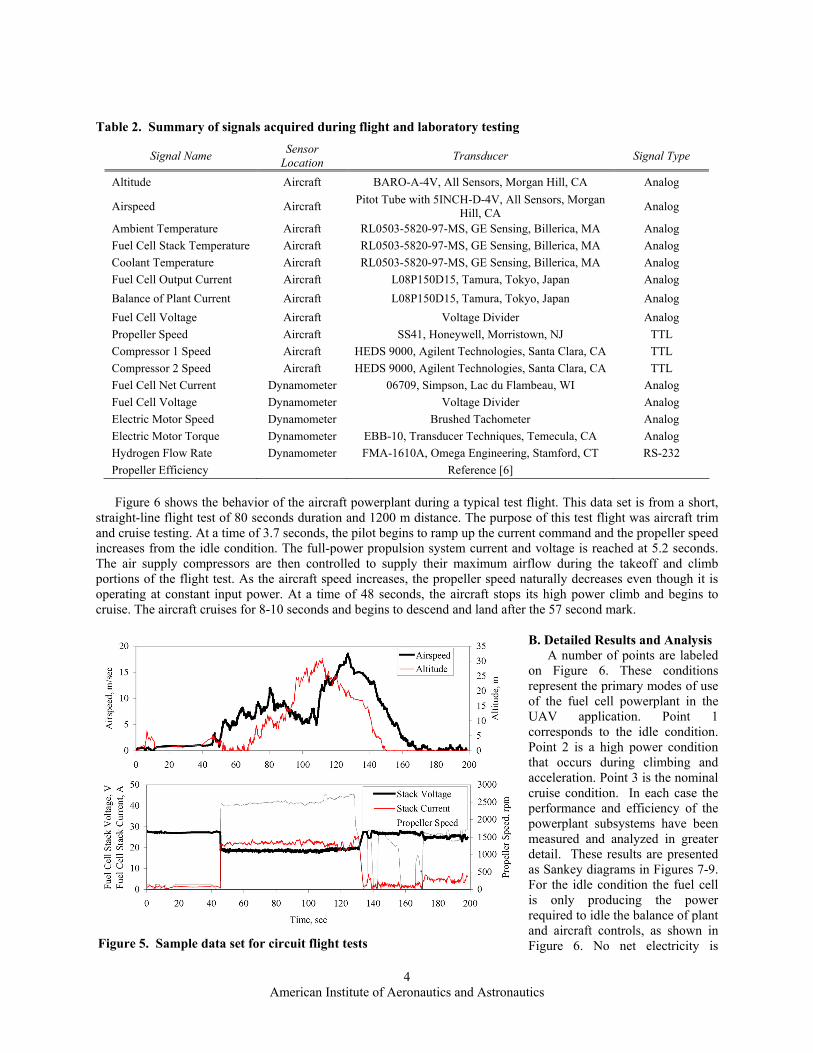
Figure 5 shows a sample from the data collected during a short circuit flight test. The aircraft accelerates as the power output of the fuel cell increases at the 46 second mark. At roughly 70 seconds, the aircraft begins to take off and gain altitude. Between 90 seconds and 110 seconds, the aircraft trades airspeed for altitude until the descent to landing begins at 120 seconds. The power from the fuel cell then drops as the aircraft deploys flaps and slows for landing. The aircraft lands at approximately 150 seconds, and slows to a halt. The power and speed transients after the 170 second mark are due to ground maneuvering and taxiing.
Figure 3. Fuel cell system architecture for the demonstrator fuel cell airplane
Figure 4. Schematic of electric motor dyno as used for flight condition emulation
American Institute of Aeronautics and Astronautics
4
Table 2. Summary of signals acquired during flight and laboratory testing
Signal Name Sensor Location Transducer Signal Type
Altitude Aircraft BARO-A-4V, All Sensors, Morgan Hill, CA Analog
Airspeed Aircraft Pitot Tube with 5INCH-D-4V, All Sensors, Morgan Hill, CA Analog
Ambient Temperature Aircraft RL0503-5820-97-MS, GE Sensing, Billerica, MA Analog Fuel Cell Stack Temperature Aircraft RL0503-5820-97-MS, GE Sensing, Billerica, MA Analog Coolant Temperature Aircraft RL0503-5820-97-MS, GE Sensing, Billerica, MA Analog Fuel Cell Output Current Aircraft L08P150D15, Tamura, Tokyo, Japan Analog Balance of Plant Current Aircraft L08P150D15, Tamura, Tokyo, Japan Analog Fuel Cell Voltage Aircraft Voltage Divider Analog Propeller Speed Aircraft SS41, Honeywell, Morristown, NJ TTL Compressor 1 Speed Aircraft HEDS 9000, Agilent Technologies, Santa Clara, CA TTL Compressor 2 Speed Aircraft HEDS 9000, Agilent Technologies, Santa Clara, CA TTL Fuel Cell Net Current Dynamometer 06709, Simpson, Lac du Flambeau, WI Analog Fuel Cell Voltage Dynamometer Voltage Divider Analog Electric Motor Speed Dynamometer Brushed Tachometer Analog Electric Motor Torque Dynamometer EBB-10, Transducer Techniques, Temecula, CA Analog Hydrogen Flow Rate Dynamometer FMA-1610A, Omega Engineering, Stamford, CT RS-232 Propeller Efficiency Reference [6] Figure 6 shows the behavior of the aircraft powerplant during a typical test flight. This data set is from a short,
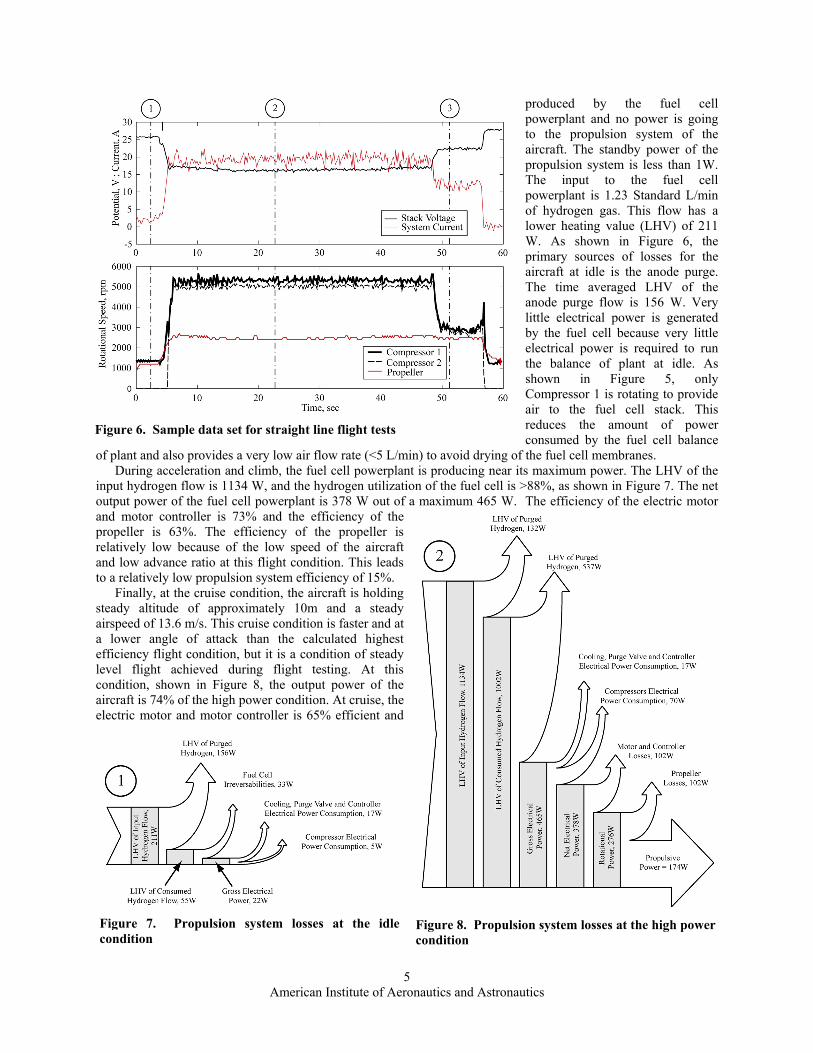
straight-line flight test of 80 seconds duration and 1200 m distance. The purpose of this test flight was aircraft trim and cruise testing. At a time of 3.7 seconds, the pilot begins to ramp up the current command and the propeller speed increases from the idle condition. The full-power propulsion system current and voltage is reached at 5.2 seconds. The air supply compressors are then controlled to supply their maximum airflow during the takeoff and climb portions of the flight test. As the aircraft speed increases, the propeller speed naturally decreases even though it is operating at constant input power. At a time of 48 seconds, the aircraft stops its high power climb and begins to cruise. The aircraft cruises for 8-10 seconds and begins to descend and land after the 57 second mark.
B. Detailed Results and Analysis
A number of points are labeled on Figure 6. These conditions represent the primary modes of use of the fuel cell powerplant in the UAV application. Point 1 corresponds to the idle condition. Point 2 is a high power condition that occurs during climbing and acceleration. Point 3 is the nominal cruise condition. In each case the performance and efficiency of the powerplant subsystems have been measured and analyzed in greater detail. These results are presented as Sankey diagrams in Figures 7-9. For the idle condition the fuel cell is only producing the power required to idle the balance of plant and aircraft controls, as shown in Figure 6. No net electricity is Figure 5. Sample data set for circuit flight tests
American Institute of Aeronautics and Astronautics
5
produced by the fuel cell powerplant and no power is going to the propulsion system of the aircraft. The standby power of the propulsion system is less than 1W. The input to the fuel cell powerplant is 1.23 Standard L/min of hydrogen gas. This flow has a lower heating value (LHV) of 211 W. As shown in Figure 6, the primary sources of losses for the aircraft at idle is the anode purge. The time averaged LHV of the anode purge flow is 156 W. Very little electrical power is generated by the fuel cell because very little electrical power is required to run the balance of plant at idle. As shown in Figure 5, only Compressor 1 is rotating to provide air to the fuel cell stack. This reduces the amount of power consumed by the fuel cell balance
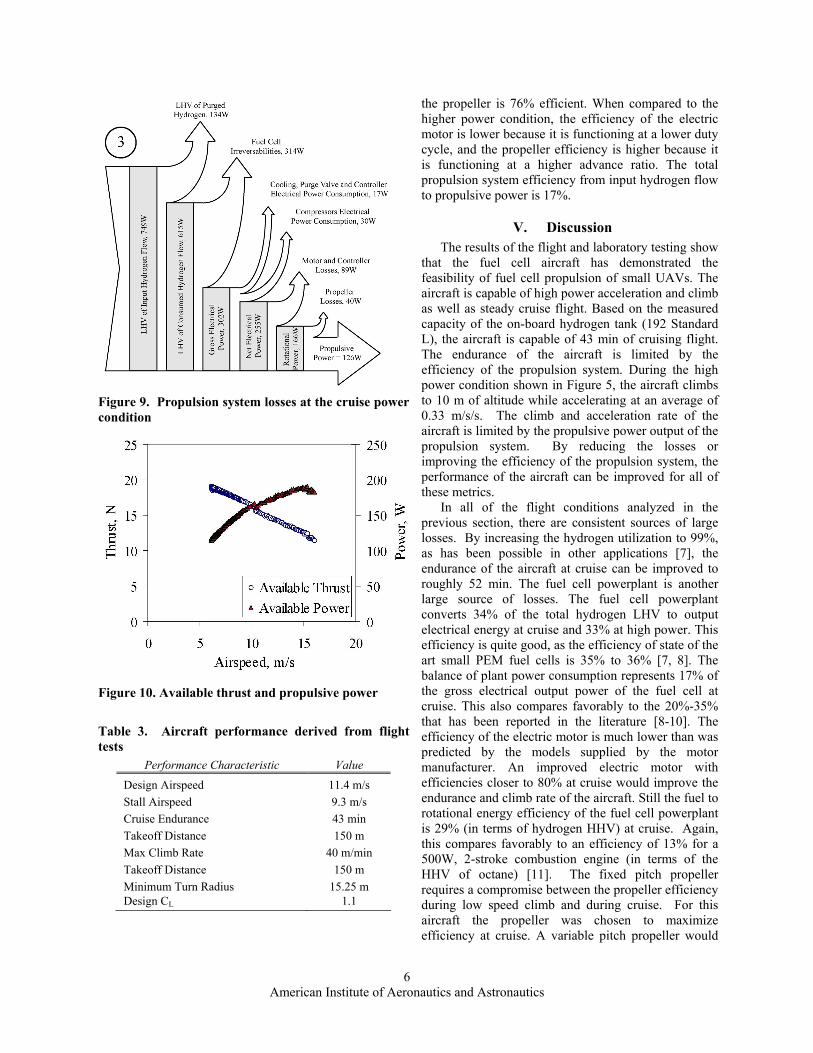
of plant and also provides a very low air flow rate (<5 L/min) to avoid drying of the fuel cell membranes. During acceleration and climb, the fuel cell powerplant is producing near its maximum power. The LHV of the
input hydrogen flow is 1134 W, and the hydrogen utilization of the fuel cell is >88%, as shown in Figure 7. The net output power of the fuel cell powerplant is 378 W out of a maximum 465 W. The efficiency of the electric motor and motor controller is 73% and the efficiency of the propeller is 63%. The efficiency of the propeller is relatively low because of the low speed of the aircraft and low advance ratio at this flight condition. This leads to a relatively low propulsion system efficiency of 15%.
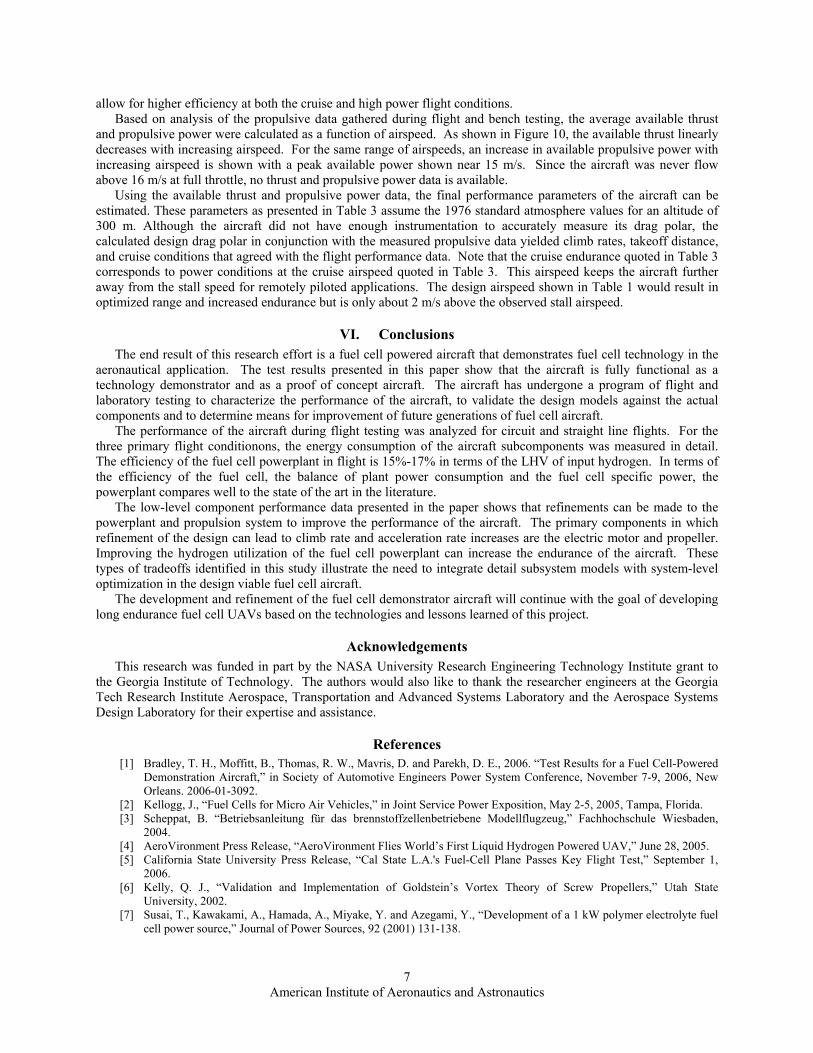
Finally, at the cruise condition, the aircraft is holding steady altitude of approximately 10m and a steady airspeed of 13.6 m/s. This cruise condition is faster and at a lower angle of attack than the calculated highest efficiency flight condition, but it is a condition of steady level flight achieved during flight testing. At this condition, shown in Figure 8, the output power of the aircraft is 74% of the high power condition. At cruise, the electric motor and motor controller is 65% efficient and
Figure 6. Sample data set for straight line flight tests
Figure 8. Propulsion system losses at the high power condition
Figure 7. Propulsion system losses at the idlecondition
American Institute of Aeronautics and Astronautics
6
the propeller is 76% efficient. When compared to the higher power condition, the efficiency of the electric motor is lower because it is functioning at a lower duty cycle, and the propeller efficiency is higher because it is functioning at a higher advance ratio. The total propulsion system efficiency from input hydrogen flow to propulsive power is 17%.
V. Discussion The results of the flight and laboratory testing show
that the fuel cell aircraft has demonstrated the feasibility of fuel cell propulsion of small UAVs. The aircraft is capable of high power acceleration and climb as well as steady cruise flight. Based on the measured capacity of the on-board hydrogen tank (192 Standard L), the aircraft is capable of 43 min of cruising flight. The endurance of the aircraft is limited by the efficiency of the propulsion system. During the high power condition shown in Figure 5, the aircraft climbs to 10 m of altitude while accelerating at an average of 0.33 m/s/s. The climb and acceleration rate of the aircraft is limited by the propulsive power output of the propulsion system. By reducing the losses or improving the efficiency of the propulsion system, the performance of the aircraft can be improved for all of these metrics.
In all of the flight conditions analyzed in the previous section, there are consistent sources of large losses. By increasing the hydrogen utilization to 99%, as has been possible in other applications [7], the endurance of the aircraft at cruise can be improved to roughly 52 min. The fuel cell powerplant is another large source of losses. The fuel cell powerplant converts 34% of the total hydrogen LHV to output electrical energy at cruise and 33% at high power. This efficiency is quite good, as the efficiency of state of the art small PEM fuel cells is 35% to 36% [7, 8]. The balance of plant power consumption represents 17% of the gross electrical output power of the fuel cell at cruise. This also compares favorably to the 20%-35% that has been reported in the literature [8-10]. The efficiency of the electric motor is much lower than was predicted by the models supplied by the motor manufacturer. An improved electric motor with efficiencies closer to 80% at cruise would improve the endurance and climb rate of the aircraft. Still the fuel to rotational energy efficiency of the fuel cell powerplant is 29% (in terms of hydrogen HHV) at cruise. Again, this compares favorably to an efficiency of 13% for a 500W, 2-stroke combustion engine (in terms of the HHV of octane) [11]. The fixed pitch propeller requires a compromise between the propeller efficiency during low speed climb and during cruise. For this aircraft the propeller was chosen to maximize efficiency at cruise. A variable pitch propeller would
Figure 9. Propulsion system losses at the cruise power condition
Figure 10. Available thrust and propulsive power
Table 3. Aircraft performance derived from flight tests
Performance Characteristic Value
Design Airspeed 11.4 m/s Stall Airspeed 9.3 m/s Cruise Endurance 43 min Takeoff Distance 150 m Max Climb Rate 40 m/min Takeoff Distance 150 m Minimum Turn Radius 15.25 m Design CL 1.1
American Institute of Aeronautics and Astronautics
7
allow for higher efficiency at both the cruise and high power flight conditions. Based on analysis of the propulsive data gathered during flight and bench testing, the average available thrust
and propulsive power were calculated as a function of airspeed. As shown in Figure 10, the available thrust linearly decreases with increasing airspeed. For the same range of airspeeds, an increase in available propulsive power with increasing airspeed is shown with a peak available power shown near 15 m/s. Since the aircraft was never flow above 16 m/s at full throttle, no thrust and propulsive power data is available.
Using the available thrust and propulsive power data, the final performance parameters of the aircraft can be estimated. These parameters as presented in Table 3 assume the 1976 standard atmosphere values for an altitude of 300 m. Although the aircraft did not have enough instrumentation to accurately measure its drag polar, the calculated design drag polar in conjunction with the measured propulsive data yielded climb rates, takeoff distance, and cruise conditions that agreed with the flight performance data. Note that the cruise endurance quoted in Table 3 corresponds to power conditions at the cruise airspeed quoted in Table 3. This airspeed keeps the aircraft further away from the stall speed for remotely piloted applications. The design airspeed shown in Table 1 would result in optimized range and increased endurance but is only about 2 m/s above the observed stall airspeed.
VI. Conclusions The end result of this research effort is a fuel cell powered aircraft that demonstrates fuel cell technology in the
aeronautical application. The test results presented in this paper show that the aircraft is fully functional as a technology demonstrator and as a proof of concept aircraft. The aircraft has undergone a program of flight and laboratory testing to characterize the performance of the aircraft, to validate the design models against the actual components and to determine means for improvement of future generations of fuel cell aircraft.
The performance of the aircraft during flight testing was analyzed for circuit and straight line flights. For the three primary flight conditionons, the energy consumption of the aircraft subcomponents was measured in detail. The efficiency of the fuel cell powerplant in flight is 15%-17% in terms of the LHV of input hydrogen. In terms of the efficiency of the fuel cell, the balance of plant power consumption and the fuel cell specific power, the powerplant compares well to the state of the art in the literature.
The low-level component performance data presented in the paper shows that refinements can be made to the powerplant and propulsion system to improve the performance of the aircraft. The primary components in which refinement of the design can lead to climb rate and acceleration rate increases are the electric motor and propeller. Improving the hydrogen utilization of the fuel cell powerplant can increase the endurance of the aircraft. These types of tradeoffs identified in this study illustrate the need to integrate detail subsystem models with system-level optimization in the design viable fuel cell aircraft.
The development and refinement of the fuel cell demonstrator aircraft will continue with the goal of developing long endurance fuel cell UAVs based on the technologies and lessons learned of this project.
Acknowledgements This research was funded in part by the NASA University Research Engineering Technology Institute grant to
the Georgia Institute of Technology. The authors would also like to thank the researcher engineers at the Georgia Tech Research Institute Aerospace, Transportation and Advanced Systems Laboratory and the Aerospace Systems Design Laboratory for their expertise and assistance.
References [1] Bradley, T. H., Moffitt, B., Thomas, R. W., Mavris, D. and Parekh, D. E., 2006. “Test Results for a Fuel Cell-Powered
Demonstration Aircraft,” in Society of Automotive Engineers Power System Conference, November 7-9, 2006, New Orleans. 2006-01-3092.
[2] Kellogg, J., “Fuel Cells for Micro Air Vehicles,” in Joint Service Power Exposition, May 2-5, 2005, Tampa, Florida. [3] Scheppat, B. “Betriebsanleitung für das brennstoffzellenbetriebene Modellflugzeug,” Fachhochschule Wiesbaden,
2004. [4] AeroVironment Press Release, “AeroVironment Flies World’s First Liquid Hydrogen Powered UAV,” June 28, 2005. [5] California State University Press Release, “Cal State L.A.'s Fuel-Cell Plane Passes Key Flight Test,” September 1,
2006. [6] Kelly, Q. J., “Validation and Implementation of Goldstein’s Vortex Theory of Screw Propellers,” Utah State
University, 2002. [7] Susai, T., Kawakami, A., Hamada, A., Miyake, Y. and Azegami, Y., “Development of a 1 kW polymer electrolyte fuel
cell power source,” Journal of Power Sources, 92 (2001) 131-138.

American Institute of Aeronautics and Astronautics
8
[8] Hwang, J. J., Wang, D. Y., Shih, N. C., Lai, D. Y. and Chen, C. K., “Development of fuel-cell-powered electric bicycle,” Journal of Power Sources, 133 (2004) 223-228.
[9] Hou, M., Ming, P., Sun, D., Liu, Y.,Hui, X., Zhang, H. and Yi, B., “The Characteristics of a PEM Fuel Cell Engine with 40kW Vehicle Stacks,” Fuel Cells, 4(1-2) 101-104.
[10] Atwood, P., Gurski, S., Nelson, D. J. and Wipke, K. B., “Degree of Hybridization Modeling of a Fuel Cell Hybrid Electric Sport Utility Vehicle,” in Society of Automotive Engineers 2001 World Congress, March 2001, Detroit. 2001-01-0236.
[11] Cadou, C., Sookdeo, T., Moulton, N. and Leach, T., “Performance scaling and measurement for hydrocarbon-fueled engines with mass less than 1kg” AIAA 2002-3448.