Embed Size (px)
Citation preview
energies
Article
Flicker of Modern Lighting Technologies Due toRapid Voltage Changes
Stefano Lodetti 1 , Izaskun Azcarate 2,* , José Julio Gutiérrez 2 , Luis Alberto Leturiondo 2,Koldo Redondo 2 , Purificación Sáiz 2 , Julio J. Melero 1 and Jorge Bruna 1
1 CIRCE, Universidad de Zaragoza, C/ Mariano Esquillor 15, 50018 Zaragoza, Spain; [email protected] (S.L.);[email protected] (J.J.M.); [email protected] (J.B.)
2 Communications Engineering Department, University of the Basque Country, UPV/EHU, Alameda UrquijoS/N, 48013 Bilbao, Spain; [email protected] (J.J.G.); [email protected] (L.A.L.);[email protected] (K.R.); [email protected] (P.S.)
* Correspondence: [email protected]; Tel.: +34-94-601-8209
Received: 9 January 2019; Accepted: 26 February 2019; Published: 5 March 2019�����������������
Abstract: The purpose of the present paper is to evaluate the sensitivity of modern lightingtechnologies to different types of RVCs. In order to do that, 27 modern lamps—mainly LED—havebeen subjected to real RVCs and their response has been assessed. The detection of RVCs on thegrid has been performed according to the IEC 61000-4-30 detection method, while the response ofthe lamps has been measured with a light flickermeter and characterized using the instantaneousflicker perception, as defined in IEC 61000-4-15. The obtained results show a high dispersion in theresponse of the modern lighting technologies and high values of flicker perception, although with alower sensitivity than the incandescent lamp. The results led the authors to propose the definitionof a new immunity test to be added to the lamp immunity protocol IEC TR-61547-1, to ensure thatnewly produced lamps cause limited irritation to grid users.
Keywords: power quality; rapid voltage changes; flicker; voltage fluctuations; energy-efficientlighting; light flickermeter
1. Introduction
One of the power quality disturbances most easily perceived by grid customers is flicker. Flicker isdefined as the impression of unsteadiness of visual sensation induced by a light stimulus whoseluminance fluctuates with time [1]. The IEC 61000-4-15 standard [2] defines the flicker measurementinstrument, known as IEC flickermeter, which employs a model of a 60 W incandescent lamp as thereference to quantify the irritation produced by voltage fluctuations. The incandescent lamp is alsothe reference of the so-called Pst = 1 curve, which defines the limits of voltage flicker that humansperceive to be irritating [3].
In the last few decades, many countries have been implementing regulations to ban incandescentlamps, encouraging the use of more efficient lighting technologies such as CFL and, mainly,Light Emitting Diodes (LEDs) [4,5]. This change has a direct effect on the power quality. On theone hand, new lighting technologies lead to an increase of the current and voltage distortion inthe grid [6–9]. On the other hand, the replacement of incandescent lamps with more efficientlighting technologies gave rise to poor correlation between measured flicker levels and customerscomplaints [10,11]. To address this latter problem, many researchers worked to develop newinstruments, with the objective of assessing flicker due to modern lighting technologies [12–16].In addition, a lot of effort was put into studying the sensitivity of the new lamps to voltage fluctuations.The very first results indicated that the new lamps were less sensitive to voltage fluctuations than
Energies 2019, 12, 865; doi:10.3390/en12050865 www.mdpi.com/journal/energies
Energies 2019, 12, 865 2 of 16
the incandescent lamps [17,18]. However, as technology evolved, more recent works proved that thisassumption was not always true [19–21]. As a consequence, modern lighting technologies are no longerconsidered a priori immune from flicker [22]. The working group MT1 IEC-TC34, with the supportof IEC-SC77A-WG2, developed an immunity protocol to test the sensitivity of lighting equipmentduring their design stage [23]. Compliance with the protocol guarantees a lower sensitivity to voltagefluctuations for newly produced lamps with respect to the incandescent lamp.
The immunity protocol, as well as most of the studies that led to its publication, were developedconsidering only periodic voltage fluctuations. However, there is not enough evidence about theresponse of modern lighting technologies to voltage changes with an occasional character. RapidVoltage Changes (RVCs) are one of these sudden variations, typically associated with single events,or repetitive events with a very long period e.g., the motor start/stop or the switching of a capacitorbank. RVCs represent a concern for power quality, since they can produce flicker and be disturbingfor power system networks [3]. The interest of scientific community is reflected in recent papersthat studied the characteristics of RVCs [24–26] and their correlation with flicker indices [17,27,28],claiming the necessity of more research and standardization. These efforts led to the publication, in2015, of the last edition of IEC 61000-4-30 [29], which provides a definition and a precise measurementmethod for the detection and characterization of RVCs.
The present study tackles the aforementioned issues by evaluating the sensitivity of modernlighting technologies to different types of RVCs, continuing the work started by the authors in [30].The study is based on real RVCs measured in the grid and a large set of commercially available modernlamps. The work is focused on the experimental assessment of the behavior of lighting technologiesin real scenarios, without using a market-based approach to study the differences between lightingbrands. The paper is structured as follows: Section 2 characterizes RVCs and their relationship withflicker using simulated voltage waveforms, while Section 3 describes the experimental setup neededto study the luminous output of the lamps subjected to the RVC events. Section 4, then, presents theresults of the measurement campaign. In Section 5, the results are discussed and, lastly, in Section 6,the conclusions are presented.
2. Characterization of RVCs and Their Effect on Flicker
In this section, the flicker measurement procedure is briefly described according to theIEC 61000-4-15 standard. Additionally, the standardized RVC measurement method according tothe IEC 61000-4-30 standard is presented. Finally, the parameters that have influence on flicker arediscussed through the simulation of the most common RVC types.
2.1. Flicker Measurement Method
The IEC 61000-4-15 standard establishes the functional and design specifications to measureand control the flicker produced by the voltage fluctuations present in the grid. Using the voltagesignal as the input, the measurement procedure reproduces the response of the human vision system,precisely characterizing the real flicker perception. Based on several physiological experiments [31–33],the IEC flickermeter defines a lamp-eye–brain model, taking the incandescent lamp as the reference,and provides the instantaneous flicker perception, Pinst, at the model’s output. Pinst is given inperceptibility units, where a unit value defines the reference human flicker perceptibility threshold,which means that such level of flicker would be perceived by 50% of the population [34]. However,this perception does not mean irritation and, therefore, cannot be directly related to customerscomplaints. In order to represent the irritation, the IEC flickermeter integrates the flicker perceptionPinst over two different observation intervals—10 min and 2 h—providing the short-term flicker severityPst and the long-term flicker severity Plt, respectively. Fluctuations producing values lying on thecurve Pst = 1 are considered the borderline of irritation.
Energies 2019, 12, 865 3 of 16
2.2. RVC Measurement Method
A precise standard measurement method for RVCs has been introduced in the last edition ofIEC 61000-4-30, describing the detection and the evaluation of RVCs. The procedure is based onthe calculation of Urms(1/2), the value of the RMS voltage measured over one cycle, commencing at afundamental zero crossing, and refreshed each half-cycle. This value is used to establish whether theRMS voltage is in a steady-state condition or not, comparing its current value with its arithmetic meanover the last 100 cycles. If the difference is larger than a certain threshold, the steady-state conditionis not met (the threshold is typically 1–6%, set by the user). Every time the Urms(1/2) signal leaves thesteady-state condition, an RVC event is detected. The evaluation of the RVC characteristics is donecalculating its start time, duration and amplitude, according to the standard. If a voltage dip/swell,with amplitudes above the 10% limit, is detected during an RVC event, the RVC event is discarded.
Different international standards, among which is the EN 50160 standard and its 2015amendment [35,36], establish that, under normal operating conditions, an RVC in Low Voltage (LV)distribution networks does not exceed 5% of the nominal voltage. In the EN 50160 standard, limits aredefined for their occurrence, allowing a maximum number of 24 RVCs per day, exceeding the5% amplitude.
2.3. Flicker Due to RVCs
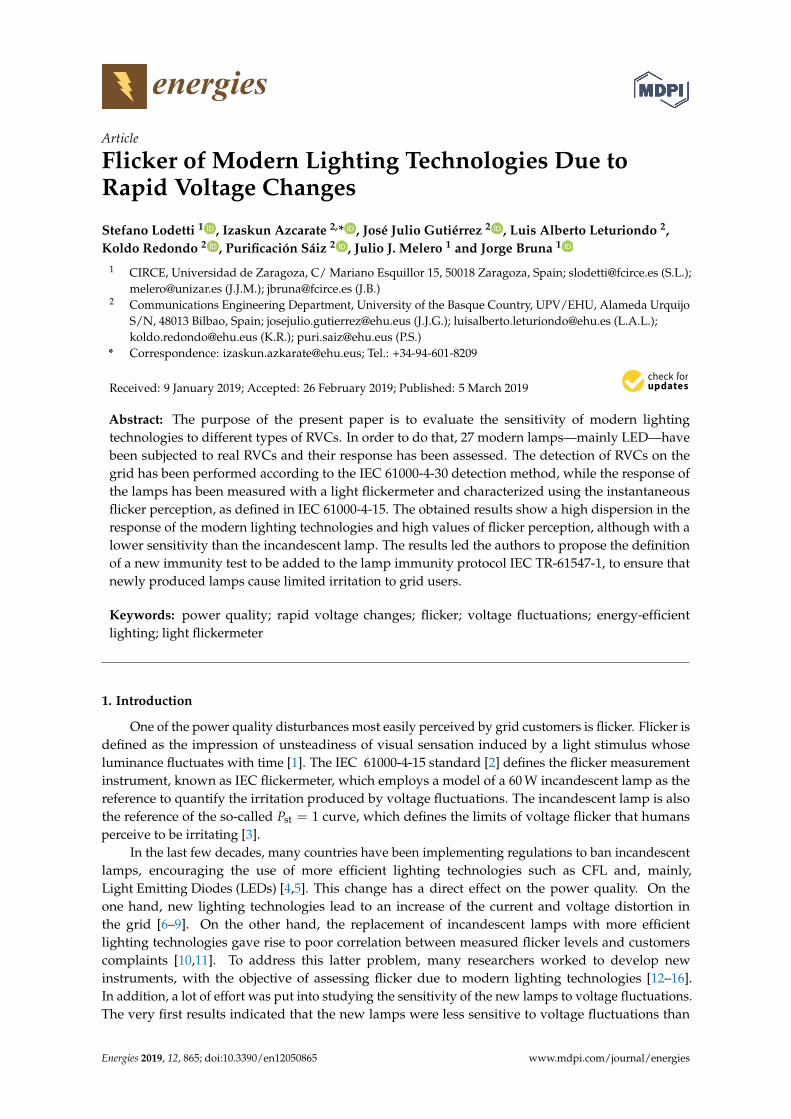
Several types of RVCs can appear in the grid, with different shapes and associated with differentevents. In [28], a classification of the most common types is suggested, considering two maincharacteristics: the RVC shape (ramp or motor type) and the rate of change of the RMS voltage, which canbe instantaneous or gradual. This leads to four categories, depicted in the top graphs of Figure 1a–d,which have then been used in the present study to classify the detected RVCs. Moreover, Figure 1eshows a special case of two consecutive instantaneous ramp RVCs, which is worth discussing.
The flicker severity index Pst is not suitable for the assessment of the RVC effect on flicker [17,27,28].The calculation of Pst involves the integration over 10 min of the Pinst values, and was conceived tofocus on periodic and constant behaviors, while discarding sudden events. However, the effect ofRVCs on the flicker perception has, as a matter of fact, a sudden nature with a very short durationwhich cannot be reflected in the Pst index. The most effective approach for the evaluation of the visualsensation caused by RVCs is through the maximum value of the instantaneous flicker perceptionPinst max [24].
Figure 1 shows simulated RMS voltage signals for the aforementioned RVC categories, along withthe corresponding Pinst curves, obtained with the standard IEC flickermeter. These curves representthe response of the incandescent lamp and can be used to extract its qualitative behavior. Figure 1aillustrates the effect of the RVC amplitude on flicker perception. It can be seen that RVCs with largeramplitude give rise to Pinst whose maximum (Pinst max) is higher i.e., more visible flicker. It mustbe noted that, while the rise of the Pinst curve depends on the change in the RMS voltage, its fall isdetermined by the memory effect of the eye–brain model function. The Pinst curves have thereforealways the same fall profile. Moreover, from Figure 1b, it can be observed how, for the same amplitude,the faster the steady-state level is recovered, the less the flicker is visible. This is due to the integrationtime needed by the human eye–brain system to perceive the change in illuminance: if the transitionis not long enough for the eye to fully integrate the illuminance variation effect, a less visible flickerwill be perceived. Figure 1c, on the other hand, shows the effect of the rate of change of the RMSvoltage. For the same amplitude, a smaller rate of change causes a smaller value of Pinst max, which alsoneeds more time to be reached. Figure 1d shows summation effects: the Pinst curve has a peak foreach change experienced by the RMS voltage. Lastly, Figure 1e illustrates the effect of two consecutiveinstantaneous ramp RVCs, one downwards and one upwards. If there is enough separation betweenthe two voltage changes, the effects on Pinst are separated, while if the two transitions are close enough,the effects sum up, resulting in a higher value of Pinst max for the same RVC amplitude values. From theanalysis of these simulated waveforms, it can be concluded that Pinst is a suitable index to study the
Energies 2019, 12, 865 4 of 16
effect of RVCs on flicker perception and that the RVC amplitude, although being the most important,is not the only parameter affecting the visibility of flicker.
PSfrag replacements
Time
Pin
stR
MS
volta
ge
(a) Instantaneous Ramp
PSfrag replacements
TimeP
inst
RM
Svo
ltage
(b) Instantaneous Motor Start
PSfrag replacements
Time
Pin
stR
MS
volta
ge
(c) Gradual Ramp
PSfrag replacements
Time
Pin
stR
MS
volta
ge
(d) Gradual Motor Start
PSfrag replacements
Time
Pin
stR
MS
volta
ge
(e) Consecutive Inst. Ramp
Figure 1. RVC types according to [28]: (a) instantaneous ramp; (b) instantaneous motor start; (c) gradualramp; (d) gradual motor start; and (e) two consecutive instantaneous ramp RVCs. The top graphs showthe RMS voltage, while the bottom graphs the Pinst obtained with the IEC flickermeter. The differentcolor lines illustrate how the RVC parameters (amplitude (red), voltage recovery time (blue), durationand rate of change (green)) affect the Pinst.
Energies 2019, 12, 865 5 of 16
3. Materials and Methods
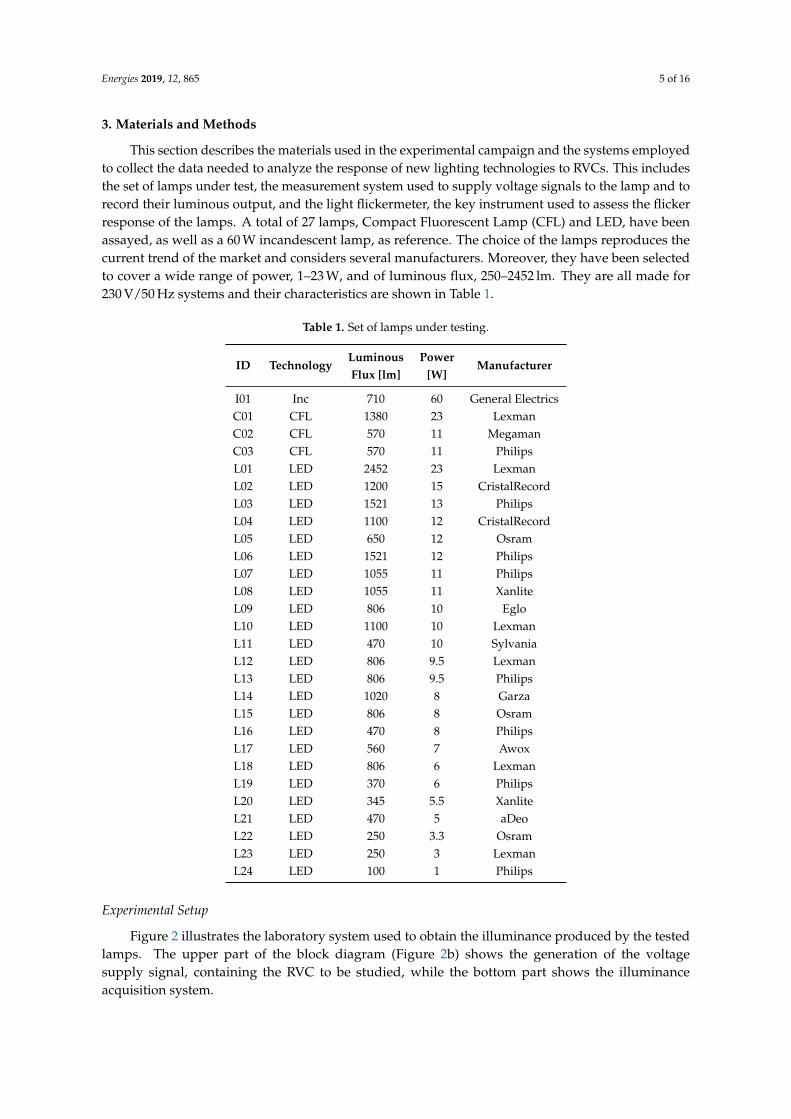
This section describes the materials used in the experimental campaign and the systems employedto collect the data needed to analyze the response of new lighting technologies to RVCs. This includesthe set of lamps under test, the measurement system used to supply voltage signals to the lamp and torecord their luminous output, and the light flickermeter, the key instrument used to assess the flickerresponse of the lamps. A total of 27 lamps, Compact Fluorescent Lamp (CFL) and LED, have beenassayed, as well as a 60 W incandescent lamp, as reference. The choice of the lamps reproduces thecurrent trend of the market and considers several manufacturers. Moreover, they have been selectedto cover a wide range of power, 1–23 W, and of luminous flux, 250–2452 lm. They are all made for230 V/50 Hz systems and their characteristics are shown in Table 1.
Table 1. Set of lamps under testing.
ID TechnologyLuminous Power
ManufacturerFlux [lm] [W]
I01 Inc 710 60 General ElectricsC01 CFL 1380 23 LexmanC02 CFL 570 11 MegamanC03 CFL 570 11 PhilipsL01 LED 2452 23 LexmanL02 LED 1200 15 CristalRecordL03 LED 1521 13 PhilipsL04 LED 1100 12 CristalRecordL05 LED 650 12 OsramL06 LED 1521 12 PhilipsL07 LED 1055 11 PhilipsL08 LED 1055 11 XanliteL09 LED 806 10 EgloL10 LED 1100 10 LexmanL11 LED 470 10 SylvaniaL12 LED 806 9.5 LexmanL13 LED 806 9.5 PhilipsL14 LED 1020 8 GarzaL15 LED 806 8 OsramL16 LED 470 8 PhilipsL17 LED 560 7 AwoxL18 LED 806 6 LexmanL19 LED 370 6 PhilipsL20 LED 345 5.5 XanliteL21 LED 470 5 aDeoL22 LED 250 3.3 OsramL23 LED 250 3 LexmanL24 LED 100 1 Philips
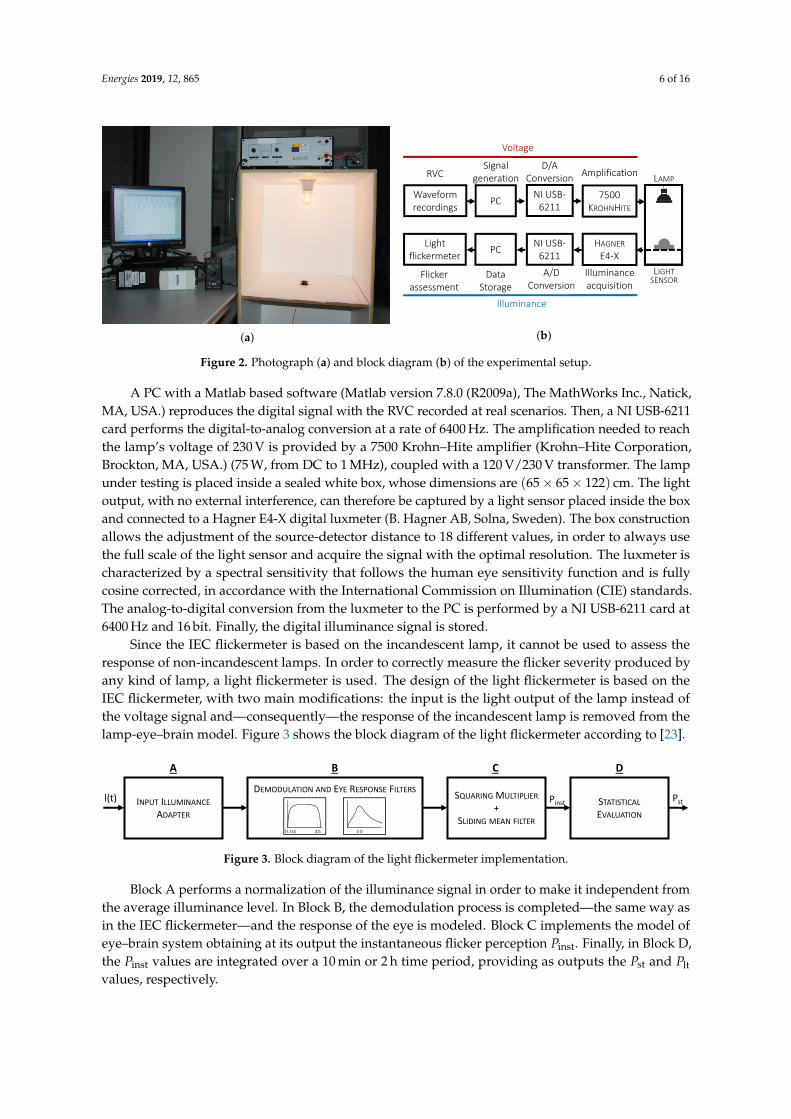
Experimental Setup
Figure 2 illustrates the laboratory system used to obtain the illuminance produced by the testedlamps. The upper part of the block diagram (Figure 2b) shows the generation of the voltagesupply signal, containing the RVC to be studied, while the bottom part shows the illuminanceacquisition system.
Energies 2019, 12, 865 6 of 16
(a)
PCNI USB-
62117500
KROHNHITE
LIGHTSENSOR
LAMP
Voltage
Signal generation
D/A Conversion Amplification
PC NI USB-6211
HAGNERE4-X
Data Storage
A/D Conversion
Illuminance acquisition
Illuminance
Paper 2
Waveform recordings
Light flickermeter
Flicker assessment
RVC
(b)
Figure 2. Photograph (a) and block diagram (b) of the experimental setup.
A PC with a Matlab based software (Matlab version 7.8.0 (R2009a), The MathWorks Inc., Natick,MA, USA.) reproduces the digital signal with the RVC recorded at real scenarios. Then, a NI USB-6211card performs the digital-to-analog conversion at a rate of 6400 Hz. The amplification needed to reachthe lamp’s voltage of 230 V is provided by a 7500 Krohn–Hite amplifier (Krohn–Hite Corporation,Brockton, MA, USA.) (75 W, from DC to 1 MHz), coupled with a 120 V/230 V transformer. The lampunder testing is placed inside a sealed white box, whose dimensions are (65 × 65 × 122) cm. The lightoutput, with no external interference, can therefore be captured by a light sensor placed inside the boxand connected to a Hagner E4-X digital luxmeter (B. Hagner AB, Solna, Sweden). The box constructionallows the adjustment of the source-detector distance to 18 different values, in order to always usethe full scale of the light sensor and acquire the signal with the optimal resolution. The luxmeter ischaracterized by a spectral sensitivity that follows the human eye sensitivity function and is fullycosine corrected, in accordance with the International Commission on Illumination (CIE) standards.The analog-to-digital conversion from the luxmeter to the PC is performed by a NI USB-6211 card at6400 Hz and 16 bit. Finally, the digital illuminance signal is stored.
Since the IEC flickermeter is based on the incandescent lamp, it cannot be used to assess theresponse of non-incandescent lamps. In order to correctly measure the flicker severity produced byany kind of lamp, a light flickermeter is used. The design of the light flickermeter is based on theIEC flickermeter, with two main modifications: the input is the light output of the lamp instead ofthe voltage signal and—consequently—the response of the incandescent lamp is removed from thelamp-eye–brain model. Figure 3 shows the block diagram of the light flickermeter according to [23].
SQUARINGMULTIPLIER
+SLIDING MEAN FILTER
DEMODULATION AND EYE RESPONSE FILTERSINPUT ILLUMINANCE
ADAPTERSTATISTICALEVALUATION
Pinst Pstl(t)
A B C D
Figure 3. Block diagram of the light flickermeter implementation.
Block A performs a normalization of the illuminance signal in order to make it independent fromthe average illuminance level. In Block B, the demodulation process is completed—the same way asin the IEC flickermeter—and the response of the eye is modeled. Block C implements the model ofeye–brain system obtaining at its output the instantaneous flicker perception Pinst. Finally, in Block D,the Pinst values are integrated over a 10 min or 2 h time period, providing as outputs the Pst and Pltvalues, respectively.
Energies 2019, 12, 865 7 of 16
The light flickermeter used in the present work is a highly accurate flickermeter, which meets allthe requirements established for the light flickermeter in the IEC TR-61547-1 [23]. Its implementationis further described in [37].
4. Results
This section presents the results of the experimental study on the response of the analyzed lightingtechnologies to RVCs. A selection of voltage signals containing RVCs recorded at real locations on thegrid have been supplied to the tested lamps and their responses have been calculated in terms of theinstantaneous flicker perception. The effect on flicker has then been evaluated.
4.1. Set of Recorded Signals
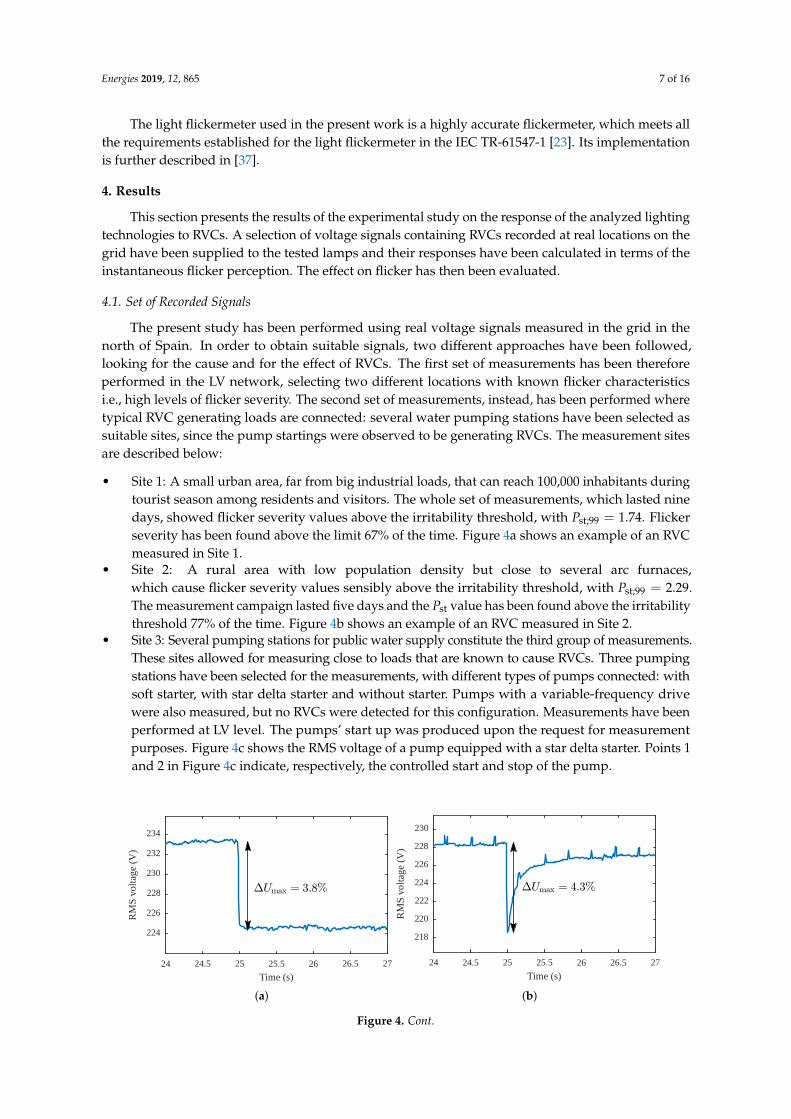
The present study has been performed using real voltage signals measured in the grid in thenorth of Spain. In order to obtain suitable signals, two different approaches have been followed,looking for the cause and for the effect of RVCs. The first set of measurements has been thereforeperformed in the LV network, selecting two different locations with known flicker characteristicsi.e., high levels of flicker severity. The second set of measurements, instead, has been performed wheretypical RVC generating loads are connected: several water pumping stations have been selected assuitable sites, since the pump startings were observed to be generating RVCs. The measurement sitesare described below:
• Site 1: A small urban area, far from big industrial loads, that can reach 100,000 inhabitants duringtourist season among residents and visitors. The whole set of measurements, which lasted ninedays, showed flicker severity values above the irritability threshold, with Pst;99 = 1.74. Flickerseverity has been found above the limit 67% of the time. Figure 4a shows an example of an RVCmeasured in Site 1.
• Site 2: A rural area with low population density but close to several arc furnaces,which cause flicker severity values sensibly above the irritability threshold, with Pst;99 = 2.29.The measurement campaign lasted five days and the Pst value has been found above the irritabilitythreshold 77% of the time. Figure 4b shows an example of an RVC measured in Site 2.
• Site 3: Several pumping stations for public water supply constitute the third group of measurements.These sites allowed for measuring close to loads that are known to cause RVCs. Three pumpingstations have been selected for the measurements, with different types of pumps connected: withsoft starter, with star delta starter and without starter. Pumps with a variable-frequency drivewere also measured, but no RVCs were detected for this configuration. Measurements have beenperformed at LV level. The pumps’ start up was produced upon the request for measurementpurposes. Figure 4c shows the RMS voltage of a pump equipped with a star delta starter. Points 1and 2 in Figure 4c indicate, respectively, the controlled start and stop of the pump.
PSfrag replacements
Time (s)
RM
Svo
ltage
(V)
24 24.5 25 25.5 26 26.5 27
224
226
228
230
232
234
(a)
PSfrag replacements
Time (s)
RM
Svo
ltage
(V)
24 24.5 25 25.5 26 26.5 27
218
220
222
224
226
228
230
(b)
Figure 4. Cont.
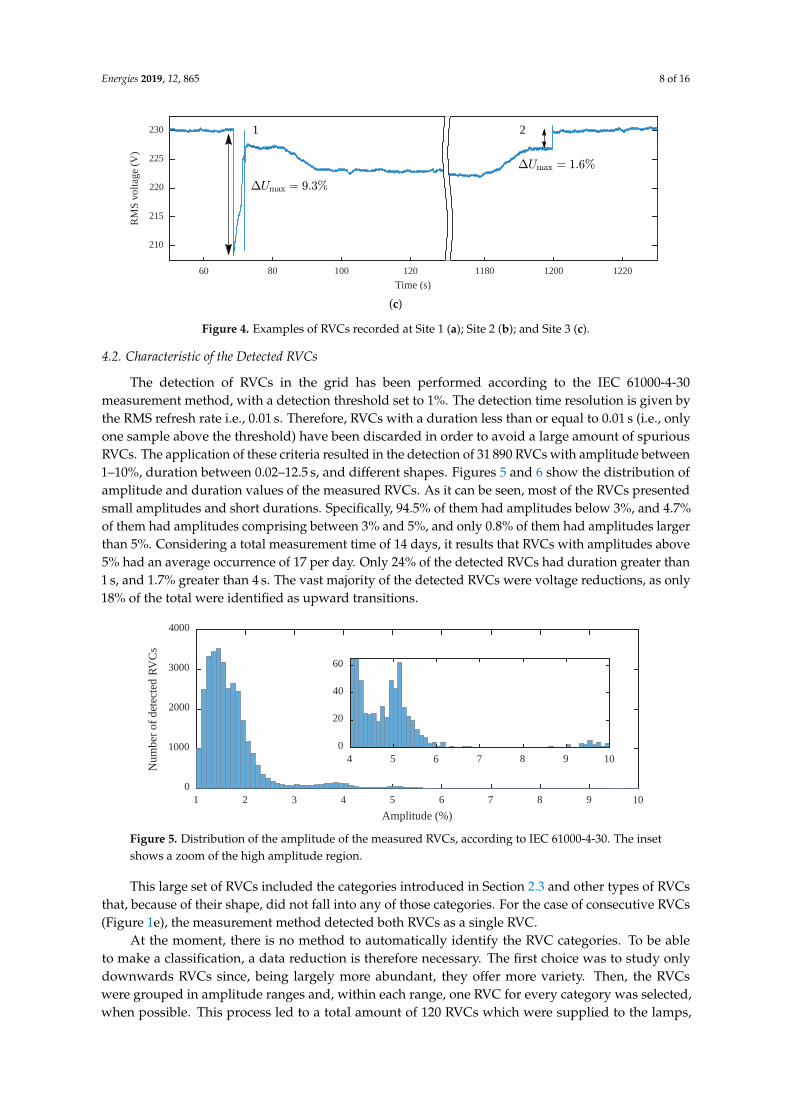
Energies 2019, 12, 865 8 of 16PSfrag replacements
2
12
1
Time (s)
RM
Svo
ltage
(V)
1180 1200 122060 80 100 120
210
215
220
225
230
(c)
Figure 4. Examples of RVCs recorded at Site 1 (a); Site 2 (b); and Site 3 (c).
4.2. Characteristic of the Detected RVCs
The detection of RVCs in the grid has been performed according to the IEC 61000-4-30measurement method, with a detection threshold set to 1%. The detection time resolution is given bythe RMS refresh rate i.e., 0.01 s. Therefore, RVCs with a duration less than or equal to 0.01 s (i.e., onlyone sample above the threshold) have been discarded in order to avoid a large amount of spuriousRVCs. The application of these criteria resulted in the detection of 31 890 RVCs with amplitude between1–10%, duration between 0.02–12.5 s, and different shapes. Figures 5 and 6 show the distribution ofamplitude and duration values of the measured RVCs. As it can be seen, most of the RVCs presentedsmall amplitudes and short durations. Specifically, 94.5% of them had amplitudes below 3%, and 4.7%of them had amplitudes comprising between 3% and 5%, and only 0.8% of them had amplitudes largerthan 5%. Considering a total measurement time of 14 days, it results that RVCs with amplitudes above5% had an average occurrence of 17 per day. Only 24% of the detected RVCs had duration greater than1 s, and 1.7% greater than 4 s. The vast majority of the detected RVCs were voltage reductions, as only18% of the total were identified as upward transitions.
PSfrag replacements
Amplitude (%)
Num
ber
ofde
tect
edR
VC
s
4 5 6 7 8 9 10
1 2 3 4 5 6 7 8 9 10
0
20
40
60
0
1000
2000
3000
4000
Figure 5. Distribution of the amplitude of the measured RVCs, according to IEC 61000-4-30. The insetshows a zoom of the high amplitude region.
This large set of RVCs included the categories introduced in Section 2.3 and other types of RVCsthat, because of their shape, did not fall into any of those categories. For the case of consecutive RVCs(Figure 1e), the measurement method detected both RVCs as a single RVC.
At the moment, there is no method to automatically identify the RVC categories. To be ableto make a classification, a data reduction is therefore necessary. The first choice was to study onlydownwards RVCs since, being largely more abundant, they offer more variety. Then, the RVCswere grouped in amplitude ranges and, within each range, one RVC for every category was selected,when possible. This process led to a total amount of 120 RVCs which were supplied to the lamps,
Energies 2019, 12, 865 9 of 16
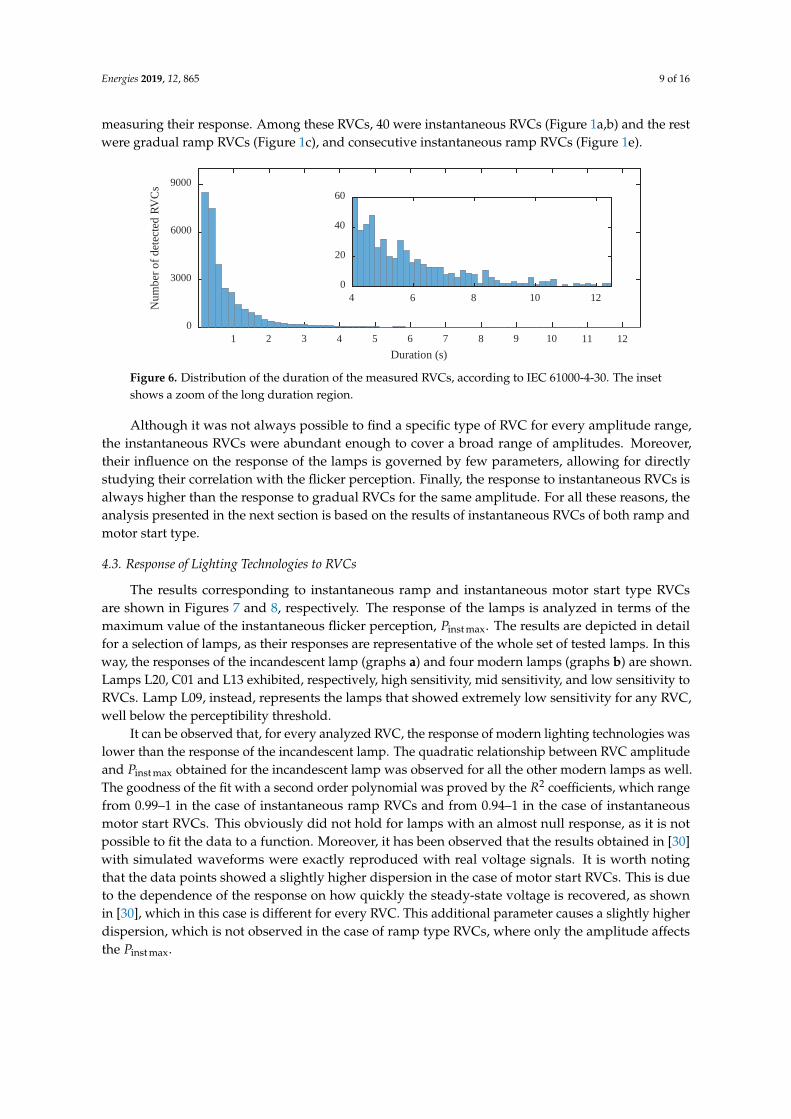
measuring their response. Among these RVCs, 40 were instantaneous RVCs (Figure 1a,b) and the restwere gradual ramp RVCs (Figure 1c), and consecutive instantaneous ramp RVCs (Figure 1e).
PSfrag replacements
Duration (s)
Num
ber
ofde
tect
edR
VC
s
4 6 8 10 12
1 2 3 4 5 6 7 8 9 10 11 12
0
20
40
60
0
3000
6000
9000
Figure 6. Distribution of the duration of the measured RVCs, according to IEC 61000-4-30. The insetshows a zoom of the long duration region.
Although it was not always possible to find a specific type of RVC for every amplitude range,the instantaneous RVCs were abundant enough to cover a broad range of amplitudes. Moreover,their influence on the response of the lamps is governed by few parameters, allowing for directlystudying their correlation with the flicker perception. Finally, the response to instantaneous RVCs isalways higher than the response to gradual RVCs for the same amplitude. For all these reasons, theanalysis presented in the next section is based on the results of instantaneous RVCs of both ramp andmotor start type.
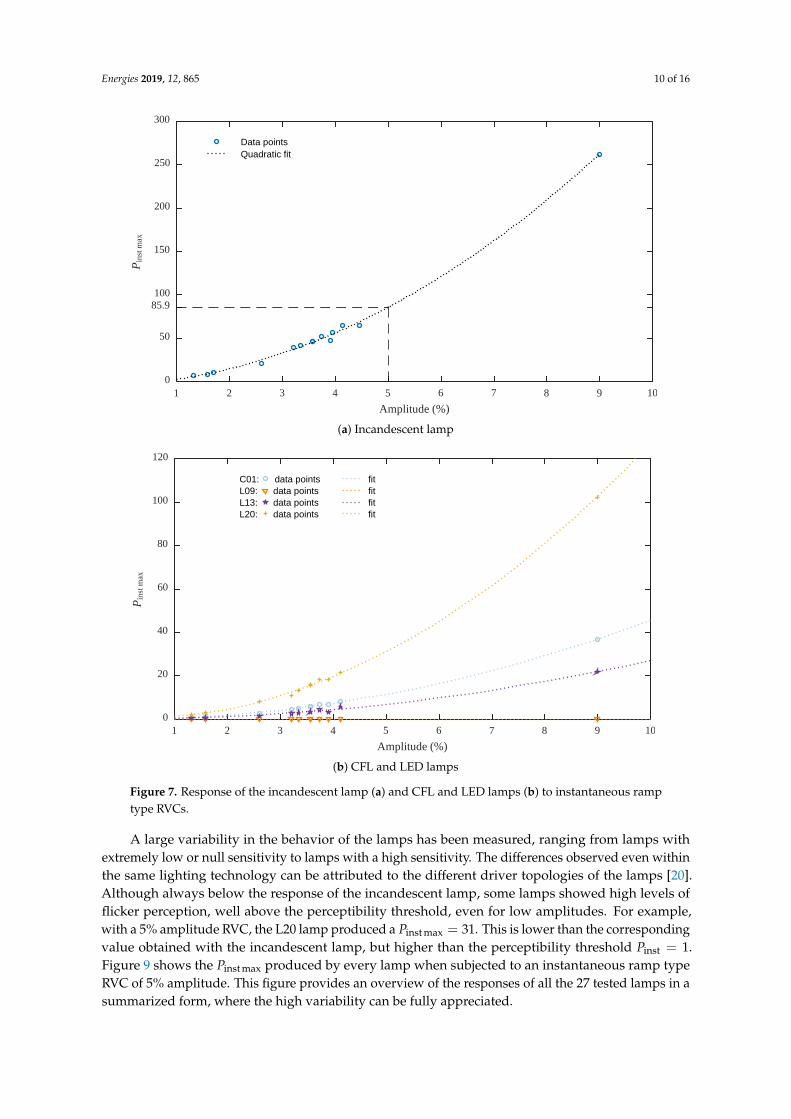
4.3. Response of Lighting Technologies to RVCs
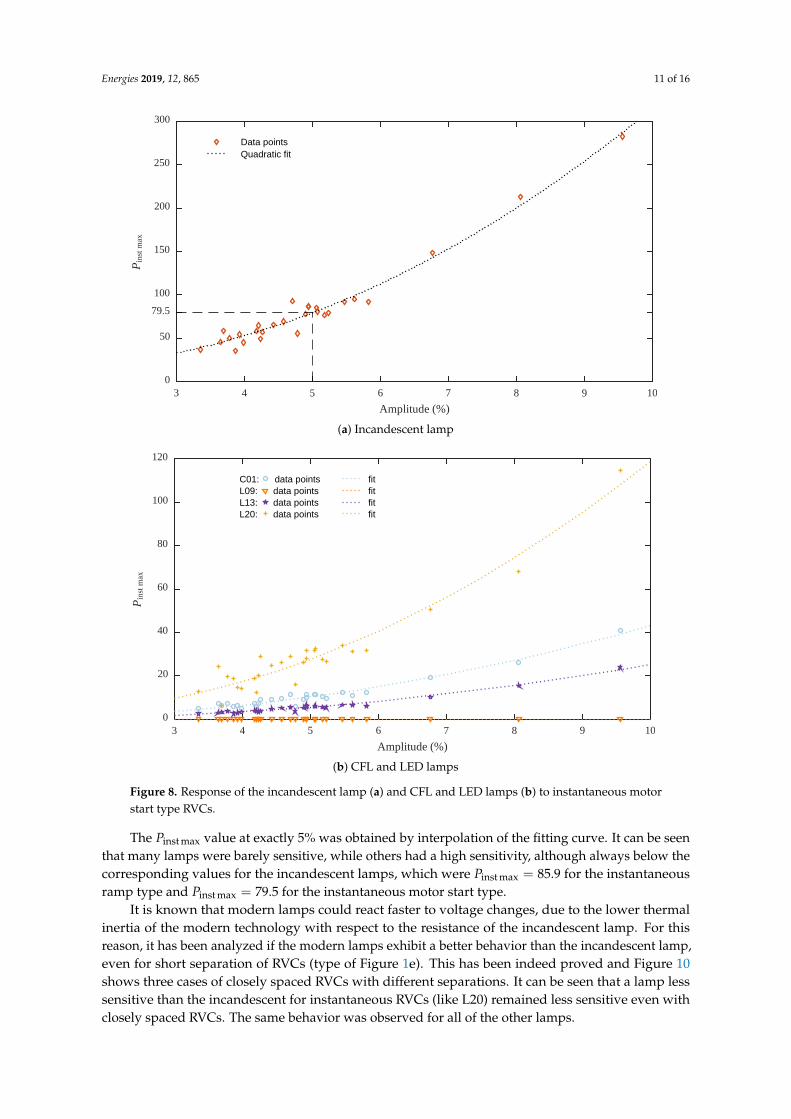
The results corresponding to instantaneous ramp and instantaneous motor start type RVCsare shown in Figures 7 and 8, respectively. The response of the lamps is analyzed in terms of themaximum value of the instantaneous flicker perception, Pinst max. The results are depicted in detailfor a selection of lamps, as their responses are representative of the whole set of tested lamps. In thisway, the responses of the incandescent lamp (graphs a) and four modern lamps (graphs b) are shown.Lamps L20, C01 and L13 exhibited, respectively, high sensitivity, mid sensitivity, and low sensitivity toRVCs. Lamp L09, instead, represents the lamps that showed extremely low sensitivity for any RVC,well below the perceptibility threshold.
It can be observed that, for every analyzed RVC, the response of modern lighting technologies waslower than the response of the incandescent lamp. The quadratic relationship between RVC amplitudeand Pinst max obtained for the incandescent lamp was observed for all the other modern lamps as well.The goodness of the fit with a second order polynomial was proved by the R2 coefficients, which rangefrom 0.99–1 in the case of instantaneous ramp RVCs and from 0.94–1 in the case of instantaneousmotor start RVCs. This obviously did not hold for lamps with an almost null response, as it is notpossible to fit the data to a function. Moreover, it has been observed that the results obtained in [30]with simulated waveforms were exactly reproduced with real voltage signals. It is worth notingthat the data points showed a slightly higher dispersion in the case of motor start RVCs. This is dueto the dependence of the response on how quickly the steady-state voltage is recovered, as shownin [30], which in this case is different for every RVC. This additional parameter causes a slightly higherdispersion, which is not observed in the case of ramp type RVCs, where only the amplitude affectsthe Pinst max.
Energies 2019, 12, 865 10 of 16
Data pointsQuadratic fit
PSfrag replacements
Amplitude (%)
Pin
stm
ax
1 2 3 4 5 6 7 8 9 100
50
85.9100
150
200
250
300
(a) Incandescent lamp
C01: data pointsL09: data pointsL13: data pointsL20: data points
fitfitfitfit
PSfrag replacements
Amplitude (%)
Pin
stm
ax
1 2 3 4 5 6 7 8 9 100
20
40
60
80
100
120
(b) CFL and LED lamps
Figure 7. Response of the incandescent lamp (a) and CFL and LED lamps (b) to instantaneous ramptype RVCs.
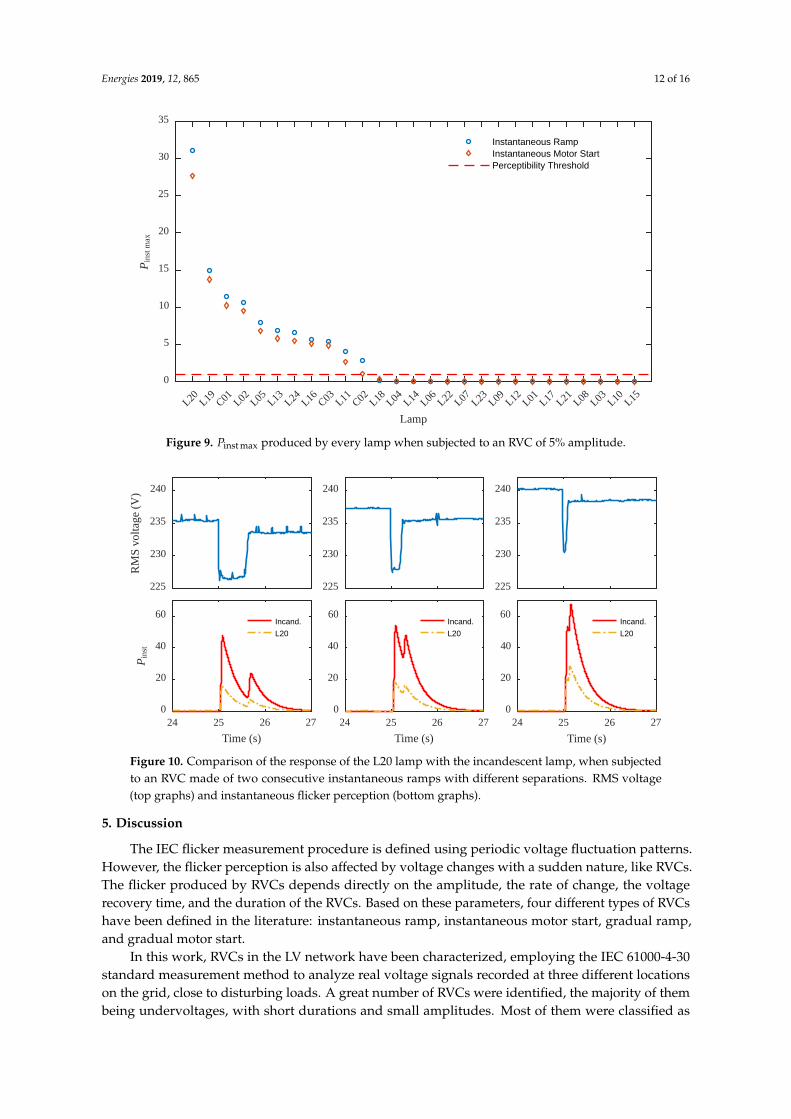
A large variability in the behavior of the lamps has been measured, ranging from lamps withextremely low or null sensitivity to lamps with a high sensitivity. The differences observed even withinthe same lighting technology can be attributed to the different driver topologies of the lamps [20].Although always below the response of the incandescent lamp, some lamps showed high levels offlicker perception, well above the perceptibility threshold, even for low amplitudes. For example,with a 5% amplitude RVC, the L20 lamp produced a Pinst max = 31. This is lower than the correspondingvalue obtained with the incandescent lamp, but higher than the perceptibility threshold Pinst = 1.Figure 9 shows the Pinst max produced by every lamp when subjected to an instantaneous ramp typeRVC of 5% amplitude. This figure provides an overview of the responses of all the 27 tested lamps in asummarized form, where the high variability can be fully appreciated.
Energies 2019, 12, 865 11 of 16
Data pointsQuadratic fit
PSfrag replacements
Amplitude (%)
Pin
stm
ax
3 4 5 6 7 8 9 100
50
79.5
100
150
200
250
300
(a) Incandescent lamp
C01: data pointsL09: data pointsL13: data pointsL20: data points
fitfitfitfit
PSfrag replacements
Amplitude (%)
Pin
stm
ax
3 4 5 6 7 8 9 100
20
40
60
80
100
120
(b) CFL and LED lamps
Figure 8. Response of the incandescent lamp (a) and CFL and LED lamps (b) to instantaneous motorstart type RVCs.
The Pinst max value at exactly 5% was obtained by interpolation of the fitting curve. It can be seenthat many lamps were barely sensitive, while others had a high sensitivity, although always below thecorresponding values for the incandescent lamps, which were Pinst max = 85.9 for the instantaneousramp type and Pinst max = 79.5 for the instantaneous motor start type.
It is known that modern lamps could react faster to voltage changes, due to the lower thermalinertia of the modern technology with respect to the resistance of the incandescent lamp. For thisreason, it has been analyzed if the modern lamps exhibit a better behavior than the incandescent lamp,even for short separation of RVCs (type of Figure 1e). This has been indeed proved and Figure 10shows three cases of closely spaced RVCs with different separations. It can be seen that a lamp lesssensitive than the incandescent for instantaneous RVCs (like L20) remained less sensitive even withclosely spaced RVCs. The same behavior was observed for all of the other lamps.
Energies 2019, 12, 865 12 of 16
Instantaneous RampInstantaneous Motor StartPerceptibility Threshold
PSfrag replacements
Lamp
Pin
stm
ax
L20 L19 C01 L02 L05 L13 L24 L16 C03 L11 C02 L18 L04 L14 L06 L22 L07 L23 L09 L12 L01 L17 L21 L08 L03 L10 L15
0
5
10
15
20
25
30
35
Figure 9. Pinst max produced by every lamp when subjected to an RVC of 5% amplitude.
Incand.
L20
Incand.
L20
Incand.
L20
PSfrag replacements
Time (s)Time (s)Time (s)
Pin
stR
MS
volta
ge(V
)
24 25 26 2724 25 26 2724 25 26 270
20
40
60
225
230
235
240
0
20
40
60
225
230
235
240
0
20
40
60
225
230
235
240
Figure 10. Comparison of the response of the L20 lamp with the incandescent lamp, when subjectedto an RVC made of two consecutive instantaneous ramps with different separations. RMS voltage(top graphs) and instantaneous flicker perception (bottom graphs).
5. Discussion
The IEC flicker measurement procedure is defined using periodic voltage fluctuation patterns.However, the flicker perception is also affected by voltage changes with a sudden nature, like RVCs.The flicker produced by RVCs depends directly on the amplitude, the rate of change, the voltagerecovery time, and the duration of the RVCs. Based on these parameters, four different types of RVCshave been defined in the literature: instantaneous ramp, instantaneous motor start, gradual ramp,and gradual motor start.
In this work, RVCs in the LV network have been characterized, employing the IEC 61000-4-30standard measurement method to analyze real voltage signals recorded at three different locationson the grid, close to disturbing loads. A great number of RVCs were identified, the majority of thembeing undervoltages, with short durations and small amplitudes. Most of them were classified as
Energies 2019, 12, 865 13 of 16
instantaneous RVCs, both ramp and motor start type, while only a small fraction of them presenteda small rate of change (gradual RVCs). In some cases, when two consecutive instantaneous RVCsexhibited a short separation between each other, they were identified by the IEC method as a singleRVC. Finally, the IEC 61000-4-30 procedure also detected RVCs with complex shapes, not belonging toany of the previously discussed types, and more related with typical fluctuations that cause flickerthan with RVCs.
The occasional character and the short-time variation of RVCs cannot be reflected in the Pst index,which is integrated over a much longer interval. Considering the sporadic nature of RVCs, their effecton flicker should be more accurately characterized through the maximum value of the instantaneousflicker perception, Pinst max. Regarding the effect of RVCs on flicker, the most important parameter isthe RVC amplitude, to which the flicker perception shows a quadratic dependence. Moreover, therate of change of the voltage determines that gradual RVCs produces less flicker perception thaninstantaneous RVCs, for the same amplitude. Lastly, it has been observed that the separation betweentwo consecutive RVCs is an additional parameter that determines whether their effect on flicker willbe summed or not.
To analyze the influence of RVCs on the flicker immunity of the lamps, the responses of somecommercially available lamps to different types of RVCs have been studied. The study is not focusedon the technological characteristics of each lamp, but uses the lamps as a tool to analyze the influenceof voltage disturbances on flicker. The analysis of modern lamp responses to RVCs focused oninstantaneous RVCs, as they generate the highest Pinst for the same amplitude among all the identifiedRVC types. This allowed for studying the variability of the response of the lamps to different RVCamplitude values. Although in the case of periodic voltage fluctuations the literature reports cases ofmodern lamps with a higher sensitivity than the incandescent lamp [19–21], in this work, none of thetested lamps resulted more sensitive to RVCs than the incandescent lamp. However, it was observedthat the response of different lamps to RVCs was not uniform, even within the same lighting technology.Some LED lamps, in fact, were practically insensitive to RVCs, while others exhibited a responseclose to the incandescent lamp. Moreover, a significant number of lamps showed Pinst max values wellabove the flicker perceptibility threshold. This proves that some modern lamps could actually produceirritation for users.
The challenge is therefore how to make sure that lamps subjected to RVCs do not produceirritation for grid customers, which, in turn, may cause complaints. In the case of periodic voltagefluctuations, this issue is effectively addressed by the lamp immunity protocol [23], which requiressupplying several periodic voltage fluctuations to the lamp under testing and to measure the Pst
obtained using the light flickermeter. The Pst values produced by the tested lamps must be lowerthan those obtained with the incandescent lamp for the same fluctuations, ensuring a lower irritation.However, this approach is not effective in the case of sudden voltage fluctuations since Pst is not asuitable indicator for such disturbances. In the case of an instantaneous voltage change, like an RVC,the most reasonable approach is to employ the instantaneous flicker perception Pinst to evaluate thelamp responses. According to the results presented in this work, the authors propose completing theimmunity protocol by including an additional test, based on the measurement of Pinst max by means ofthe light flickermeter. This test should be designed to assess the sensitivity of the lamps to RVCs andensure that the irritation remains within the limits of the reference incandescent lamp. Instantaneousramp RVCs are those producing the highest flicker perception among all types. As for the voltage testsignal to be supplied to the lamps, the authors suggest the use of an instantaneous ramp RVC. As forthe amplitude, a 5% value is the most appropriate choice for a test signal. This amplitude value is thecommon feature of the international standards regarding RVCs limits, and limiting RVCs to this valuehas worked well in dealing with incandescent lamps. Therefore, guaranteeing that new lamps have alower sensitivity than the incandescent lamp for 5% amplitude RVCs will effectively limit the irritationto the users.
Energies 2019, 12, 865 14 of 16
Lastly, this work highlighted the importance of the separation of two consecutive RVCs whenit comes to flicker assessment. The influence of this parameter on the produced irritation is still tobe studied, requiring further research and measurements, which will contribute to completing theanalysis of the effect of RVCs on flicker.
6. Conclusions
In this paper, the flicker produced by RVCs in modern lighting technologies has been measuredand studied, using the maximum instantaneous flicker perception as metrics. Modern lightingtechnologies showed lower sensitivity than the incandescent lamp. However, large dispersion andhigh values of flicker perception have been observed. The results led the authors to propose thedefinition of a new RVC immunity test to be added to the lamp immunity protocol IEC TR-61547-1,ensuring that newly produced lamps cause limited irritation to grid users.
Author Contributions: S.L. and I.A. have performed the experimental activity and the data processing; I.A. andJ.J.G. have contributed in the conceptualization and the definition of the methodology of the experiments; S.L.,L.A.L., K.R., P.S. have carried out the data acquisition in the grid; S.L., I.A. and J.J.G. have prepared the first draftof the manuscript; J.J.G., J.J.M. and J.B. have reviewed and edited the manuscript. All the authors have approvedthe submitted version of this manuscript.
Funding: This project has received funding from the European Union’s Horizon 2020 research and innovationprogramme under the Marie Sklodowska-Curie grant agreement No 676042. This work also received financialsupport from the Spanish MINECO through the project DPI2014-53317-R (cofinanced with the European RegionalDevelopment Fund) and from the Basque Government (Basque Country, Spain) through the project IT1087-16.
Conflicts of Interest: The authors declare no conflict of interest.
References
1. International Electrotechnical Vocabulary—Part 614: Generation, Transmission and Distribution ofElectricity—Operation; IEC 60050-614; International Electrotechnical Commission (IEC): Geneva,Switzerland, 2016.
2. Electromagnetic Compatibility (EMC)—Part 4-15: Testing and Measurement Techniques—Flickermeter—Functionaland Design Specifications; IEC 61000-4-15 Ed.2; International Electrotechnical Commission (IEC): Geneva,Switzerland, 2010.
3. Electromagnetic Compatibility (EMC)—Part 3-7: Limits—Assessment of Emission Limits for the Connection ofFluctuating Installations to MV, HV and EHV Power Systems; IEC 61000-3-7; International ElectrotechnicalCommission (IEC): Geneva, Switzerland, 2008.
4. U.S. Department of Energy. Energy Savings Forecast of Solid-State Lighting in General Illumination Applications;Technical Report; U.S. Department of Energy: Washington, DC, USA, 2016.
5. McKinsey & Company Inc. Lighting the Way: Perspectives on the Global Lighting Market, 2nd ed.; TechnicalReport; McKinsey & Company Inc.: New York, NY, USA, 2012.
6. Phannil, N.; Jettanasen, C.; Ngaopitakkul, A. Harmonics and Reduction of Energy Consumption in LightingSystems by Using LED Lamps. Energies 2018, 11, 3169. [CrossRef]
7. Wlas, M.; Galla, S. The influence of LED lighting sources on the nature of power factor. Energies 2018, 11,1479. [CrossRef]
8. Hermoso-Orzáez, M.J.; Gago-Calderón, A.; Rojas-Sola, J.I. Power quality and energy efficiency in thepre-evaluation of an outdoor lighting renewal with light-emitting diode technology: Experimental studyand amortization analysis. Energies 2017, 10, 836. [CrossRef]
9. Bollen, M.H.; Rönnberg, S.K.; Larsson, E.O.A.; Wahlberg, M.; Lundmark, C.M. Harmonic emission frominstallations with energy-efficient lighting. In Proceeding of the International Conference on Electrical PowerQuality and Utilisation, EPQU, Lisbon, Portugal, 17–19 October 2011; pp. 797–802. [CrossRef]
10. Halpin, M.; Cai, R.; De Jaeger, E.; Papic, I.; Perera, S.; Yang, X. A review of flicker objectives related tocomplaints, measurements, and analysis techniques. In Proceeding of the 20th International Conference onElectricity Distribution (CIRED), Prague, Czech Republic, 8–11 June 2009; Number 0755, pp. 1–4. [CrossRef]
Energies 2019, 12, 865 15 of 16
11. Arlt, D.; Stark, M.; Eberlein, C. Examples of International flicker requirements in high voltage networks andreal world measurements. In Proceeding of the International Conference on Electrical Power Quality andUtilisation, EPQU, Barcelona, Spain, 9–11 October 2007. [CrossRef]
12. Gallo, D.; Landi, C.; Pasquino, N. Design and Calibration of an Objective Flickermeter. IEEE Trans. Instrum.Meas. 2006, 55, 2118–2125. [CrossRef]
13. Cai, R.; Cobben, J.; Myrzik, J.M.; Kling, W. Improving Weighting Filter of UIE/IEC Flickermeter - Buildingthe Lamp Model. In Proceeding of the 19th International Conference on Electricity Distribution (CIRED),Vienna, Austria, 21–24 May 2007.
14. Azcarate, I.; Gutierrez, J.J.; Lazkano, A.; Leturiondo, L.A.; Saiz, P.; Redondo, K.; Barros, J. Type Testing of aHighly Accurate Illuminance Flickermeter. In Proceedings of International Conference on Harmonics andQuality of Power, ICHQP, Hong Kong, China, 17–20 June 2012; pp. 897–903. [CrossRef]
15. Hooshyar, A.; El-Saadany, E.F. Development of a flickermeter to measure non-incandescent lamps flicker.IEEE Trans. Power Deliv. 2013, 28, 2103–2115. [CrossRef]
16. Drapela, J.; Langella, R.; Slezingr, J.; Testa, A. A Tunable Flickermeter to Account for Different LampTechnologies. IEEE Trans. Power Deliv. 2016, PP, 1. [CrossRef]
17. CIGRE/CIRED. Review of Flicker Objectives for HV, MV and LV Systems; Final Report CIGRE/CIRED WGC4.108; CIGRE: Paris, France, 2009.
18. Cai, R.; Cobben, J.; Myrzik, J.M.; Blom, J.; Kling, W. Flicker responses of different lamp types. IET Gener.Transm. Distrib. 2009, 3, 816. [CrossRef]
19. Chmielowiec, K. Flicker effect of different type of light sources. In Proceeding of the International Conferenceon Electrical Power Quality and Utilisation, EPQU, Lisbon, Portugal, 17–19 October 2011; pp. 3–8.
20. Drapela, J.; Langella, R.; Testa, A.; Collin, A.J.; Xu, X.; Djokic, S.Z. Experimental evaluation and classificationof LED lamps for light flicker sensitivity. In Proceedings of International Conference on Harmonics andQuality of Power, ICHQP, Ljubljana, Slovenia, 13–16 May 2018. [CrossRef]
21. Azcarate, I.; Gutierrez, J.J.; Lazkano, A.; Saiz, P.; Redondo, K.; Leturiondo, L.A. Experimental Study of theResponse of Efficient Lighting Technologies to Complex Voltage Fluctuations. Int. J. Electr. Power EnergySyst. 2014, 63, 499–506. [CrossRef]
22. Azcarate, I. Tecnologías de Iluminación ante Fluctuaciones de Tensión: Análisis de Sensibilidad y Control deInmunidad. Ph.D. Thesis, Universidad del País Vasco (UPV/EHU), Bilbao, Spain 2016.
23. Equipment for General Lighting Purposes—EMC Immunity Requirements—Part 1: An Objective Light Flickermeterand Voltage Fluctuation Immunity Test Method; IEC TR 61547-1; International Electrotechnical Commission(IEC): Geneva, Switzerland, 2017.
24. Barros, J.; Gutierrez, J.J.; De Apraiz, M.; Saiz, P.; Diego, R.I.; Lazkano, A. Rapid Voltage Changes in PowerSystem Networks and Their Effect on Flicker. IEEE Trans. Power Deliv. 2016, 31, 262–270. [CrossRef]
25. Bollen, M.H.; Hager, M.; Schwaegerl, C. Quantifying voltage variations on a time scale between 3 secondsand 10 minutes. In Proceeding of the 18th International Conference on Electricity Distribution (CIRED),Turin, Italy, 6–9 June 2005. [CrossRef]
26. Halpin, M.; De Jaeger, E. Suggestions for overall EMC co-ordination with regard to rapid voltage changes.In Proceeding of the 20th International Conference on Electricity Distribution (CIRED), Prague, CzechRepublic, 8–11 June 2009.
27. Bollen, M.H.; Gu, I.Y. Characterization of Voltage Variations in the Very-Short Time-Scale. IEEE Trans.Power Deliv. 2005, 20, 1198–1199. [CrossRef]
28. Brekke, K.; Seljeseth, H.; Mogstad, O. Rapid Voltage Changes—Definition and Minimum Requirements.In Proceeding of the 20th International Conference on Electricity Distribution (CIRED), Prague,Czech Republic, 8–11 June 2009. [CrossRef]
29. Electromagnetic Compatibility (EMC)—Part 4-30: Testing and Measurement Techniques—Power QualityMeasurement Methods; IEC 61000-4-30 Ed.3; International Electrotechnical Commission (IEC):Geneva, Switzerland, 2015.
30. Lodetti, S.; Azcarate, I.; Gutierrez, J.J.; Redondo, K.; Saiz, P.; Melero, J.J.; Bruna, J. Sensitivity of ModernLighting Technologies to Rapid Voltage Changes. In Proceedings of International Conference on Harmonicsand Quality of Power, ICHQP, Ljubljana, Slovenia, 13–16 May 2018.
31. Rashbass, C. The visibility of transient changes of luminance. J. Physiol. 1970, 210, 165–186. [CrossRef][PubMed]
Energies 2019, 12, 865 16 of 16
32. De Lange, H. Experiments on flicker and some calculations on an electrical analogue of the foveal systems.Physica 1952, 18, 935–950. [CrossRef]
33. Ailleret, P. Détermination des lois expérimentales du papillotement (flicker) en vue de leur applicationaux réseaux basse tension sur lesquels les charges varient priodiquement ou aléatoirement (soudeusesdémarrages de moteurs). Bulletin de la Société Française des Electriciens 1957, 7, 257–262.
34. UIE. Flicker Measurement and Evaluation; Technical Report; International Union for Electroheat, DisturbancesWG: Paris, France, 1992.
35. Voltage Characteristics of Electricity Supplied by Public Distribution Networks; EN 50160:2010; CENELEC:Brussels, Belgium, 2010.
36. Voltage Characteristics of Electricity Supplied by Public Distribution Networks; EN 50160:2010/A1:2015;CENELEC: Brussels, Belgium, 2015.
37. Gutierrez, J.J.; Beeckman, P.; Azcarate, I. A Protocol to Test The Sensitivity Of Lighting Equipment toVoltage Fluctuations. In Proceeding of the 23rd International Conference on Electricity Distribution (CIRED),Lyon, France, 15–18 June 2015.
© 2019 by the authors. Licensee MDPI, Basel, Switzerland. This article is an open accessarticle distributed under the terms and conditions of the Creative Commons Attribution(CC BY) license (http://creativecommons.org/licenses/by/4.0/).