Embed Size (px)
Citation preview

Package ‘flextable’March 7, 2022
Type Package
Title Functions for Tabular Reporting
Version 0.7.0
Description Create pretty tables for 'HTML', 'PDF', 'Microsoft Word' and 'Microsoft PowerPoint'documents from 'R Markdown'. Functions are provided to let users create tables, modify and for-mattheir content. It also extends package 'officer' that does not contain any feature for customizedtabular reporting.
License GPL-3
Imports stats, utils, grDevices, graphics, officer (>= 0.4.1),rmarkdown, knitr, htmltools, xml2, data.table (>= 1.13.0), uuid(>= 0.1-4), gdtools (>= 0.1.6), rlang, base64enc
RoxygenNote 7.1.2
Suggests testthat (>= 2.1.0), xtable, webshot, magick, ggplot2,scales, broom, mgcv, bookdown, equatags, commonmark,pdftools
Encoding UTF-8
URL https://ardata-fr.github.io/flextable-book/,
https://davidgohel.github.io/flextable/
BugReports https://github.com/davidgohel/flextable/issues
VignetteBuilder knitr
NeedsCompilation no
Author David Gohel [aut, cre],Clementine Jager [ctb],Quentin Fazilleau [ctb],Maxim Nazarov [ctb] (rmarkdown for docx output),Titouan Robert [ctb],Michael Barrowman [ctb] (inline footnotes),Atsushi Yasumoto [ctb] (support for bookdown cross reference),Paul Julian [ctb] (support for gam objects)
Maintainer David Gohel <[email protected]>
Repository CRAN
Date/Publication 2022-03-06 23:20:02 UTC
1

2 R topics documented:
R topics documented:flextable-package . . . . . . . . . . . . . . . . . . . . . . . . . . . . . . . . . . . . . . 4add_body . . . . . . . . . . . . . . . . . . . . . . . . . . . . . . . . . . . . . . . . . . 5add_header . . . . . . . . . . . . . . . . . . . . . . . . . . . . . . . . . . . . . . . . . 6add_header_lines . . . . . . . . . . . . . . . . . . . . . . . . . . . . . . . . . . . . . . 7add_header_row . . . . . . . . . . . . . . . . . . . . . . . . . . . . . . . . . . . . . . . 8add_latex_dep . . . . . . . . . . . . . . . . . . . . . . . . . . . . . . . . . . . . . . . . 9align . . . . . . . . . . . . . . . . . . . . . . . . . . . . . . . . . . . . . . . . . . . . . 9append_chunks . . . . . . . . . . . . . . . . . . . . . . . . . . . . . . . . . . . . . . . 10as_b . . . . . . . . . . . . . . . . . . . . . . . . . . . . . . . . . . . . . . . . . . . . . 12as_bracket . . . . . . . . . . . . . . . . . . . . . . . . . . . . . . . . . . . . . . . . . . 13as_chunk . . . . . . . . . . . . . . . . . . . . . . . . . . . . . . . . . . . . . . . . . . 14as_equation . . . . . . . . . . . . . . . . . . . . . . . . . . . . . . . . . . . . . . . . . 15as_flextable . . . . . . . . . . . . . . . . . . . . . . . . . . . . . . . . . . . . . . . . . 16as_flextable.gam . . . . . . . . . . . . . . . . . . . . . . . . . . . . . . . . . . . . . . 16as_flextable.glm . . . . . . . . . . . . . . . . . . . . . . . . . . . . . . . . . . . . . . . 17as_flextable.grouped_data . . . . . . . . . . . . . . . . . . . . . . . . . . . . . . . . . 18as_flextable.htest . . . . . . . . . . . . . . . . . . . . . . . . . . . . . . . . . . . . . . 19as_flextable.lm . . . . . . . . . . . . . . . . . . . . . . . . . . . . . . . . . . . . . . . 20as_flextable.tabulator . . . . . . . . . . . . . . . . . . . . . . . . . . . . . . . . . . . . 21as_flextable.xtable . . . . . . . . . . . . . . . . . . . . . . . . . . . . . . . . . . . . . 22as_grouped_data . . . . . . . . . . . . . . . . . . . . . . . . . . . . . . . . . . . . . . 24as_highlight . . . . . . . . . . . . . . . . . . . . . . . . . . . . . . . . . . . . . . . . . 25as_i . . . . . . . . . . . . . . . . . . . . . . . . . . . . . . . . . . . . . . . . . . . . . 26as_image . . . . . . . . . . . . . . . . . . . . . . . . . . . . . . . . . . . . . . . . . . 27as_paragraph . . . . . . . . . . . . . . . . . . . . . . . . . . . . . . . . . . . . . . . . 28as_raster . . . . . . . . . . . . . . . . . . . . . . . . . . . . . . . . . . . . . . . . . . . 29as_sub . . . . . . . . . . . . . . . . . . . . . . . . . . . . . . . . . . . . . . . . . . . . 30as_sup . . . . . . . . . . . . . . . . . . . . . . . . . . . . . . . . . . . . . . . . . . . . 31autofit . . . . . . . . . . . . . . . . . . . . . . . . . . . . . . . . . . . . . . . . . . . . 32before . . . . . . . . . . . . . . . . . . . . . . . . . . . . . . . . . . . . . . . . . . . . 33bg . . . . . . . . . . . . . . . . . . . . . . . . . . . . . . . . . . . . . . . . . . . . . . 34body_add_flextable . . . . . . . . . . . . . . . . . . . . . . . . . . . . . . . . . . . . . 35bold . . . . . . . . . . . . . . . . . . . . . . . . . . . . . . . . . . . . . . . . . . . . . 36border_inner . . . . . . . . . . . . . . . . . . . . . . . . . . . . . . . . . . . . . . . . . 37border_inner_h . . . . . . . . . . . . . . . . . . . . . . . . . . . . . . . . . . . . . . . 38border_inner_v . . . . . . . . . . . . . . . . . . . . . . . . . . . . . . . . . . . . . . . 39border_outer . . . . . . . . . . . . . . . . . . . . . . . . . . . . . . . . . . . . . . . . . 40border_remove . . . . . . . . . . . . . . . . . . . . . . . . . . . . . . . . . . . . . . . 41colformat_char . . . . . . . . . . . . . . . . . . . . . . . . . . . . . . . . . . . . . . . 41colformat_date . . . . . . . . . . . . . . . . . . . . . . . . . . . . . . . . . . . . . . . 42colformat_datetime . . . . . . . . . . . . . . . . . . . . . . . . . . . . . . . . . . . . . 44colformat_double . . . . . . . . . . . . . . . . . . . . . . . . . . . . . . . . . . . . . . 45colformat_image . . . . . . . . . . . . . . . . . . . . . . . . . . . . . . . . . . . . . . 46colformat_int . . . . . . . . . . . . . . . . . . . . . . . . . . . . . . . . . . . . . . . . 47colformat_lgl . . . . . . . . . . . . . . . . . . . . . . . . . . . . . . . . . . . . . . . . 48colformat_num . . . . . . . . . . . . . . . . . . . . . . . . . . . . . . . . . . . . . . . 49

R topics documented: 3
color . . . . . . . . . . . . . . . . . . . . . . . . . . . . . . . . . . . . . . . . . . . . . 51colorize . . . . . . . . . . . . . . . . . . . . . . . . . . . . . . . . . . . . . . . . . . . 52compose . . . . . . . . . . . . . . . . . . . . . . . . . . . . . . . . . . . . . . . . . . . 53continuous_summary . . . . . . . . . . . . . . . . . . . . . . . . . . . . . . . . . . . . 54delete_part . . . . . . . . . . . . . . . . . . . . . . . . . . . . . . . . . . . . . . . . . . 55df_printer . . . . . . . . . . . . . . . . . . . . . . . . . . . . . . . . . . . . . . . . . . 55dim.flextable . . . . . . . . . . . . . . . . . . . . . . . . . . . . . . . . . . . . . . . . 56dim_pretty . . . . . . . . . . . . . . . . . . . . . . . . . . . . . . . . . . . . . . . . . . 57empty_blanks . . . . . . . . . . . . . . . . . . . . . . . . . . . . . . . . . . . . . . . . 58fit_to_width . . . . . . . . . . . . . . . . . . . . . . . . . . . . . . . . . . . . . . . . . 59fix_border_issues . . . . . . . . . . . . . . . . . . . . . . . . . . . . . . . . . . . . . . 60flextable . . . . . . . . . . . . . . . . . . . . . . . . . . . . . . . . . . . . . . . . . . . 60flextable_dim . . . . . . . . . . . . . . . . . . . . . . . . . . . . . . . . . . . . . . . . 62flextable_html_dependency . . . . . . . . . . . . . . . . . . . . . . . . . . . . . . . . . 63flextable_to_rmd . . . . . . . . . . . . . . . . . . . . . . . . . . . . . . . . . . . . . . 63fmt_2stats . . . . . . . . . . . . . . . . . . . . . . . . . . . . . . . . . . . . . . . . . . 65font . . . . . . . . . . . . . . . . . . . . . . . . . . . . . . . . . . . . . . . . . . . . . 66fontsize . . . . . . . . . . . . . . . . . . . . . . . . . . . . . . . . . . . . . . . . . . . 67footers_flextable_at_bkm . . . . . . . . . . . . . . . . . . . . . . . . . . . . . . . . . . 68footnote . . . . . . . . . . . . . . . . . . . . . . . . . . . . . . . . . . . . . . . . . . . 68fp_border_default . . . . . . . . . . . . . . . . . . . . . . . . . . . . . . . . . . . . . . 70fp_text_default . . . . . . . . . . . . . . . . . . . . . . . . . . . . . . . . . . . . . . . 70get_flextable_defaults . . . . . . . . . . . . . . . . . . . . . . . . . . . . . . . . . . . . 72gg_chunk . . . . . . . . . . . . . . . . . . . . . . . . . . . . . . . . . . . . . . . . . . 72headers_flextable_at_bkm . . . . . . . . . . . . . . . . . . . . . . . . . . . . . . . . . 73height . . . . . . . . . . . . . . . . . . . . . . . . . . . . . . . . . . . . . . . . . . . . 74highlight . . . . . . . . . . . . . . . . . . . . . . . . . . . . . . . . . . . . . . . . . . . 75hline . . . . . . . . . . . . . . . . . . . . . . . . . . . . . . . . . . . . . . . . . . . . . 76hline_bottom . . . . . . . . . . . . . . . . . . . . . . . . . . . . . . . . . . . . . . . . 77hline_top . . . . . . . . . . . . . . . . . . . . . . . . . . . . . . . . . . . . . . . . . . 78hrule . . . . . . . . . . . . . . . . . . . . . . . . . . . . . . . . . . . . . . . . . . . . . 79htmltools_value . . . . . . . . . . . . . . . . . . . . . . . . . . . . . . . . . . . . . . . 80hyperlink_text . . . . . . . . . . . . . . . . . . . . . . . . . . . . . . . . . . . . . . . . 80italic . . . . . . . . . . . . . . . . . . . . . . . . . . . . . . . . . . . . . . . . . . . . . 81knit_print.flextable . . . . . . . . . . . . . . . . . . . . . . . . . . . . . . . . . . . . . 82linerange . . . . . . . . . . . . . . . . . . . . . . . . . . . . . . . . . . . . . . . . . . 86line_spacing . . . . . . . . . . . . . . . . . . . . . . . . . . . . . . . . . . . . . . . . . 87lollipop . . . . . . . . . . . . . . . . . . . . . . . . . . . . . . . . . . . . . . . . . . . 88merge_at . . . . . . . . . . . . . . . . . . . . . . . . . . . . . . . . . . . . . . . . . . 89merge_h . . . . . . . . . . . . . . . . . . . . . . . . . . . . . . . . . . . . . . . . . . . 90merge_h_range . . . . . . . . . . . . . . . . . . . . . . . . . . . . . . . . . . . . . . . 91merge_none . . . . . . . . . . . . . . . . . . . . . . . . . . . . . . . . . . . . . . . . . 91merge_v . . . . . . . . . . . . . . . . . . . . . . . . . . . . . . . . . . . . . . . . . . . 92minibar . . . . . . . . . . . . . . . . . . . . . . . . . . . . . . . . . . . . . . . . . . . 94ncol_keys . . . . . . . . . . . . . . . . . . . . . . . . . . . . . . . . . . . . . . . . . . 95nrow_part . . . . . . . . . . . . . . . . . . . . . . . . . . . . . . . . . . . . . . . . . . 96padding . . . . . . . . . . . . . . . . . . . . . . . . . . . . . . . . . . . . . . . . . . . 96ph_with.flextable . . . . . . . . . . . . . . . . . . . . . . . . . . . . . . . . . . . . . . 97

4 flextable-package
plot.flextable . . . . . . . . . . . . . . . . . . . . . . . . . . . . . . . . . . . . . . . . 98plot_chunk . . . . . . . . . . . . . . . . . . . . . . . . . . . . . . . . . . . . . . . . . 99print.flextable . . . . . . . . . . . . . . . . . . . . . . . . . . . . . . . . . . . . . . . . 100proc_freq . . . . . . . . . . . . . . . . . . . . . . . . . . . . . . . . . . . . . . . . . . 101rotate . . . . . . . . . . . . . . . . . . . . . . . . . . . . . . . . . . . . . . . . . . . . 102save_as_docx . . . . . . . . . . . . . . . . . . . . . . . . . . . . . . . . . . . . . . . . 104save_as_html . . . . . . . . . . . . . . . . . . . . . . . . . . . . . . . . . . . . . . . . 105save_as_image . . . . . . . . . . . . . . . . . . . . . . . . . . . . . . . . . . . . . . . 106save_as_pptx . . . . . . . . . . . . . . . . . . . . . . . . . . . . . . . . . . . . . . . . 107set_caption . . . . . . . . . . . . . . . . . . . . . . . . . . . . . . . . . . . . . . . . . 107set_flextable_defaults . . . . . . . . . . . . . . . . . . . . . . . . . . . . . . . . . . . . 109set_formatter . . . . . . . . . . . . . . . . . . . . . . . . . . . . . . . . . . . . . . . . 111set_header_footer_df . . . . . . . . . . . . . . . . . . . . . . . . . . . . . . . . . . . . 113set_header_labels . . . . . . . . . . . . . . . . . . . . . . . . . . . . . . . . . . . . . . 114set_table_properties . . . . . . . . . . . . . . . . . . . . . . . . . . . . . . . . . . . . . 115style . . . . . . . . . . . . . . . . . . . . . . . . . . . . . . . . . . . . . . . . . . . . . 116summarizor . . . . . . . . . . . . . . . . . . . . . . . . . . . . . . . . . . . . . . . . . 117surround . . . . . . . . . . . . . . . . . . . . . . . . . . . . . . . . . . . . . . . . . . . 119tabulator . . . . . . . . . . . . . . . . . . . . . . . . . . . . . . . . . . . . . . . . . . . 120theme_alafoli . . . . . . . . . . . . . . . . . . . . . . . . . . . . . . . . . . . . . . . . 124theme_booktabs . . . . . . . . . . . . . . . . . . . . . . . . . . . . . . . . . . . . . . . 125theme_box . . . . . . . . . . . . . . . . . . . . . . . . . . . . . . . . . . . . . . . . . . 126theme_tron . . . . . . . . . . . . . . . . . . . . . . . . . . . . . . . . . . . . . . . . . 127theme_tron_legacy . . . . . . . . . . . . . . . . . . . . . . . . . . . . . . . . . . . . . 128theme_vader . . . . . . . . . . . . . . . . . . . . . . . . . . . . . . . . . . . . . . . . . 129theme_vanilla . . . . . . . . . . . . . . . . . . . . . . . . . . . . . . . . . . . . . . . . 130theme_zebra . . . . . . . . . . . . . . . . . . . . . . . . . . . . . . . . . . . . . . . . . 131use_df_printer . . . . . . . . . . . . . . . . . . . . . . . . . . . . . . . . . . . . . . . . 132valign . . . . . . . . . . . . . . . . . . . . . . . . . . . . . . . . . . . . . . . . . . . . 132vline . . . . . . . . . . . . . . . . . . . . . . . . . . . . . . . . . . . . . . . . . . . . . 133vline_left . . . . . . . . . . . . . . . . . . . . . . . . . . . . . . . . . . . . . . . . . . 134vline_right . . . . . . . . . . . . . . . . . . . . . . . . . . . . . . . . . . . . . . . . . . 135void . . . . . . . . . . . . . . . . . . . . . . . . . . . . . . . . . . . . . . . . . . . . . 136width . . . . . . . . . . . . . . . . . . . . . . . . . . . . . . . . . . . . . . . . . . . . 136
Index 138
flextable-package flextable: Functions for Tabular Reporting
Description
The flextable package facilitates access to and manipulation of tabular reporting elements from R.
The documentation of functions can be opened with command help(package = "flextable").
To learn more about flextable, start with the vignettes: browseVignettes(package = "flextable").
flextable() function is producing flexible tables where each cell can contain several chunks oftext with their own set of formatting properties (bold, font color, etc.). Function compose() letscustomise text of cells.
add_body 5
See Also
https://davidgohel.github.io/flextable/, flextable()
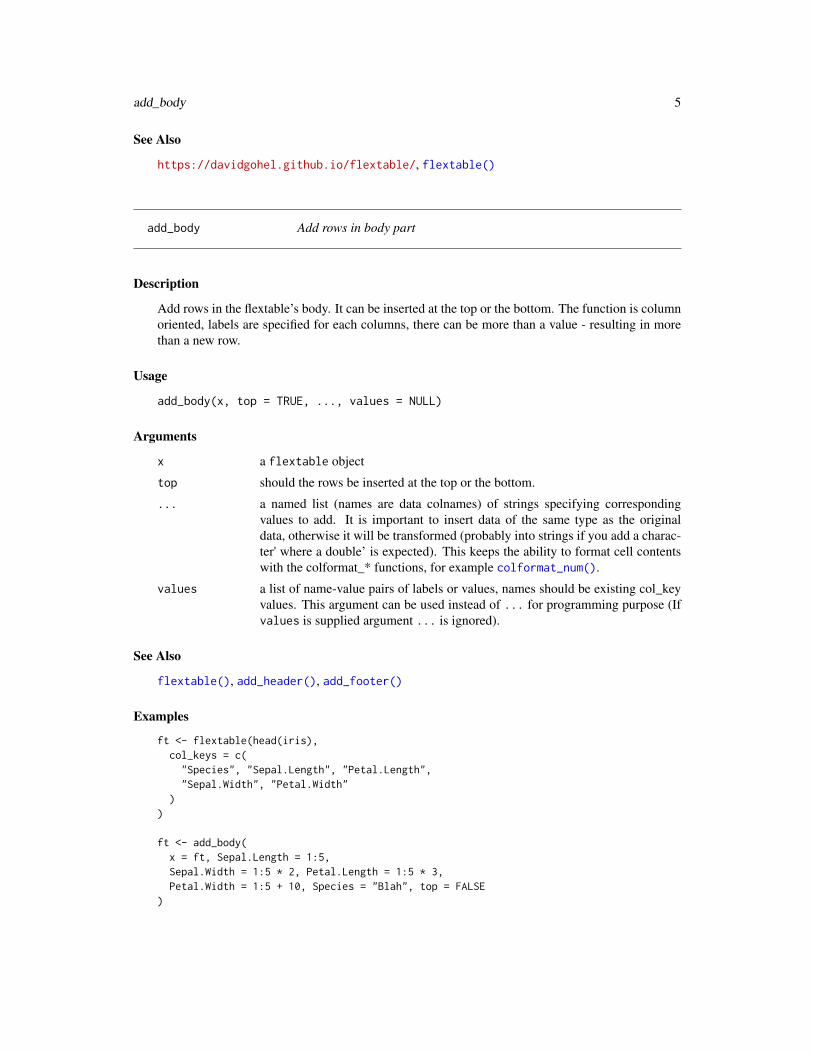
add_body Add rows in body part
Description
Add rows in the flextable’s body. It can be inserted at the top or the bottom. The function is columnoriented, labels are specified for each columns, there can be more than a value - resulting in morethan a new row.
Usage
add_body(x, top = TRUE, ..., values = NULL)
Arguments
x a flextable object
top should the rows be inserted at the top or the bottom.
... a named list (names are data colnames) of strings specifying correspondingvalues to add. It is important to insert data of the same type as the originaldata, otherwise it will be transformed (probably into strings if you add a charac-ter' where a double’ is expected). This keeps the ability to format cell contentswith the colformat_* functions, for example colformat_num().
values a list of name-value pairs of labels or values, names should be existing col_keyvalues. This argument can be used instead of ... for programming purpose (Ifvalues is supplied argument ... is ignored).
See Also
flextable(), add_header(), add_footer()
Examples
ft <- flextable(head(iris),col_keys = c("Species", "Sepal.Length", "Petal.Length","Sepal.Width", "Petal.Width"
))
ft <- add_body(x = ft, Sepal.Length = 1:5,Sepal.Width = 1:5 * 2, Petal.Length = 1:5 * 3,Petal.Width = 1:5 + 10, Species = "Blah", top = FALSE
)

6 add_header
ft <- theme_booktabs(ft)ft
add_header Add a rows of labels in header or footer part
Description
Add rows of labels in the flextable’s header or footer part. It can be inserted at the top or the bottomof the part. The function is column oriented, labels are specified for each columns, there can bemore than a label - resulting in more than a new row.
Usage
add_header(x, top = TRUE, ..., values = NULL)
add_footer(x, top = TRUE, ..., values = NULL)
Arguments
x a flextable object
top should the rows be inserted at the top or the bottom.
... a named list (names are data colnames) of strings specifying correspondingvalues to add. It is important to insert data of the same type as the originaldata, otherwise it will be transformed (probably into strings if you add a charac-ter' where a double’ is expected). This keeps the ability to format cell contentswith the colformat_* functions, for example colformat_num().
values a list of name-value pairs of labels or values, names should be existing col_keyvalues. This argument can be used instead of ... for programming purpose (Ifvalues is supplied argument ... is ignored).
Illustrations
Note
when repeating values, they can be merged together with function merge_h() and merge_v().
See Also
Other headers and footers: add_header_lines(), add_header_row(), set_header_footer_df,set_header_labels()

add_header_lines 7
Examples
ft <- flextable( head( iris ),col_keys = c("Species", "Sepal.Length", "Petal.Length",
"Sepal.Width", "Petal.Width") )
# start with no headerft <- delete_part(ft, part = "header")
# add a line of rowft <- add_header(x = ft, Sepal.Length = "length",
Sepal.Width = "width", Petal.Length = "length",Petal.Width = "width", Species = "Species", top = FALSE )
# add another line of row at the top positionft <- add_header(ft, Sepal.Length = "Inches",
Sepal.Width = "Inches", Petal.Length = "Inches",Petal.Width = "Inches", top = TRUE )
# merge horizontally when there are identical valuesft <- merge_h(ft, part = "header")
# add a footnote in the footer partft <- add_footer(ft, Species = "This is a note in footer" )ft <- merge_at(ft, j = 1:5, part = "footer")
# theme the tableft <- theme_box(ft)
ft
add_header_lines Add a label in a header or footer new row.
Description
Add an header or footer new row made of one cell. This is a sugar function to be used when youneed to add a title row to a flextable, most of the time it will be used in a context of adding a footnoteor adding a title on the top line of the flextable.
Usage
add_header_lines(x, values = character(0), top = TRUE)
add_footer_lines(x, values = character(0), top = FALSE)
Arguments
x a flextable objectvalues a character vector, each element will be added a a new row in the header or
footer part.top should the row be inserted at the top or the bottom.

8 add_header_row
Illustrations
See Also
Other headers and footers: add_header_row(), add_header(), set_header_footer_df, set_header_labels()
Examples
ft_1 <- flextable( head( iris ) )ft_1 <- add_header_lines(ft_1, values = "blah blah")ft_1 <- add_header_lines(ft_1, values = c("blah 1", "blah 2"))ft_1 <- autofit(ft_1)ft_1ft_2 <- flextable( head( iris ) )ft_2 <- add_footer_lines(ft_2, values = "blah blah")ft_2 <- add_footer_lines(ft_2, values = c("blah 1", "blah 2"))ft_2 <- theme_tron(ft_2)ft_2
add_header_row Add labels and merge cells in a new header or footer row
Description
Add an header or footer new row where some cells are merged, labels are associated with a numberof columns to merge. The function is row oriented. One call allow to add one single row.
Usage
add_header_row(x, top = TRUE, values = character(0), colwidths = integer(0))
add_footer_row(x, top = TRUE, values = character(0), colwidths = integer(0))
Arguments
x a flextable object
top should the row be inserted at the top or the bottom.
values values to add as a character vector
colwidths the number of columns to merge in the row for each label
Illustrations

add_latex_dep 9
See Also
Other headers and footers: add_header_lines(), add_header(), set_header_footer_df, set_header_labels()
Examples
ft <- flextable( head( iris ) )ft <- add_header_row(ft, values = "blah blah", colwidths = 5)ft <- add_header_row(ft, values = c("blah", "blah"), colwidths = c(3,2))ft <- theme_tron(ft)ftft <- flextable( head( iris ) )ft <- add_footer_row(ft, values = "blah blah", colwidths = 5)ft <- add_footer_row(ft, values = c("blah", "blah"), colwidths = c(3,2))ft
add_latex_dep add latex dependencies
Description
Manually add flextable latex dependencies to the knitr session via knit_meta_add().
When enabling caching in ’R Markdown’ documents for PDF output, the flextable cached result isused directly. Call add_latex_dep() in a non cached chunk so that flextable latex dependenciesare added to knitr metadata.
Usage
add_latex_dep()
Examples
add_latex_dep()
align Set text alignment
Description
change text alignment of selected rows and columns of a flextable.
Usage
align(x, i = NULL, j = NULL, align = "left", part = "body")
align_text_col(x, align = "left", header = TRUE, footer = TRUE)
align_nottext_col(x, align = "right", header = TRUE, footer = TRUE)

10 append_chunks
Arguments
x a flextable object
i rows selection
j columns selection
align text alignment - a single character value, expected value is one of ’left’, ’right’,’center’, ’justify’.
part partname of the table (one of ’all’, ’body’, ’header’, ’footer’)
header should the header be aligned with the body
footer should the footer be aligned with the body
Illustrations
See Also
Other sugar functions for table style: bg(), bold(), color(), empty_blanks(), fontsize(),font(), highlight(), italic(), line_spacing(), padding(), rotate(), valign()
Examples
ft <- flextable(head(mtcars)[,3:6])ft <- align(ft, align = "right", part = "all")ft <- theme_tron_legacy(ft)ftftab <- flextable(mtcars)ftab <- align_text_col(ftab, align = "left")ftab <- align_nottext_col(ftab, align = "right")ftab
append_chunks append chunks to flextable content
Description
append chunks (for example chunk as_chunk()) in a flextable.
Usage
append_chunks(x, i = NULL, j = NULL, ..., part = "body")

append_chunks 11
Arguments
x a flextable object
i rows selection
j column selection
... chunks to be appened, see as_chunk(), gg_chunk() and other chunk elementsfor paragraph.
part partname of the table (one of ’body’, ’header’, ’footer’)
Examples
library(flextable)
f1 <- function(x) {formatC(x, digits = 1,
format = "f")}f2 <- function(x) {
paste0(" (",formatC(x, digits = 1,
format = "f"), ")")}
ft_1 <- flextable(data = head(mtcars),col_keys = c("am", "gear", "carb", "mycol")
)ft_1 <- merge_v(ft_1, j = "am")ft_1 <- valign(ft_1, valign = "top")ft_1 <- theme_vanilla(ft_1)ft_1 <- mk_par(ft_1,
j = "mycol", part = "body",value = as_paragraph(as_chunk(mpg, formatter = f1), " ",colorize(as_chunk(wt, formatter = f2), "gray")
))
ft_1 <-append_chunks(ft_1,
i = 1, j = "mycol", part = "header",as_chunk("mpg "),colorize(as_bracket("wt"), "gray")
)
ft_1 <- align(x = ft_1, j = c("am", "gear", "carb"),align = "center", part = "all")
ft_1 <- align(x = ft_1, j = "mycol",
12 as_b
align = "right", part = "all")
ft_1 <- autofit(ft_1)
ft_1
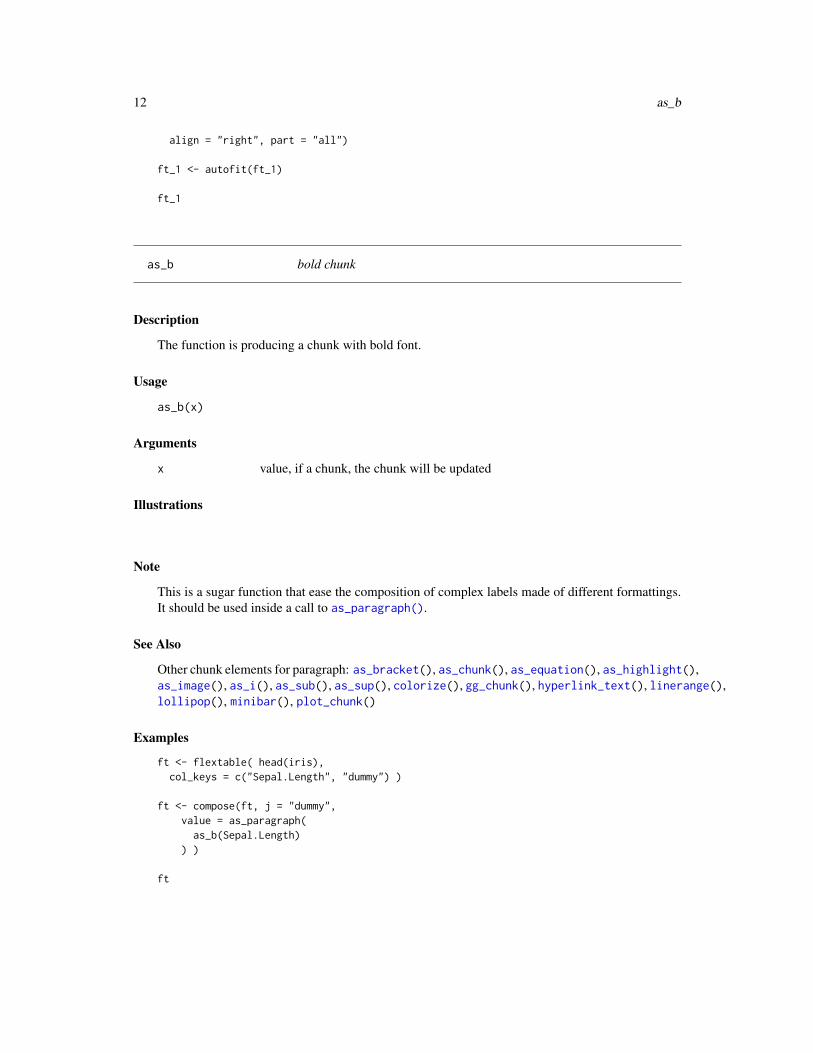
as_b bold chunk
Description
The function is producing a chunk with bold font.
Usage
as_b(x)
Arguments
x value, if a chunk, the chunk will be updated
Illustrations
Note
This is a sugar function that ease the composition of complex labels made of different formattings.It should be used inside a call to as_paragraph().
See Also
Other chunk elements for paragraph: as_bracket(), as_chunk(), as_equation(), as_highlight(),as_image(), as_i(), as_sub(), as_sup(), colorize(), gg_chunk(), hyperlink_text(), linerange(),lollipop(), minibar(), plot_chunk()
Examples
ft <- flextable( head(iris),col_keys = c("Sepal.Length", "dummy") )
ft <- compose(ft, j = "dummy",value = as_paragraph(
as_b(Sepal.Length)) )
ft

as_bracket 13
as_bracket chunk with values in brackets
Description
The function is producing a chunk by pasting values and add the result in brackets. It should beused inside a call to as_paragraph().
Usage
as_bracket(..., sep = ", ", p = "(", s = ")")
Arguments
... text and column names
sep separator
p prefix, default to ’(’
s suffix, default to ’)’
Illustrations
See Also
Other chunk elements for paragraph: as_b(), as_chunk(), as_equation(), as_highlight(),as_image(), as_i(), as_sub(), as_sup(), colorize(), gg_chunk(), hyperlink_text(), linerange(),lollipop(), minibar(), plot_chunk()
Examples
ft <- flextable( head(iris),col_keys = c("Species", "Sepal", "Petal") )
ft <- set_header_labels(ft, Sepal="Sepal", Petal="Petal")ft <- compose(ft, j = "Sepal",
value = as_paragraph( as_bracket(Sepal.Length, Sepal.Width) ) )ft <- compose(ft, j = "Petal",
value = as_paragraph( as_bracket(Petal.Length, Petal.Width) ) )ft

14 as_chunk
as_chunk chunk of text wrapper
Description
The function lets add text within flextable objects with function compose(). It should be used insidea call to as_paragraph().
Usage
as_chunk(x, props = NULL, formatter = format_fun, ...)
Arguments
x text or any element that can be formatted as text with function provided in argu-ment formatter.
props an officer::fp_text() object to be used to format the text. If not specified, itwill be the default value corresponding to the cell.
formatter a function that will format x as a character vector.
... additional arguments for formatter function.
Illustrations
See Also
Other chunk elements for paragraph: as_bracket(), as_b(), as_equation(), as_highlight(),as_image(), as_i(), as_sub(), as_sup(), colorize(), gg_chunk(), hyperlink_text(), linerange(),lollipop(), minibar(), plot_chunk()
Examples
library(officer)
ft <- flextable( head(iris))
ft <- compose( ft, j = "Sepal.Length",value = as_paragraph("Sepal.Length value is ",as_chunk(Sepal.Length, props = fp_text(color = "red"))
),part = "body")
ft <- color(ft, color = "gray40", part = "all")ft <- autofit(ft)ft
as_equation 15
as_equation equation chunk
Description
This function is used to insert equations into flextable with function compose(). It should be usedinside a call to as_paragraph().
To use this function, package ’equatags’ is required; also equatags::mathjax_install() must beexecuted only once to install necessary dependencies.
Usage
as_equation(x, width = 1, height = 0.2, unit = "in")
Arguments
x values containing the ’MathJax’ equations
width, height size of the resulting equation in inches
unit unit for width and height, one of "in", "cm", "mm".
See Also
Other chunk elements for paragraph: as_bracket(), as_b(), as_chunk(), as_highlight(),as_image(), as_i(), as_sub(), as_sup(), colorize(), gg_chunk(), hyperlink_text(), linerange(),lollipop(), minibar(), plot_chunk()
Examples
library(flextable)if(require("equatags") && mathjax_available()){
eqs <- c("(ax^2 + bx + c = 0)","a \\ne 0","x = {-b \\pm \\sqrt{b^2-4ac} \\over 2a}")
df <- data.frame(formula = eqs)df
ft <- flextable(df)ft <- compose(
x = ft, j = "formula",value = as_paragraph(as_equation(formula, width = 2, height = .5)))
ft <- align(ft, align = "center", part = "all")ft <- width(ft, width = 2)ft
}
16 as_flextable.gam
as_flextable method to convert object to flextable
Description
This is a convenient function to let users create flextable bindings from any objects. Users shouldconsult documentation of corresponding method to understand the details and see what argumentscan be used.
Usage
as_flextable(x, ...)
Arguments
x object to be transformed as flextable
... arguments for custom methods
See Also
Other as_flextable methods: as_flextable.gam(), as_flextable.glm(), as_flextable.grouped_data(),as_flextable.htest(), as_flextable.lm(), as_flextable.tabulator(), as_flextable.xtable()
as_flextable.gam tabular summary for gam object
Description
produce a flextable describing a generalized additive model produced by function mgcv::gam.
Usage
## S3 method for class 'gam'as_flextable(x, ...)
Arguments
x gam model
... unused argument
Illustrations

as_flextable.glm 17
See Also
Other as_flextable methods: as_flextable.glm(), as_flextable.grouped_data(), as_flextable.htest(),as_flextable.lm(), as_flextable.tabulator(), as_flextable.xtable(), as_flextable()
Examples
if (require("mgcv")) {set.seed(2)
# Simulated datadat <- gamSim(1, n = 400, dist = "normal", scale = 2)
# basic GAM modelb <- gam(y ~ s(x0) + s(x1) + s(x2) + s(x3), data = dat)
ft <- as_flextable(b)ft
}
as_flextable.glm tabular summary for glm object
Description
produce a flextable describing a generalized linear model produced by function glm.
Usage
## S3 method for class 'glm'as_flextable(x, ...)
Arguments
x glm model
... unused argument
Illustrations
See Also
Other as_flextable methods: as_flextable.gam(), as_flextable.grouped_data(), as_flextable.htest(),as_flextable.lm(), as_flextable.tabulator(), as_flextable.xtable(), as_flextable()
18 as_flextable.grouped_data
Examples
if(require("broom")){dat <- attitudedat$high.rating <- (dat$rating > 70)probit.model <- glm(high.rating ~ learning + critical +
advance, data=dat, family = binomial(link = "probit"))ft <- as_flextable(probit.model)ft
}
as_flextable.grouped_data
tabular summary for grouped_data object
Description
produce a flextable from a table produced by function as_grouped_data().
Usage
## S3 method for class 'grouped_data'as_flextable(x, col_keys = NULL, hide_grouplabel = FALSE, ...)
Arguments
x object to be transformed as flextable
col_keys columns names/keys to display. If some column names are not in the dataset,they will be added as blank columns by default.
hide_grouplabel
if TRUE, group label will not be rendered, only level/value will be rendered.
... unused argument
Illustrations
See Also
as_grouped_data()
Other as_flextable methods: as_flextable.gam(), as_flextable.glm(), as_flextable.htest(),as_flextable.lm(), as_flextable.tabulator(), as_flextable.xtable(), as_flextable()

as_flextable.htest 19
Examples
library(data.table)CO2 <- CO2setDT(CO2)CO2$conc <- as.integer(CO2$conc)
data_co2 <- dcast(CO2, Treatment + conc ~ Type,value.var = "uptake", fun.aggregate = mean)
data_co2 <- as_grouped_data(x = data_co2, groups = c("Treatment"))
ft <- as_flextable( data_co2 )ft <- add_footer_lines(ft, "dataset CO2 has been used for this flextable")ft <- add_header_lines(ft, "mean of carbon dioxide uptake in grass plants")ft <- set_header_labels(ft, conc = "Concentration")ft <- autofit(ft)ft <- width(ft, width = c(1, 1, 1))ft
as_flextable.htest tabular summary for htest object
Description
produce a flextable describing an object oof class htest.
Usage
## S3 method for class 'htest'as_flextable(x, ...)
Arguments
x htest object
... unused argument
Illustrations
See Also
Other as_flextable methods: as_flextable.gam(), as_flextable.glm(), as_flextable.grouped_data(),as_flextable.lm(), as_flextable.tabulator(), as_flextable.xtable(), as_flextable()
20 as_flextable.lm
Examples
if(require("stats")){M <- as.table(rbind(c(762, 327, 468), c(484, 239, 477)))dimnames(M) <- list(gender = c("F", "M"),party = c("Democrat","Independent", "Republican"))ft_1 <- as_flextable(chisq.test(M))ft_1
}
as_flextable.lm tabular summary for lm object
Description
produce a flextable describing a linear model produced by function lm.
Usage
## S3 method for class 'lm'as_flextable(x, ...)
Arguments
x lm model
... unused argument
Illustrations
See Also
Other as_flextable methods: as_flextable.gam(), as_flextable.glm(), as_flextable.grouped_data(),as_flextable.htest(), as_flextable.tabulator(), as_flextable.xtable(), as_flextable()
Examples
if(require("broom")){lmod <- lm(rating ~ complaints + privileges +learning + raises + critical, data=attitude)
ft <- as_flextable(lmod)ft
}

as_flextable.tabulator 21
as_flextable.tabulator
tabulator to flextable
Description
tabulator object can be transformed as a flextable with method as_flextable().
Usage
## S3 method for class 'tabulator'as_flextable(x,separate_with = character(0),big_border = fp_border_default(width = 1.5),small_border = fp_border_default(width = 0.75),rows_alignment = "left",columns_alignment = "center",sep_w = 0.05,unit = "in",...
)
Arguments
x result from tabulator()
separate_with columns used to sepatate the groups with an horizontal line.big_border, small_border
big and small border properties defined by a call to fp_border_default() orfp_border().
rows_alignment, columns_alignment
alignments to apply to columns corresponding to rows and columns; see argu-ments rows and columns in tabulator().
sep_w blank column separators’width to be used. If 0, blank column separators willnot be used.
unit unit of argument sep_w, one of "in", "cm", "mm".
... unused argument
See Also
summarizor(), as_grouped_data()
Other as_flextable methods: as_flextable.gam(), as_flextable.glm(), as_flextable.grouped_data(),as_flextable.htest(), as_flextable.lm(), as_flextable.xtable(), as_flextable()
22 as_flextable.xtable
Examples
library(flextable)
set_flextable_defaults(digits = 2, border.color = "gray")
if(require("stats")){dat <- aggregate(breaks ~ wool + tension,data = warpbreaks, mean)
cft_1 <- tabulator(x = dat,rows = "wool",
columns = "tension",`mean` = as_paragraph(as_chunk(breaks)),`(N)` = as_paragraph(
as_chunk(length(breaks) )))
ft_1 <- as_flextable(cft_1, sep_w = .1)ft_1
set_flextable_defaults(padding = 1, font.size = 9, border.color = "orange")ft_2 <- as_flextable(cft_1, sep_w = 0)ft_2
set_flextable_defaults(padding = 6, font.size = 11,border.color = "white", font.color = "white",background.color = "#333333")
ft_3 <- as_flextable(x = cft_1, sep_w = 0,rows_alignment = "center",columns_alignment = "right")
ft_3}
init_flextable_defaults()
as_flextable.xtable get a flextable from a xtable object
Description
Get a flextable object from a xtable object.
xtable_to_flextable will be deprecated in favor of as_flextable.xtable.
Usage
## S3 method for class 'xtable'as_flextable(x,

as_flextable.xtable 23
text.properties = fp_text_default(),format.args = getOption("xtable.format.args", NULL),rowname_col = "rowname",hline.after = getOption("xtable.hline.after", c(-1, 0, nrow(x))),NA.string = getOption("xtable.NA.string", ""),include.rownames = TRUE,rotate.colnames = getOption("xtable.rotate.colnames", FALSE),...
)
xtable_to_flextable(x,text.properties = fp_text_default(),format.args = getOption("xtable.format.args", NULL),rowname_col = "rowname",hline.after = getOption("xtable.hline.after", c(-1, 0, nrow(x))),NA.string = getOption("xtable.NA.string", ""),include.rownames = TRUE,rotate.colnames = getOption("xtable.rotate.colnames", FALSE),...
)
Arguments
x xtable objecttext.properties
default text formatting properties
format.args List of arguments for the formatC function. See argument format.args ofprint.xtable. Not yet implemented.
rowname_col colname used for row names column
hline.after see ?print.xtable.
NA.string see ?print.xtable.include.rownames
see ?print.xtable.rotate.colnames
see ?print.xtable.
... unused arguments
Illustrations
See Also
Other as_flextable methods: as_flextable.gam(), as_flextable.glm(), as_flextable.grouped_data(),as_flextable.htest(), as_flextable.lm(), as_flextable.tabulator(), as_flextable()

24 as_grouped_data
Examples
library(officer)if( require("xtable") ){
data(tli)tli.table <- xtable(tli[1:10, ])align(tli.table) <- rep("r", 6)align(tli.table) <- "|r|r|clr|r|"ft_1 <- as_flextable(tli.table,rotate.colnames = TRUE,include.rownames = FALSE)
ft_1 <- height(ft_1, i = 1, part = "header", height = 1)ft_1
Grade3 <- c("A","B","B","A","B","C","C","D","A","B","C","C","C","D","B","B","D","C","C","D")
Grade6 <- c("A","A","A","B","B","B","B","B","C","C","A","C","C","C","D","D","D","D","D","D")
Cohort <- table(Grade3, Grade6)ft_2 <- as_flextable(xtable(Cohort))ft_2 <- set_header_labels(ft_2, rowname = "Grade 3")ft_2 <- autofit(ft_2)ft_2 <- add_header(ft_2, A = "Grade 6")ft_2 <- merge_at(ft_2, i = 1, j = seq_len( ncol(Cohort) ) + 1,
part = "header" )ft_2 <- bold(ft_2, j = 1, bold = TRUE, part = "body")ft_2 <- height_all(ft_2, part = "header", height = .4)ft_2
temp.ts <- ts(cumsum(1 + round(rnorm(100), 0)),start = c(1954, 7), frequency = 12)
ft_3 <- as_flextable(x = xtable(temp.ts, digits = 0),NA.string = "-")
ft_3
detach("package:xtable", unload = TRUE)}
as_grouped_data grouped data transformation
Description
Repeated consecutive values of group columns will be used to define the title of the groups and willbe added as a row title.
Usage
as_grouped_data(x, groups, columns = NULL)
as_highlight 25
Arguments
x datasetgroups columns names to be used as row separators.columns columns names to keep
See Also
as_flextable.grouped_data()
Examples
# as_grouped_data -----library(data.table)CO2 <- CO2setDT(CO2)CO2$conc <- as.integer(CO2$conc)
data_co2 <- dcast(CO2, Treatment + conc ~ Type,value.var = "uptake", fun.aggregate = mean)
data_co2data_co2 <- as_grouped_data(x = data_co2, groups = c("Treatment"))data_co2
as_highlight highlight chunk
Description
The function is producing a chunk with an highlight chunk.
Usage
as_highlight(x, color)
Arguments
x value, if a chunk, the chunk will be updatedcolor color to use as text highlighting color as character vector.
Note
This is a sugar function that ease the composition of complex labels made of different formattings.It should be used inside a call to as_paragraph().
See Also
Other chunk elements for paragraph: as_bracket(), as_b(), as_chunk(), as_equation(), as_image(),as_i(), as_sub(), as_sup(), colorize(), gg_chunk(), hyperlink_text(), linerange(), lollipop(),minibar(), plot_chunk()
26 as_i
Examples
ft <- flextable( head(iris),col_keys = c("Sepal.Length", "dummy") )
ft <- compose(ft, j = "dummy",value = as_paragraph(as_highlight(Sepal.Length, color = "yellow")) )
ft
as_i italic chunk
Description
The function is producing a chunk with italic font.
Usage
as_i(x)
Arguments
x value, if a chunk, the chunk will be updated
Illustrations
Note
This is a sugar function that ease the composition of complex labels made of different formattings.It should be used inside a call to as_paragraph().
See Also
Other chunk elements for paragraph: as_bracket(), as_b(), as_chunk(), as_equation(), as_highlight(),as_image(), as_sub(), as_sup(), colorize(), gg_chunk(), hyperlink_text(), linerange(),lollipop(), minibar(), plot_chunk()
Examples
ft <- flextable( head(iris),col_keys = c("Sepal.Length", "dummy") )
ft <- compose(ft, j = "dummy",value = as_paragraph(as_i(Sepal.Length)) )
ft
as_image 27
as_image image chunk wrapper
Description
The function lets add images within flextable objects with function compose(). It should be usedinside a call to as_paragraph().
Usage
as_image(src, width = 0.5, height = 0.2, unit = "in", ...)
Arguments
src image filename
width, height size of the png file in inches
unit unit for width and height, one of "in", "cm", "mm".
... unused argument
Illustrations
Note
This chunk option requires package officedown in a R Markdown context with Word output format.
PowerPoint cannot mix images and text in a paragraph, images are removed when outputing toPowerPoint format.
See Also
compose(), as_paragraph()
Other chunk elements for paragraph: as_bracket(), as_b(), as_chunk(), as_equation(), as_highlight(),as_i(), as_sub(), as_sup(), colorize(), gg_chunk(), hyperlink_text(), linerange(), lollipop(),minibar(), plot_chunk()
Examples
img.file <- file.path( R.home("doc"), "html", "logo.jpg" )library(officer)
myft <- flextable( head(iris))
myft <- compose( myft, i = 1:3, j = 1,value = as_paragraph(
as_image(src = img.file, width = .20, height = .15)," blah blah ",

28 as_paragraph
as_chunk(Sepal.Length, props = fp_text(color = "red"))),part = "body")
ft <- autofit(myft)ft
as_paragraph concatenate chunks in a flextable
Description
The function is concatenating text and images within paragraphs of a flextable object, this functionis to be used with function compose().
Usage
as_paragraph(..., list_values = NULL)
Arguments
... chunk elements that are defining paragraph
list_values a list of chunk elements that are defining paragraph. If specified argument ...is unused.
Illustrations
See Also
as_chunk(), minibar(), as_image(), hyperlink_text()
Examples
library(flextable)ft <- flextable(airquality[sample.int(150, size = 10), ])ft <- compose(ft,
j = "Wind",value = as_paragraph(as_chunk(Wind, props = fp_text_default(color = "orange"))," ",
minibar(value = Wind, max = max(airquality$Wind), barcol = "orange", bg = "black", height = .15)),part = "body"
)ft <- autofit(ft)ft
as_raster 29
as_raster get a flextable as a raster
Description
save a flextable as an image and return the corresponding raster. This function has been imple-mented to let flextable be printed on a ggplot object.
Usage
as_raster(x, zoom = 2, expand = 2, webshot = "webshot")
Arguments
x a flextable object
zoom, expand parameters used by webshot function.
webshot webshot package as a scalar character, one of "webshot" or "webshot2".
Note
This function requires packages: webshot and magick.
See Also
Other flextable print function: df_printer(), flextable_to_rmd(), htmltools_value(), knit_print.flextable(),plot.flextable(), print.flextable(), save_as_docx(), save_as_html(), save_as_image(),save_as_pptx()
Examples
ft <- qflextable( head( mtcars ) )## Not run:if( require("ggplot2") && require("webshot") ){
print(qplot(speed, dist, data = cars, geom = "point"))grid::grid.raster(as_raster(ft))
}
## End(Not run)
30 as_sub
as_sub subscript chunk
Description
The function is producing a chunk with subscript vertical alignment.
Usage
as_sub(x)
Arguments
x value, if a chunk, the chunk will be updated
Illustrations
Note
This is a sugar function that ease the composition of complex labels made of different formattings.It should be used inside a call to as_paragraph().
See Also
Other chunk elements for paragraph: as_bracket(), as_b(), as_chunk(), as_equation(), as_highlight(),as_image(), as_i(), as_sup(), colorize(), gg_chunk(), hyperlink_text(), linerange(),lollipop(), minibar(), plot_chunk()
Examples
ft <- flextable( head(iris), col_keys = c("dummy") )
ft <- compose(ft, i = 1, j = "dummy", part = "header",value = as_paragraph(
as_sub("Sepal.Length")," anything "
) )
ft <- autofit(ft)ft

as_sup 31
as_sup superscript chunk
Description
The function is producing a chunk with superscript vertical alignment.
Usage
as_sup(x)
Arguments
x value, if a chunk, the chunk will be updated
Illustrations
Note
This is a sugar function that ease the composition of complex labels made of different formattings.It should be used inside a call to as_paragraph().
See Also
Other chunk elements for paragraph: as_bracket(), as_b(), as_chunk(), as_equation(), as_highlight(),as_image(), as_i(), as_sub(), colorize(), gg_chunk(), hyperlink_text(), linerange(),lollipop(), minibar(), plot_chunk()
Examples
ft <- flextable( head(iris), col_keys = c("dummy") )
ft <- compose(ft, i = 1, j = "dummy", part = "header",value = as_paragraph(
" anything ",as_sup("Sepal.Width")
) )
ft <- autofit(ft)ft

32 autofit
autofit Adjusts cell widths and heights
Description
compute and apply optimized widths and heights (minimum estimated widths and heights for eachtable columns and rows in inches returned by function dim_pretty()).
This function is to be used when the table widths and heights should automatically be adjusted tofit the size of the content.
Usage
autofit(x, add_w = 0.1, add_h = 0.1, part = c("body", "header"), unit = "in")
Arguments
x flextable object
add_w extra width to add in inches
add_h extra height to add in inches
part partname of the table (one of ’all’, ’body’, ’header’ or ’footer’)
unit unit for add_h and add_w, one of "in", "cm", "mm".
line breaks
Soft returns (a line break in a paragraph) are not supported. Function autofit will return wrongresults if \n are used (they will be considered as "").
Illustrations
Note
This function is not related to ’Microsoft Word’ Autofit feature.
See Also
Other flextable dimensions: dim.flextable(), dim_pretty(), fit_to_width(), flextable_dim(),height(), hrule(), ncol_keys(), nrow_part(), set_table_properties(), width()
Examples
ft_1 <- flextable(head(mtcars))ft_1ft_2 <- autofit(ft_1)ft_2
before 33
before is an element before a match with entries
Description
return a logical vector of the same length as x, indicating if elements are located before a set ofentries to match or not.
Usage
before(x, entries)
Arguments
x an atomic vector of values to be tested
entries a sequence of items to be searched in x.
See Also
hline()
Examples
library(flextable)library(officer)
dat <- data.frame(stringsAsFactors = FALSE,check.names = FALSE,Level = c("setosa", "versicolor", "virginica", "<NA>", "Total"),Freq = as.integer(c(50, 50, 50, 0, 150)),`% Valid` = c(100/3,
100/3,100/3,NA,100),`% Valid Cum.` = c(100/3, 100*2/3, 100, NA, 100),`% Total` = c(100/3,
100/3,100/3,0,100),`% Total Cum.` = c(100/3,
100*2/3,100,100,100))
ft <- flextable(dat)ft <- hline(ft, i = ~ before(Level, "Total"),
border = fp_border_default(width = 2))ft

34 bg
bg Set background color
Description
change background color of selected rows and columns of a flextable.
Usage
bg(x, i = NULL, j = NULL, bg, part = "body", source = j)
Arguments
x a flextable object
i rows selection
j columns selection
bg color to use as background color. If a function, function need to return a charac-ter vector of colors.
part partname of the table (one of ’all’, ’body’, ’header’, ’footer’)
source if bg is a function, source is specifying the dataset column to be used as argumentto bg. This is only useful if j is colored with values contained in another (orother) column.
Illustrations
Note
Word does not allow you to apply transparency to table cells or paragraph shading.
See Also
Other sugar functions for table style: align(), bold(), color(), empty_blanks(), fontsize(),font(), highlight(), italic(), line_spacing(), padding(), rotate(), valign()
Examples
ft_1 <- flextable(head(mtcars))ft_1 <- bg(ft_1, bg = "wheat", part = "header")ft_1 <- bg(ft_1, i = ~ qsec < 18, bg = "#EFEFEF", part = "body")ft_1 <- bg(ft_1, j = "drat", bg = "#606060", part = "all")ft_1 <- color(ft_1, j = "drat", color = "white", part = "all")ft_1
if(require("scales")){ft_2 <- flextable(head(iris))

body_add_flextable 35
colourer <- col_numeric(palette = c("wheat", "red"),domain = c(0, 7))
ft_2 <- bg(ft_2, j = c("Sepal.Length", "Sepal.Width","Petal.Length", "Petal.Width"),
bg = colourer, part = "body")ft_2
}
body_add_flextable add flextable into a Word document
Description
add a flextable into a Word document.
Usage
body_add_flextable(x,value,align = "center",pos = "after",split = FALSE,topcaption = TRUE,keepnext = TRUE
)
body_replace_flextable_at_bkm(x,bookmark,value,align = "center",split = FALSE
)
Arguments
x an rdocx object
value flextable object
align left, center (default) or right.
pos where to add the flextable relative to the cursor, one of "after", "before", "on"(end of line).
split set to TRUE if you want to activate Word option ’Allow row to break acrosspages’.
topcaption if TRUE caption is added before the table, if FALSE, caption is added after thetable.
36 bold
keepnext Word option ’keep rows together’ can be activated when TRUE. It avoids pagebreak within tables.
bookmark bookmark id
body_replace_flextable_at_bkm
Use this function if you want to replace a paragraph containing a bookmark with a flextable. As aside effect, the bookmark will be lost.
Examples
library(officer)
# autonum for captionautonum <- run_autonum(seq_id = "tab", bkm = "mtcars")
ftab <- flextable( head( mtcars ) )ftab <- set_caption(ftab, caption = "mtcars data", autonum = autonum)ftab <- autofit(ftab)doc <- read_docx()doc <- body_add_flextable(doc, value = ftab)fileout <- tempfile(fileext = ".docx")# fileout <- "test.docx" # uncomment to write in your working directoryprint(doc, target = fileout)
bold Set bold font
Description
change font weight of selected rows and columns of a flextable.
Usage
bold(x, i = NULL, j = NULL, bold = TRUE, part = "body")
Arguments
x a flextable object
i rows selection
j columns selection
bold boolean value
part partname of the table (one of ’all’, ’body’, ’header’, ’footer’)
Illustrations

border_inner 37
See Also
Other sugar functions for table style: align(), bg(), color(), empty_blanks(), fontsize(),font(), highlight(), italic(), line_spacing(), padding(), rotate(), valign()
Examples
ft <- flextable(head(iris))ft <- bold(ft, bold = TRUE, part = "header")
border_inner set vertical & horizontal inner borders
Description
The function is applying a vertical and horizontal borders to inner content of one or all parts of aflextable.
Usage
border_inner(x, border = NULL, part = "all")
Arguments
x a flextable object
border border properties defined by a call to fp_border()
part partname of the table (one of ’all’, ’body’, ’header’, ’footer’)
Illustrations
See Also
Other borders management: border_inner_h(), border_inner_v(), border_outer(), border_remove(),hline_bottom(), hline_top(), hline(), surround(), vline_left(), vline_right(), vline()
Examples
library(officer)std_border = fp_border(color="orange", width = 1)
dat <- iris[c(1:5, 51:55, 101:105),]ft <- flextable(dat)ft <- border_remove(x = ft)
# add inner vertical bordersft <- border_inner(ft, border = std_border )ft

38 border_inner_h
border_inner_h set inner borders
Description
The function is applying a border to inner content of one or all parts of a flextable.
Usage
border_inner_h(x, border = NULL, part = "body")
Arguments
x a flextable object
border border properties defined by a call to fp_border()
part partname of the table (one of ’all’, ’body’, ’header’, ’footer’)
Illustrations
See Also
Other borders management: border_inner_v(), border_inner(), border_outer(), border_remove(),hline_bottom(), hline_top(), hline(), surround(), vline_left(), vline_right(), vline()
Examples
library(officer)std_border = fp_border(color="orange", width = 1)
dat <- iris[c(1:5, 51:55, 101:105),]ft <- flextable(dat)ft <- border_remove(x = ft)
# add inner horizontal bordersft <- border_inner_h(ft, border = std_border )ft
border_inner_v 39
border_inner_v set vertical inner borders
Description
The function is applying a vertical border to inner content of one or all parts of a flextable.
Usage
border_inner_v(x, border = NULL, part = "all")
Arguments
x a flextable object
border border properties defined by a call to fp_border()
part partname of the table (one of ’all’, ’body’, ’header’, ’footer’)
Illustrations
See Also
Other borders management: border_inner_h(), border_inner(), border_outer(), border_remove(),hline_bottom(), hline_top(), hline(), surround(), vline_left(), vline_right(), vline()
Examples
library(officer)std_border = fp_border(color="orange", width = 1)
dat <- iris[c(1:5, 51:55, 101:105),]ft <- flextable(dat)ft <- border_remove(x = ft)
# add inner vertical bordersft <- border_inner_v(ft, border = std_border )ft
40 border_outer
border_outer set outer borders
Description
The function is applying a border to outer cells of one or all parts of a flextable.
Usage
border_outer(x, border = NULL, part = "all")
Arguments
x a flextable object
border border properties defined by a call to fp_border()
part partname of the table (one of ’all’, ’body’, ’header’, ’footer’)
Illustrations
See Also
Other borders management: border_inner_h(), border_inner_v(), border_inner(), border_remove(),hline_bottom(), hline_top(), hline(), surround(), vline_left(), vline_right(), vline()
Examples
library(officer)big_border = fp_border(color="red", width = 2)
dat <- iris[c(1:5, 51:55, 101:105),]ft <- flextable(dat)ft <- border_remove(x = ft)
# add outer bordersft <- border_outer(ft, part="all", border = big_border )ft
border_remove 41
border_remove remove borders
Description
The function is deleting all borders of the flextable object.
Usage
border_remove(x)
Arguments
x a flextable object
Illustrations
See Also
Other borders management: border_inner_h(), border_inner_v(), border_inner(), border_outer(),hline_bottom(), hline_top(), hline(), surround(), vline_left(), vline_right(), vline()
Examples
dat <- iris[c(1:5, 51:55, 101:105),]ft_1 <- flextable(dat)ft_1 <- theme_box(ft_1)ft_1
# remove all bordersft_2 <- border_remove(x = ft_1)ft_2
colformat_char format character cells
Description
Format character cells in a flextable.
42 colformat_date
Usage
colformat_char(x,i = NULL,j = NULL,na_str = get_flextable_defaults()$na_str,nan_str = get_flextable_defaults()$nan_str,prefix = "",suffix = ""
)
Arguments
x a flextable object
i rows selection
j columns selection.na_str, nan_str
string to be used for NA and NaN values
prefix, suffix string to be used as prefix or suffix
Illustrations
See Also
Other cells formatters: colformat_datetime(), colformat_date(), colformat_double(), colformat_image(),colformat_int(), colformat_lgl(), colformat_num(), compose(), set_formatter()
Examples
dat <- irisz <- flextable(head(dat))ft <- colformat_char(
x = z, j = "Species", suffix = "!")z <- autofit(z)z
colformat_date format date cells
Description
Format date cells in a flextable.

colformat_date 43
Usage
colformat_date(x,i = NULL,j = NULL,fmt_date = get_flextable_defaults()$fmt_date,na_str = get_flextable_defaults()$na_str,nan_str = get_flextable_defaults()$nan_str,prefix = "",suffix = ""
)
Arguments
x a flextable object
i rows selection
j columns selection.
fmt_date see strptime()
na_str string to be used for NA and NaN values
nan_str string to be used for NA and NaN values
prefix string to be used as prefix or suffix
suffix string to be used as prefix or suffix
Illustrations
See Also
Other cells formatters: colformat_char(), colformat_datetime(), colformat_double(), colformat_image(),colformat_int(), colformat_lgl(), colformat_num(), compose(), set_formatter()
Examples
dat <- data.frame(z = Sys.Date() + 1:3,w = Sys.Date() - 1:3)
ft <- flextable(dat)ft <- colformat_date(x = ft)ft <- autofit(ft)ft

44 colformat_datetime
colformat_datetime format datetime cells
Description
Format datetime cells in a flextable.
Usage
colformat_datetime(x,i = NULL,j = NULL,fmt_datetime = get_flextable_defaults()$fmt_datetime,na_str = get_flextable_defaults()$na_str,nan_str = get_flextable_defaults()$nan_str,prefix = "",suffix = ""
)
Arguments
x a flextable object
i rows selection
j columns selection.
fmt_datetime see strptime()
na_str string to be used for NA and NaN values
nan_str string to be used for NA and NaN values
prefix string to be used as prefix or suffix
suffix string to be used as prefix or suffix
Illustrations
See Also
Other cells formatters: colformat_char(), colformat_date(), colformat_double(), colformat_image(),colformat_int(), colformat_lgl(), colformat_num(), compose(), set_formatter()
colformat_double 45
Examples
dat <- data.frame(z = Sys.time() + (1:3)*24,w = Sys.Date() - (1:3)*24)
ft <- flextable(dat)ft <- colformat_datetime(x = ft)ft <- autofit(ft)ft
colformat_double format numeric cells
Description
Format numeric cells in a flextable.
Usage
colformat_double(x,i = NULL,j = NULL,big.mark = get_flextable_defaults()$big.mark,decimal.mark = get_flextable_defaults()$decimal.mark,digits = get_flextable_defaults()$digits,na_str = get_flextable_defaults()$na_str,nan_str = get_flextable_defaults()$nan_str,prefix = "",suffix = ""
)
Arguments
x a flextable object
i rows selection
j columns selection.big.mark, digits, decimal.mark
see formatC()
na_str string to be used for NA and NaN values
nan_str string to be used for NA and NaN values
prefix string to be used as prefix or suffix
suffix string to be used as prefix or suffix
Illustrations

46 colformat_image
See Also
Other cells formatters: colformat_char(), colformat_datetime(), colformat_date(), colformat_image(),colformat_int(), colformat_lgl(), colformat_num(), compose(), set_formatter()
Examples
dat <- mtcarsft <- flextable(head(dat))ft <- colformat_double(x = ft,
big.mark=",", digits = 2, na_str = "N/A")autofit(ft)
colformat_image format cells as images
Description
Format image paths as images in a flextable.
Usage
colformat_image(x,i = NULL,j = NULL,width,height,na_str = get_flextable_defaults()$na_str,nan_str = get_flextable_defaults()$nan_str,prefix = "",suffix = ""
)
Arguments
x a flextable object
i rows selection
j columns selection.
width, height size of the png file in inches
na_str string to be used for NA and NaN values
nan_str string to be used for NA and NaN values
prefix string to be used as prefix or suffix
suffix string to be used as prefix or suffix
colformat_int 47
Illustrations
See Also
Other cells formatters: colformat_char(), colformat_datetime(), colformat_date(), colformat_double(),colformat_int(), colformat_lgl(), colformat_num(), compose(), set_formatter()
Examples
img.file <- file.path( R.home("doc"), "html", "logo.jpg" )
dat <- head(iris)dat$Species <- as.character(dat$Species)dat[c(1, 3, 5), "Species"] <- img.file
myft <- flextable( dat)myft <- colformat_image(
myft, i = c(1, 3, 5),j = "Species", width = .20, height = .15)
ft <- autofit(myft)ft
colformat_int format integer cells
Description
Format integer cells in a flextable.
Usage
colformat_int(x,i = NULL,j = NULL,big.mark = get_flextable_defaults()$big.mark,na_str = get_flextable_defaults()$na_str,nan_str = get_flextable_defaults()$nan_str,prefix = "",suffix = ""
)
Arguments
x a flextable object
i rows selection
48 colformat_lgl
j columns selection.
big.mark see format()
na_str string to be used for NA and NaN values
nan_str string to be used for NA and NaN values
prefix string to be used as prefix or suffix
suffix string to be used as prefix or suffix
See Also
Other cells formatters: colformat_char(), colformat_datetime(), colformat_date(), colformat_double(),colformat_image(), colformat_lgl(), colformat_num(), compose(), set_formatter()
Examples
z <- flextable(head(mtcars))j <- c("vs", "am", "gear", "carb")z <- colformat_int(x = z, j = j, prefix = "# ")z
colformat_lgl format logical cells
Description
Format logical cells in a flextable.
Usage
colformat_lgl(x,i = NULL,j = NULL,true = "true",false = "false",na_str = get_flextable_defaults()$na_str,nan_str = get_flextable_defaults()$nan_str,prefix = "",suffix = ""
)
Arguments
x a flextable object
i rows selection
j columns selection.

colformat_num 49
false, true string to be used for logical
na_str string to be used for NA and NaN values
nan_str string to be used for NA and NaN values
prefix string to be used as prefix or suffix
suffix string to be used as prefix or suffix
See Also
Other cells formatters: colformat_char(), colformat_datetime(), colformat_date(), colformat_double(),colformat_image(), colformat_int(), colformat_num(), compose(), set_formatter()
Examples
dat <- data.frame(a = c(TRUE, FALSE), b = c(FALSE, TRUE))
z <- flextable(dat)z <- colformat_lgl(x = z, j = c("a", "b"))autofit(z)
colformat_num format numeric cells
Description
Format numeric cells in a flextable.
The function is different from colformat_double() on numeric type columns. The function usesthe format() function of R on numeric type columns. So this is normally what you see on the Rconsole most of the time (but scientific mode is disabled, NA are replaced, etc.).
Usage
colformat_num(x,i = NULL,j = NULL,big.mark = get_flextable_defaults()$big.mark,decimal.mark = get_flextable_defaults()$decimal.mark,na_str = get_flextable_defaults()$na_str,nan_str = get_flextable_defaults()$nan_str,prefix = "",suffix = "",...
)

50 colformat_num
Arguments
x a flextable objecti rows selectionj columns selection.big.mark, decimal.mark
see format()
na_str string to be used for NA and NaN valuesnan_str string to be used for NA and NaN valuesprefix string to be used as prefix or suffixsuffix string to be used as prefix or suffix... additional argument for function format(), scientific and digits can not be
used.
format call
Function format() is called with the following values:
• trim is set to TRUE,• scientific is set to FALSE,• big.mark is set to the value of big.mark argument,• decimal.mark is set to the value of decimal.mark argument,• other arguments are passed ’as is’ to the format function.
argument digits is ignored as it is not the same digits that users want, this one will be used byformat() and not formatC(). To change the digit argument use options(digits=4) instead.
This argument will not be changed because colformat_num() is supposed to format things roughlyas what you see on the R console.
If you are not happy with these choices, use set_formatter() and define your own format.
Illustrations
See Also
Other cells formatters: colformat_char(), colformat_datetime(), colformat_date(), colformat_double(),colformat_image(), colformat_int(), colformat_lgl(), compose(), set_formatter()
Examples
dat <- mtcarsdat[2,1] <- NAft <- flextable(head(dat))ft <- colformat_num(x = ft,
big.mark=" ", decimal.mark = ",",na_str = "N/A")
ft <- autofit(ft)ft
color 51
color Set font color
Description
change font color of selected rows and columns of a flextable.
Usage
color(x, i = NULL, j = NULL, color, part = "body", source = j)
Arguments
x a flextable object
i rows selection
j columns selection
color color to use as font color. If a function, function need to return a character vectorof colors.
part partname of the table (one of ’all’, ’body’, ’header’, ’footer’)
source if bg is a function, source is specifying the dataset column to be used as argumentto color. This is only useful if j is colored with values contained in another (orother) column.
Illustrations
See Also
Other sugar functions for table style: align(), bg(), bold(), empty_blanks(), fontsize(),font(), highlight(), italic(), line_spacing(), padding(), rotate(), valign()
Examples
ft <- flextable(head(mtcars))ft <- color(ft, color = "orange", part = "header")ft <- color(ft, color = "red",
i = ~ qsec < 18 & vs < 1 )ft
if(require("scales")){scale <- scales::col_numeric(domain= c(-1, 1), palette ="RdBu")
x <- as.data.frame(cor(iris[-5]))x <- cbind(data.frame(colname = colnames(x),
stringsAsFactors = FALSE),x)

52 colorize
ft_2 <- flextable(x)ft_2 <- color(ft_2, j = x$colname, color = scale)ft_2 <- set_formatter_type(ft_2)ft_2
}
colorize colorize chunk
Description
The function is producing a chunk with a font in color.
Usage
colorize(x, color)
Arguments
x value, if a chunk, the chunk will be updated
color color to use as text highlighting color as character vector.
Note
This is a sugar function that ease the composition of complex labels made of different formattings.It should be used inside a call to as_paragraph().
See Also
Other chunk elements for paragraph: as_bracket(), as_b(), as_chunk(), as_equation(), as_highlight(),as_image(), as_i(), as_sub(), as_sup(), gg_chunk(), hyperlink_text(), linerange(), lollipop(),minibar(), plot_chunk()
Examples
ft <- flextable( head(iris),col_keys = c("Sepal.Length", "dummy") )
ft <- compose(ft, j = "dummy",value = as_paragraph(colorize(Sepal.Length, color = "red")) )
ft

compose 53
compose Define flextable displayed values
Description
Modify flextable displayed values. Function is handling complex formatting as well as image in-sertion.
Function mk_par is another name for compose as there is an unwanted conflict with package purrr.
Usage
compose(x, i = NULL, j = NULL, value, part = "body", use_dot = FALSE)
mk_par(x, i = NULL, j = NULL, value, part = "body", use_dot = FALSE)
Arguments
x a flextable object
i rows selection
j column selection
value a call to function as_paragraph().
part partname of the table (one of ’all’, ’body’, ’header’, ’footer’)
use_dot by default use_dot=FALSE; if use_dot=TRUE, value is evaluated within a data.frameaugmented of a column named . containing the jth column.
Illustrations
See Also
Other cells formatters: colformat_char(), colformat_datetime(), colformat_date(), colformat_double(),colformat_image(), colformat_int(), colformat_lgl(), colformat_num(), set_formatter()
Examples
library(officer)ft <- flextable(head( mtcars, n = 10))ft <- compose(ft, j = "carb", i = ~ drat > 3.5,
value = as_paragraph("carb is ", as_chunk( sprintf("%.1f", carb)) ))
ft <- autofit(ft)

54 continuous_summary
continuous_summary continuous columns summary
Description
create a data.frame summary for continuous variables
Usage
continuous_summary(dat,columns = NULL,by = character(0),hide_grouplabel = TRUE,digits = 3
)
Arguments
dat a data.frame
columns continuous variables to be summarized. If NULL all continuous variables aresummarized.
by discrete variables to use as groups when summarizing.
hide_grouplabel
if TRUE, group label will not be rendered, only level/value will be rendered.
digits the desired number of digits after the decimal point
Illustrations
Examples
ft_1 <- continuous_summary(iris, names(iris)[1:4], by = "Species",hide_grouplabel = FALSE)
ft_1

delete_part 55
delete_part delete flextable part
Description
indicate to not print a part of the flextable, i.e. an header, footer or the body.
Usage
delete_part(x, part = "header")
Arguments
x a flextable object
part partname of the table to delete (one of ’body’, ’header’ or ’footer’).
Illustrations
Examples
ft <- flextable( head( iris ) )ft <- delete_part(x = ft, part = "header")ft
df_printer data.frame automatic printing as a flextable
Description
Create a summary from a data.frame as a flextable. This function is to be used in an R Markdowndocument.
To use that function, you must declare it in the part df_print of the ’YAML’ header of your RMarkdown document:
---df_print: !expr function(x) flextable::df_printer(x)---
We notice an unexpected behavior with bookdown. When using bookdown it is necessary to useuse_df_printer() instead in a setup run chunk:
use_df_printer()
56 dim.flextable
Usage
df_printer(dat, ...)
Arguments
dat the data.frame
... unused argument
Details
’knitr’ chunk options are available to customize the output:
• ft_max_row: The number of rows to print. Default to 10.
• ft_split_colnames: Should the column names be split (with non alpha-numeric characters).Default to FALSE.
• ft_short_strings: Should the character column be shorten. Default to FALSE.
• ft_short_size: Maximum length of character column if ft_short_strings is TRUE. De-fault to 35.
• ft_short_suffix: Suffix to add when character values are shorten. Default to "...".
• ft_do_autofit: Use autofit() before rendering the table. Default to TRUE.
• ft_show_coltype: Show column types. Default to TRUE.
• ft_color_coltype: Color to use for column types. Default to "#999999".
See Also
Other flextable print function: as_raster(), flextable_to_rmd(), htmltools_value(), knit_print.flextable(),plot.flextable(), print.flextable(), save_as_docx(), save_as_html(), save_as_image(),save_as_pptx()
Examples
df_printer(head(mtcars))
dim.flextable Get widths and heights of flextable
Description
returns widths and heights for each table columns and rows. Values are expressed in inches.
Usage
## S3 method for class 'flextable'dim(x)

dim_pretty 57
Arguments
x flextable object
See Also
Other flextable dimensions: autofit(), dim_pretty(), fit_to_width(), flextable_dim(),height(), hrule(), ncol_keys(), nrow_part(), set_table_properties(), width()
Examples
ftab <- flextable(head(iris))dim(ftab)
dim_pretty Calculate pretty dimensions
Description
return minimum estimated widths and heights for each table columns and rows in inches.
Usage
dim_pretty(x, part = "all", unit = "in")
Arguments
x flextable object
part partname of the table (one of ’all’, ’body’, ’header’ or ’footer’)
unit unit for returned values, one of "in", "cm", "mm".
line breaks
Soft returns (a line break in a paragraph) are not supported. Function dim_pretty will return wrongresults if \n are used (they will be considered as "").
See Also
Other flextable dimensions: autofit(), dim.flextable(), fit_to_width(), flextable_dim(),height(), hrule(), ncol_keys(), nrow_part(), set_table_properties(), width()
Examples
ftab <- flextable(head(mtcars))dim_pretty(ftab)
58 empty_blanks
empty_blanks make blank columns as transparent
Description
blank columns are set as transparent. This is a shortcut function that will delete top and bottomborders, change background color to transparent, display empty content and set blank columns’width.
Usage
empty_blanks(x, width = 0.05, unit = "in", part = "all")
Arguments
x a flextable object
width width of blank columns (.1 inch by default).
unit unit for width, one of "in", "cm", "mm".
part partname of the table (one of ’all’, ’body’, ’header’, ’footer’)
See Also
Other sugar functions for table style: align(), bg(), bold(), color(), fontsize(), font(),highlight(), italic(), line_spacing(), padding(), rotate(), valign()
Examples
typology <- data.frame(col_keys = c( "Sepal.Length", "Sepal.Width", "Petal.Length",
"Petal.Width", "Species" ),what = c("Sepal", "Sepal", "Petal", "Petal", " "),measure = c("Length", "Width", "Length", "Width", "Species"),stringsAsFactors = FALSE )
typology
ftab <- flextable(head(iris), col_keys = c("Species","break1", "Sepal.Length", "Sepal.Width","break2", "Petal.Length", "Petal.Width") )
ftab <- set_header_df(ftab, mapping = typology, key = "col_keys" )ftab <- merge_h(ftab, part = "header")ftab <- theme_vanilla(ftab)ftab <- empty_blanks(ftab)ftab <- width(ftab, j = c(2, 5), width = .1 )ftab
fit_to_width 59
fit_to_width fit a flextable to a maximum width
Description
decrease font size for each cell incrementally until it fits a given max_width.
Usage
fit_to_width(x, max_width, inc = 1L, max_iter = 20, unit = "in")
Arguments
x flextable object
max_width maximum width to fit in inches
inc the font size decrease for each step
max_iter maximum iterations
unit unit for max_width, one of "in", "cm", "mm".
Illustrations
See Also
Other flextable dimensions: autofit(), dim.flextable(), dim_pretty(), flextable_dim(),height(), hrule(), ncol_keys(), nrow_part(), set_table_properties(), width()
Examples
ft_1 <- qflextable(head(mtcars))ft_1 <- width(ft_1, width = 1)ft_1
ft_2 <- fit_to_width(ft_1, max_width = 4)ft_2

60 flextable
fix_border_issues fix border issues when cell are merged
Description
When cells are merged, the rendered borders will be those of the first cell. If a column is made ofthree merged cells, the bottom border that will be seen will be the bottom border of the first cell inthe column. From a user point of view, this is wrong, the bottom should be the one defined for cell3. This function modify the border values to avoid that effect.
Usage
fix_border_issues(x, part = "all")
Arguments
x flextable object
part partname of the table (one of ’all’, ’body’, ’header’, ’footer’)
Examples
library(officer)dat <- data.frame(a = 1:5, b = 6:10)ft <- flextable(dat)
ft <- theme_box(ft)ft <- merge_at(ft, i = 4:5, j = 1, part = "body")ft <- hline(ft, i = 5, part = "body",
border = fp_border(color = "red", width = 5) )print(ft)ft <- fix_border_issues(ft)print(ft)
flextable flextable creation
Description
Create a flextable object with function flextable.
flextable are designed to make tabular reporting easier for R users. Functions are available to letyou format text, paragraphs and cells; table cells can be merge vertically or horizontally, row head-ers can easilly be defined, rows heights and columns widths can be manually set or automaticallycomputed.
Default formatting properties are automatically applied to every flextable you produce. You canchange these default values with function set_flextable_defaults().
flextable 61
Usage
flextable(data,col_keys = names(data),cwidth = 0.75,cheight = 0.25,defaults = list(),theme_fun = theme_booktabs
)
qflextable(data)
regulartable(data, col_keys = names(data), cwidth = 0.75, cheight = 0.25)
Arguments
data dataset
col_keys columns names/keys to display. If some column names are not in the dataset,they will be added as blank columns by default.
cwidth, cheight
initial width and height to use for cell sizes in inches.defaults, theme_fun
deprecated, use set_flextable_defaults() instead.
Details
A flextable is made of 3 parts: header, body and footer.
Most functions have an argument named part that will be used to specify what part of of the tableshould be modified.
If working with R Markdown document, you should read about knitr chunk options in knit_print.flextable()and about setting default values with set_flextable_defaults().
Illustrations
qflextable
qflextable is a convenient tool to produce quickly a flextable for reporting where layoout is fixedand columns widths adjusted with autofit().
Note
Function regulartable is maintained for compatibility with old codes mades by users but be awareit produces the same exact object than flextable. This function should be deprecated then removedin the next versions.
62 flextable_dim
See Also
style(), autofit(), theme_booktabs(), knit_print.flextable(), compose(), footnote(),set_caption()
Examples
ft <- flextable(head(mtcars))ft
flextable_dim width and height of a flextable object
Description
Returns the width, height and aspect ratio of a flextable in a named list. The aspect ratio is the ratiocorresponding to height/width.
Names of the list are width, height and aspect_ratio.
Usage
flextable_dim(x, unit = "in")
Arguments
x a flextable object
unit unit for returned values, one of "in", "cm", "mm".
See Also
Other flextable dimensions: autofit(), dim.flextable(), dim_pretty(), fit_to_width(),height(), hrule(), ncol_keys(), nrow_part(), set_table_properties(), width()
Examples
ftab <- flextable(head(iris))flextable_dim(ftab)ftab <- autofit(ftab)flextable_dim(ftab)
flextable_html_dependency 63
flextable_html_dependency
htmlDependency for flextable objects
Description
When using loops in an R Markdown for HTML document, the htmlDependency object for flextablemust also be added at least once.
Usage
flextable_html_dependency()
Examples
if(require("htmltools"))div(flextable_html_dependency())
flextable_to_rmd flextable raw code
Description
Print openxml, latex or html code of a flextable. The function is particularly useful when you wantto generate flextable in a loop from a R Markdown document.
Inside R Markdown document, chunk option results must be set to ’asis’.
All arguments whose name starts with ft. can be set in the chunk options.
See knit_print.flextable for more details.
Usage
flextable_to_rmd(x,ft.align = opts_current$get("ft.align"),ft.split = opts_current$get("ft.split"),ft.keepnext = opts_current$get("ft.keepnext"),ft.tabcolsep = opts_current$get("ft.tabcolsep"),ft.arraystretch = opts_current$get("ft.arraystretch"),ft.left = opts_current$get("ft.left"),ft.top = opts_current$get("ft.top"),text_after = "",webshot = opts_current$get("webshot"),bookdown = FALSE,pandoc2 = TRUE,print = TRUE,...
)
64 flextable_to_rmd
Arguments
x a flextable object
ft.align flextable alignment, supported values are ’left’, ’center’ and ’right’.
ft.split Word option ’Allow row to break across pages’ can be activated when TRUE.
ft.keepnext Word option ’keep rows together’ can be activated when TRUE. It avoids pagebreak within tables.
ft.tabcolsep space between the text and the left/right border of its containing cell, the defaultvalue is 8 points.
ft.arraystretch
height of each row relative to its default height, the default value is 1.5.ft.left, ft.top
Position should be defined with options ft.left and ft.top. Theses are thetop left coordinates in inches of the placeholder that will contain the table. Theirdefault values are 1 and 2 inches.
text_after The string you put here will be added after printing the content of the flextable.For example, you can put "\\pagebreak" here to have tables produced with pagebreaks.
webshot webshot package as a scalar character, one of "webshot" or "webshot2".
bookdown TRUE or FALSE (default) to support cross referencing with bookdown.
pandoc2 TRUE (default) or FALSE to get the string in a pandoc raw HTML attribute (onlyvalid when pandoc version is >= 2.
print print output if TRUE
... unused arguments
See Also
Other flextable print function: as_raster(), df_printer(), htmltools_value(), knit_print.flextable(),plot.flextable(), print.flextable(), save_as_docx(), save_as_html(), save_as_image(),save_as_pptx()
Examples
demo_loop <- system.file(package = "flextable", "examples/rmd", "loop_with_flextable.Rmd")rmd_file <- tempfile(fileext = ".Rmd")file.copy(demo_loop, to = rmd_file, overwrite = TRUE)rmd_file # R Markdown document used for demoif(require("rmarkdown", quietly = TRUE)){# render(input = rmd_file, output_format = "word_document",# output_file = "loop_with_flextable.docx")# render(input = rmd_file, output_format = "html_document",# output_file = "loop_with_flextable.html")# render(input = rmd_file,# output_format = rmarkdown::pdf_document(latex_engine = "xelatex"),# output_file = "loop_with_flextable.pdf")}

fmt_2stats 65
fmt_2stats format content for data generated with summarizor()
Description
This function was written to allow easy demonstrations of flextable’s ability to produce table sum-maries (with summarizor()). It assumes that we have either a quantitative variable, in which casewe will display the mean and the standard deviation, or a qualitative variable, in which case we willdisplay the count and the percentage corresponding to each modality.
Usage
fmt_2stats(num1,num2,cts,pcts,num1_mask = "%.01f",num2_mask = "(%.01f)",cts_mask = "%.0f",pcts_mask = "(%.02f %%)"
)
Arguments
num1 a numeric statistic to display such as a mean or a median
num2 a numeric statistic to display such as a standard deviation or a median absolutedeviation.
cts a count to display
pcts a percentage to display
num1_mask format associated with num1, a format string used by sprintf().
num2_mask format associated with num2, a format string used by sprintf().
cts_mask format associated with cts, a format string used by sprintf().
pcts_mask format associated with pcts, a format string used by sprintf().
See Also
summarizor(), tabulator(), mk_par()

66 font
font Set font
Description
change font of selected rows and columns of a flextable.
Usage
font(x,i = NULL,j = NULL,fontname,part = "body",cs.family = fontname,hansi.family = fontname,eastasia.family = fontname
)
Arguments
x a flextable object
i rows selection
j columns selection
fontname single character value. With Word and PowerPoint output, the value specifies thefont to be used to format characters in the Unicode range (U+0000-U+007F).
part partname of the table (one of ’all’, ’body’, ’header’, ’footer’)
cs.family Optional font to be used to format characters in a complex script Unicode range.For example, Arabic text might be displayed using the "Arial Unicode MS" font.Used only with Word and PowerPoint outputs. Its default value is the value offontname.
hansi.family optional. Specifies the font to be used to format characters in a Unicode rangewhich does not fall into one of the other categories. Used only with Word andPowerPoint outputs. Its default value is the value of fontname.
eastasia.family
optional font to be used to format characters in an East Asian Unicode range.For example, Japanese text might be displayed using the "MS Mincho" font.Used only with Word and PowerPoint outputs. Its default value is the value offontname.
Illustrations

fontsize 67
See Also
Other sugar functions for table style: align(), bg(), bold(), color(), empty_blanks(), fontsize(),highlight(), italic(), line_spacing(), padding(), rotate(), valign()
Examples
require("gdtools")fontname <- "Brush Script MT"
if( font_family_exists(fontname) ){ft_1 <- flextable(head(iris))ft_2 <- font(ft_1, fontname = fontname, part = "header")ft_2 <- font(ft_2, fontname = fontname, j = 5)ft_2
}
fontsize Set font size
Description
change font size of selected rows and columns of a flextable.
Usage
fontsize(x, i = NULL, j = NULL, size = 11, part = "body")
Arguments
x a flextable object
i rows selection
j columns selection
size integer value (points)
part partname of the table (one of ’all’, ’body’, ’header’, ’footer’)
Illustrations
See Also
Other sugar functions for table style: align(), bg(), bold(), color(), empty_blanks(), font(),highlight(), italic(), line_spacing(), padding(), rotate(), valign()
68 footnote
Examples
ft <- flextable(head(iris))ft <- fontsize(ft, size = 14, part = "header")ft <- fontsize(ft, size = 14, j = 2)ft <- fontsize(ft, size = 7, j = 3)ft
footers_flextable_at_bkm
add flextable at a bookmark location in document’s footer
Description
replace in the footer of a document a paragraph containing a bookmark by a flextable. A bookmarkwill be considered as valid if enclosing words within a paragraph; i.e., a bookmark along two ormore paragraphs is invalid, a bookmark set on a whole paragraph is also invalid, but bookmarkingfew words inside a paragraph is valid.
Usage
footers_flextable_at_bkm(x, bookmark, value)
Arguments
x an rdocx objectbookmark bookmark idvalue a flextable object
footnote add footnotes to flextable
Description
add footnotes to a flextable object. A symbol is appened where the footnote is defined and the noteis appened in the footer part of the table.
Usage
footnote(x,i = NULL,j = NULL,value,ref_symbols = NULL,part = "body",inline = FALSE,sep = "; "
)

footnote 69
Arguments
x a flextable object
i rows selection
j column selection
value a call to function as_paragraph().
ref_symbols character value, symbols to append that will be used as references to notes.
part partname of the table (one of ’body’, ’header’, ’footer’)
inline whether to add footnote on same line as previous footnote or not
sep inline = T, character string to use as a separator between footnotes
Illustrations
Examples
ft_1 <- flextable(head(iris))ft_1 <- footnote( ft_1, i = 1, j = 1:3,
value = as_paragraph(c("This is footnote one",
"This is footnote two","This is footnote three")
),ref_symbols = c("a", "b", "c"),part = "header")
ft_1 <- valign(ft_1, valign = "bottom", part = "header")ft_1 <- autofit(ft_1)
ft_2 <- flextable(head(iris))ft_2 <- autofit(ft_2)ft_2 <- footnote( ft_2, i = 1, j = 1:2,
value = as_paragraph(c("This is footnote one",
"This is footnote two")),ref_symbols = c("a", "b"),part = "header", inline = TRUE)
ft_2 <- footnote( ft_2, i = 1, j = 3:4,value = as_paragraph(
c("This is footnote three","This is footnote four")
),ref_symbols = c("c","d"),part = "header", inline = TRUE)
ft_2
70 fp_text_default
fp_border_default Border formatting properties
Description
Create a fp_border() object that uses defaut values defined in flextable defaults formatting prop-erties, i.e. default border color (see set_flextable_defaults()).
Usage
fp_border_default(color = flextable_global$defaults$border.color,style = "solid",width = 1
)
Arguments
color border color - single character value (e.g. "#000000" or "black")
style border style - single character value : "none" or "solid" or "dotted" or "dashed"
width border width - an integer value : 0>= value
See Also
hline(), vline()
Other functions for defining formatting properties: fp_text_default()
Examples
fp_border_default(width = 2)
fp_text_default Text formatting properties
Description
Create a fp_text() object that uses defaut values defined in flextable defaults formatting prop-erties, i.e. default font color, font size and font family (see set_flextable_defaults()). (seeset_flextable_defaults()).

fp_text_default 71
Usage
fp_text_default(color = flextable_global$defaults$font.color,font.size = flextable_global$defaults$font.size,bold = FALSE,italic = FALSE,underlined = FALSE,font.family = flextable_global$defaults$font.family,cs.family = NULL,eastasia.family = NULL,hansi.family = NULL,vertical.align = "baseline",shading.color = "transparent"
)
Arguments
color font color - a single character value specifying a valid color (e.g. "#000000" or"black").
font.size font size (in point) - 0 or positive integer value.
bold is bold
italic is italic
underlined is underlined
font.family single character value. Specifies the font to be used to format characters in theUnicode range (U+0000-U+007F).
cs.family optional font to be used to format characters in a complex script Unicode range.For example, Arabic text might be displayed using the "Arial Unicode MS" font.
eastasia.family
optional font to be used to format characters in an East Asian Unicode range.For example, Japanese text might be displayed using the "MS Mincho" font.
hansi.family optional. Specifies the font to be used to format characters in a Unicode rangewhich does not fall into one of the other categories.
vertical.align single character value specifying font vertical alignments. Expected value is oneof the following : default 'baseline' or 'subscript' or 'superscript'
shading.color shading color - a single character value specifying a valid color (e.g. "#000000"or "black").
See Also
as_chunk()
Other functions for defining formatting properties: fp_border_default()
Examples
fp_text_default(bold = TRUE)

72 gg_chunk
get_flextable_defaults
Get flextable defaults formatting properties
Description
The current formatting properties are automatically applied to every flextable you produce. Thesedefault values are returned by this function.
Usage
get_flextable_defaults()
Value
a list containing default values.
See Also
Other functions related to themes: set_flextable_defaults(), theme_alafoli(), theme_booktabs(),theme_box(), theme_tron_legacy(), theme_tron(), theme_vader(), theme_vanilla(), theme_zebra()
Examples
get_flextable_defaults()
gg_chunk gg plots chunk wrapper
Description
This function is used to insert mini gg plots into flextable with function compose(). It should beused inside a call to as_paragraph().
Usage
gg_chunk(value, width = 1, height = 0.2, unit = "in")
Arguments
value gg objects, stored in a list column.
width, height size of the resulting png file in inches
unit unit for width and height, one of "in", "cm", "mm".
headers_flextable_at_bkm 73
Illustrations
Note
This chunk option requires package officedown in a R Markdown context with Word output format.
PowerPoint cannot mix images and text in a paragraph, images are removed when outputing toPowerPoint format.
See Also
Other chunk elements for paragraph: as_bracket(), as_b(), as_chunk(), as_equation(), as_highlight(),as_image(), as_i(), as_sub(), as_sup(), colorize(), hyperlink_text(), linerange(), lollipop(),minibar(), plot_chunk()
Examples
library(data.table)library(flextable)if(require("ggplot2")){
my_cor_plot <- function(x){cols <- colnames(x)[sapply(x, is.numeric)]x <- x[, .SD, .SDcols = cols]cormat <- as.data.table(cor(x))cormat$var1 <- colnames(cormat)cormat <- melt(cormat, id.vars = "var1", measure.vars = cormat$var1,
variable.name = "var2", value.name = "correlation")ggplot(data = cormat, aes(x=var1, y=var2, fill=correlation)) +
geom_tile() + coord_equal() +scale_fill_gradient2(low = "blue",
mid = "white", high = "red", limits = c(-1, 1),guide = FALSE) + theme_void()
}z <- as.data.table(iris)z <- z[ , list(gg = list(my_cor_plot(.SD))), by = "Species"]ft <- flextable(z)ft <- mk_par(ft, j = "gg",
value = as_paragraph(gg_chunk(value = gg, width = 1, height = 1)
))ft
}
headers_flextable_at_bkm
add flextable at a bookmark location in document’s header

74 height
Description
replace in the header of a document a paragraph containing a bookmark by a flextable. A bookmarkwill be considered as valid if enclosing words within a paragraph; i.e., a bookmark along two ormore paragraphs is invalid, a bookmark set on a whole paragraph is also invalid, but bookmarkingfew words inside a paragraph is valid.
Usage
headers_flextable_at_bkm(x, bookmark, value)
Arguments
x an rdocx object
bookmark bookmark id
value a flextable object
height Set flextable rows height
Description
control rows height for a part of the flextable when the line height adjustment is "atleast" or "exact"(see hrule()).
Usage
height(x, i = NULL, height, part = "body", unit = "in")
height_all(x, height, part = "all", unit = "in")
Arguments
x flextable object
i rows selection
height height in inches
part partname of the table
unit unit for height, one of "in", "cm", "mm".
Illustrations
height_all
height_all is a convenient function for setting the same height to all rows (selected with argumentpart).
highlight 75
Note
This function has no effect when the rule for line height is set to "auto" (see hrule()), which is thedefault case, except with PowerPoint which does not support this automatic line height adjustmentfeature.
See Also
Other flextable dimensions: autofit(), dim.flextable(), dim_pretty(), fit_to_width(),flextable_dim(), hrule(), ncol_keys(), nrow_part(), set_table_properties(), width()
Examples
ft_1 <- flextable(head(iris))ft_1 <- height(ft_1, height = .5)ft_1 <- hrule(ft_1, rule = "exact")ft_1
ft_2 <- flextable(head(iris))ft_2 <- height_all(ft_2, height = 1)ft_2 <- hrule(ft_2, rule = "exact")ft_2
highlight Text Highlight Color
Description
change text highlight color of selected rows and columns of a flextable.
Usage
highlight(x, i = NULL, j = NULL, color = "yellow", part = "body", source = j)
Arguments
x a flextable object
i rows selection
j columns selection
color color to use as text highlighting color. If a function, function need to return acharacter vector of colors.
part partname of the table (one of ’all’, ’body’, ’header’, ’footer’)
source if color is a function, source is specifying the dataset column to be used asargument to color. This is only useful if j is colored with values contained inanother (or other) column.

76 hline
Illustrations
See Also
Other sugar functions for table style: align(), bg(), bold(), color(), empty_blanks(), fontsize(),font(), italic(), line_spacing(), padding(), rotate(), valign()
Examples
my_color_fun <- function(x){out <- rep("yellow", length(x))out[x < quantile(x, .75)] <- "pink"out[x < quantile(x, .50)] <- "wheat"out[x < quantile(x, .25)] <- "gray90"out
}ft <- flextable(head( mtcars, n = 10))ft <- highlight(ft, j = "disp", i = ~ disp > 200, color = "yellow")ft <- highlight(ft, j = ~ drat + wt + qsec, color = my_color_fun)ft
hline set horizontal borders
Description
The function is applying an horizontal border to inner content of one or all parts of a flextable. Thelines are the bottom borders of selected cells.
Usage
hline(x, i = NULL, j = NULL, border = NULL, part = "body")
Arguments
x a flextable object
i rows selection
j columns selection
border border properties defined by a call to fp_border()
part partname of the table (one of ’all’, ’body’, ’header’, ’footer’)
Illustrations
hline_bottom 77
See Also
Other borders management: border_inner_h(), border_inner_v(), border_inner(), border_outer(),border_remove(), hline_bottom(), hline_top(), surround(), vline_left(), vline_right(),vline()
Examples
library(officer)std_border = fp_border(color="gray")
ft <- flextable(head(iris))ft <- border_remove(x = ft)
# add horizontal bordersft <- hline(ft, part="all", border = std_border )ft
hline_bottom set bottom horizontal border
Description
The function is applying an horizontal border to the bottom of one or all parts of a flextable. Theline is the bottom border of selected parts.
Usage
hline_bottom(x, j = NULL, border = NULL, part = "body")
Arguments
x a flextable object
j columns selection
border border properties defined by a call to fp_border()
part partname of the table (one of ’all’, ’body’, ’header’, ’footer’)
Illustrations
See Also
Other borders management: border_inner_h(), border_inner_v(), border_inner(), border_outer(),border_remove(), hline_top(), hline(), surround(), vline_left(), vline_right(), vline()
78 hline_top
Examples
library(officer)big_border = fp_border(color="orange", width = 3)
ft <- flextable(head(iris))ft <- border_remove(x = ft)
# add/replace horizontal border on bottomft <- hline_bottom(ft, part="body", border = big_border )ft
hline_top set top horizontal border
Description
The function is applying an horizontal border to the top of one or all parts of a flextable. The line isthe top border of selected parts.
Usage
hline_top(x, j = NULL, border = NULL, part = "body")
Arguments
x a flextable object
j columns selection
border border properties defined by a call to fp_border()
part partname of the table (one of ’all’, ’body’, ’header’, ’footer’)
Illustrations
See Also
Other borders management: border_inner_h(), border_inner_v(), border_inner(), border_outer(),border_remove(), hline_bottom(), hline(), surround(), vline_left(), vline_right(), vline()
Examples
library(officer)big_border = fp_border(color="orange", width = 3)
ft <- flextable(head(iris))ft <- border_remove(x = ft)
# add horizontal border on top
hrule 79
ft <- hline_top(ft, part="all", border = big_border )ft
hrule Set flextable rule for rows heights
Description
control rules of each height for a part of the flextable, this is only for Word and PowerPoint outputs,it will not have any effect when output is HTML.
Usage
hrule(x, i = NULL, rule = "auto", part = "body")
Arguments
x flextable object
i rows selection
rule specify the meaning of the height. Possible values are "atleast" (height shouldbe at least the value specified), "exact" (height should be exactly the value spec-ified), or the default value "auto" (height is determined based on the height ofthe contents, so the value is ignored).
part partname of the table, one of "all", "header", "body", "footer"
Illustrations
See Also
Other flextable dimensions: autofit(), dim.flextable(), dim_pretty(), fit_to_width(),flextable_dim(), height(), ncol_keys(), nrow_part(), set_table_properties(), width()
Examples
ft_1 <- flextable(head(iris))ft_1 <- width(ft_1, width = 1.5)ft_1 <- height(ft_1, height = 0.75, part = "header")ft_1 <- hrule(ft_1, rule = "exact", part = "header")ft_1
ft_2 <- hrule(ft_1, rule = "auto", part = "header")ft_2

80 hyperlink_text
htmltools_value flextable as an HTML object
Description
get a div() from a flextable object. This can be used in a shiny application. For an output within"R Markdown" document, use knit_print.flextable.
Usage
htmltools_value(x, ft.align = "center", ft.shadow = TRUE)
Arguments
x a flextable object
ft.align flextable alignment, supported values are ’left’, ’center’ and ’right’.
ft.shadow use shadow dom, this option is existing to disable shadow dom (set to FALSE)for pagedown that can not support it for now.
Value
an object marked as HTML ready to be used within a call to shiny::renderUI for example.
See Also
Other flextable print function: as_raster(), df_printer(), flextable_to_rmd(), knit_print.flextable(),plot.flextable(), print.flextable(), save_as_docx(), save_as_html(), save_as_image(),save_as_pptx()
Examples
htmltools_value(flextable(iris[1:5,]))
hyperlink_text chunk of text with hyperlink wrapper
Description
The function lets add hyperlinks within flextable objects with function compose(). It should beused inside a call to as_paragraph().
Usage
hyperlink_text(x, props = NULL, formatter = format_fun, url, ...)

italic 81
Arguments
x text or any element that can be formatted as text with function provided in argu-ment formatter.
props an officer::fp_text() object to be used to format the text. If not specified, itwill be the default value corresponding to the cell.
formatter a function that will format x as a character vector.
url url to be used
... additional arguments for formatter function.
Note
This chunk option requires package officedown in a R Markdown context with Word output format.
See Also
compose()
Other chunk elements for paragraph: as_bracket(), as_b(), as_chunk(), as_equation(), as_highlight(),as_image(), as_i(), as_sub(), as_sup(), colorize(), gg_chunk(), linerange(), lollipop(),minibar(), plot_chunk()
Examples
dat <- data.frame(col = "Google it",href = "https://www.google.fr/search?source=hp&q=flextable+R+package",stringsAsFactors = FALSE)
ftab <- flextable(dat)ftab <- compose( x = ftab, j = "col",
value = as_paragraph("This is a link: ",hyperlink_text(x = col, url = href ) ) )
ftab
italic Set italic font
Description
change font decoration of selected rows and columns of a flextable.
Usage
italic(x, i = NULL, j = NULL, italic = TRUE, part = "body")

82 knit_print.flextable
Arguments
x a flextable object
i rows selection
j columns selection
italic boolean value
part partname of the table (one of ’all’, ’body’, ’header’, ’footer’)
Illustrations
See Also
Other sugar functions for table style: align(), bg(), bold(), color(), empty_blanks(), fontsize(),font(), highlight(), line_spacing(), padding(), rotate(), valign()
Examples
ft <- flextable(head(mtcars))ft <- italic(ft, italic = TRUE, part = "header")
knit_print.flextable Render flextable in rmarkdown
Description
Function used to render flextable in knitr/rmarkdown documents.
You should not call this method directly. This function is used by the knitr package to automaticallydisplay a flextable in an "R Markdown" document from a chunk. However, it is recommended toread its documentation in order to get familiar with the different options available.
R Markdown outputs can be :
• HTML
• ’Microsoft Word’
• ’Microsoft PowerPoint’
Table captioning is a flextable feature compatible with R Markdown documents. The feature isavailable for HTML, PDF and Word documents. Compatibility with the "bookdown" package isalso ensured, including the ability to produce captions so that they can be used in cross-referencing.
For Word, it’s recommanded to work with package ’officedown’ that supports all features of flextable.
Usage
## S3 method for class 'flextable'knit_print(x, ...)
knit_print.flextable 83
Arguments
x a flextable object
... arguments passed to flextable_to_rmd().
Chunk options
Some features, often specific to an output format, are available to help you configure some globalsettings relatve to the table output. knitr’s chunk options are to be used to change the default settings:
chunk option property default value HTML docx PDF pptxft.align flextable alignment, supported values are ’left’, ’center’ and ’right’ ’center’ yes yes yes noft.shadow HTML option, disable shadow dom (set to FALSE) for pagedown. TRUE yes no no noft.split Word option ’Allow row to break across pages’ can be activated when TRUE. FALSE no yes no noft.keepnext Word option ’keep rows together’ can be activated when TRUE. TRUE no yes no noft.tabcolsep space between the text and the left/right border of its containing cell 8.0 no no yes noft.arraystretch height of each row relative to its default height 1.5 no no yes noft.left left coordinates in inches 1.0 no no no yesft.top top coordinates in inches 2.0 no no no yes
Table caption
Captions can be defined in two ways.
The first is with the set_caption function. If it is used, the other method will be ignored. Thesecond method is by using knitr chunk option tab.cap.
set_caption(x, caption = "my caption")
If set_caption function is not used, caption identifier will be read from knitr’s chunk optiontab.id. Note that in a bookdown and when not using officedown::rdocx_document(), the usualnumbering feature of bookdown is used.
tab.id='my_id'.
Some options are available to customise captions for any output:
label name valueWord stylename to use for table captions. tab.cap.style NULLcaption id/bookmark tab.id NULLcaption tab.cap NULLdisplay table caption on top of the table or not tab.topcaption TRUEcaption table sequence identifier. tab.lp "tab:"
Word output when officedown::rdocx_document() is used is coming with more options such asability to choose the prefix for numbering chunk for example. The table below expose these options:
label name valueprefix for numbering chunk (default to "Table "). tab.cap.pre Tablesuffix for numbering chunk (default to ": "). tab.cap.sep " :"

84 knit_print.flextable
title number depth tab.cap.tnd 0caption prefix formatting properties tab.cap.fp_text fp_text_lite(bold = TRUE)separator to use between title number and table number. tab.cap.tns "-"
HTML output
HTML output is using shadow dom to encapsule the table into an isolated part of the page so thatno clash happens with styles. Some output may not support this feature. To our knowledge, onlythe pagedown output is concerned. Use knitr chunk option ft.shadow=FALSE to disable shadowdom.
If ft.shadow=TRUE some global CSS rules may change the desired output of flextables.
PDF output
Some features are not implemented in PDF due to technical infeasibility. These are the padding,line_spacing and height properties.
Background color and merged cells are also sources of trouble with PDF format. Authors are hopingto fix these issues in the future.
See add_latex_dep() if caching flextable results in ’R Markdown’ documents.
PowerPoint output
Auto-adjust Layout is not available for PowerPoint, PowerPoint only support fixed layout. It’s thenoften necessary to call function autofit() so that the columns’ widths are adjusted if user does notprovide the withs.
Images cannot be integrated into tables with the PowerPoint format.
Note
Supported formats require some minimum pandoc versions:
Output format pandoc minimal versionHTML >= 1.12
Word (docx) >= 2.0PowerPoint (pptx) >= 2.4
PDF >= 1.12
See Also
Other flextable print function: as_raster(), df_printer(), flextable_to_rmd(), htmltools_value(),plot.flextable(), print.flextable(), save_as_docx(), save_as_html(), save_as_image(),save_as_pptx()
Examples
# simple examples -----
knit_print.flextable 85
demo_docx <- system.file(package = "flextable", "examples/rmd", "demo.Rmd")rmd_file <- tempfile(fileext = ".Rmd")file.copy(demo_docx, to = rmd_file, overwrite = TRUE)rmd_file # R Markdown document used for demoif(require("rmarkdown", quietly = TRUE)){# knitr::opts_chunk$set(webshot = "webshot2")# render(input = rmd_file, output_format = "word_document", output_file = "doc.docx")# render(input = rmd_file, output_format = "pdf_document", output_file = "doc.pdf")# render(input = rmd_file, output_format = "html_document", output_file = "doc.html")# render(input = rmd_file, output_format = "powerpoint_presentation", output_file = "pres.pptx")# render(input = rmd_file, output_format = "slidy_presentation", output_file = "slidy.html")# render(input = rmd_file, output_format = "beamer_presentation", output_file = "beamer.pdf")# render(input = rmd_file, output_format = "pagedown::html_paged", output_file = "paged.html")}
## bookdown examples wth captions and cross ref -----# captions_example <- system.file(# package = "flextable",# "examples/rmd", "captions_example.Rmd")## dir_tmp <- tempfile(pattern = "dir")# dir.create(dir_tmp, showWarnings = FALSE, recursive = TRUE)# file.copy(captions_example, dir_tmp)# rmd_file <- file.path(dir_tmp, basename(captions_example))## file.copy(captions_example, to = rmd_file, overwrite = TRUE)## if(require("rmarkdown", quietly = TRUE)){# render(input = rmd_file,# output_format = word_document(),# output_file = "doc.docx")# render(input = rmd_file,# output_format = pdf_document(latex_engine = "xelatex"),# output_file = "doc.pdf")# render(input = rmd_file,# output_format = html_document(),# output_file = "doc.html")## # bookdown ----# if(require("bookdown", quietly = TRUE)){# render(input = rmd_file, output_format = word_document2(),# output_file = "book.docx")# render(input = rmd_file,# output_format = pdf_document2(latex_engine = "xelatex"),# output_file = "book.pdf")# render(input = rmd_file,# output_format = html_document2(),# output_file = "book.html")## # officedown ----# if(require("officedown", quietly = TRUE)){# render(input = rmd_file,
86 linerange
# output_format = markdown_document2(base_format=rdocx_document),# output_file = "officedown.docx")# }# }# }# browseURL(dirname(rmd_file))
linerange mini linerange chunk wrapper
Description
This function is used to insert lineranges into flextable with function compose(). It should be usedinside a call to as_paragraph()
Usage
linerange(value,min = NULL,max = NULL,rangecol = "#CCCCCC",stickcol = "#FF0000",bg = "transparent",width = 1,height = 0.2,raster_width = 30,unit = "in"
)
Arguments
value values containing the bar size
min min bar size. Default min of value
max max bar size. Default max of value
rangecol bar color
stickcol jauge color
bg background color
width, height size of the resulting png file in inches
raster_width number of pixels used as width when interpolating value.
unit unit for width and height, one of "in", "cm", "mm".

line_spacing 87
Note
This chunk option requires package officedown in a R Markdown context with Word output format.
PowerPoint cannot mix images and text in a paragraph, images are removed when outputing toPowerPoint format.
See Also
compose(), as_paragraph()
Other chunk elements for paragraph: as_bracket(), as_b(), as_chunk(), as_equation(), as_highlight(),as_image(), as_i(), as_sub(), as_sup(), colorize(), gg_chunk(), hyperlink_text(), lollipop(),minibar(), plot_chunk()
Examples
myft <- flextable( head(iris, n = 10 ))
myft <- compose( myft, j = 1,value = as_paragraph(
linerange(value = Sepal.Length)),part = "body")
autofit(myft)
line_spacing Set text alignment
Description
change text alignment of selected rows and columns of a flextable.
Usage
line_spacing(x, i = NULL, j = NULL, space = 1, part = "body", unit = "in")
Arguments
x a flextable object
i rows selection
j columns selection
space space between lines of text, 1 is single line spacing, 2 is double line spacing.
part partname of the table (one of ’all’, ’body’, ’header’, ’footer’)
unit unit for space, one of "in", "cm", "mm".
Illustrations

88 lollipop
See Also
Other sugar functions for table style: align(), bg(), bold(), color(), empty_blanks(), fontsize(),font(), highlight(), italic(), padding(), rotate(), valign()
Examples
ft <- flextable(head(mtcars)[,3:6])ft <- line_spacing(ft, space = 1.6, part = "all")ft <- set_table_properties(ft, layout = "autofit")ft
lollipop mini lollipop chart chunk wrapper
Description
This function is used to insert lollipop charts into flextable with function compose(). It should beused inside a call to as_paragraph()
Usage
lollipop(value,min = NULL,max = NULL,rangecol = "#CCCCCC",bg = "transparent",width = 1,height = 0.2,unit = "in",raster_width = 30,positivecol = "#00CC00",negativecol = "#CC0000",neutralcol = "#CCCCCC",neutralrange = c(0, 0),rectanglesize = 2
)
Arguments
value values containing the bar size
min min bar size. Default min of value
max max bar size. Default max of value
rangecol bar color
bg background color
width, height size of the resulting png file in inches

merge_at 89
unit unit for width and height, one of "in", "cm", "mm".
raster_width number of pixels used as width
positivecol box color of positive values
negativecol box color of negative values
neutralcol box color of neutral values
neutralrange minimal and maximal range of neutral values (default: 0)
rectanglesize size of the rectangle (default: 2, max: 5) when interpolating value.
Illustrations
Note
This chunk option requires package officedown in a R Markdown context with Word output format.
PowerPoint cannot mix images and text in a paragraph, images are removed when outputing toPowerPoint format.
See Also
compose(), as_paragraph()
Other chunk elements for paragraph: as_bracket(), as_b(), as_chunk(), as_equation(), as_highlight(),as_image(), as_i(), as_sub(), as_sup(), colorize(), gg_chunk(), hyperlink_text(), linerange(),minibar(), plot_chunk()
Examples
iris$Sepal.Ratio <- (iris$Sepal.Length - mean(iris$Sepal.Length))/mean(iris$Sepal.Length)ft <- flextable( tail(iris, n = 10 ))
ft <- compose( ft, j = "Sepal.Ratio", value = as_paragraph(lollipop(value = Sepal.Ratio, min=-.25, max=.25)
),part = "body")
ft <- autofit(ft)ft
merge_at Merge flextable cells into a single one
Description
Merge flextable cells into a single one. All rows and columns must be consecutive.
90 merge_h
Usage
merge_at(x, i = NULL, j = NULL, part = "body")
Arguments
x flextable objecti, j columns and rows to mergepart partname of the table where merge has to be done.
See Also
Other flextable merging function: merge_h_range(), merge_h(), merge_none(), merge_v()
Examples
ft_merge <- flextable( head( mtcars ), cwidth = .5 )ft_merge <- merge_at( ft_merge, i = 1:2, j = 1:2 )ft_merge
merge_h Merge flextable cells horizontally
Description
Merge flextable cells horizontally when consecutive cells have identical values. Text of formattedvalues are used to compare values.
Usage
merge_h(x, i = NULL, part = "body")
Arguments
x flextable objecti rows where cells have to be merged.part partname of the table where merge has to be done.
See Also
Other flextable merging function: merge_at(), merge_h_range(), merge_none(), merge_v()
Examples
dummy_df <- data.frame( col1 = letters,col2 = letters, stringsAsFactors = FALSE )ft_merge <- flextable(dummy_df)ft_merge <- merge_h(x = ft_merge)ft_merge

merge_h_range 91
merge_h_range rowwise merge of a range of columns
Description
Merge flextable columns into a single one for each selected rows. All columns must be consecutive.
Usage
merge_h_range(x, i = NULL, j1 = NULL, j2 = NULL, part = "body")
Arguments
x flextable object
i selected rows
j1, j2 selected columns that will define the range of columns to merge.
part partname of the table where merge has to be done.
Illustrations
See Also
Other flextable merging function: merge_at(), merge_h(), merge_none(), merge_v()
Examples
ft <- flextable( head( mtcars ), cwidth = .5 )ft <- theme_box( ft )ft <- merge_h_range( ft, i = ~ cyl == 6, j1 = "am", j2 = "carb")ft <- flextable::align( ft, i = ~ cyl == 6, align = "center")ft
merge_none Delete flextable merging informations
Description
Delete all merging informations from a flextable.
Usage
merge_none(x, part = "all")
92 merge_v
Arguments
x flextable object
part partname of the table where merge has to be done.
Illustrations
See Also
Other flextable merging function: merge_at(), merge_h_range(), merge_h(), merge_v()
Examples
typology <- data.frame(col_keys = c( "Sepal.Length", "Sepal.Width", "Petal.Length", "Petal.Width", "Species" ),what = c("Sepal", "Sepal", "Petal", "Petal", "Species"),measure = c("Length", "Width", "Length", "Width", "Species"),stringsAsFactors = FALSE )
ft <- flextable( head( iris ) )ft <- set_header_df(ft, mapping = typology, key = "col_keys" )ft <- merge_v(ft, j = c("Species"))
ft <- theme_tron_legacy( merge_none( ft ) )ft
merge_v Merge flextable cells vertically
Description
Merge flextable cells vertically when consecutive cells have identical values. Text of formattedvalues are used to compare values if available.
Two options are available, either a column-by-column algorithm or an algorithm where the combi-nations of these columns are used once for all target columns.
Usage
merge_v(x, j = NULL, target = NULL, part = "body", combine = FALSE)
Arguments
x flextable object
j column to used to find consecutive values to be merged. Columns from orignaldataset can also be used.
target columns names where cells have to be merged.

merge_v 93
part partname of the table where merge has to be done.
combine If the value is TRUE, the columns defined by j will be combined into a singlecolumn/value and the consecutive values of this result will be used. Otherwise,the columns are inspected one by one to perform cell merges.
Illustrations
See Also
Other flextable merging function: merge_at(), merge_h_range(), merge_h(), merge_none()
Examples
ft_merge <- flextable(mtcars)ft_merge <- merge_v(ft_merge, j = c("gear", "carb"))ft_merge
data_ex <- structure(list(srdr_id = c("175124", "175124", "172525", "172525","172545", "172545", "172609", "172609", "172609"
), substances = c("alcohol","alcohol", "alcohol", "alcohol", "cannabis","cannabis", "alcohol\n cannabis\n other drugs","alcohol\n cannabis\n other drugs","alcohol\n cannabis\n other drugs"
), full_name = c("TAU", "MI", "TAU", "MI (parent)", "TAU", "MI","TAU", "MI", "MI"
), article_arm_name = c("Control", "WISEteens","Treatment as usual", "Brief MI (b-MI)", "Assessed control","Intervention", "Control", "Computer BI", "Therapist BI"
)), row.names = c(NA,-9L
), class = c("tbl_df", "tbl", "data.frame"))
ft_1 <- flextable(data_ex)ft_1 <- theme_box(ft_1)ft_2 <- merge_v(ft_1, j = "srdr_id",
target = c("srdr_id", "substances"))ft_2
94 minibar
minibar mini barplots chunk wrapper
Description
This function is used to insert bars into flextable with function compose(). It should be used insidea call to as_paragraph()
Usage
minibar(value,max = NULL,barcol = "#CCCCCC",bg = "transparent",width = 1,height = 0.2,unit = "in"
)
Arguments
value values containing the bar size
max max bar size
barcol bar color
bg background color
width, height size of the resulting png file in inches
unit unit for width and height, one of "in", "cm", "mm".
Illustrations
Note
This chunk option requires package officedown in a R Markdown context with Word output format.
PowerPoint cannot mix images and text in a paragraph, images are removed when outputing toPowerPoint format.
See Also
compose(), as_paragraph()
Other chunk elements for paragraph: as_bracket(), as_b(), as_chunk(), as_equation(), as_highlight(),as_image(), as_i(), as_sub(), as_sup(), colorize(), gg_chunk(), hyperlink_text(), linerange(),lollipop(), plot_chunk()

ncol_keys 95
Examples
ft <- flextable( head(iris, n = 10 ))
ft <- compose(ft, j = 1,value = as_paragraph(minibar(value = Sepal.Length, max = max(Sepal.Length))
),part = "body")
ft <- autofit(ft)ft
ncol_keys Number of columns
Description
returns the number of columns displayed
Usage
ncol_keys(x)
Arguments
x flextable object
See Also
Other flextable dimensions: autofit(), dim.flextable(), dim_pretty(), fit_to_width(),flextable_dim(), height(), hrule(), nrow_part(), set_table_properties(), width()
Examples
library(flextable)ft <- qflextable(head(cars))ncol_keys(ft)

96 padding
nrow_part Number of rows of a part
Description
returns the number of lines in a part of flextable.
Usage
nrow_part(x, part = "body")
Arguments
x flextable object
part partname of the table (one of ’body’, ’header’, ’footer’)
See Also
Other flextable dimensions: autofit(), dim.flextable(), dim_pretty(), fit_to_width(),flextable_dim(), height(), hrule(), ncol_keys(), set_table_properties(), width()
Examples
library(flextable)ft <- qflextable(head(cars))nrow_part(ft, part = "body")
padding Set paragraph paddings
Description
change paddings of selected rows and columns of a flextable.
Usage
padding(x,i = NULL,j = NULL,padding = NULL,padding.top = NULL,padding.bottom = NULL,padding.left = NULL,padding.right = NULL,part = "body"
)
ph_with.flextable 97
Arguments
x a flextable object
i rows selection
j columns selection
padding padding (shortcut for top, bottom, left and right), unit is pts (points).
padding.top padding top, unit is pts (points).
padding.bottom padding bottom, unit is pts (points).
padding.left padding left, unit is pts (points).
padding.right padding right, unit is pts (points).
part partname of the table (one of ’all’, ’body’, ’header’, ’footer’)
Illustrations
See Also
Other sugar functions for table style: align(), bg(), bold(), color(), empty_blanks(), fontsize(),font(), highlight(), italic(), line_spacing(), rotate(), valign()
Examples
ft_1 <- flextable(head(iris))ft_1 <- theme_vader(ft_1)ft_1 <- padding(ft_1, padding.top = 4, part = "all")ft_1 <- padding(ft_1, j = 1, padding.right = 40)ft_1 <- padding(ft_1, i = 3, padding.top = 40)ft_1 <- padding(ft_1, padding.top = 10, part = "header")ft_1 <- padding(ft_1, padding.bottom = 10, part = "header")ft_1 <- autofit(ft_1)ft_1
ph_with.flextable add a flextable into a PowerPoint slide
Description
Add a flextable in a PowerPoint document object produced by officer::read_pptx().
Usage
## S3 method for class 'flextable'ph_with(x, value, location, ...)
98 plot.flextable
Arguments
x a pptx device
value flextable object
location a location for a placeholder. See officer::ph_location_type() for example.
... unused arguments.
Note
The width and height of the table can not be set with location. Use functions width(), height(),autofit() and dim_pretty() instead. The overall size is resulting from cells, paragraphs and textproperties (i.e. padding, font size, border widths).
Examples
library(officer)
ft = flextable(head(iris))
doc <- read_pptx()doc <- add_slide(doc, "Title and Content", "Office Theme")doc <- ph_with(doc, ft, location = ph_location_left())
fileout <- tempfile(fileext = ".pptx")print(doc, target = fileout)
plot.flextable plot a flextable
Description
save a flextable as an image and display the result in a new R graphics window.
Usage
## S3 method for class 'flextable'plot(x, zoom = 2, expand = 2, ...)
Arguments
x a flextable object
zoom, expand parameters used by webshot function.
... additional parameters sent to as_raster() function
Note
This function requires packages: webshot and magick.

plot_chunk 99
See Also
Other flextable print function: as_raster(), df_printer(), flextable_to_rmd(), htmltools_value(),knit_print.flextable(), print.flextable(), save_as_docx(), save_as_html(), save_as_image(),save_as_pptx()
Examples
ftab <- flextable( head( mtcars ) )ftab <- autofit(ftab)## Not run:if( require("webshot") ){
plot(ftab)}
## End(Not run)
plot_chunk mini plots chunk wrapper
Description
This function is used to insert mini plots into flextable with function compose(). It should be usedinside a call to as_paragraph().
Available plots are ’box’, ’line’, ’points’, ’density’.
Usage
plot_chunk(value,width = 1,height = 0.2,type = "box",free_scale = FALSE,unit = "in",...
)
Arguments
value a numeric vector, stored in a list column.
width, height size of the resulting png file in inches
type type of the plot: ’box’, ’line’, ’points’ or ’density’.
free_scale Should scales be free (TRUE or FALSE, the default value).
unit unit for width and height, one of "in", "cm", "mm".
... arguments sent to plot functions (see par())

100 print.flextable
Illustrations
Note
This chunk option requires package officedown in a R Markdown context with Word output format.
PowerPoint cannot mix images and text in a paragraph, images are removed when outputing toPowerPoint format.
See Also
Other chunk elements for paragraph: as_bracket(), as_b(), as_chunk(), as_equation(), as_highlight(),as_image(), as_i(), as_sub(), as_sup(), colorize(), gg_chunk(), hyperlink_text(), linerange(),lollipop(), minibar()
Examples
library(data.table)library(flextable)
z <- as.data.table(iris)z <- z[ , list(
Sepal.Length = mean(Sepal.Length, na.rm = TRUE),z = list(.SD$Sepal.Length)), by = "Species"]
ft <- flextable(z,col_keys = c("Species", "Sepal.Length", "box", "density"))
ft <- mk_par(ft, j = "box", value = as_paragraph(plot_chunk(value = z, type = "box",
border = "red", col = "transparent")))ft <- mk_par(ft, j = "density", value = as_paragraph(plot_chunk(value = z, type = "dens", col = "red")))
ft <- set_table_properties(ft, layout = "autofit", width = .6)ft <- set_header_labels(ft, box = "boxplot", density= "density")theme_vanilla(ft)
print.flextable flextable printing
Description
print a flextable object to format html, docx, pptx or as text (not for display but for informativepurpose). This function is to be used in an interactive context.
Usage
## S3 method for class 'flextable'print(x, preview = "html", ...)
proc_freq 101
Arguments
x flextable object
preview preview type, one of c("html", "pptx", "docx", "pdf, "log"). When "log" is used,a description of the flextable is printed.
... arguments for ’pdf_document’ call when preview is "pdf".
Note
When argument preview is set to "docx" or "pptx", an external client linked to these formats(Office is installed) is used to edit a document. The document is saved in the temporary directoryof the R session and will be removed when R session will be ended.
When argument preview is set to "html", an external client linked to these HTML format is usedto display the table. If RStudio is used, the Viewer is used to display the table.
Note also that a print method is used when flextable are used within R markdown documents. Seeknit_print.flextable().
See Also
Other flextable print function: as_raster(), df_printer(), flextable_to_rmd(), htmltools_value(),knit_print.flextable(), plot.flextable(), save_as_docx(), save_as_html(), save_as_image(),save_as_pptx()
proc_freq frequency table as flextable
Description
This function compute a two way contingency table and make a flextable with the result.
Usage
proc_freq(x,row,col,main = "",include.row_percent = TRUE,include.column_percent = TRUE,include.table_percent = TRUE,include.column_total = TRUE,include.row_total = TRUE,include.header_row = TRUE,weight = NULL
)
102 rotate
Arguments
x data.frame object
row characer column names for row
col characer column names for column
main characer titleinclude.row_percent
boolean whether to include the row percents; defaults to TRUE
include.column_percent
boolean whether to include the column percents; defaults to TRUE
include.table_percent
boolean whether to include the table percents; defaults to TRUE
include.column_total
boolean whether to include the row of column totals; defaults to TRUE
include.row_total
boolean whether to include the column of row totals; defaults to TRUE
include.header_row
boolean whether to include the header row; defaults to TRUE
weight character column name for weight
Author(s)
Titouan Robert
Examples
proc_freq(mtcars, "vs", "gear")proc_freq(mtcars, "gear", "vs")proc_freq(mtcars, "gear", "vs", weight = "wt")proc_freq(mtcars, "gear", "vs", "My title")
rotate rotate cell text
Description
apply a rotation to cell text. The text direction can be "lrtb" which mean from left to right and topto bottom (the default direction). In some cases, it can be useful to be able to change the direction,when the table headers are huge for example, header labels can be rendered as "tbrl" (top to bottomand right to left) corresponding to a 90 degrees rotation or "btlr" corresponding to a 270 degreesrotation.
Usage
rotate(x, i = NULL, j = NULL, rotation, align = "center", part = "body")

rotate 103
Arguments
x a flextable object
i rows selection
j columns selection
rotation one of "lrtb", "tbrl", "btlr". Note that "btlr" is ignored when output is HTML.
align vertical alignment of paragraph within cell, one of "center" or "top" or "bottom".
part partname of the table (one of ’all’, ’body’, ’header’, ’footer’)
Details
When function autofit is used, the rotation will be ignored. In that case, use dim_pretty and widthinstead of autofit.
Illustrations
See Also
Other sugar functions for table style: align(), bg(), bold(), color(), empty_blanks(), fontsize(),font(), highlight(), italic(), line_spacing(), padding(), valign()
Examples
library(flextable)
ft <- flextable(head(iris))
# measure column widths but only for the body partw_body <- dim_pretty(ft, part = "body")$widths# measure column widths only for the header part and get the max# as height value for rotated texth_header <- max( dim_pretty(ft, part = "header")$widths )
ft <- rotate(ft, j = 1:4, rotation="btlr",part="header")ft <- rotate(ft, j = 5, rotation="tbrl",part="header")
ft <- valign(ft, valign = "center", part = "header")ft <- flextable::align(ft, align = "center", part = "all")
# Manage header heightft <- height(ft, height = h_header * 1.1, part = "header")# ... mainly because Word don't handle auto height with rotated headersft <- hrule(ft, i = 1, rule = "exact", part = "header")
ft
104 save_as_docx
save_as_docx save flextable objects in an Word file
Description
sugar function to save flextable objects in an Word file.
Usage
save_as_docx(..., values = NULL, path, pr_section = NULL)
Arguments
... flextable objects, objects, possibly named. If named objects, names are used astitles.
values a list (possibly named), each element is a flextable object. If named objects,names are used as titles. If provided, argument ... will be ignored.
path Word file to be created
pr_section a prop_section object that can be used to define page layout such as orientation,width and height.
See Also
Other flextable print function: as_raster(), df_printer(), flextable_to_rmd(), htmltools_value(),knit_print.flextable(), plot.flextable(), print.flextable(), save_as_html(), save_as_image(),save_as_pptx()
Examples
tf <- tempfile(fileext = ".docx")
library(officer)ft1 <- flextable( head( iris ) )save_as_docx(ft1, path = tf)
ft2 <- flextable( head( mtcars ) )sect_properties <- prop_section(
page_size = page_size(orient = "landscape",width = 8.3, height = 11.7),
type = "continuous",page_margins = page_mar()
)save_as_docx(`iris table` = ft1, `mtcars table` = ft2,
path = tf, pr_section = sect_properties)
save_as_html 105
save_as_html Save a Flextable in an HTML File
Description
save a flextable in an HTML file. This function is useful to save the flextable in HTML file withoutusing R Markdown (it is highly recommanded to use R Markdown instead).
Usage
save_as_html(...,values = NULL,path,encoding = "utf-8",title = deparse(sys.call())
)
Arguments
... flextable objects, objects, possibly named. If named objects, names are used astitles.
values a list (possibly named), each element is a flextable object. If named objects,names are used as titles. If provided, argument ... will be ignored.
path HTML file to be created
encoding encoding to be used in the HTML file
title page title
See Also
Other flextable print function: as_raster(), df_printer(), flextable_to_rmd(), htmltools_value(),knit_print.flextable(), plot.flextable(), print.flextable(), save_as_docx(), save_as_image(),save_as_pptx()
Examples
ft1 <- flextable( head( iris ) )tf1 <- tempfile(fileext = ".html")save_as_html(ft1, path = tf1)# browseURL(tf1)
ft2 <- flextable( head( mtcars ) )tf2 <- tempfile(fileext = ".html")save_as_html(
`iris table` = ft1,`mtcars table` = ft2,path = tf2,
106 save_as_image
title = "rhoooo")# browseURL(tf2)
save_as_image save a flextable as an image
Description
save a flextable as a png, pdf or jpeg image.
Image generated with package ’webshot’ or package ’webshot2’. Package ’webshot2’ should beprefered as ’webshot’ can have issues with some properties (i.e. bold are not rendered for someusers).
Usage
save_as_image(x, path, zoom = 3, expand = 10, webshot = "webshot")
Arguments
x a flextable object
path image file to be created. It should end with .png, .pdf, or .jpeg.
zoom, expand parameters used by webshot function.
webshot webshot package as a scalar character, one of "webshot" or "webshot2".
Note
This function requires package webshot or webshot2.
See Also
Other flextable print function: as_raster(), df_printer(), flextable_to_rmd(), htmltools_value(),knit_print.flextable(), plot.flextable(), print.flextable(), save_as_docx(), save_as_html(),save_as_pptx()
Examples
ft <- flextable( head( mtcars ) )ft <- autofit(ft)tf <- tempfile(fileext = ".png")## Not run:if( require("webshot") ){
save_as_image(x = ft, path = "myimage.png")}
## End(Not run)

save_as_pptx 107
save_as_pptx save flextable objects in an PowerPoint file
Description
sugar function to save flextable objects in an PowerPoint file.
Usage
save_as_pptx(..., values = NULL, path)
Arguments
... flextable objects, objects, possibly named. If named objects, names are used asslide titles.
values a list (possibly named), each element is a flextable object. If named objects,names are used as slide titles. If provided, argument ... will be ignored.
path PowerPoint file to be created
See Also
Other flextable print function: as_raster(), df_printer(), flextable_to_rmd(), htmltools_value(),knit_print.flextable(), plot.flextable(), print.flextable(), save_as_docx(), save_as_html(),save_as_image()
Examples
ft1 <- flextable( head( iris ) )tf <- tempfile(fileext = ".pptx")save_as_pptx(ft1, path = tf)
ft2 <- flextable( head( mtcars ) )tf <- tempfile(fileext = ".pptx")save_as_pptx(`iris table` = ft1, `mtcars table` = ft2, path = tf)
set_caption Set Caption
Description
Set caption value in a flextable.
• The caption will be associated with a paragraph style when the output is Word. It can also benumbered as a auto-numbered Word computed value.
• The PowerPoint format ignores captions.
108 set_caption
Usage
set_caption(x,caption,autonum = NULL,style = "Table Caption",html_escape = TRUE
)
Arguments
x flextable object
caption caption value
autonum an autonum representation. See officer::run_autonum(). This has only aneffect when output is Word. If used, the caption is preceded by an auto-numbersequence. In this case, the caption is preceded by an auto-number sequence thatcan be cross referenced.
style caption paragraph style name. These names are available with function officer::styles_info()when output is Word; if HTML, the value is set as class value in the captiontag.
html_escape should HTML entities be escaped so that it can be safely included as text or anattribute value within an HTML document.
R Markdown
flextable captions can be defined from R Markdown documents by using knitr::opts_chunk$set().The following options are available with officedown::rdocx_document and/or bookdown:
label name valueWord stylename to use for table captions. tab.cap.style NULLcaption id/bookmark tab.id NULLcaption tab.cap NULLdisplay table caption on top of the table or not tab.topcaption TRUEcaption table sequence identifier. tab.lp "tab:"
The following options are only available when used with officedown::rdocx_document:
label name valueprefix for numbering chunk (default to "Table "). tab.cap.pre Tablesuffix for numbering chunk (default to ": "). tab.cap.sep " :"title number depth tab.cap.tnd 0separator to use between title number and table number. tab.cap.tns "-"caption prefix formatting properties tab.cap.fp_text fp_text_lite(bold = TRUE)
See knit_print.flextable for more details.
set_flextable_defaults 109
See Also
flextable()
Examples
ftab <- flextable( head( iris ) )ftab <- set_caption(ftab, "my caption")ftab
library(officer)autonum <- run_autonum(seq_id = "tab", bkm = "mtcars")ftab <- flextable( head( mtcars ) )ftab <- set_caption(ftab, caption = "mtcars data", autonum = autonum)ftab
set_flextable_defaults
Modify flextable defaults formatting properties
Description
The current formatting properties (see get_flextable_defaults()) are automatically applied toevery flextable you produce. Use set_flextable_defaults() to override them. Use init_flextable_defaults()to re-init all values with the package defaults.
Usage
set_flextable_defaults(font.family = NULL,font.size = NULL,font.color = NULL,text.align = NULL,padding = NULL,padding.bottom = NULL,padding.top = NULL,padding.left = NULL,padding.right = NULL,border.color = NULL,background.color = NULL,line_spacing = NULL,table.layout = NULL,cs.family = NULL,eastasia.family = NULL,hansi.family = NULL,decimal.mark = NULL,big.mark = NULL,digits = NULL,

110 set_flextable_defaults
na_str = NULL,nan_str = NULL,fmt_date = NULL,fmt_datetime = NULL,extra_css = NULL,fonts_ignore = NULL,theme_fun = NULL,post_process_pdf = NULL,post_process_docx = NULL,post_process_html = NULL,post_process_pptx = NULL
)
init_flextable_defaults()
Arguments
font.family single character value. When format is Word, it specifies the font to be used toformat characters in the Unicode range (U+0000-U+007F).
font.size font size (in point) - 0 or positive integer value.
font.color font color - a single character value specifying a valid color (e.g. "#000000" or"black").
text.align text alignment - a single character value, expected value is one of ’left’, ’right’,’center’, ’justify’.
padding padding (shortcut for top, bottom, left and right padding)padding.bottom, padding.top, padding.left, padding.right
paragraph paddings - 0 or positive integer value.
border.color border color - single character value (e.g. "#000000" or "black").background.color
cell background color - a single character value specifying a valid color (e.g."#000000" or "black").
line_spacing space between lines of text, 1 is single line spacing, 2 is double line spacing.
table.layout ’autofit’ or ’fixed’ algorithm. Default to ’autofit’.
cs.family optional and only for Word. Font to be used to format characters in a complexscript Unicode range. For example, Arabic text might be displayed using the"Arial Unicode MS" font.
eastasia.family
optional and only for Word. Font to be used to format characters in an EastAsian Unicode range. For example, Japanese text might be displayed using the"MS Mincho" font.
hansi.family optional and only for Word. Font to be used to format characters in a Unicoderange which does not fall into one of the other categories.
decimal.mark, big.mark, na_str, nan_str
formatC arguments used by colformat_num(), colformat_double(), and colformat_int().
digits formatC argument used by colformat_double().
set_formatter 111
fmt_date, fmt_datetime
formats for date and datetime columns as documented in strptime(). Defaultto ’%Y-%m-%d’ and ’%Y-%m-%d %H:%M:%S’.
extra_css css instructions to be integrated with the table.
fonts_ignore if TRUE, pdf-engine pdflatex can be used instead of xelatex or lualatex. If pdfla-tex is used, fonts will be ignored because they are not supported by pdflatex,whereas with the xelatex and lualatex engines they are.
theme_fun a single character value (the name of the theme function to be applied) or atheme function (input is a flextable, output is a flextable).
post_process_pdf, post_process_docx, post_process_html, post_process_pptx
Post-processing functions that will allow you to customize the display by outputtype (pdf, html, docx, pptx). They are executed just before printing the table.
Value
a list containing previous default values.
Illustrations
See Also
Other functions related to themes: get_flextable_defaults(), theme_alafoli(), theme_booktabs(),theme_box(), theme_tron_legacy(), theme_tron(), theme_vader(), theme_vanilla(), theme_zebra()
Examples
ft_1 <- qflextable(head(airquality))ft_1
old <- set_flextable_defaults(font.color = "#AA8855",border.color = "#8855AA")
ft_2 <- qflextable(head(airquality))ft_2
do.call(set_flextable_defaults, old)
set_formatter set column formatter functions
Description
Define formatter functions associated to each column key. Functions have a single argument (thevector) and are returning the formatted values as a character vector.

112 set_formatter
Usage
set_formatter(x, ..., values = NULL, part = "body")
set_formatter_type(x,fmt_double = "%.03f",fmt_integer = "%.0f",fmt_date = "%Y-%m-%d",fmt_datetime = "%Y-%m-%d %H:%M:%S",true = "true",false = "false",na_str = ""
)
Arguments
x a flextable object
... Name-value pairs of functions, names should be existing col_key values
values a list of name-value pairs of functions, names should be existing col_key values.If values is supplied argument ... is ignored.
part partname of the table (one of ’body’ or ’header’ or ’footer’)
fmt_double, fmt_integer
arguments used by sprintf to format double and integer columns.
fmt_date, fmt_datetime
arguments used by format to format date and date time columns.
false, true string to be used for logical columns
na_str string for NA values
Illustrations
set_formatter_type
set_formatter_type is an helper function to quickly define formatter functions regarding to col-umn types.
This function will be deprecated in favor of the colformat_* functions, for example colformat_double().
See Also
Other cells formatters: colformat_char(), colformat_datetime(), colformat_date(), colformat_double(),colformat_image(), colformat_int(), colformat_lgl(), colformat_num(), compose()
Other cells formatters: colformat_char(), colformat_datetime(), colformat_date(), colformat_double(),colformat_image(), colformat_int(), colformat_lgl(), colformat_num(), compose()

set_header_footer_df 113
Examples
ft <- flextable( head( iris ) )ft <- set_formatter( x = ft,
Sepal.Length = function(x) sprintf("%.02f", x),Sepal.Width = function(x) sprintf("%.04f", x)
)ft <- theme_vanilla( ft )ft
set_header_footer_df Set flextable’s header or footer rows
Description
Use a data.frame to specify flextable’s header or footer rows.
The data.frame must contain a column whose values match flextable col_keys argument, this col-umn will be used as join key. The other columns will be displayed as header or footer rows. Theleftmost column is used as the top header/footer row and the rightmost column is used as the bottomheader/footer row.
Usage
set_header_df(x, mapping = NULL, key = "col_keys")
set_footer_df(x, mapping = NULL, key = "col_keys")
Arguments
x a flextable object
mapping a data.frame specyfing for each colname content of the column.
key column to use as key when joigning data_mapping.
Illustrations
See Also
Other headers and footers: add_header_lines(), add_header_row(), add_header(), set_header_labels()

114 set_header_labels
Examples
typology <- data.frame(col_keys = c( "Sepal.Length", "Sepal.Width", "Petal.Length",
"Petal.Width", "Species" ),what = c("Sepal", "Sepal", "Petal", "Petal", "Species"),measure = c("Length", "Width", "Length", "Width", "Species"),stringsAsFactors = FALSE )
ft_1 <- flextable( head( iris ))ft_1 <- set_header_df(ft_1, mapping = typology, key = "col_keys" )ft_1 <- merge_h(ft_1, part = "header")ft_1 <- merge_v(ft_1, j = "Species", part = "header")ft_1 <- theme_vanilla(ft_1)ft_1 <- fix_border_issues(ft_1)ft_1
typology <- data.frame(col_keys = c( "Sepal.Length", "Sepal.Width", "Petal.Length",
"Petal.Width", "Species" ),unit = c("(cm)", "(cm)", "(cm)", "(cm)", ""),stringsAsFactors = FALSE )
ft_2 <- set_footer_df(ft_1, mapping = typology, key = "col_keys" )ft_2 <- italic(ft_2, italic = TRUE, part = "footer" )ft_2 <- theme_booktabs(ft_2)ft_2 <- fix_border_issues(ft_2)ft_2
set_header_labels Set flextable’s headers labels
Description
This function set labels for specified columns in a single row header of a flextable.
Usage
set_header_labels(x, ..., values = NULL)
Arguments
x a flextable object
... named arguments (names are data colnames), each element is a single charactervalue specifying label to use.
values a named list (names are data colnames), each element is a single character valuespecifying label to use. If provided, argument ... will be ignored.

set_table_properties 115
Illustrations
See Also
Other headers and footers: add_header_lines(), add_header_row(), add_header(), set_header_footer_df
Examples
ft <- flextable( head( iris ))ft <- set_header_labels(ft, Sepal.Length = "Sepal length",
Sepal.Width = "Sepal width", Petal.Length = "Petal length",Petal.Width = "Petal width"
)
ft <- flextable( head( iris ))ft <- set_header_labels(ft,
values = list(Sepal.Length = "Sepal length",Sepal.Width = "Sepal width",Petal.Length = "Petal length",Petal.Width = "Petal width" ) )
ft
set_table_properties Global table properties
Description
Set table layout and table width. Default to fixed algorithm.
If layout is fixed, column widths will be used to display the table; width is ignored.
If layout is autofit, column widths will not be used; table width is used (as a percentage).
Usage
set_table_properties(x, layout = "fixed", width = 0)
Arguments
x flextable object
layout ’autofit’ or ’fixed’ algorithm. Default to ’autofit’.
width The parameter has a different effect depending on the output format. Usersshould consider it as a minimum width. In HTML, it is the minimum width ofthe space that the table should occupy. In Word, it is a preferred size and Wordmay decide not to strictly stick to it. It has no effect on PowerPoint and PDFoutput. Its default value is 0, as an effect, it only use necessary width to displayall content. It is not used by the PDF output.

116 style
Illustrations
Note
PowerPoint output ignore ’autofit layout’.
See Also
Other flextable dimensions: autofit(), dim.flextable(), dim_pretty(), fit_to_width(),flextable_dim(), height(), hrule(), ncol_keys(), nrow_part(), width()
Examples
library(flextable)ft_1 <- qflextable(head(cars))ft_2 <- set_table_properties(ft_1, width = .5, layout = "autofit")ft_2
style Set flextable style
Description
Modify flextable text, paragraphs and cells formatting properties. It allows to specify a set offormatting properties for a selection instead of using multiple functions (.i.e bold, italic, bg) thatshould all be applied to the same selection of rows and columns.
Usage
style(x,i = NULL,j = NULL,pr_t = NULL,pr_p = NULL,pr_c = NULL,part = "body"
)
Arguments
x a flextable object
i rows selection
j columns selection
pr_t object(s) of class fp_text
summarizor 117
pr_p object(s) of class fp_par
pr_c object(s) of class fp_cell
part partname of the table (one of ’all’, ’body’, ’header’ or ’footer’)
Illustrations
Examples
library(officer)def_cell <- fp_cell(border = fp_border(color="wheat"))
def_par <- fp_par(text.align = "center")
ft <- flextable(head(mtcars))
ft <- style( ft, pr_c = def_cell, pr_p = def_par, part = "all")ft <- style(ft, ~ drat > 3.5, ~ vs + am + gear + carb,
pr_t = fp_text(color="red", italic = TRUE) )
ft
summarizor data summary preparation
Description
It performs a univariate statistical analysis of a dataset by group and formats the results so that theycan be used with the tabulator() function.
Usage
summarizor(x, by = character(), overall_label = NULL)
Arguments
x dataset
by columns names to be used as grouping columns
overall_label label to use as overall label
Illustrations
ft_1 appears as:
ft_2 appears as:
118 summarizor
Note
This is very first version of the function; be aware it can evolve or change.
See Also
fmt_2stats()
Examples
z <- summarizor(CO2[-c(1, 4)],by = "Treatment",overall_label = "Overall"
)
# version 1 ----tab_1 <- tabulator(
x = z,rows = c("variable", "stat"),columns = "Treatment",blah = as_paragraph(as_chunk(
fmt_2stats(num1 = stat, num2 = value, cts = cts, pcts = percent
))
))
ft_1 <- as_flextable(tab_1, separate_with = "variable")ft_1
# version 2 ----n_format <- function(n, percent) {
z <- character(length = length(n))wcts <- !is.na(n)z[wcts] <- sprintf("%.0f (%.01f %%)", n[wcts], percent[wcts] * 100)z
}stat_format <- function(value) {
z <- character(length = length(value))wnum <- !is.na(value)z[wnum] <- sprintf("%.01f", value[wnum])z
}
tab_2 <- tabulator(z,rows = c("variable", "stat"),columns = "Treatment",`Est.` = as_paragraph(as_chunk(value)),`N` = as_paragraph(as_chunk(n_format(cts, percent)))
)

surround 119
ft_2 <- as_flextable(tab_2, separate_with = "variable")ft_2
surround Set borders for a selection of cells
Description
Highlight specific cells with borders.
To set borders for the whole table, use border_outer(), border_inner_h() and border_inner_v().
All the following functions also support the row and column selector i and j:
• hline(): set bottom borders (inner horizontal)
• vline(): set right borders (inner vertical)
• hline_top(): set the top border (outer horizontal)
• vline_left(): set the left border (outer vertical)
Usage
surround(x,i = NULL,j = NULL,border = NULL,border.top = NULL,border.bottom = NULL,border.left = NULL,border.right = NULL,part = "body"
)
Arguments
x a flextable object
i rows selection
j columns selection
border border (shortcut for top, bottom, left and right)
border.top border top
border.bottom border bottom
border.left border left
border.right border right
part partname of the table (one of ’all’, ’body’, ’header’, ’footer’)

120 tabulator
See Also
Other borders management: border_inner_h(), border_inner_v(), border_inner(), border_outer(),border_remove(), hline_bottom(), hline_top(), hline(), vline_left(), vline_right(),vline()
Examples
library(officer)library(flextable)
# cell to highlightvary_i <- 1:3vary_j <- 1:3
std_border <- fp_border(color = "orange")
ft <- flextable(head(iris))ft <- border_remove(x = ft)ft <- border_outer(x = ft, border = std_border)
for (id in seq_along(vary_i)) {ft <- bg(x = ft,i = vary_i[id],j = vary_j[id], bg = "yellow"
)ft <- surround(
x = ft,i = vary_i[id],j = vary_j[id],border.left = std_border,border.right = std_border,part = "body"
)}
ft <- autofit(ft)ft# # render# print(ft, preview = "pptx")# print(ft, preview = "docx")# print(ft, preview = "pdf")# print(ft, preview = "html")
tabulator Tabulation of aggregations
tabulator 121
Description
It tabulates a data.frame representing an aggregation which is then transformed as a flextable. Thefunction allows to define any display with the syntax of flextable in a table whose layout is showingdimensions of the aggregation across rows and columns.
Usage
tabulator(x,rows,columns,supp_data = NULL,hidden_data = NULL,row_compose = list(),...
)
## S3 method for class 'tabulator'summary(object, ...)
Arguments
x an aggregated data.frame
rows column names to use in rows dimensions
columns column names to use in columns dimensions
supp_data additional data that will be merged with table and presented after the columnspresenting the row dimensions.
hidden_data additional data that will be merged with table, the columns are not presented butcan be used with compose() or mk_par() function.
row_compose a list of call to as_paragraph() - these calls will be applied to the row dimen-sions (the name is used to target the displayed column).
... named arguments calling function as_paragraph(). The names are used aslabels and the values are evaluated when the flextable is created.
object an object returned by function tabulator().
Value
an object of class tabulator.
Methods (by generic)
• summary: call summary() to get a data.frame describing mappings between variables and theirnames in the flextable. This data.frame contains a column named col_keys where are storedthe names that can be used for further selections.

122 tabulator
Illustrations
ft_1 appears as:
ft_2 appears as:
Note
This is very first version of the function; be aware it can evolve or change.
See Also
as_flextable.tabulator(), summarizor(), as_grouped_data()
Examples
n_format <- function(z){x <- sprintf("%.0f", z)x[is.na(z)] <- "-"x
}
set_flextable_defaults(digits = 2, border.color = "gray")
if(require("stats")){dat <- aggregate(breaks ~ wool + tension,data = warpbreaks, mean)
cft_1 <- tabulator(x = dat, rows = "wool",columns = "tension",`mean` = as_paragraph(as_chunk(breaks)),`(N)` = as_paragraph(
as_chunk(length(breaks), formatter = n_format )))
ft_1 <- as_flextable(cft_1)ft_1
}
if(require("data.table") && require("ggplot2")){
multi_fun <- function(x) {list(mean = mean(x),
sd = sd(x))}myformat <- function(z){
x <- sprintf("%.1f", z)x[is.na(z)] <- ""x
}
grey_txt <- fp_text_default(color = "gray")

tabulator 123
dat <- as.data.table(ggplot2::diamonds)dat <- dat[cut %in% c("Fair", "Good", "Very Good")]dat <- dat[clarity %in% c("I1", "SI1", "VS2")]
dat <- dat[, unlist(lapply(.SD, multi_fun),recursive = FALSE),
.SDcols = c("z", "y"),by = c("cut", "color", "clarity")]
tab_2 <- tabulator(x = dat, rows = c("cut", "color"),columns = "clarity",`z stats` = as_paragraph(
as_chunk(z.mean, formatter = myformat)),`y stats` = as_paragraph(
as_chunk(y.mean, formatter = myformat),as_chunk(" (\u00B1 ", props = grey_txt),as_chunk(y.sd, formatter = myformat, props = grey_txt),as_chunk(")", props = grey_txt))
)ft_2 <- as_flextable(tab_2)ft_2 <- autofit(x = ft_2, add_w = .05)ft_2
}
if(require("data.table")){#' # data.table versiondat <- melt(as.data.table(iris),
id.vars = "Species",variable.name = "name",value.name = "value")[,
list(avg = mean(value, na.rm = TRUE),sd = sd(value, na.rm = TRUE)),
by = c("Species", "name")]
# dplyr version# library(dplyr)# dat <- iris %>%# pivot_longer(cols = -c(Species)) %>%# group_by(Species, name) %>%# summarise(avg = mean(value, na.rm = TRUE),# sd = sd(value, na.rm = TRUE),# .groups = "drop")
tab_3 <- tabulator(x = dat, rows = c("Species"),columns = "name",`mean (sd)` = as_paragraph( as_chunk(avg),
" (", as_chunk(sd), ")"))
ft_3 <- as_flextable(tab_3, separate_with = character(0))ft_3

124 theme_alafoli
}
init_flextable_defaults()
theme_alafoli Apply alafoli theme
Description
Apply alafoli theme
Usage
theme_alafoli(x)
Arguments
x a flextable object
Illustrations
behavior
Theme functions are not like ’ggplot2’ themes. They are applied to the existing table immediately.If you add a row in the footer, the new row is not formatted with the theme. The theme functionapplies the theme only to existing elements when the function is called.
That is why theme functions should be applied after all elements of the table have been added(mainly additionnal header or footer rows).
If you want to automatically apply a theme function to each flextable, you can use the theme_funargument of set_flextable_defaults(); be aware that this theme function is applied as the lastinstruction when calling flextable() - so if you add headers or footers to the array, they will notbe formatted with the theme.
You can also use the post_process_html argument of set_flextable_defaults() (or post_process_pdf,post_process_docx, post_process_pptx) to specify a theme to be applied systematically beforethe flextable() is printed; in this case, don’t forget to take care that the theme doesn’t overrideany formatting done before the print statement.
See Also
Other functions related to themes: get_flextable_defaults(), set_flextable_defaults(),theme_booktabs(), theme_box(), theme_tron_legacy(), theme_tron(), theme_vader(), theme_vanilla(),theme_zebra()
theme_booktabs 125
Examples
ft <- flextable(head(airquality))ft <- theme_alafoli(ft)ft
theme_booktabs Apply booktabs theme
Description
Apply theme booktabs to a flextable
Usage
theme_booktabs(x, bold_header = FALSE, ...)
Arguments
x a flextable object
bold_header header will be bold if TRUE.
... unused
Illustrations
behavior
Theme functions are not like ’ggplot2’ themes. They are applied to the existing table immediately.If you add a row in the footer, the new row is not formatted with the theme. The theme functionapplies the theme only to existing elements when the function is called.
That is why theme functions should be applied after all elements of the table have been added(mainly additionnal header or footer rows).
If you want to automatically apply a theme function to each flextable, you can use the theme_funargument of set_flextable_defaults(); be aware that this theme function is applied as the lastinstruction when calling flextable() - so if you add headers or footers to the array, they will notbe formatted with the theme.
You can also use the post_process_html argument of set_flextable_defaults() (or post_process_pdf,post_process_docx, post_process_pptx) to specify a theme to be applied systematically beforethe flextable() is printed; in this case, don’t forget to take care that the theme doesn’t overrideany formatting done before the print statement.
See Also
Other functions related to themes: get_flextable_defaults(), set_flextable_defaults(),theme_alafoli(), theme_box(), theme_tron_legacy(), theme_tron(), theme_vader(), theme_vanilla(),theme_zebra()

126 theme_box
Examples
ft <- flextable(head(airquality))ft <- theme_booktabs(ft)ft
theme_box Apply box theme
Description
Apply theme box to a flextable
Usage
theme_box(x)
Arguments
x a flextable object
Illustrations
behavior
Theme functions are not like ’ggplot2’ themes. They are applied to the existing table immediately.If you add a row in the footer, the new row is not formatted with the theme. The theme functionapplies the theme only to existing elements when the function is called.
That is why theme functions should be applied after all elements of the table have been added(mainly additionnal header or footer rows).
If you want to automatically apply a theme function to each flextable, you can use the theme_funargument of set_flextable_defaults(); be aware that this theme function is applied as the lastinstruction when calling flextable() - so if you add headers or footers to the array, they will notbe formatted with the theme.
You can also use the post_process_html argument of set_flextable_defaults() (or post_process_pdf,post_process_docx, post_process_pptx) to specify a theme to be applied systematically beforethe flextable() is printed; in this case, don’t forget to take care that the theme doesn’t overrideany formatting done before the print statement.
See Also
Other functions related to themes: get_flextable_defaults(), set_flextable_defaults(),theme_alafoli(), theme_booktabs(), theme_tron_legacy(), theme_tron(), theme_vader(),theme_vanilla(), theme_zebra()
theme_tron 127
Examples
ft <- flextable(head(airquality))ft <- theme_box(ft)ft
theme_tron Apply tron theme
Description
Apply theme tron to a flextable
Usage
theme_tron(x)
Arguments
x a flextable object
Illustrations
behavior
Theme functions are not like ’ggplot2’ themes. They are applied to the existing table immediately.If you add a row in the footer, the new row is not formatted with the theme. The theme functionapplies the theme only to existing elements when the function is called.
That is why theme functions should be applied after all elements of the table have been added(mainly additionnal header or footer rows).
If you want to automatically apply a theme function to each flextable, you can use the theme_funargument of set_flextable_defaults(); be aware that this theme function is applied as the lastinstruction when calling flextable() - so if you add headers or footers to the array, they will notbe formatted with the theme.
You can also use the post_process_html argument of set_flextable_defaults() (or post_process_pdf,post_process_docx, post_process_pptx) to specify a theme to be applied systematically beforethe flextable() is printed; in this case, don’t forget to take care that the theme doesn’t overrideany formatting done before the print statement.
See Also
Other functions related to themes: get_flextable_defaults(), set_flextable_defaults(),theme_alafoli(), theme_booktabs(), theme_box(), theme_tron_legacy(), theme_vader(),theme_vanilla(), theme_zebra()

128 theme_tron_legacy
Examples
ft <- flextable(head(airquality))ft <- theme_tron(ft)ft
theme_tron_legacy Apply tron legacy theme
Description
Apply theme tron legacy to a flextable
Usage
theme_tron_legacy(x)
Arguments
x a flextable object
Illustrations
behavior
Theme functions are not like ’ggplot2’ themes. They are applied to the existing table immediately.If you add a row in the footer, the new row is not formatted with the theme. The theme functionapplies the theme only to existing elements when the function is called.
That is why theme functions should be applied after all elements of the table have been added(mainly additionnal header or footer rows).
If you want to automatically apply a theme function to each flextable, you can use the theme_funargument of set_flextable_defaults(); be aware that this theme function is applied as the lastinstruction when calling flextable() - so if you add headers or footers to the array, they will notbe formatted with the theme.
You can also use the post_process_html argument of set_flextable_defaults() (or post_process_pdf,post_process_docx, post_process_pptx) to specify a theme to be applied systematically beforethe flextable() is printed; in this case, don’t forget to take care that the theme doesn’t overrideany formatting done before the print statement.
See Also
Other functions related to themes: get_flextable_defaults(), set_flextable_defaults(),theme_alafoli(), theme_booktabs(), theme_box(), theme_tron(), theme_vader(), theme_vanilla(),theme_zebra()

theme_vader 129
Examples
ft <- flextable(head(airquality))ft <- theme_tron_legacy(ft)ft
theme_vader Apply Sith Lord Darth Vader theme
Description
Apply Sith Lord Darth Vader theme to a flextable
Usage
theme_vader(x, ...)
Arguments
x a flextable object
... unused
Illustrations
behavior
Theme functions are not like ’ggplot2’ themes. They are applied to the existing table immediately.If you add a row in the footer, the new row is not formatted with the theme. The theme functionapplies the theme only to existing elements when the function is called.
That is why theme functions should be applied after all elements of the table have been added(mainly additionnal header or footer rows).
If you want to automatically apply a theme function to each flextable, you can use the theme_funargument of set_flextable_defaults(); be aware that this theme function is applied as the lastinstruction when calling flextable() - so if you add headers or footers to the array, they will notbe formatted with the theme.
You can also use the post_process_html argument of set_flextable_defaults() (or post_process_pdf,post_process_docx, post_process_pptx) to specify a theme to be applied systematically beforethe flextable() is printed; in this case, don’t forget to take care that the theme doesn’t overrideany formatting done before the print statement.
See Also
Other functions related to themes: get_flextable_defaults(), set_flextable_defaults(),theme_alafoli(), theme_booktabs(), theme_box(), theme_tron_legacy(), theme_tron(),theme_vanilla(), theme_zebra()

130 theme_vanilla
Examples
ft <- flextable(head(airquality))ft <- theme_vader(ft)ft
theme_vanilla Apply vanilla theme
Description
Apply theme vanilla to a flextable: The external horizontal lines of the different parts of the table(body, header, footer) are black 2 points thick, the external horizontal lines of the different partsare black 0.5 point thick. Header text is bold, text columns are left aligned, other columns are rightaligned.
Usage
theme_vanilla(x)
Arguments
x a flextable object
behavior
Theme functions are not like ’ggplot2’ themes. They are applied to the existing table immediately.If you add a row in the footer, the new row is not formatted with the theme. The theme functionapplies the theme only to existing elements when the function is called.
That is why theme functions should be applied after all elements of the table have been added(mainly additionnal header or footer rows).
If you want to automatically apply a theme function to each flextable, you can use the theme_funargument of set_flextable_defaults(); be aware that this theme function is applied as the lastinstruction when calling flextable() - so if you add headers or footers to the array, they will notbe formatted with the theme.
You can also use the post_process_html argument of set_flextable_defaults() (or post_process_pdf,post_process_docx, post_process_pptx) to specify a theme to be applied systematically beforethe flextable() is printed; in this case, don’t forget to take care that the theme doesn’t overrideany formatting done before the print statement.
Illustrations
See Also
Other functions related to themes: get_flextable_defaults(), set_flextable_defaults(),theme_alafoli(), theme_booktabs(), theme_box(), theme_tron_legacy(), theme_tron(),theme_vader(), theme_zebra()

theme_zebra 131
Examples
ft <- flextable(head(airquality))ft <- theme_vanilla(ft)ft
theme_zebra Apply zebra theme
Description
Apply theme zebra to a flextable
Usage
theme_zebra(x,odd_header = "#CFCFCF",odd_body = "#EFEFEF",even_header = "transparent",even_body = "transparent"
)
Arguments
x a flextable objectodd_header, odd_body, even_header, even_body
odd/even colors for table header and body
Illustrations
behavior
Theme functions are not like ’ggplot2’ themes. They are applied to the existing table immediately.If you add a row in the footer, the new row is not formatted with the theme. The theme functionapplies the theme only to existing elements when the function is called.
That is why theme functions should be applied after all elements of the table have been added(mainly additionnal header or footer rows).
If you want to automatically apply a theme function to each flextable, you can use the theme_funargument of set_flextable_defaults(); be aware that this theme function is applied as the lastinstruction when calling flextable() - so if you add headers or footers to the array, they will notbe formatted with the theme.
You can also use the post_process_html argument of set_flextable_defaults() (or post_process_pdf,post_process_docx, post_process_pptx) to specify a theme to be applied systematically beforethe flextable() is printed; in this case, don’t forget to take care that the theme doesn’t overrideany formatting done before the print statement.

132 valign
See Also
Other functions related to themes: get_flextable_defaults(), set_flextable_defaults(),theme_alafoli(), theme_booktabs(), theme_box(), theme_tron_legacy(), theme_tron(),theme_vader(), theme_vanilla()
Examples
ft <- flextable(head(airquality))ft <- theme_zebra(ft)ft
use_df_printer set data.frame automatic printing as a flextable
Description
Define df_printer() as data.frame print method in an R Markdown document.
In a setup run chunk:
flextable::use_df_printer()
Usage
use_df_printer()
See Also
df_printer(), flextable()
valign Set vertical alignment
Description
change vertical alignment of selected rows and columns of a flextable.
Usage
valign(x, i = NULL, j = NULL, valign = "center", part = "body")
Arguments
x a flextable objecti rows selectionj columns selectionvalign vertical alignment of paragraph within cell, one of "center" or "top" or "bottom".part partname of the table (one of ’all’, ’body’, ’header’, ’footer’)

vline 133
Illustrations
See Also
Other sugar functions for table style: align(), bg(), bold(), color(), empty_blanks(), fontsize(),font(), highlight(), italic(), line_spacing(), padding(), rotate()
Examples
ft_1 <- flextable(iris[c(1:3, 51:53, 101:103),])ft_1 <- theme_box(ft_1)ft_1 <- merge_v(ft_1, j = 5)ft_1
ft_2 <- valign(ft_1, j = 5, valign = "top", part = "all")ft_2
vline set vertical borders
Description
The function is applying vertical borders to inner content of one or all parts of a flextable. The linesare the right borders of selected cells.
Usage
vline(x, i = NULL, j = NULL, border = NULL, part = "all")
Arguments
x a flextable object
i rows selection
j columns selection
border border properties defined by a call to fp_border()
part partname of the table (one of ’all’, ’body’, ’header’, ’footer’)
Illustrations
See Also
Other borders management: border_inner_h(), border_inner_v(), border_inner(), border_outer(),border_remove(), hline_bottom(), hline_top(), hline(), surround(), vline_left(), vline_right()
134 vline_left
Examples
library(officer)std_border = fp_border(color="orange")
ft <- flextable(head(iris))ft <- border_remove(x = ft)
# add vertical bordersft <- vline(ft, border = std_border )ft
vline_left set flextable left vertical borders
Description
The function is applying vertical borders to the left side of one or all parts of a flextable. The line isthe left border of selected cells of the first column.
Usage
vline_left(x, i = NULL, border = NULL, part = "all")
Arguments
x a flextable object
i rows selection
border border properties defined by a call to fp_border()
part partname of the table (one of ’all’, ’body’, ’header’, ’footer’)
Illustrations
See Also
Other borders management: border_inner_h(), border_inner_v(), border_inner(), border_outer(),border_remove(), hline_bottom(), hline_top(), hline(), surround(), vline_right(), vline()
Examples
library(officer)std_border = fp_border(color="orange")
ft <- flextable(head(iris))ft <- border_remove(x = ft)
# add vertical border on the left side of the table

vline_right 135
ft <- vline_left(ft, border = std_border )ft
vline_right set flextable right vertical borders
Description
The function is applying vertical borders to the right side of one or all parts of a flextable. The lineis the right border of selected cells of the last column.
Usage
vline_right(x, i = NULL, border = NULL, part = "all")
Arguments
x a flextable object
i rows selection
border border properties defined by a call to fp_border()
part partname of the table (one of ’all’, ’body’, ’header’, ’footer’)
Illustrations
See Also
Other borders management: border_inner_h(), border_inner_v(), border_inner(), border_outer(),border_remove(), hline_bottom(), hline_top(), hline(), surround(), vline_left(), vline()
Examples
library(officer)std_border = fp_border(color="orange")
ft <- flextable(head(iris))ft <- border_remove(x = ft)
# add vertical border on the left side of the tableft <- vline_right(ft, border = std_border )ft

136 width
void Delete flextable content
Description
Set content display as a blank " ".
Usage
void(x, j = NULL, part = "body")
Arguments
x flextable object
j columns selection
part partname of the table
Examples
ftab <- flextable(head(mtcars))ftab <- void(ftab, ~ vs + am + gear + carb )ftab
width Set flextable columns width
Description
control columns width
Usage
width(x, j = NULL, width, unit = "in")
Arguments
x flextable object
j columns selection
width width in inches
unit unit for width, one of "in", "cm", "mm".
Details
Heights are not used when flextable is been rendered into HTML.

width 137
Illustrations
See Also
Other flextable dimensions: autofit(), dim.flextable(), dim_pretty(), fit_to_width(),flextable_dim(), height(), hrule(), ncol_keys(), nrow_part(), set_table_properties()
Examples
ft <- flextable(head(iris))ft <- width(ft, width = 1.5)ft
Index
∗ as_flextable methodsas_flextable, 16as_flextable.gam, 16as_flextable.glm, 17as_flextable.grouped_data, 18as_flextable.htest, 19as_flextable.lm, 20as_flextable.tabulator, 21as_flextable.xtable, 22
∗ borders managementborder_inner, 37border_inner_h, 38border_inner_v, 39border_outer, 40border_remove, 41hline, 76hline_bottom, 77hline_top, 78surround, 119vline, 133vline_left, 134vline_right, 135
∗ cells formatterscolformat_char, 41colformat_date, 42colformat_datetime, 44colformat_double, 45colformat_image, 46colformat_int, 47colformat_lgl, 48colformat_num, 49compose, 53set_formatter, 111
∗ chunk elements for paragraphas_b, 12as_bracket, 13as_chunk, 14as_equation, 15as_highlight, 25
as_i, 26as_image, 27as_sub, 30as_sup, 31colorize, 52gg_chunk, 72hyperlink_text, 80linerange, 86lollipop, 88minibar, 94plot_chunk, 99
∗ flextable dimensionsautofit, 32dim.flextable, 56dim_pretty, 57fit_to_width, 59flextable_dim, 62height, 74hrule, 79ncol_keys, 95nrow_part, 96set_table_properties, 115width, 136
∗ flextable merging functionmerge_at, 89merge_h, 90merge_h_range, 91merge_none, 91merge_v, 92
∗ flextable print functionas_raster, 29df_printer, 55flextable_to_rmd, 63htmltools_value, 80knit_print.flextable, 82plot.flextable, 98print.flextable, 100save_as_docx, 104save_as_html, 105
138

INDEX 139
save_as_image, 106save_as_pptx, 107
∗ functions for defining formattingproperties
fp_border_default, 70fp_text_default, 70
∗ functions related to themesget_flextable_defaults, 72set_flextable_defaults, 109theme_alafoli, 124theme_booktabs, 125theme_box, 126theme_tron, 127theme_tron_legacy, 128theme_vader, 129theme_vanilla, 130theme_zebra, 131
∗ headers and footersadd_header, 6add_header_lines, 7add_header_row, 8set_header_footer_df, 113set_header_labels, 114
∗ sugar functions for table stylealign, 9bg, 34bold, 36color, 51empty_blanks, 58font, 66fontsize, 67highlight, 75italic, 81line_spacing, 87padding, 96rotate, 102valign, 132
add_body, 5add_footer (add_header), 6add_footer(), 5add_footer_lines (add_header_lines), 7add_footer_row (add_header_row), 8add_header, 6, 8, 9, 113, 115add_header(), 5add_header_lines, 6, 7, 9, 113, 115add_header_row, 6, 8, 8, 113, 115add_latex_dep, 9add_latex_dep(), 84
align, 9, 34, 37, 51, 58, 67, 76, 82, 88, 97,103, 133
align_nottext_col (align), 9align_text_col (align), 9append_chunks, 10as_b, 12, 13–15, 25–27, 30, 31, 52, 73, 81, 87,
89, 94, 100as_bracket, 12, 13, 14, 15, 25–27, 30, 31, 52,
73, 81, 87, 89, 94, 100as_chunk, 12, 13, 14, 15, 25–27, 30, 31, 52,
73, 81, 87, 89, 94, 100as_chunk(), 10, 11, 28, 71as_equation, 12–14, 15, 25–27, 30, 31, 52,
73, 81, 87, 89, 94, 100as_flextable, 16, 17–21, 23as_flextable(), 21as_flextable.gam, 16, 16, 17–21, 23as_flextable.glm, 16, 17, 17, 18–21, 23as_flextable.grouped_data, 16, 17, 18,
19–21, 23as_flextable.grouped_data(), 25as_flextable.htest, 16–18, 19, 20, 21, 23as_flextable.lm, 16–19, 20, 21, 23as_flextable.tabulator, 16–20, 21, 23as_flextable.tabulator(), 122as_flextable.xtable, 16–21, 22as_grouped_data, 24as_grouped_data(), 18, 21, 122as_highlight, 12–15, 25, 26, 27, 30, 31, 52,
73, 81, 87, 89, 94, 100as_i, 12–15, 25, 26, 27, 30, 31, 52, 73, 81, 87,
89, 94, 100as_image, 12–15, 25, 26, 27, 30, 31, 52, 73,
81, 87, 89, 94, 100as_image(), 28as_paragraph, 28as_paragraph(), 12–15, 25–27, 30, 31, 52,
53, 69, 72, 80, 86–89, 94, 99, 121as_raster, 29, 56, 64, 80, 84, 99, 101,
104–107as_raster(), 98as_sub, 12–15, 25–27, 30, 31, 52, 73, 81, 87,
89, 94, 100as_sup, 12–15, 25–27, 30, 31, 52, 73, 81, 87,
89, 94, 100autofit, 32, 57, 59, 62, 75, 79, 95, 96, 103,
116, 137autofit(), 61, 62, 84, 98
140 INDEX
before, 33bg, 10, 34, 37, 51, 58, 67, 76, 82, 88, 97, 103,
133body_add_flextable, 35body_replace_flextable_at_bkm
(body_add_flextable), 35bold, 10, 34, 36, 51, 58, 67, 76, 82, 88, 97,
103, 133border_inner, 37, 38–41, 77, 78, 120,
133–135border_inner_h, 37, 38, 39–41, 77, 78, 120,
133–135border_inner_h(), 119border_inner_v, 37, 38, 39, 40, 41, 77, 78,
120, 133–135border_inner_v(), 119border_outer, 37–39, 40, 41, 77, 78, 120,
133–135border_outer(), 119border_remove, 37–40, 41, 77, 78, 120,
133–135
colformat_char, 41, 43, 44, 46–50, 53, 112colformat_date, 42, 42, 44, 46–50, 53, 112colformat_datetime, 42, 43, 44, 46–50, 53,
112colformat_double, 42–44, 45, 47–50, 53,
112colformat_double(), 49, 110, 112colformat_image, 42–44, 46, 46, 48–50, 53,
112colformat_int, 42–44, 46, 47, 47, 49, 50, 53,
112colformat_int(), 110colformat_lgl, 42–44, 46–48, 48, 50, 53, 112colformat_num, 42–44, 46–49, 49, 53, 112colformat_num(), 5, 6, 110color, 10, 34, 37, 51, 58, 67, 76, 82, 88, 97,
103, 133colorize, 12–15, 25–27, 30, 31, 52, 73, 81,
87, 89, 94, 100compose, 42–44, 46–50, 53, 112compose(), 4, 14, 15, 27, 28, 62, 72, 80, 81,
86–89, 94, 99, 121continuous_summary, 54
delete_part, 55df_printer, 29, 55, 64, 80, 84, 99, 101,
104–107
df_printer(), 132dim.flextable, 32, 56, 57, 59, 62, 75, 79, 95,
96, 116, 137dim_pretty, 32, 57, 57, 59, 62, 75, 79, 95, 96,
103, 116, 137dim_pretty(), 32, 98div(), 80
empty_blanks, 10, 34, 37, 51, 58, 67, 76, 82,88, 97, 103, 133
fit_to_width, 32, 57, 59, 62, 75, 79, 95, 96,116, 137
fix_border_issues, 60flextable, 60flextable(), 5, 109, 132flextable-package, 4flextable_dim, 32, 57, 59, 62, 75, 79, 95, 96,
116, 137flextable_html_dependency, 63flextable_to_rmd, 29, 56, 63, 80, 84, 99,
101, 104–107flextable_to_rmd(), 83fmt_2stats, 65fmt_2stats(), 118font, 10, 34, 37, 51, 58, 66, 67, 76, 82, 88, 97,
103, 133fontsize, 10, 34, 37, 51, 58, 67, 67, 76, 82,
88, 97, 103, 133footers_flextable_at_bkm, 68footnote, 68footnote(), 62format(), 48–50formatC, 110formatC(), 45, 50fp_border(), 21, 37–40, 70, 76–78, 133–135fp_border_default, 70, 71fp_border_default(), 21fp_text(), 70fp_text_default, 70, 70
get_flextable_defaults, 72, 111, 124–130,132
get_flextable_defaults(), 109gg_chunk, 12–15, 25–27, 30, 31, 52, 72, 81,
87, 89, 94, 100gg_chunk(), 11
headers_flextable_at_bkm, 73

INDEX 141
height, 32, 57, 59, 62, 74, 79, 95, 96, 116, 137height(), 98height_all (height), 74highlight, 10, 34, 37, 51, 58, 67, 75, 82, 88,
97, 103, 133hline, 37–41, 76, 77, 78, 120, 133–135hline(), 33, 70, 119hline_bottom, 37–41, 77, 77, 78, 120,
133–135hline_top, 37–41, 77, 78, 120, 133–135hline_top(), 119hrule, 32, 57, 59, 62, 75, 79, 95, 96, 116, 137hrule(), 74, 75HTML, 80htmltools_value, 29, 56, 64, 80, 84, 99, 101,
104–107hyperlink_text, 12–15, 25–27, 30, 31, 52,
73, 80, 87, 89, 94, 100hyperlink_text(), 28
init_flextable_defaults(set_flextable_defaults), 109
italic, 10, 34, 37, 51, 58, 67, 76, 81, 88, 97,103, 133
knit_meta_add(), 9knit_print.flextable, 29, 56, 63, 64, 80,
82, 99, 101, 104–108knit_print.flextable(), 61, 62, 101
line_spacing, 10, 34, 37, 51, 58, 67, 76, 82,87, 97, 103, 133
linerange, 12–15, 25–27, 30, 31, 52, 73, 81,86, 89, 94, 100
lollipop, 12–15, 25–27, 30, 31, 52, 73, 81,87, 88, 94, 100
merge_at, 89, 90–93merge_h, 90, 90, 91–93merge_h(), 6merge_h_range, 90, 91, 92, 93merge_none, 90, 91, 91, 93merge_v, 90–92, 92merge_v(), 6minibar, 12–15, 25–27, 30, 31, 52, 73, 81, 87,
89, 94, 100minibar(), 28mk_par (compose), 53mk_par(), 65, 121
ncol_keys, 32, 57, 59, 62, 75, 79, 95, 96, 116,137
nrow_part, 32, 57, 59, 62, 75, 79, 95, 96, 116,137
officer::fp_text(), 14, 81officer::ph_location_type(), 98officer::read_pptx(), 97officer::run_autonum(), 108officer::styles_info(), 108
padding, 10, 34, 37, 51, 58, 67, 76, 82, 88, 96,103, 133
par(), 99ph_with.flextable, 97plot.flextable, 29, 56, 64, 80, 84, 98, 101,
104–107plot_chunk, 12–15, 25–27, 30, 31, 52, 73, 81,
87, 89, 94, 99print.flextable, 29, 56, 64, 80, 84, 99, 100,
104–107proc_freq, 101prop_section, 104
qflextable (flextable), 60
regulartable (flextable), 60rotate, 10, 34, 37, 51, 58, 67, 76, 82, 88, 97,
102, 133
save_as_docx, 29, 56, 64, 80, 84, 99, 101,104, 105–107
save_as_html, 29, 56, 64, 80, 84, 99, 101,104, 105, 106, 107
save_as_image, 29, 56, 64, 80, 84, 99, 101,104, 105, 106, 107
save_as_pptx, 29, 56, 64, 80, 84, 99, 101,104–106, 107
set_caption, 107set_caption(), 62set_flextable_defaults, 72, 109, 124–130,
132set_flextable_defaults(), 60, 61, 70,
124–131set_footer_df (set_header_footer_df),
113set_formatter, 42–44, 46–50, 53, 111set_formatter(), 50set_formatter_type (set_formatter), 111
142 INDEX
set_header_df (set_header_footer_df),113
set_header_footer_df, 6, 8, 9, 113, 115set_header_labels, 6, 8, 9, 113, 114set_table_properties, 32, 57, 59, 62, 75,
79, 95, 96, 115, 137sprintf(), 65strptime(), 43, 44, 111style, 116style(), 62summarizor, 117summarizor(), 21, 65, 122summary.tabulator (tabulator), 120surround, 37–41, 77, 78, 119, 133–135
tabulator, 120tabulator(), 21, 65, 117theme_alafoli, 72, 111, 124, 125–130, 132theme_booktabs, 72, 111, 124, 125, 126–130,
132theme_booktabs(), 62theme_box, 72, 111, 124, 125, 126, 127–130,
132theme_tron, 72, 111, 124–126, 127, 128–130,
132theme_tron_legacy, 72, 111, 124–127, 128,
129, 130, 132theme_vader, 72, 111, 124–128, 129, 130, 132theme_vanilla, 72, 111, 124–129, 130, 132theme_zebra, 72, 111, 124–130, 131
use_df_printer, 132use_df_printer(), 55
valign, 10, 34, 37, 51, 58, 67, 76, 82, 88, 97,103, 132
vline, 37–41, 77, 78, 120, 133, 134, 135vline(), 70, 119vline_left, 37–41, 77, 78, 120, 133, 134, 135vline_left(), 119vline_right, 37–41, 77, 78, 120, 133, 134,
135void, 136
width, 32, 57, 59, 62, 75, 79, 95, 96, 103, 116,136
width(), 98
xtable_to_flextable(as_flextable.xtable), 22