Embed Size (px)
DESCRIPTION
Flexible Web Visualization for Alert-Based Network Security Analytics. Lihua Hao 1 , Christopher G. Healey 1 , Steve E. Hutchinson 2 1 North Carolina State University, 2 U.S. Army Research Laboratory [email protected] ARO MURI Meeting, ASU, October 29, 2013. Introduction. - PowerPoint PPT Presentation
Citation preview
1/22
Flexible Web Visualization for Alert-Based Network Security Analytics
Lihua Hao1, Christopher G. Healey1, Steve E. Hutchinson2
1North Carolina State University, 2U.S. Army Research Laboratory
ARO MURI Meeting, ASU, October 29, 2013
2/22
Introduction
• Building a visualization tool for Army Research Laboratory (ARL) network security analysts
• Driven by analysts- “Do not fit our problem to your tool, but build a tool to fit our problem.”
- Our approach does not focus explicitly on network security data, but rather on network security analysts
• Balance- Meeting needs of the analysts
- Applying knowledge and best practices from visualization
• A web-based visualization tool to support flexible network data analysis
• Looking for comments & advices about an idea- Will the ongoing ensemble visualization research be useful in network security domain?- How to adjust the techniques to better fit the requirements in network security domain?
3/22
Design Constraints
1. Mental models- “Fit” the mental models the analysts use to investigate problems
2. Working environment- Integrate into the analyst’s current working environment (e.g., web browser for ARL analysts)
3. Configurability- Static, pre-defined presentations of the data are typically NOT useful
4. Accessibility- The visualizations should be familiar to analysts (avoid steep learning curve)
5. Scalability- Support query and retrieval from multiple data sources
6. Integration- Augment the analyst’s current problem-solving strategies with useful support
4/22
Existing Visualization Techniques
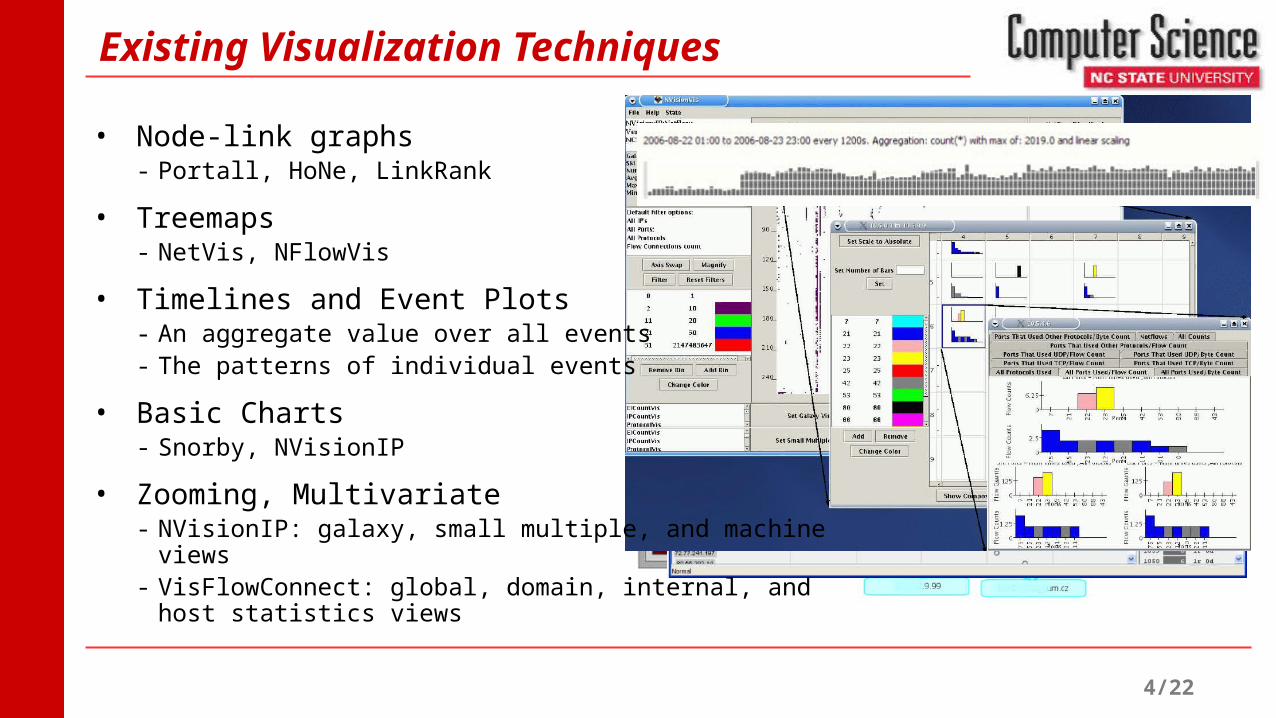
• Node-link graphs- Portall, HoNe, LinkRank
• Treemaps- NetVis, NFlowVis
• Timelines and Event Plots- An aggregate value over all events- The patterns of individual events
• Basic Charts- Snorby, NVisionIP
• Zooming, Multivariate- NVisionIP: galaxy, small multiple, and machine views- VisFlowConnect: global, domain, internal, and host statistics
views
5/22
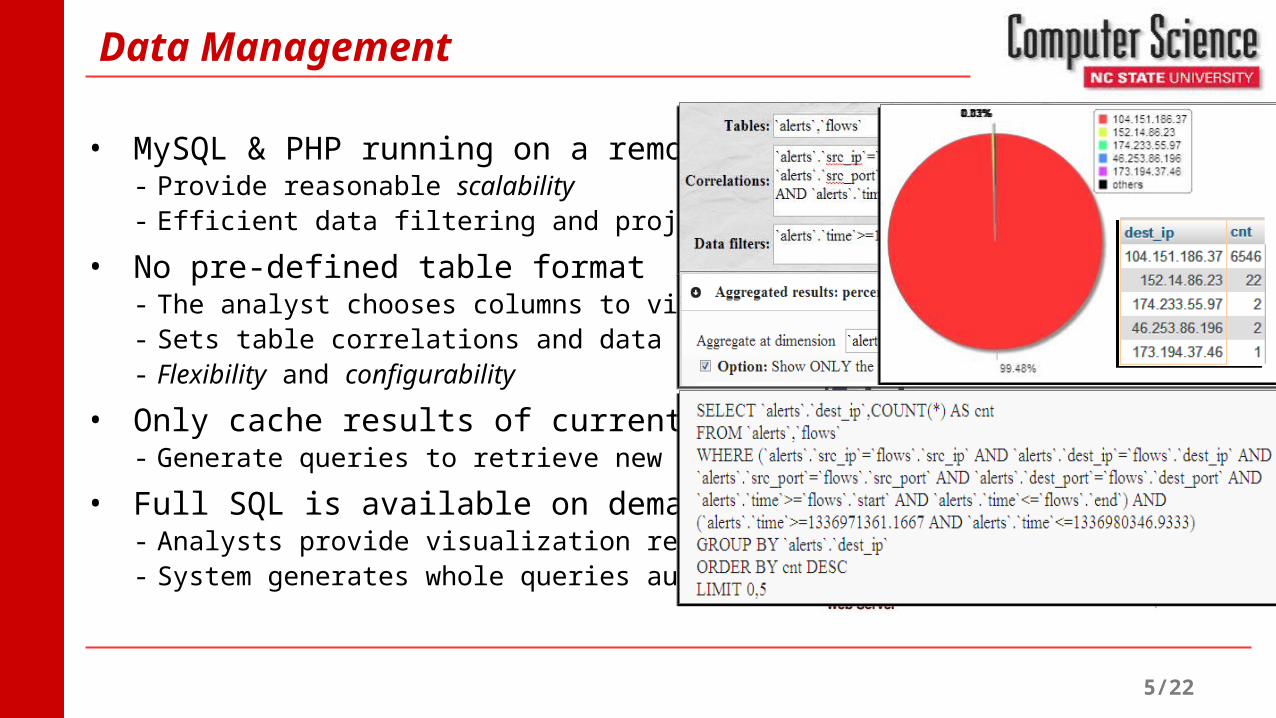
• MySQL & PHP running on a remote server- Provide reasonable scalability- Efficient data filtering and projection
• No pre-defined table format- The analyst chooses columns to visualize- Sets table correlations and data filtering- Flexibility and configurability
• Only cache results of current query in memory- Generate queries to retrieve new data on demand
• Full SQL is available on demand- Analysts provide visualization requirement- System generates whole queries automatically
Data Management
6/22
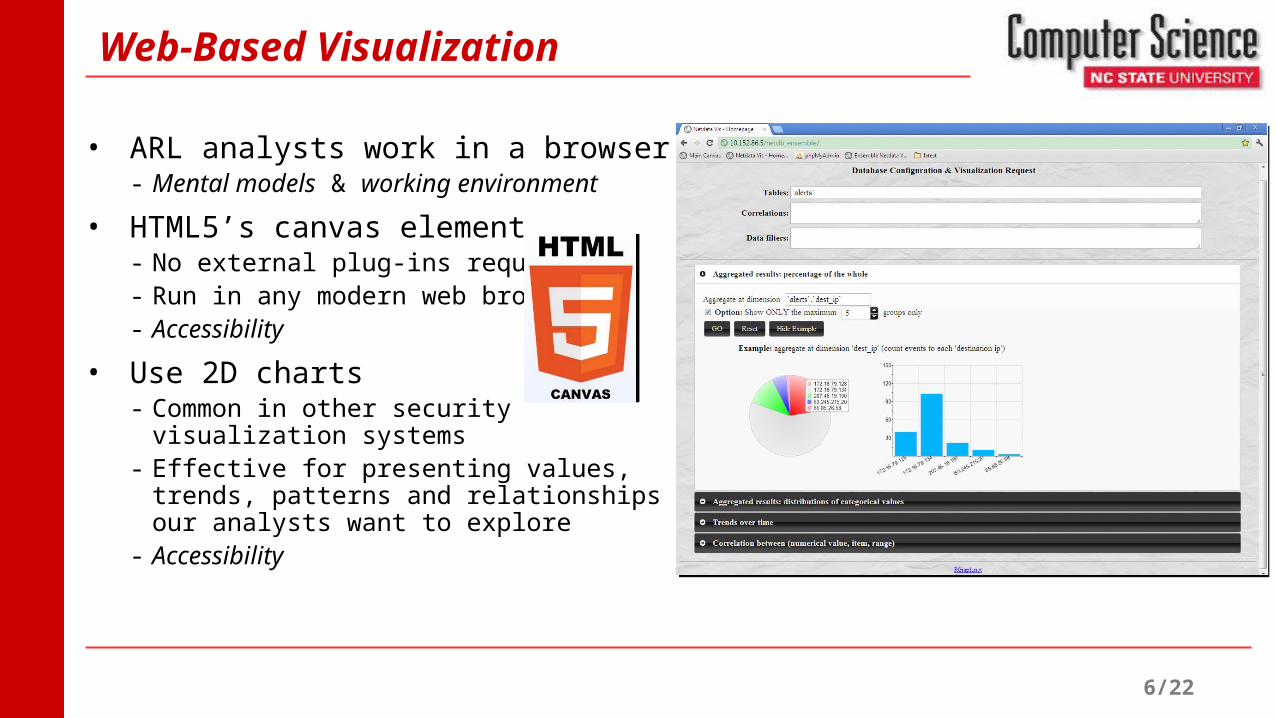
Web-Based Visualization
• ARL analysts work in a browser- Mental models & working environment
• HTML5’s canvas element- No external plug-ins required - Run in any modern web browser- Accessibility
• Use 2D charts - Common in other security visualization systems - Effective for presenting values, trends, patterns
and relationships our analysts want to explore- Accessibility
7/22
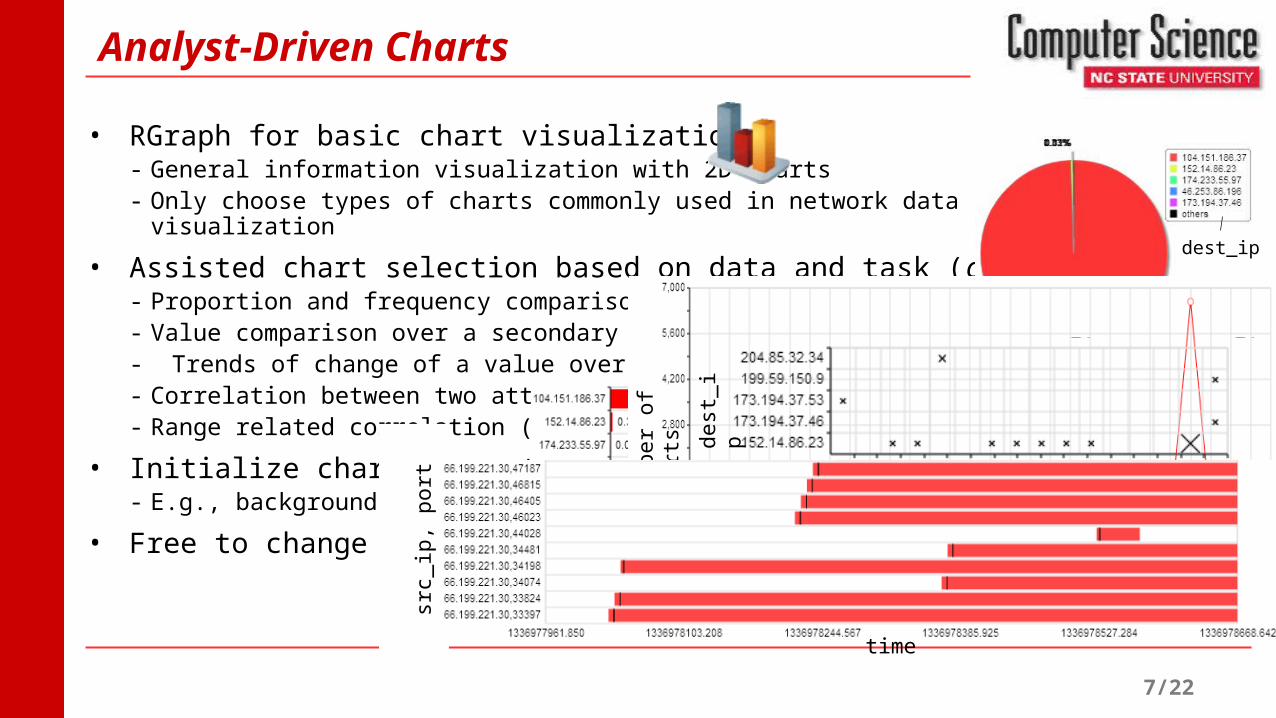
• RGraph for basic chart visualizations- General information visualization with 2D charts- Only choose types of charts commonly used in network data visualization
• Assisted chart selection based on data and task (capability)- Proportion and frequency comparison (pie) - Value comparison over a secondary attribute (bar)- Trends of change of a value over time (line)- Correlation between two attributes (scatterplots)- Range related correlation (gantt)
• Initialize chart properties - E.g., background grids, glyph size, color and type
• Free to change the initial choices
dest_ip
Analyst-Driven Charts
timeN
umbe
r of
aler
ts dest
_ip
src_ip
src
_ip,
por
t
time
8/22
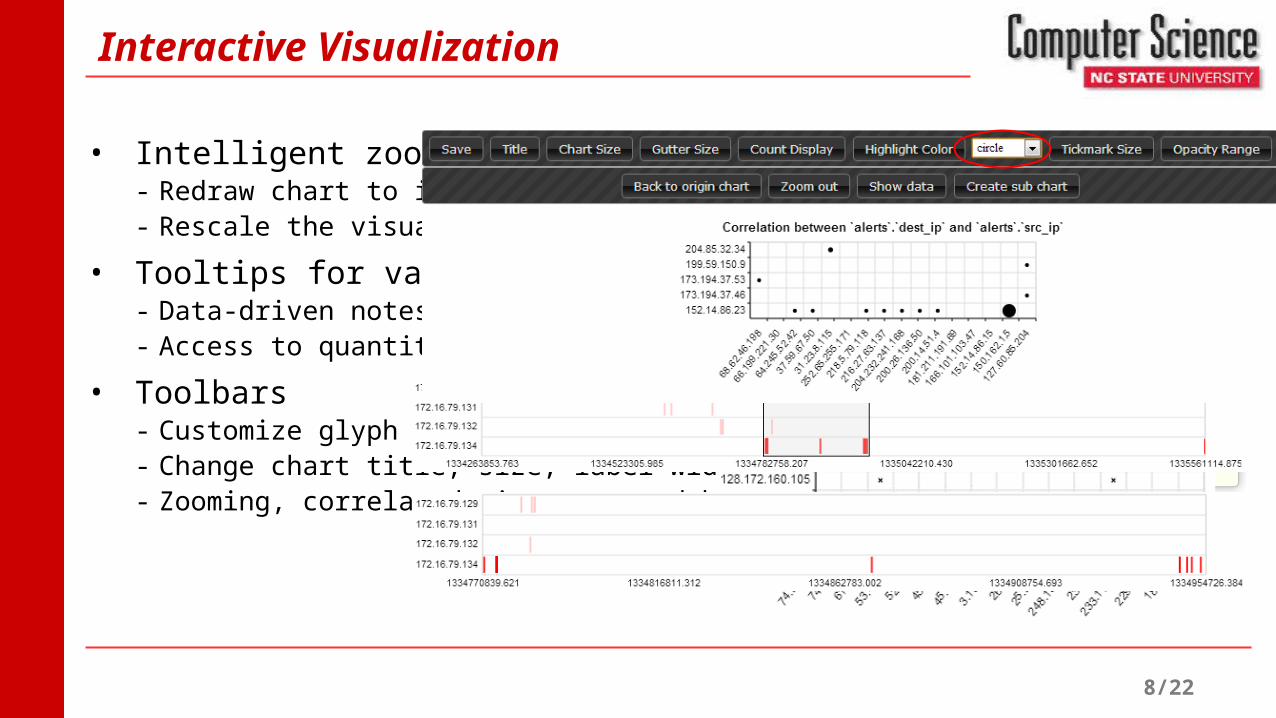
• Intelligent zoom- Redraw chart to include only the selected chart elements- Rescale the visual attributes of chart elements
• Tooltips for value query- Data-driven notes attached to chart elements- Access to quantitative data on demand
• Toolbars- Customize glyph size, color, size- Change chart title, size, label width, and so on- Zooming, correlated views, spreadsheets
Interactive Visualization
9/22
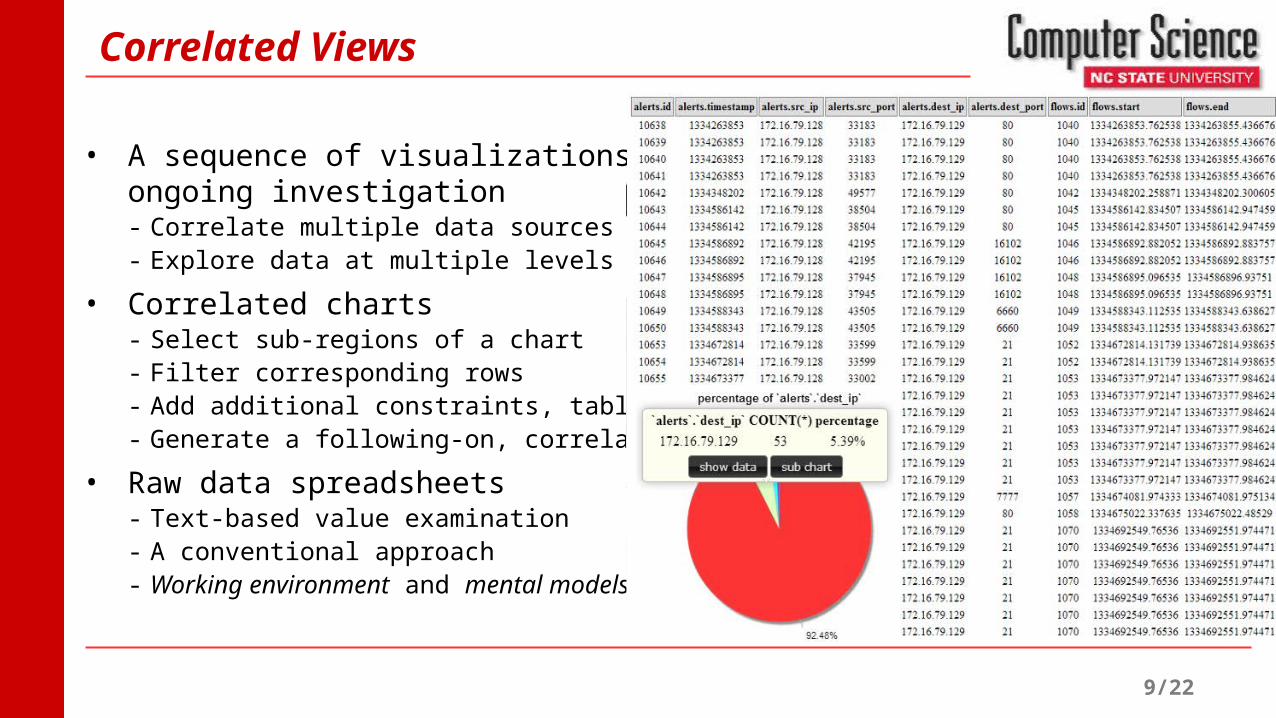
• A sequence of visualizations to track an ongoing investigation- Correlate multiple data sources- Explore data at multiple levels of details
• Correlated charts- Select sub-regions of a chart- Filter corresponding rows- Add additional constraints, tables, attributes- Generate a following-on, correlated chart
• Raw data spreadsheets- Text-based value examination- A conventional approach- Working environment and mental models
Correlated Views
10/22
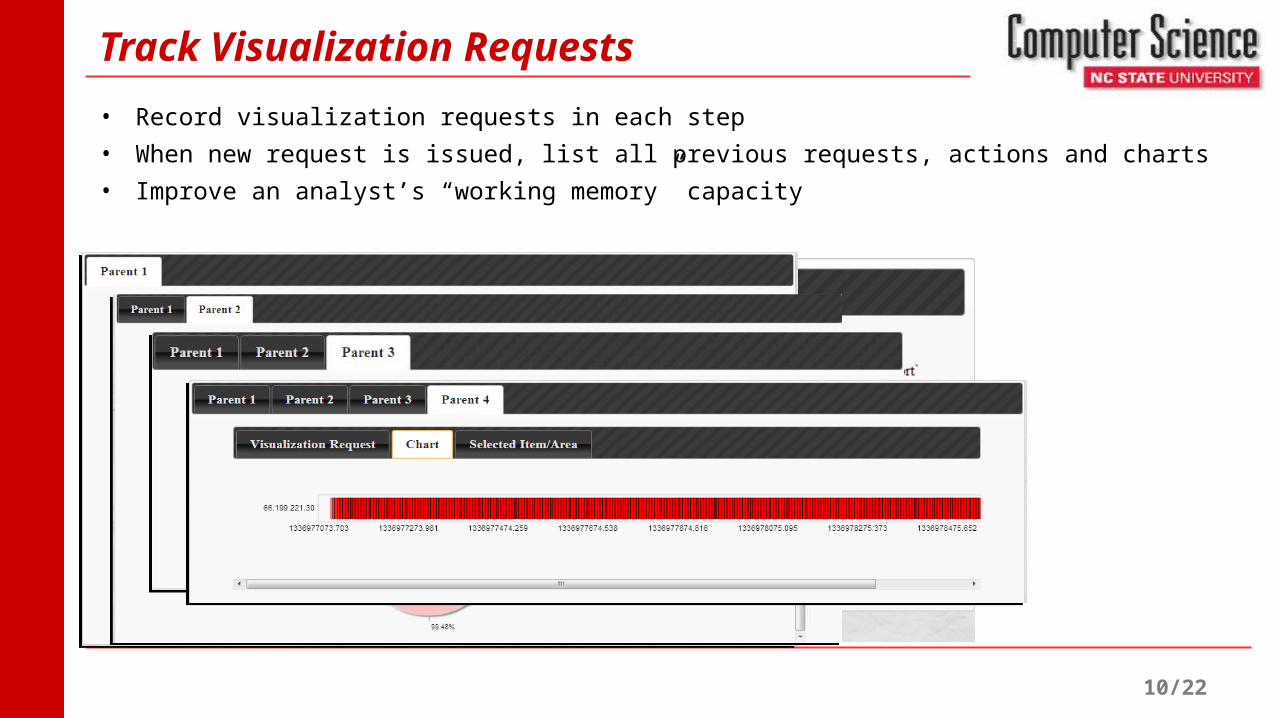
• Record visualization requests in each step
• When new request is issued, list all previous requests, actions and charts
• Improve an analyst’s “working memory” capacity
Track Visualization Requests
11/22
Trap Data
• Need real world data to test the system
• For security reasons, it is not possible to use data from ARL for testing
• The trap server - Data from network security researchers at NCSU- Real world network traffic in Computer Science building- Transmitted to a Snort sensor to perform: (1) intrusion detection and (2) extraction of network packets- Stores two types of data: (1) NetFlow data and (2) Snort alerts
• An example file for 24 hours of data- 17.4GB of packet headers- 938K unique source IPs, 168K unique destination IPs- 1.6M flows with 615K alerts
12/22
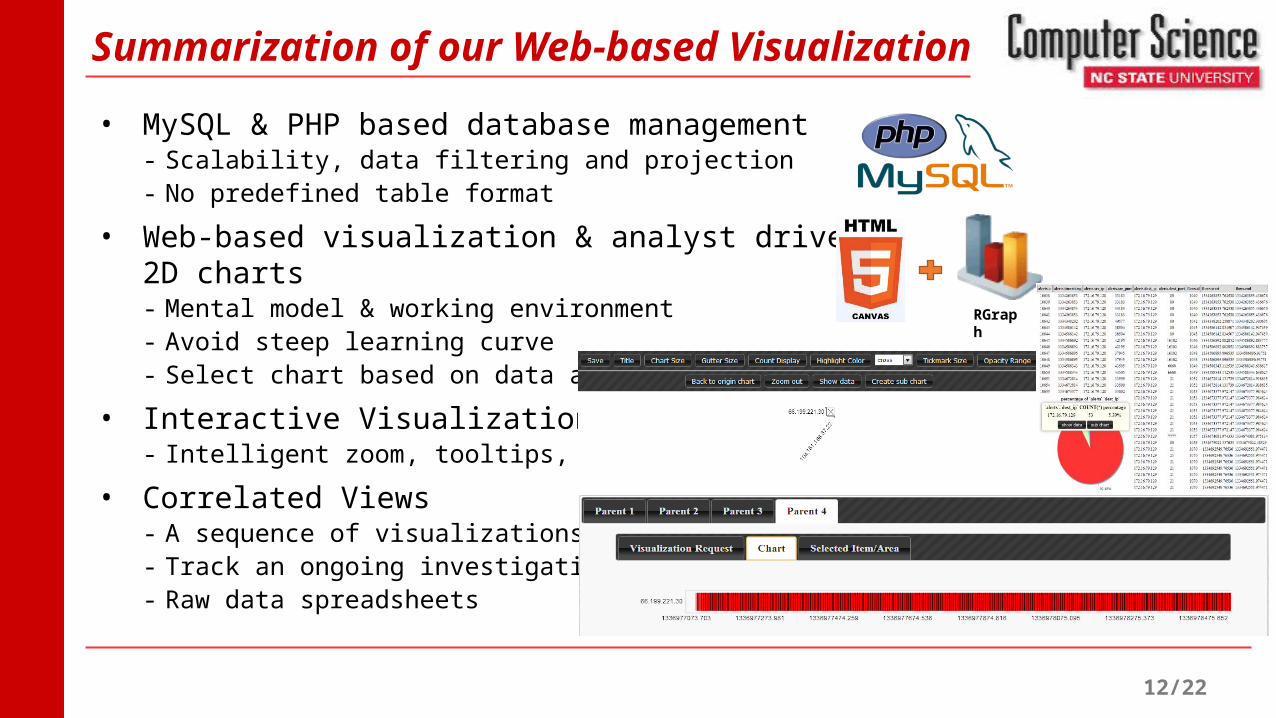
• MySQL & PHP based database management- Scalability, data filtering and projection- No predefined table format
• Web-based visualization & analyst driven 2D charts- Mental model & working environment- Avoid steep learning curve- Select chart based on data and task
• Interactive Visualization- Intelligent zoom, tooltips, toolbar
• Correlated Views- A sequence of visualizations- Track an ongoing investigation- Raw data spreadsheets
Summarization of our Web-based Visualization
RGraph
13/22
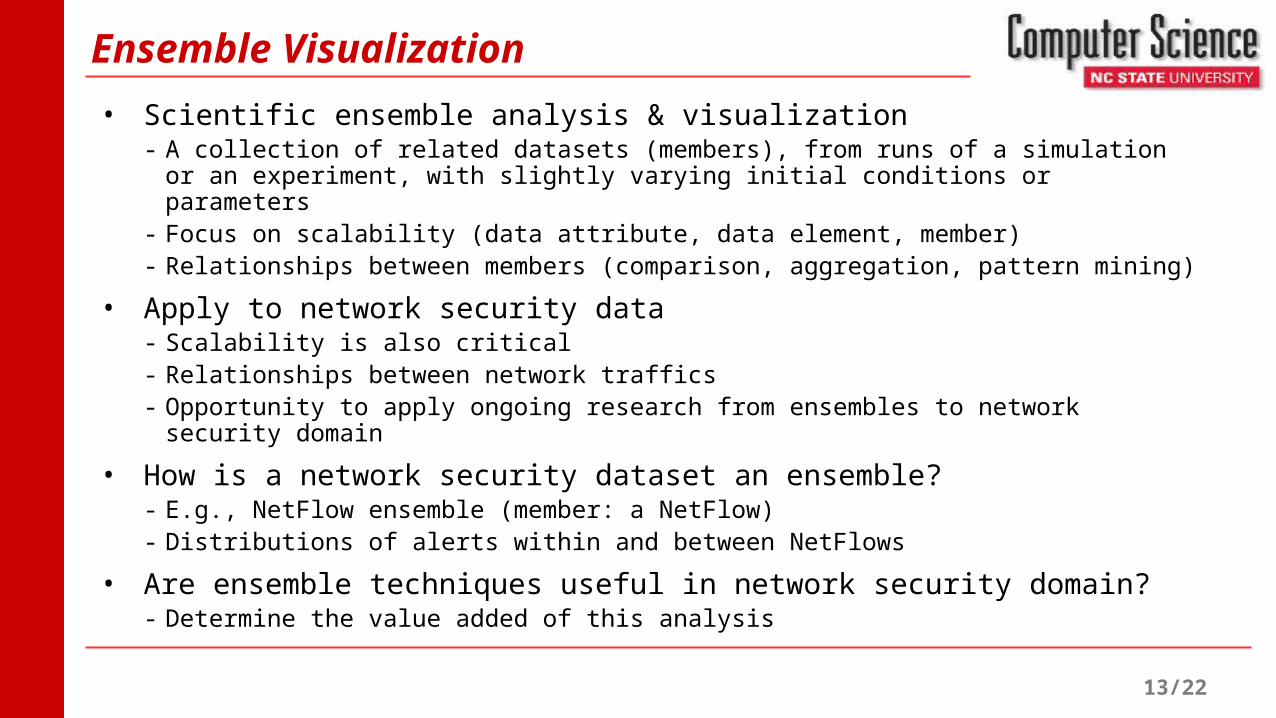
Ensemble Visualization
• Scientific ensemble analysis & visualization- A collection of related datasets (members), from runs of a simulation or an experiment, with
slightly varying initial conditions or parameters - Focus on scalability (data attribute, data element, member)- Relationships between members (comparison, aggregation, pattern mining)
• Apply to network security data- Scalability is also critical- Relationships between network traffics- Opportunity to apply ongoing research from ensembles to network security domain
• How is a network security dataset an ensemble?- E.g., NetFlow ensemble (member: a NetFlow)- Distributions of alerts within and between NetFlows
• Are ensemble techniques useful in network security domain?- Determine the value added of this analysis
14/22
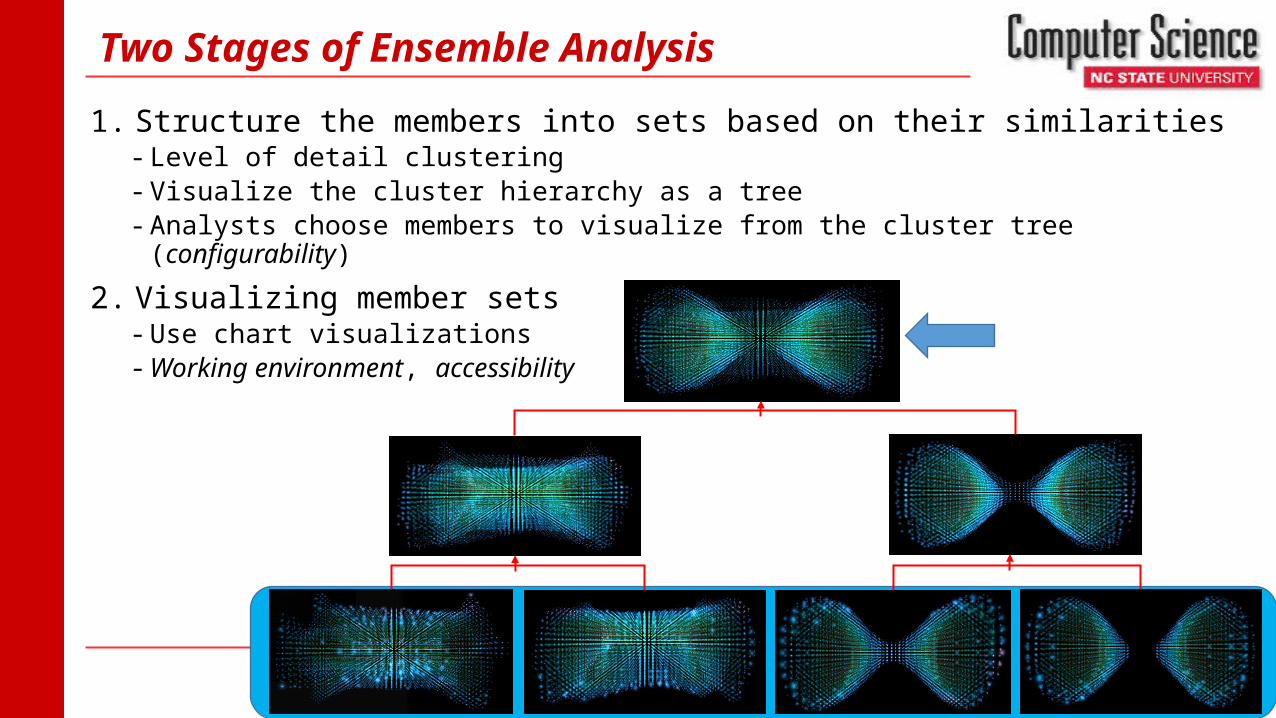
Two Stages of Ensemble Analysis
1. Structure the members into sets based on their similarities- Level of detail clustering- Visualize the cluster hierarchy as a tree- Analysts choose members to visualize from the cluster tree (configurability)
2. Visualizing member sets- Use chart visualizations- Working environment, accessibility
15/22
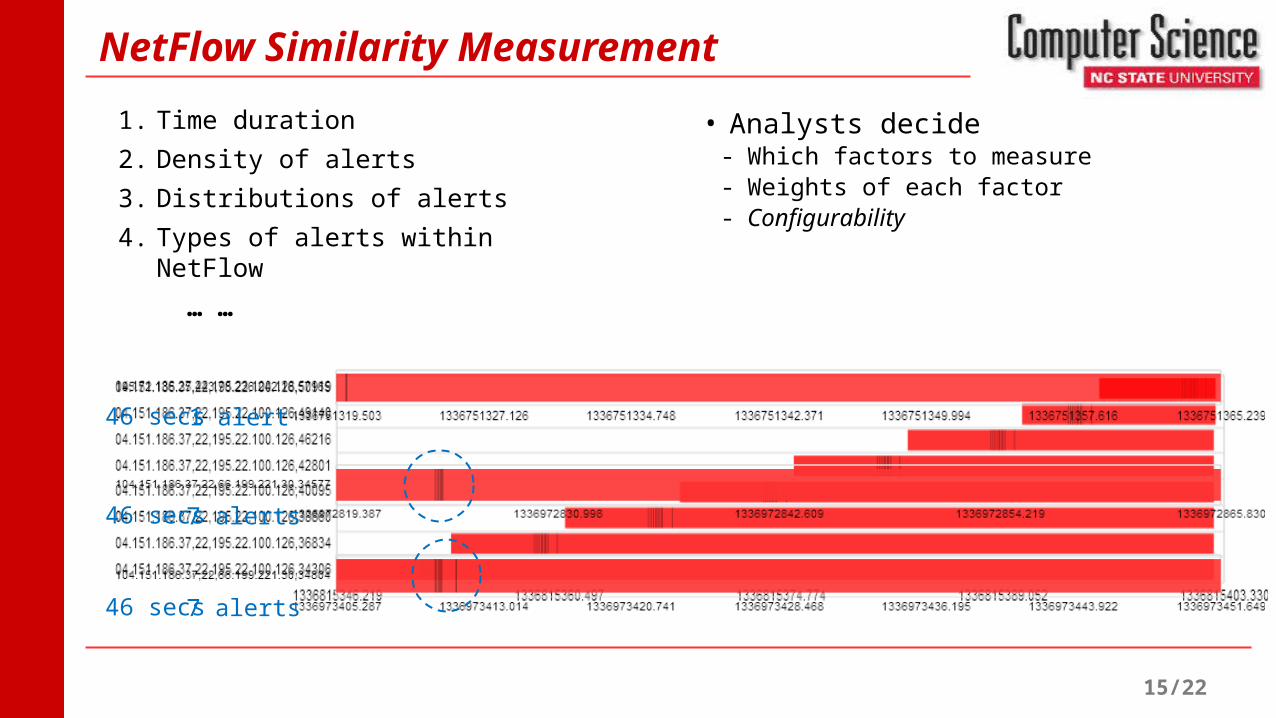
NetFlow Similarity Measurement
1. Time duration
2. Density of alerts
3. Distributions of alerts
4. Types of alerts within NetFlow
… …
• Analysts decide - Which factors to measure- Weights of each factor- Configurability
46 secs
46 secs
46 secs
1 alert
7 alerts
7 alerts
16/22
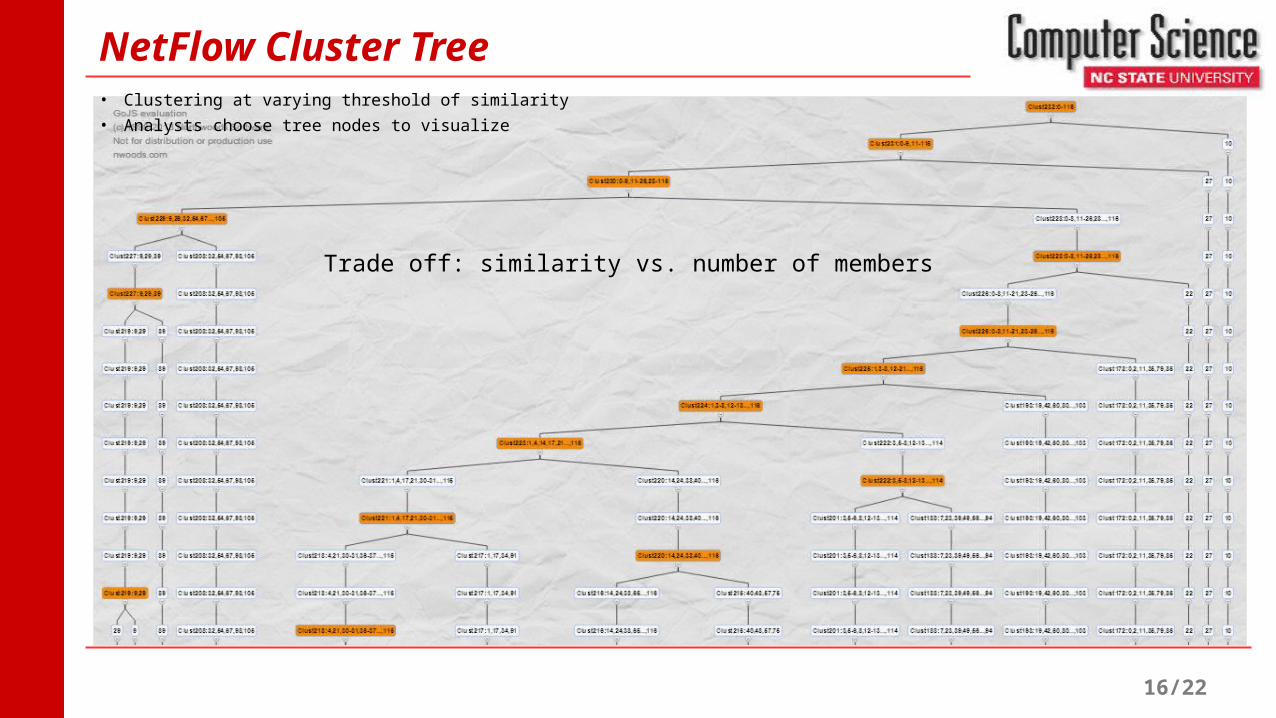
NetFlow Cluster Tree• Clustering at varying threshold of similarity
• Analysts choose tree nodes to visualize
Trade off: similarity vs. number of members
17/22
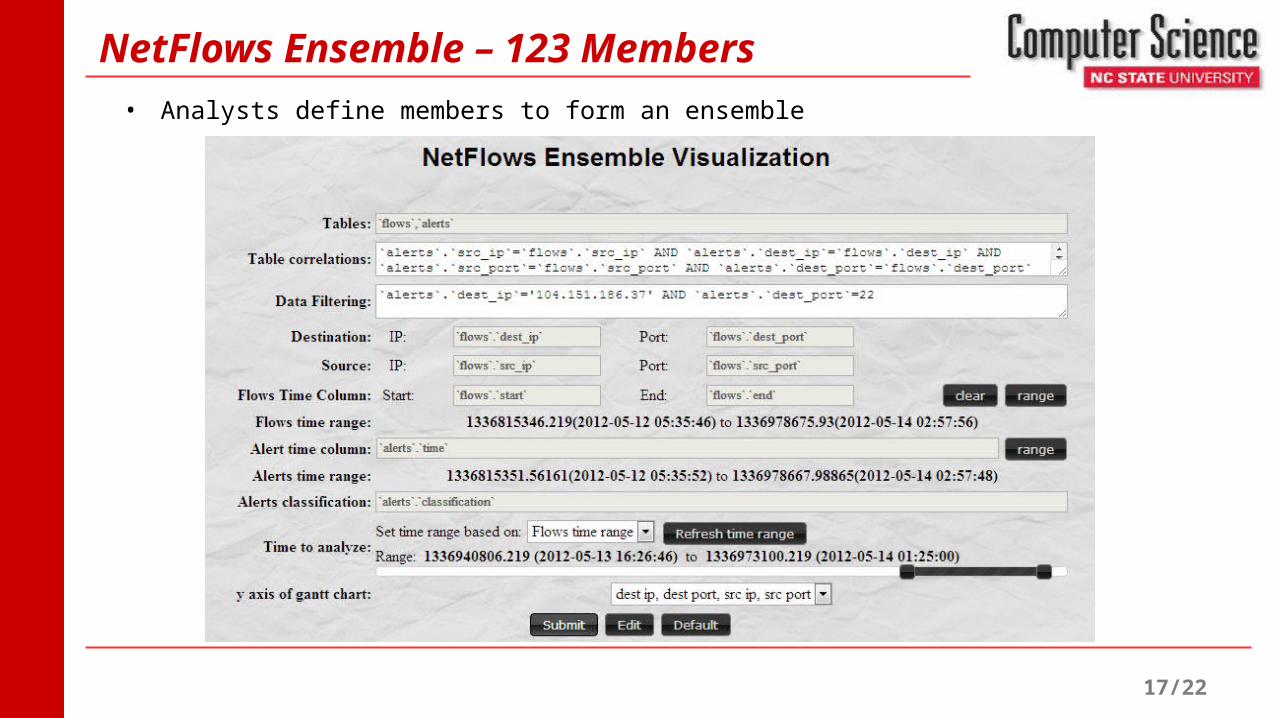
• Analysts define members to form an ensemble
NetFlows Ensemble – 123 Members
18/22
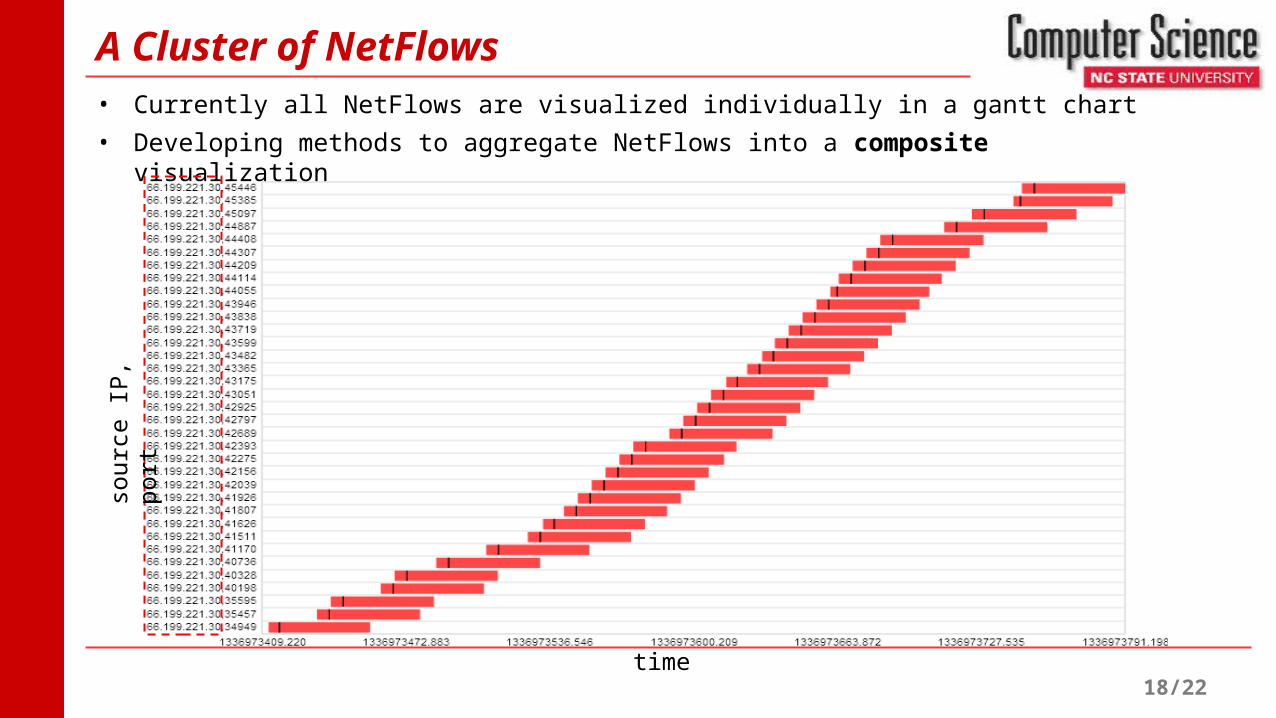
A Cluster of NetFlows
• Currently all NetFlows are visualized individually in a gantt chart
• Developing methods to aggregate NetFlows into a composite visualizationso
urce
IP,
port
time
19/22
Feedbacks for Further Adjustment
• Ensemble analysis and visualization is flexible- Techniques vary based on requirements of applications
• Different perspectives to define a network ensemble (member)?
• Useful ways to measure correlations between ensemble members?
• Useful ways to structure ensemble members?
• Special requirements for the composite visualization?
• Other recommendations?
20/22
Future Work
• Analysis Sandbox- Individual analyses can be performed, stored, reviewed and compared- Improve an analyst’s “working memory” capacity
• Analysis Preferences- Track an analyst’s actions to better anticipate their strategies for specific types of tasks- Use preference elicitation algorithms to track an analyst’s interest within a visualization session
• Real-world Integration- Not allowed to speak directly with the analysts- Coordinate with IT staffs who support the analysts
• Ensemble Visualization- Further adjust existing techniques to meet the requirements in network security domain- Integrate into the web-based network security visualization tool
21/22
Progress Summary
• Papers- Flexible Web Visualization for Alert-Based Network Security Analytics. Hao,
Healey, and Hutchinson. In Proceedings VizSec 2013 (Atlanta, GA), 2013.
• Students supported- Lihua Hao, PhD candidate, NC State University
• Projects supported- Web-based visualization for network security analytics- Ensemble visualization for network security analytics
22/22
FY 2014 Research Plan
• Validation of web-based tool with ARL collaborators- Finalize web-based visualization tool- Present tool to ARL IT staff- Integrate feedback into tool’s design, iterate on requested changes and improvements
• Investigation of scalability support through ensemble visualization- Confirm interest in pursuing scalability support- Integrate ensemble visualization research into web-based visualization tool- Update visualizations to support intelligent summarization and aggregation


![Flexible Web Visualization for Alert-Based Network Security … · 2014-03-08 · nications in a network. Picviz [16] uses parallel coordinates to present relationships between multiple](https://img.pdfslide.us/doc/110x75/5ec64f6cb7ba2117d5289292/flexible-web-visualization-for-alert-based-network-security-2014-03-08-nications.jpg)