Embed Size (px)
Citation preview
STATE OF FLORIDA
FLEXIBLE PAVEMENTSMOOTHNESS ACCEPTANCE REPORT
INTERNATIONAL ROUGHNESS INDEX
FL/DOT/SMO/10-535June 2010
STATE MATERIALS OFFICE

PAGE
LEFT BLANK
Glenn Salvo
John Schiffermuller
2) Under Most Requested, select Research Reports
William Bryant
Gregory Beckner
Stacy Scott
Melissa Lira
Alexander Mraz
This report is a result of the dedicated effort and contribution by the following individuals:
Tom Byron
Kyle Kroodsma
To access the electronic copy of this and other reports, please follow the steps below:
http://www.dot.state.fl.us/statematerialsoffice/
1) Logon to the State Materials Office's website, located at the following URL:
** Title 23 U.S.C. Section 409, provides that this information provided to you is not subject to discovery nor is it
admissible into evidence.
i

PAGE
LEFT BLANK
ii

Executive Summary ……………………………………………………………………………………………. 1
TABLE OF CONTENTS
List of Tables ………………………………………………………………………………………………….. vii
List of Figures …………………………………………………………………………………………………. v
Statewide Ride Distribution …………………………………………………………………………………… 7
Introduction ……………………………………………………………………………………………………. 3
Statewide Ride Distribution by Friction Course Type ………………………………………………………… 12
Statewide Contractor Statistics ………………………………………………………………………………… 21
99
District 8 Statistics (Turnpike) ………………………………………………………………………………… 109
Appendi A: C stomer Ser ice Form A 1
District 6 Statistics …………………………………………………………………………………………….. 91
Statewide Statistics …………………………………………………………………………………………….. 15
District 4 Statistics …………………………………………………………………………………………….. 67
District 1 Statistics ……………………………………………………………………………………………..
Statewide Ride Distribution by System Type …………………………………………………………………. 8
District 2 Statistics …………………………………………………………………………………………….. 45
District 5 Statistics …………………………………………………………………………………………….. 77
District 3 Statistics …………………………………………………………………………………………….. 57
District 7 Statistics ……………………………………………………………………………………………..
33
Appendix - A: Customer Service Form ……………………………………………………………………….. A-1
iii

PAGE
LEFT BLANK
iv

45
11 District 1 Ride Distribution, by Friction Course Type ………………………………………………..
No. Page
4 Statewide Ride Distribution, Interstate ……………………………………………………………….. 10
2 Statewide Ride Distribution, Primary …………………………………………………………………. 8
Statewide Ride Distribution, All Lots …………………………………………………………………. 7
13 District 2 Ride Distribution, by System Type ………………………………………………………….
9 District 1 Ride Distribution, All Lots ………………………………………………………………….
LIST OF FIGURES
7 Statewide Ride Distribution, FC 9.5 ………………………………………………………………….. 13
5 Statewide Ride Distribution, Turnpike ……………………………………………………………….. 11
16 District 3 Ride Distribution, by System Type …………………………………………………………. 58
15 District 3 Ride Distribution, All Lots …………………………………………………………………. 57
14 District 2 Ride Distribution, by Friction Course Type ……………………………………………….. 47
6
1
District 1 Ride Distribution, by System Type …………………………………………………………. 34
8 Statewide Ride Distribution, FC 12.5 …………………………………………………………………. 14
46
35
3 Statewide Ride Distribution, Toll Roads ……………………………………………………………… 9
33
Statewide Ride Distribution, FC 5 ……………………………………………………………………..
10
12
12 District 2 Ride Distribution, All Lots ………………………………………………………………….
101
District 7 Ride Distribution, All Lots …………………………………………………………………. 99
28 District 7 Ride Distribution, by System Type …………………………………………………………. 100
26 District 6 Ride Distribution, by Friction Course Type ……………………………………………….. 93
18 District 4 Ride Distribution, All Lots …………………………………………………………………. 67
59
22 District 5 Ride Distribution, by System Type …………………………………………………………. 78
District 3 Ride Distribution, by Friction Course Type ………………………………………………..
23
21 District 5 Ride Distribution, All Lots …………………………………………………………………. 77
20 District 4 Ride Distribution, by Friction Course Type ……………………………………………….. 69
19
27
17
District 4 Ride Distribution, by System Type …………………………………………………………. 68
24 District 6 Ride Distribution, All Lots …………………………………………………………………. 91
District 6 Ride Distribution, by System Type …………………………………………………………. 92
District 5 Ride Distribution, by Friction Course Type ……………………………………………….. 79
31 District 8 Ride Distribution, by Friction Course Type ……………………………………………….. 110
25
30 District 8 Ride Distribution, All Turnpike Lots ……………………………………………………….. 109
v
29 District 7 Ride Distribution, by Friction Course Type ………………………………………………..

PAGE
vi
LEFT BLANK

LIST OF TABLES
Statewide Statistical Summary for Aggregate Type, by Contractor ………………………………….. 29
District 1 Statistical Summary for System Type, by Year ……………………………………………..
5 Statewide Statistical Summary for Friction Course Type, by Aggregate Type ……………………….. 18
Page
13 36
9 Statewide Statistical Summary for Contractors ……………………………………………………….. 21
No.
1 Statewide Statistical Summary for Year ………………………………………………………………. 15
Statewide Statistical Summary for Friction Course Type, by Contractor …………………………….. 23
6 19Statewide Statistical Summary for Friction Course Type, by Binder Type ……………………………
20
7
4 Statewide Statistical Summary for Friction Course Type, by System Type ………………………….. 18
3 Statewide Statistical Summary for Friction Course Type, by Year …………………………………… 17
2 Statewide Statistical Summary for System Type, by Year ……………………………………………. 16
19
District 1 Statistical Summary for Year ……………………………………………………………….. 36
Statewide Statistical Summary for Friction Course Type, by Access Type …………………………..
10
11
8 Lane Miles Tested Per District, by Friction Course Type ……………………………………………..
12
16 District 1 Statistical Summary for Friction Course Type, by Aggregate Type ……………………….. 38
15 District 1 Statistical Summary for Friction Course Type, by System Type …………………………… 37
14 District 1 Statistical Summary for Friction Course Type, by Year ……………………………………. 37
20
30 District 2 Statistical Summary for Friction Course Type, by Contractor …………………………….. 53
26 District 2 Statistical Summary for Friction Course Type, by Aggregate Type ………………………..
District 1 Statistical Summary for Friction Course Type, by Contractor …………………………….. 41
22 District 2 Statistical Summary for Year ………………………………………………………………..
23 District 2 Statistical Summary for System Type, by Year …………………………………………….. 48
29 District 2 Statistical Summary for Contractors ……………………………………………………….. 52
28 District 2 Statistical Summary for Friction Course Type, by Access Type …………………………… 51
24
vii
District 2 Statistical Summary for Friction Course Type, by Year ……………………………………. 49
25 District 2 Statistical Summary for Friction Course Type, by System Type …………………………… 49
50
District 1 Statistical Summary for Aggregate Type, by Contractor …………………………………… 43
48
21
5531 District 2 Statistical Summary for Aggregate Type, by Contractor ……………………………………
27 District 2 Statistical Summary for Friction Course Type, by Binder Type …………………………… 50
District 1 Statistical Summary for Contractors ……………………………………………………….. 40
17 District 1 Statistical Summary for Friction Course Type, by Binder Type …………………………… 38
18 District 1 Statistical Summary for Friction Course Type, by Access Type …………………………… 39
19
37 District 3 Statistical Summary for Friction Course Type, by Binder Type …………………………… 62
36
32 District 3 Statistical Summary for Year ……………………………………………………………….. 60
No. Page
District 3 Statistical Summary for Friction Course Type, by Aggregate Type ………………………..
73
63
62
64
70
64
District 3 Statistical Summary for Friction Course Type, by Year ……………………………………. 61
District 3 Statistical Summary for System Type, by Year …………………………………………….. 60
District 3 Statistical Summary for Friction Course Type, by System Type …………………………… 61
47 District 4 Statistical Summary for Friction Course Type, by Binder Type ……………………………
42 District 4 Statistical Summary for Year ……………………………………………………………….. 70
46
41 District 3 Statistical Summary for Aggregate Type, by Contractor …………………………………… 65
District 4 Statistical Summary for Friction Course Type, by Aggregate Type ……………………….. 72
44 District 4 Statistical Summary for Friction Course Type, by Year ……………………………………. 71
District 3 Statistical Summary for Friction Course Type, by Access Type ……………………………
40 District 3 Statistical Summary for Friction Course Type, by Contractor ……………………………..
43 District 4 Statistical Summary for System Type, by Year ……………………………………………..
39 District 3 Statistical Summary for Contractors ………………………………………………………..
34
33
35
49 District 4 Statistical Summary for Contractors ……………………………………………………….. 74
38
72
45 District 4 Statistical Summary for Friction Course Type, by System Type …………………………… 71
48 District 4 Statistical Summary for Friction Course Type, by Access Type ……………………………
District 5 Statistical Summary for Friction Course Type, by Contractor …………………………….. 85
viii
57 District 5 Statistical Summary for Friction Course Type, by Binder Type …………………………… 82
56 District 5 Statistical Summary for Friction Course Type, by Aggregate Type ……………………….. 82
50 District 4 Statistical Summary for Friction Course Type, by Contractor …………………………….. 75
District 5 Statistical Summary for Aggregate Type, by Contractor …………………………………… 8761
64 District 6 Statistical Summary for Friction Course Type, by Year ……………………………………. 95
63 District 6 Statistical Summary for System Type, by Year …………………………………………….. 94
53 District 5 Statistical Summary for System Type, by Year …………………………………………….. 80
54 District 5 Statistical Summary for Friction Course Type, by Year ……………………………………. 81
59 District 5 Statistical Summary for Contractors ……………………………………………………….. 84
District 6 Statistical Summary for Year ……………………………………………………………….. 94
51 District 4 Statistical Summary for Aggregate Type, by Contractor ……………………………………
58 District 5 Statistical Summary for Friction Course Type, by Access Type …………………………… 83
52 District 5 Statistical Summary for Year ……………………………………………………………….. 80
76
55 District 5 Statistical Summary for Friction Course Type, by System Type …………………………… 81
60
62
District 8 Statistical Summary for Year ……………………………………………………………….. 111
96
69 District 6 Statistical Summary for Contractors ………………………………………………………..
68 District 6 Statistical Summary for Friction Course Type, by Access Type ……………………………
71
70 District 6 Statistical Summary for Friction Course Type, by Contractor …………………………….. 97
District 7 Statistical Summary for Friction Course Type, by System Type …………………………… 103
74
65 District 6 Statistical Summary for Friction Course Type, by System Type …………………………… 95
66 District 6 Statistical Summary for Friction Course Type, by Aggregate Type ……………………….. 96
Page
District 7 Statistical Summary for Friction Course Type, by Year …………………………………… 103
97
District 6 Statistical Summary for Aggregate Type, by Contractor …………………………………… 98
No.
76 District 7 Statistical Summary for Friction Course Type, by Aggregate Type ……………………….. 104
78 District 7 Statistical Summary for Friction Course Type, by Access Type …………………………… 105
72 District 7 Statistical Summary for Year ……………………………………………………………….. 102
District 7 Statistical Summary for System Type, by Year …………………………………………….. 10273
82
79 District 7 Statistical Summary for Contractors ……………………………………………………….. 106
77 District 7 Statistical Summary for Friction Course Type, by Binder Type …………………………… 104
80 District 7 Statistical Summary for Friction Course Type, by Contractor …………………………….. 107
75
81 District 7 Statistical Summary for Aggregate Type, by Contractor …………………………………… 108
67 District 6 Statistical Summary for Friction Course Type, by Binder Type …………………………… 96
86 District 8 Statistical Summary for Aggregate Type, by Contractor …………………………………… 113
ix
83 District 8 Statistical Summary for Aggregate Type …………………………………………………… 111
85 District 8 Statistical Summary for Contractors ……………………………………………………….. 112
84 District 8 Statistical Summary for Binder Type ……………………………………………………….. 111

PAGE
LEFT BLANK
Executive Summary
The traveling public wants smooth, safe, and long lasting pavements. Initial pavement smoothness has been
shown to improve the overall pavement performance. The Florida Department of Transportation (FDOT) has
developed smoothness specifications for the acceptance of asphalt pavements on high-speed facilities that
incorporates smoothness results obtained with high-speed inertial profilers.
This report is a synthesis of statewide project smoothness data collected from January 2005 through December
2009. It provides the end user with basic statistics on the Ride quality of projects tested for Ride Acceptance
(RA). The data analyzed herein consists of all lots greater than or equal to 0.01 mile and less than or equal to 0.1
mile in length.
The information presented herein is summarized on a statewide basis as well as by District, roadway system,
friction course, contractor, and year. Contractor statistics are further summarized by friction course type and
aggregate type. Users of the report are encouraged to return the customer service form included in Appendix A.
** Title 23 U.S.C. Section 409, provides that this information provided to you is not subject to discovery nor is it
admissible into evidence.
1

PAGE
LEFT BLANK
2

Introduction
According to National Cooperative Highway Research Program (NCHRP) project 1-31, conducted fromFebruary 1994 to December 1996 and published as NCHRP Web Document 1, "Smoothness Specifications forPavements," the importance of pavement smoothness to the travelling public is undisputed. Smooth-ridingpavements provide comfort, allow more efficient movement of vehicles over the roadway, raise optimum travelspeeds, maintain traffic flow, reduce safety hazards to users and their vehicles, and may increase fuel efficiency,leading to lower traveling costs to roadway users. Pavement smoothness also imparts a positive reflection on theconstruction and maintenance proficiency of the owner agency, be it a state agency, city, county, or tollauthority. In addition, American Association of State Highway and Transportation Officials (AASHTO)pavement design models suggest that initially smooth pavements last longer than initially rough pavements,though this has never confirmed through long-term field investigation (AASHTO design equations are based ononly 2 years of performance data).
Ride quality has been used by FDOT for evaluating new construction, overlay projects, special ride quality
evaluations used for informational purposes, and for monitoring long-term pavement performance at the network
level. To measure pavement ride quality, automated or manual methods can be used to measure roadway profiles
from which a roughness value is calculated. Most states including Florida use high-speed inertial profilers to
FDOT RIDE QUALITY
g g g p p
measure smoothness. The commonly used measures of roughness (or smoothness) are the International
Roughness Index (IRI) and Ride Number (RN). Since 1998, FDOT has been using the RN for project level
acceptance, and evaluation in accordance with American Society for Testing and Materials (ASTM) E1489.
3
The FDOT has worked very closely with the Federal Highway Administration (FHWA) and the construction
industry to improve pavement smoothness on Florida's state highways. To this end, a smoothness task team was
created with representatives from FDOT, FHWA and the paving industry to develop and implement non-contact
profiler based smoothness specifications. Sub-article 330-12.6 of the FDOT Standard Specifications sets the
requirements for Acceptance Testing for Pavement Smoothness by Laser Profiler.

The Pavement Condition Unit of the State Materials Office (SMO) is responsible for conducting smoothness
evaluation using an inertial high-speed laser profiler. Florida test method FM 5-549, "Laser Profiler Roughness
Evaluation," provides the method by which a pavement is evaluated for smoothness using the longitudinal
profiles recorded from each wheel path using an inertial profiler test vehicle.
The test vehicle is driven along the wheel paths of the pavement section to be evaluated and uses a system of
three laser sensors and two accelerometers mounted in the front bumper of a full-size van. One laser is mounted
in front of each tire to measure the longitudinal profile in the left and right wheel paths of the traveled surface.
These 32 kHz lasers measure the vertical distance between the sensor and the pavement surface at an initial rate
of 30 readings per inch as the vehicle travels at 60 mph. An accelerometer is mounted atop each of these two
lasers to isolate the vehicle's vertical motion and thus provide a "zero" reference plane. The third laser, mounted
equidistant from the two wheel path lasers, provides a height reading from which to calculate rut depth in each
wheel path. The vehicle's data acquisition system uses the accelerometer data to provide a correction to the laser
data, eliminating the effects of vehicle movement, and uses a Distance Measuring Instrument (DMI) connected to
the vehicle transmission and recording the longitudinal distance traveled to summarize the corrected laser data
into approximately 1 inch intervals. The exact interval is a function of each individual DMI's calibration
RIDE QUALITY EVALUATION PROCESS
District project personnel may submit all requests for pavement evaluations using online request forms available
at the SMO's website:
4
settings. These summary values are then post-processed into exactly 6 inch intervals to generate a longitudinal
profile for each wheel path, as well as a combined value for both wheel paths, and an average rut depth.
Intranet: http://materials.dot.state.fl.us/smo/pavement/pavementhome.htmInternet: http://www.dot.state.fl.us/statematerialsoffice/pavement/index.shtm
The laser profilers currently in use by FDOT are manufactured by International Cybernetics Corporation (ICC)
of Largo, Florida. All of these profilers are owned by FDOT with the exception of one unit that is provided
through a contract with Applied Research Associates, Inc. (ARA). Currently this profiler is the primary unit
used by the SMO for the collection of project level smoothness data.

In "Guidelines for Conducting and Calibrating Road Roughness Measurements", published by the World Bank in
1986 as Technical Paper 46, International Roughness Index (IRI) is defined as a mathematical transform (a
property) of a true profile describing surface roughness that causes vehicle vibration.
The underlying IRI model is a series of differential equations that relate the motions of a simulated quarter-car to
a road profile. The IRI is computed as a linear accumulation of the simulated suspension motion, normalized by
the length of the profile. IRI therefore has units of slope, typically "in/mi" or "m/km", and is computed from a
single longitudinal wheel path profile. It has a demonstrated strong compatibility with the equipment used to
develop pavement management systems. IRI is sensitive to wavelengths between 4 and 100 feet and is most
sensitive to wavelengths of 7 and 50 feet.
All data is analyzed according to ASTM E1926, "Standard Practice for Computing International Roughness
Index of Roads from Longitudinal Profile Measurements".
WHAT IS THE INTERNATIONAL ROUGHNESS INDEX?
5

PAGE
6
LEFT BLANK

1Statewide
Statewide Ride Distribution
10%
rcen
tage
Statewide Ride Distribution, All Lots
Total Miles: 6565.24
Figure 1 Statewide Ride Distribution, All Lots
7
St. DevIRI ≥ 86
Lots Miles
13.15 1449 125.22All Lots 67345 6565.24 24 52 269
Type TotalLots
TotalMiles Minimum Mean Maximum
0%
10%
0 14 28 42 56 70 84 98 112 126 140 >153
Perc
enta
ge
International Roughness Index (IRI)
Statewide Ride Distribution, All Lots
Total Miles: 6565.24

Primary
Statewide Ride Distribution by System Type
10%
Perc
enta
ge
Statewide Ride Distribution, Primary System Lots
Total Miles: 3860.09
1
Figure 2 Statewide Ride Distribution, Primary
Type TotalLots
TotalMiles Minimum
Lots MilesMean Maximum St. Dev
IRI ≥ 86
8
Primary 39356 52 269 12.64 769 67.103860.09 24
0%
10%
0 14 28 42 56 70 84 98 112 126 140 >153
Perc
enta
ge
International Roughness Index (IRI)
Statewide Ride Distribution, Primary System Lots
Total Miles: 3860.09
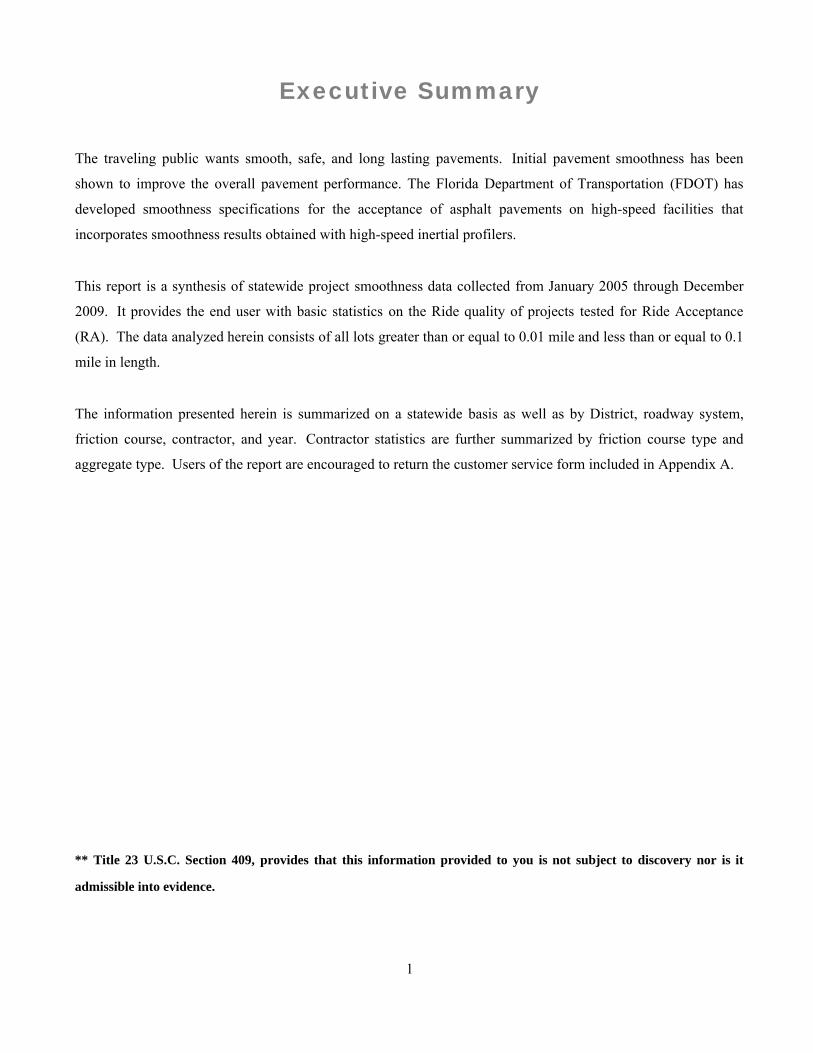
Toll Roads
10%
Perc
enta
ge
Statewide Ride Distribution, Toll System Lots
Total Miles: 22.47
Toll 243
Maximum St. Dev
22.47 42
Minimum Mean
9
58 228 9.80 4 0.10
Lots Miles
IRI ≥ 86Type Total
LotsTotalMiles
Figure 3 Statewide Ride Distribution, Toll Roads
0%
10%
0 14 28 42 56 70 84 98 112 126 140 >153
Perc
enta
ge
International Roughness Index (IRI)
Statewide Ride Distribution, Toll System Lots
Total Miles: 22.47
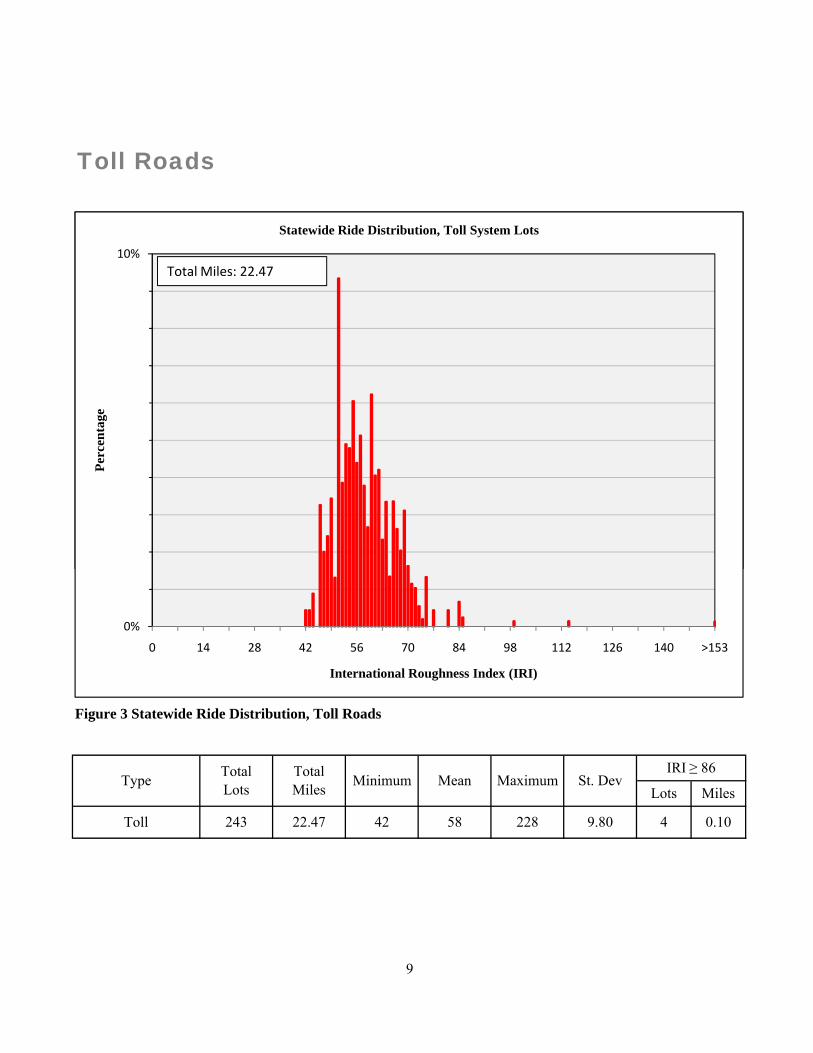
Interstate
10%
Perc
enta
ge
Statewide Ride Distribution, Interstate System Lots
Total Miles: 2472.79
Figure 4 Statewide Ride Distribution, Interstate
13.87 597 52.07
Type TotalLots
TotalMiles Minimum Mean Maximum
10
25539 2472.79Interstate 25 51 166
St. DevIRI ≥ 86
Lots Miles
0%
10%
0 14 28 42 56 70 84 98 112 126 140 >153
Perc
enta
ge
International Roughness Index (IRI)
Statewide Ride Distribution, Interstate System Lots
Total Miles: 2472.79

Turnpike
10%
Perc
enta
ge
Statewide Ride Distribution, Turnpike System Lots
Total Miles: 209.88
Type TotalLots
TotalMiles Minimum
Lots MilesMean Maximum St. Dev
IRI ≥ 86
Figure 5 Statewide Ride Distribution, Turnpike
11
177 13.31 79 5.95Turnpike 2207 209.88 33 54
0%
10%
0 14 28 42 56 70 84 98 112 126 140 >153
Perc
enta
ge
International Roughness Index (IRI)
Statewide Ride Distribution, Turnpike System Lots
Total Miles: 209.88
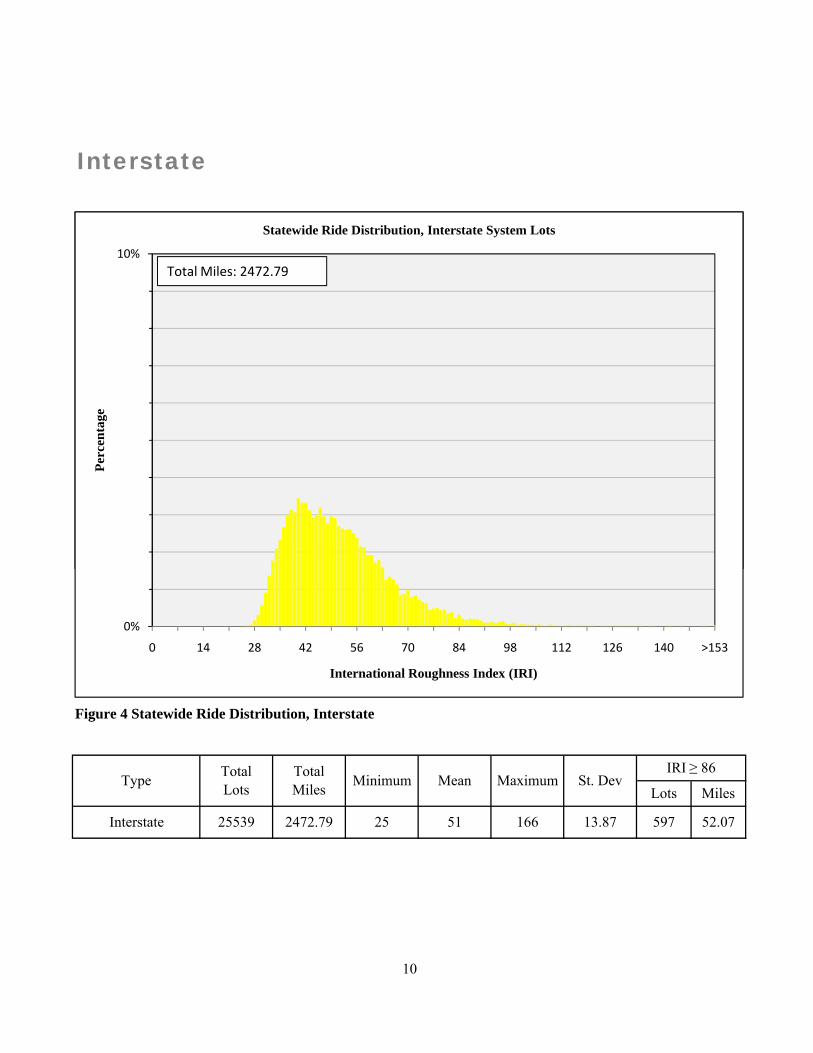
Ride Distribution by Friction Course Type
FC 5
10%
Perc
enta
ge
Statewide Ride Distribution, FC5 Lots
Total Miles: 4806.07
92.66
Maximum St. DevIRI ≥ 86
Type TotalLots
FC5 49425 4806.07 25 52 269 13.20 1079
Lots Miles
Figure 6 Statewide Ride Distribution, FC 5
TotalMiles Minimum Mean
12
0%
10%
0 14 28 42 56 70 84 98 112 126 140 >153
Perc
enta
ge
International Roughness Index (IRI)
Statewide Ride Distribution, FC5 Lots
Total Miles: 4806.07
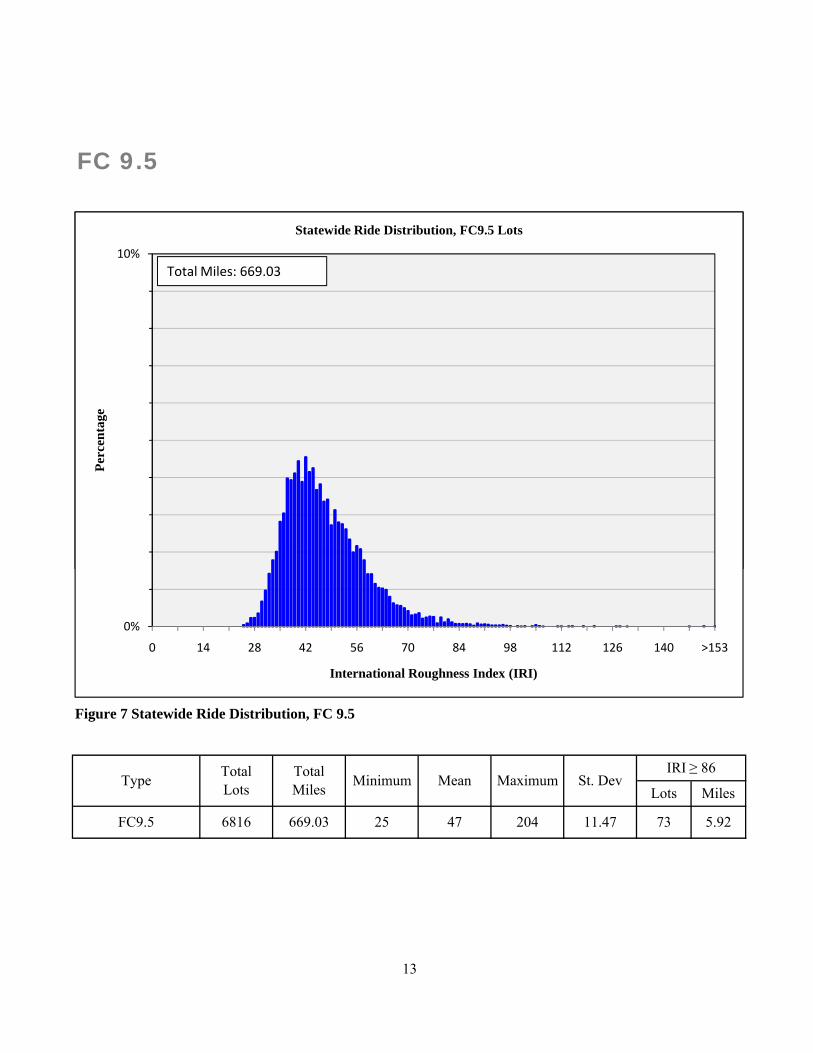
FC 9.5
10%
Perc
enta
ge
Statewide Ride Distribution, FC9.5 Lots
Total Miles: 669.03
25 47
13
FC9.5 6816 669.03
Type
204 11.47 73 5.92
TotalLots
TotalMiles Minimum Mean Maximum St. Dev
IRI ≥ 86
Lots Miles
Figure 7 Statewide Ride Distribution, FC 9.5
0%
10%
0 14 28 42 56 70 84 98 112 126 140 >153
Perc
enta
ge
International Roughness Index (IRI)
Statewide Ride Distribution, FC9.5 Lots
Total Miles: 669.03

FC 12.5
10%
Perc
enta
ge
Statewide Ride Distribution, FC12.5 Lots
Total Miles: 1090.14
Type TotalLots
TotalMiles Minimum Mean Maximum
FC12.5 11104
St. DevIRI ≥ 86
14
1090.14 24 54 207 13.29 297 26.64
Figure 8 Statewide Ride Distribution, FC 12.5
Lots Miles
0%
10%
0 14 28 42 56 70 84 98 112 126 140 >153
Perc
enta
ge
International Roughness Index (IRI)
Statewide Ride Distribution, FC12.5 Lots
Total Miles: 1090.14
Year TotalLots
TotalMiles Minimum Mean Maximum St. Dev
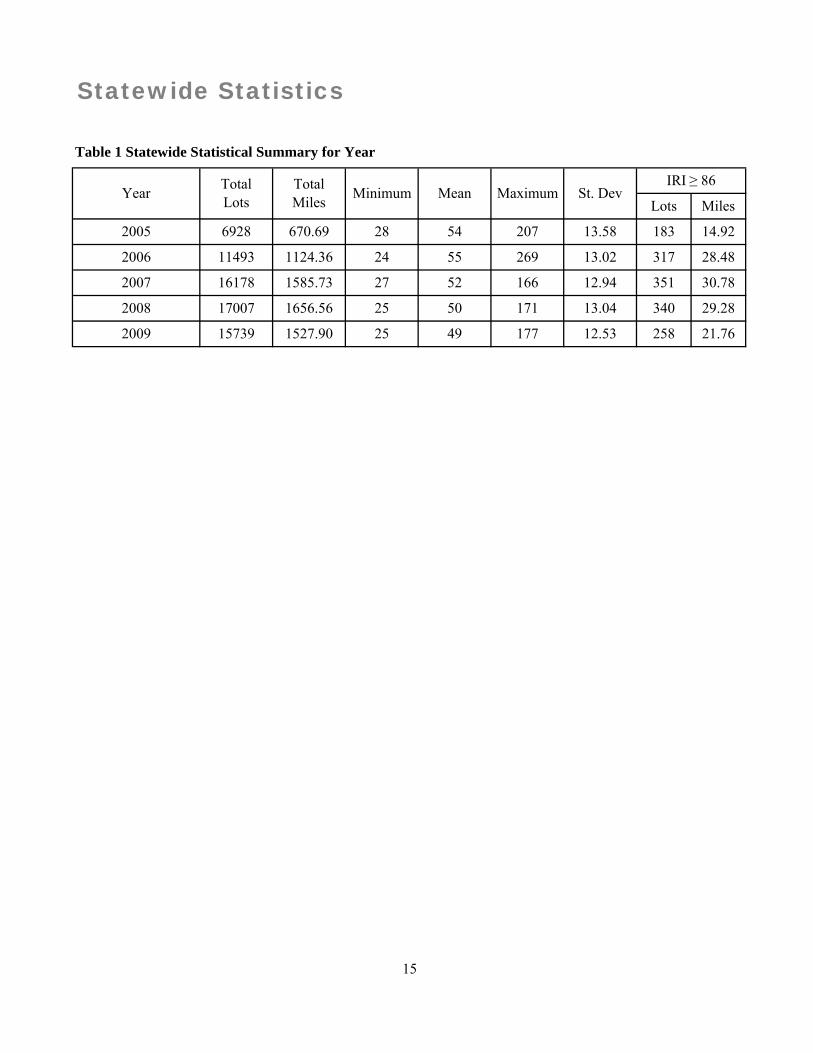
Table 1 Statewide Statistical Summary for Year
IRI ≥ 86
13.58 183 14.92
13.02
Lots Miles
Statewide Statistics
2008 17007 1656.56 25 50 171 13.04 340
2006 11493 1124.36 24 55 269
6928 670.69 28 54 207
2009 15739 1527.90 25 49 177 12.53 258
2007 16178 1585.73 27 52 166
21.76
12.94 351 30.78
317 28.48
29.28
2005
15

1
3
40.00
28 58 142
Lots MilesTotalLots
TotalMiles
168 15.09
0
2006
120 9.84
7161 701.87
2005 0 0.00 0
2009 8996 880.15 25 50 164 12.93
42 58
2008 0 0.00
9814 963.49 25
Minimum Mean Maximum St. Dev
2005
Year
3713
2007 6086
Inte
rsta
te 2006
659 25 25
Toll
0 0.00
0 0
591.56 28 52 166 13.65
361.47 31 55
2009 0 0.00 0 0 0.00
2007 0 0.00
2006 243 22.47
2008
0 0 0.00
14.43 158 15.19
50 151
Prim
ary
0 0
14 19 176 15 072008 6840
171 12.05 143 12.47
0
12.47 183 16.50
0.00 0 0.00
0.00
207 13.93
4089 400.02
50
161
2005 3057 293.68 28 53 127 13.29 63 5.07
24 54 269 11.96 155 13.20
228 9.80
0
4 0.10
Table 2 Statewide Statistical Summary for System Type, by Year
0 0.00 0
2007 9672 953.11 27 52 163
13.61
IRI ≥ 86
5
In
39 3.12
659.25 25 50 151
2009 1276 119.47 33 51 177 13.66 51 3.55
Turn
pike
0.00
5467 528.28 27
14.19 176 15.072008 6840
14.23 21 1.742008 353 33.82 33 58 124
2009
420 41.05 42 62 102 8.94
2005 158 15.55 37 50 82 7.82 0
46 130 11.03
7 0.672007
16
0.00 0 0 0 0.00 0 0.0002006
28
Lots Miles
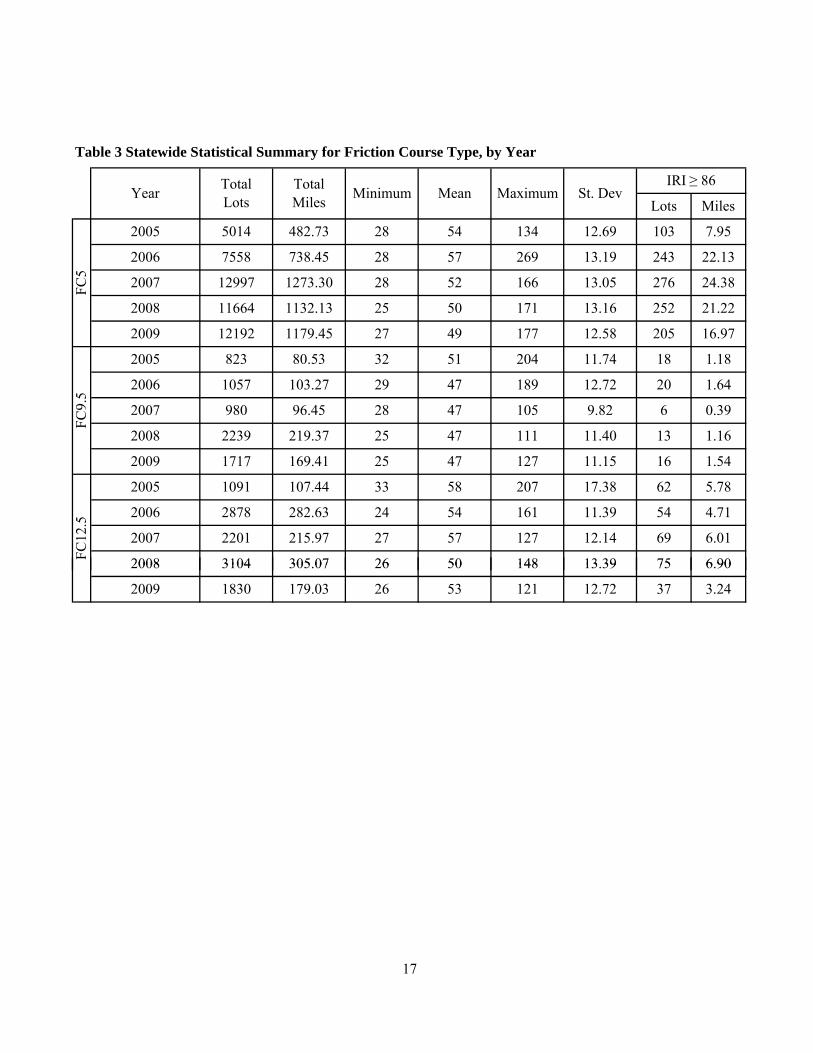
Table 3 Statewide Statistical Summary for Friction Course Type, by Year
FC5
2005 5014 482.73
2005
11.40
2878
51
Year TotalLots
TotalMiles Minimum Mean Maximum
FC9.
5
54 134 12.69 103
2006 1057 103.27 29 47 189
204
2009 12192 1179.45 27 49 177
2006 7558 738.45 28 57
1712008 11664 1132.13 25 50
2008 3104 305 07 26 50 148
St. DevIRI ≥ 86
12.72 20
11.74 18 1.18
13.16 252 21.22
12.58 205 16.97
13 39
243 22.13
1.64
7.95
2007 12997 1273.30 28 52 166 13.05
282.63 24 54 161
2007 980 96.45 28 47 105 9.82
11.39 54 4.71
6.01
6 0.39
13 1.162008 2239 219.37 25 47 111
269
69
75
2007 2201 215.97 27 57 127 12.14
276 24.38
FC12
.5
2005 1091 107.44 33 58
11.15 16 1.542009 1717 169.41 25 47 127
2006
823 80.53 32
13.19
207 17.38 62 5.78
6 90
121 12.7226 532009 1830 179.03
2008 3104 305.07 26 50 148 13.39
17
75
37 3.24
6.90
1
3
4
5
1
3
4
5
1
3
4
5
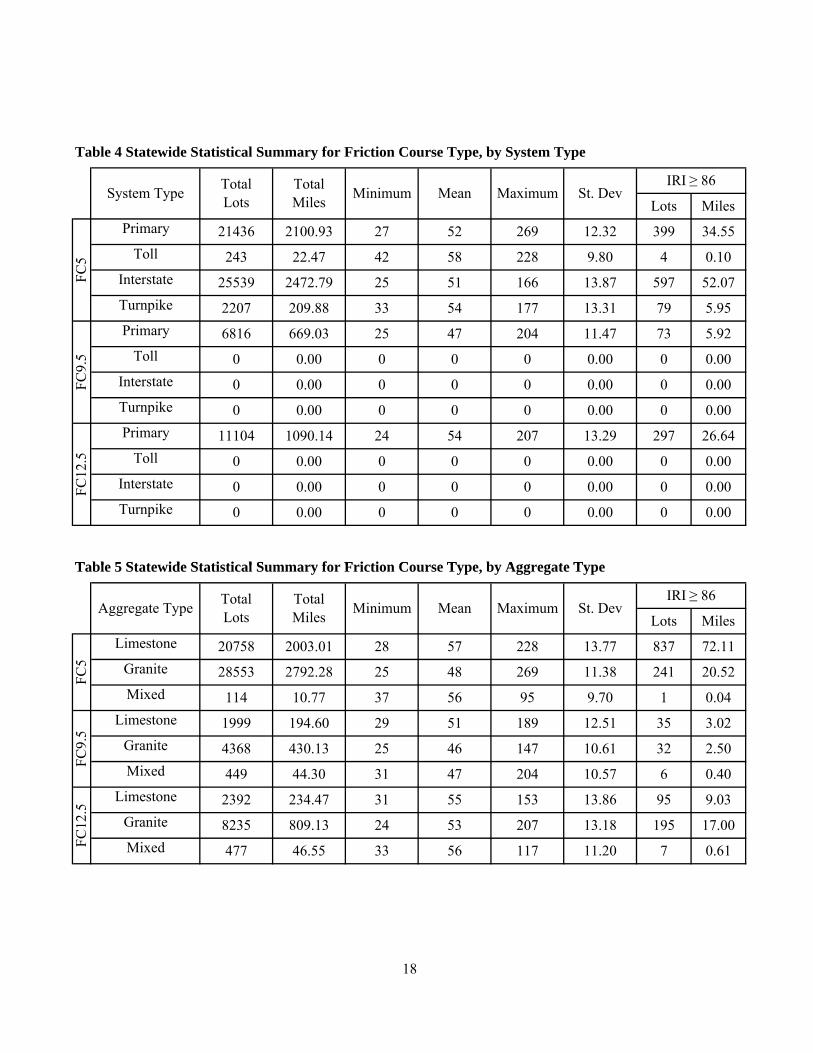
2100.93 27 52 269
Toll 0 0.00
Turnpike 2207 209.88 33 54 177
TotalMiles MinimumSystem Type Total
Lots
FC5
Primary 21436
Lots MilesMaximum St. Dev
IRI ≥ 86
13.31 79 5.95
0.00 0
669.03 25
25 51 166
Table 4 Statewide Statistical Summary for Friction Course Type, by System Type
Mean
Toll 4 0.10243 22.47 42 58 228 9.80
0 0
FC12
.5
Primary 11104 1090.14 24
5.92
Interstate 0
0.00
Interstate
47 204 11.47 73
0.00 0 0 0 0.00 0
2472.79
0.00
0.00
0 0 0
0
0 0 0
Toll 0 0.00
Turnpike 0 0.00
Table 5 Statewide Statistical Summary for Friction Course Type by Aggregate Type
Primary 6816
Turnpike 0 0.00
Interstate 0 0.00
FC9.
5
26.64
0.00 0 0.00
13.87 597 52.07
12.32 399 34.55
0.00 0 0.00
0.00 0 0.00
0
297
0 0
54 207 13.29
0 0 0 0 0.00
25539
L
G
B
L
G
B
L
G
B
28553 2792.28 25Granite 269 11.38 241
228 13.77
FC9.
5
Limestone 1999 194.60 29 51 189 12.51 35
20.52
10.61 32 2.50
Mixed 114 10.77 37
837 72.11
FC5
Limestone 20758 2003.01 28 57
48
18
Granite 4368 430.13 25 46 147
Lots Miles
Table 5 Statewide Statistical Summary for Friction Course Type, by Aggregate Type
0.40
56 95 9.70 1 0.04
31 55 153 13.86 95 9.03
11.20 7 0.61Mixed 477FC12
.5
Limestone 2392 234.47
Mixed 449 44.30 31 47 204 10.57 6
46.55 33 56 117
53 207 13.18 195 17.00Granite 8235
3.02
Minimum Mean
809.13 24
Maximum St. DevIRI ≥ 86
Aggregate Type TotalLots
TotalMiles
1
2
1
2
1
2
Binder Type TotalLots Lots Miles
TotalMiles Minimum Mean Maximum
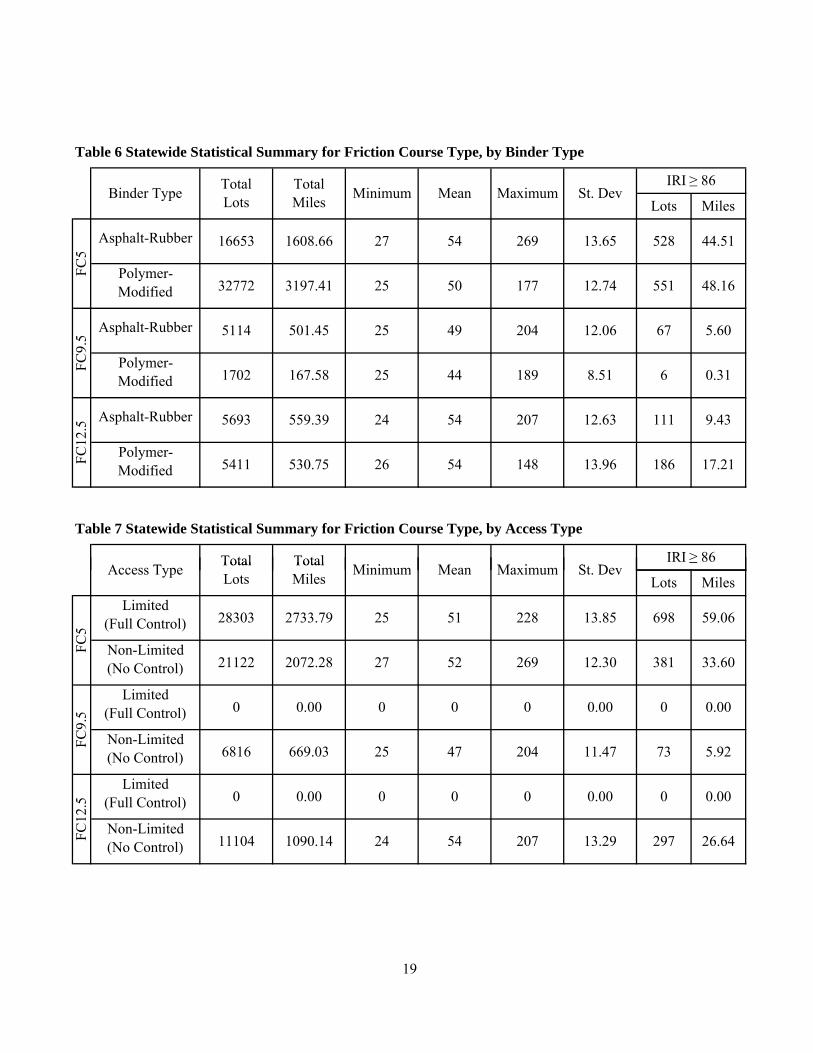
Table 6 Statewide Statistical Summary for Friction Course Type, by Binder Type
FC12
.5
25 44FC9.
5FC
5
A T Total
1702 167.58
Table 7 Statewide Statistical Summary for Friction Course Type, by Access Type
50 177 12.74 551 48.16
189 8.51 6 0.31
5411 530.75 26 54 148 13.96 186 17.21
3197.41 25
5114 501.45 25 49 204 12.06 67 5.60
5693 559.39 24 54 207 12.63 111 9.43
St. DevIRI ≥ 86
32772
27 54 269 13.65 528 44.51
Polymer-Modified
Asphalt-Rubber
Asphalt-Rubber
Polymer-Modified
Asphalt-Rubber
Polymer-Modified
16653 1608.66
Total Mi i M M i S DIRI ≥ 86
1
3
1
3
1
3
Limited(Full Control)
Non-Limited(No Control)
Limited(Full Control)
Non-Limited(No Control)
Limited(Full Control)
Non-Limited(No Control)
FC5
FC9.
5
28303 2733.79 25
19
Access Type TotalLots Lots Miles
0
11104 1090.14 24 54 207 13.29 297 26.64FC12
.5
0 0.00 0 0 0 0.00 0 0.00
0 0.00 0
51 228 13.85 698 59.06
21122 2072.28 27 52 269 12.30 381 33.60
TotalMiles Minimum
0 0.00 0 0.00
6816 669.03 25 47 204 11.47 73 5.92
Mean Maximum St. Dev≥

Total
Total Lane Miles Tested
467.64 812.50 209.88
Friction Course Type District 1
76.82 171.91 27.70
11.32 152.76 8.78 45.63 0.00
99.31 426.71 209.88
FC5
District 2 District 3 District 4
FC12.5 300.08 504.60 66.96
869.77 822.63 1198.89 90.53
FC9.5 178.61
District 5 District 6 District 7 District 8
334.23
167.14 0.00 46.85 0.00
Table 8 Lane Miles Tested Per District, by Friction Course Type
1348.45 1404.05 706.52 851.52 1518.78
20
#
#
1
#
#
#
#
Statewide Contractor Statistics
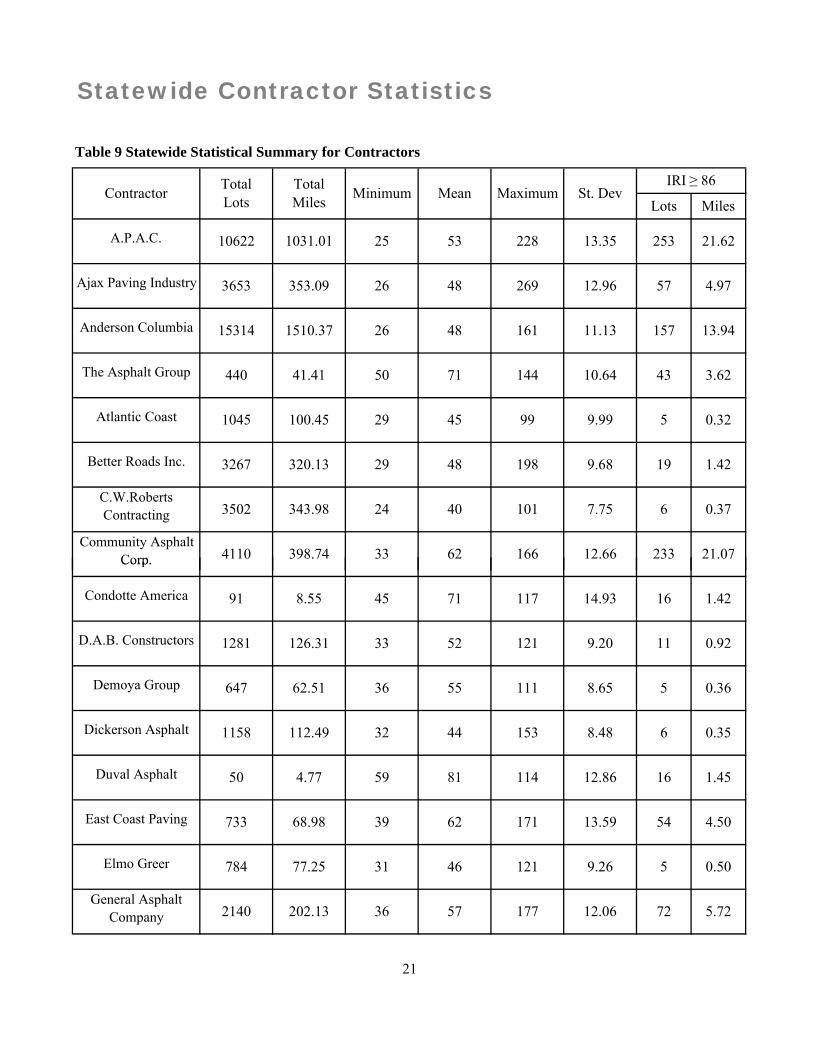
Table 9 Statewide Statistical Summary for Contractors
Maximum St. DevIRI ≥ 86
The Asphalt Group
3653 353.09 26 48 269 12.96 57 4.97
15314
Lots MilesContractor Total
Lots
21.07
TotalMiles Minimum Mean
29 45 99
Ajax Paving Industry
Anderson Columbia 1510.37 26 48 161 11.13 157 13.94
440 41.41 50 71 144 10.64 43 3.62
Atlantic Coast
Better Roads Inc.
C.W.Roberts Contracting
1045 100.45 9.99 5 0.32
3267 320.13 29 48 198 9.68 19 1.42
3502 343.98 24 40 101 7.75 6 0.37
4110 398.74 33 62 166 12.66 233
1031.01 25 53 228 13.35 253 21.62
Community Asphalt Corp.
A.P.A.C. 10622
#
#
#
#
#
#
#
#
#2140 202.13 36 57 177 12.06 72 5.72
East Coast Paving
Condotte America
D.A.B. Constructors
Demoya Group
Dickerson Asphalt
Duval Asphalt
91 8.55 45 71 117 14.93 16 1.42
1281 126.31 33 52 121 9.20 11 0.92
647 36 55 111
21
Elmo Greer
General Asphalt Company
784
1158 112.49 32 44 153 8.48 6 0.35
50 4.77 59 81 114 12.86 16 1.45
733 68.98 39 62 171 13.59 54 4.50
8.65 5 0.3662.51
77.25 31 46 121 9.26 5 0.50
Corp.

#
#
#
3
#
#
#
4.46
11.90 21 1.86
72 6.13 44 65 131 12.14 7 0.24
56
252 23.62 44 65 98 9.93 9 0.80
292 28.75 34 58 114 9.29 2 0.17
1071 101.86 29 53 125 13.87 36 3.10
Halifax Paving Inc. 864 85.83 27 47
Contractor TotalLots
TotalMiles
85 10.89 0 0.00
Hardrives Of Delray
Hewitt Contracting Co.
Lots Miles
Table 9 Statewide Statistical Summary for Contractors, continued
Minimum Mean Maximum St. DevIRI ≥ 86
Hubbard Construction
John C. Hipp
Lane Construction Corp. 136 11.34
Middlesex Corp.
Milestone Southern Paving
1047 101.85 32 55 127
10 0.95 43 53 74 9.24 0 0.00
2549 248.02 33 55
#
#
#
#
#
#
4
#
#
1034
547 53.76 29 55 112 16.23 32 2.93
44 4.19 42 64 98 14.31 5 0.45
2823 277.96 28
50 4.75 35 49 71 7.53 0 0.00
6174 599.17 31 58 151 13.99 283 25.65
140 13.96 31 47 85 9.24 0 0.00
114 10.75 48 66 101 10.07 6 0.32
50 130 11.90 32 2.65
43
22
100.14 25
Ranger Construction
Steven Counts Inc.
Weekly Asphalt Paving
Paving
Orlando Paving Company
Overstreet Paving
P & S Paving
Peavey And Sons 130 7.70 1 0.02
Quality Enterprises Usa Inc.

#
#
#
1
Mean
Whitehurst 1425 141.35 34 53 93 8.58 1 0.05
Miles
27260.102704Ajax Paving
Industry
7.16
St. DevIRI ≥ 86
Table 9 Statewide Statistical Summary for Contractors, continued
LotsContractor Total
LotsTotalMiles Minimum Mean Maximum
Maximum St. Dev
8699A.P.A.C.
1.311810.2626946
IRI ≥ 86
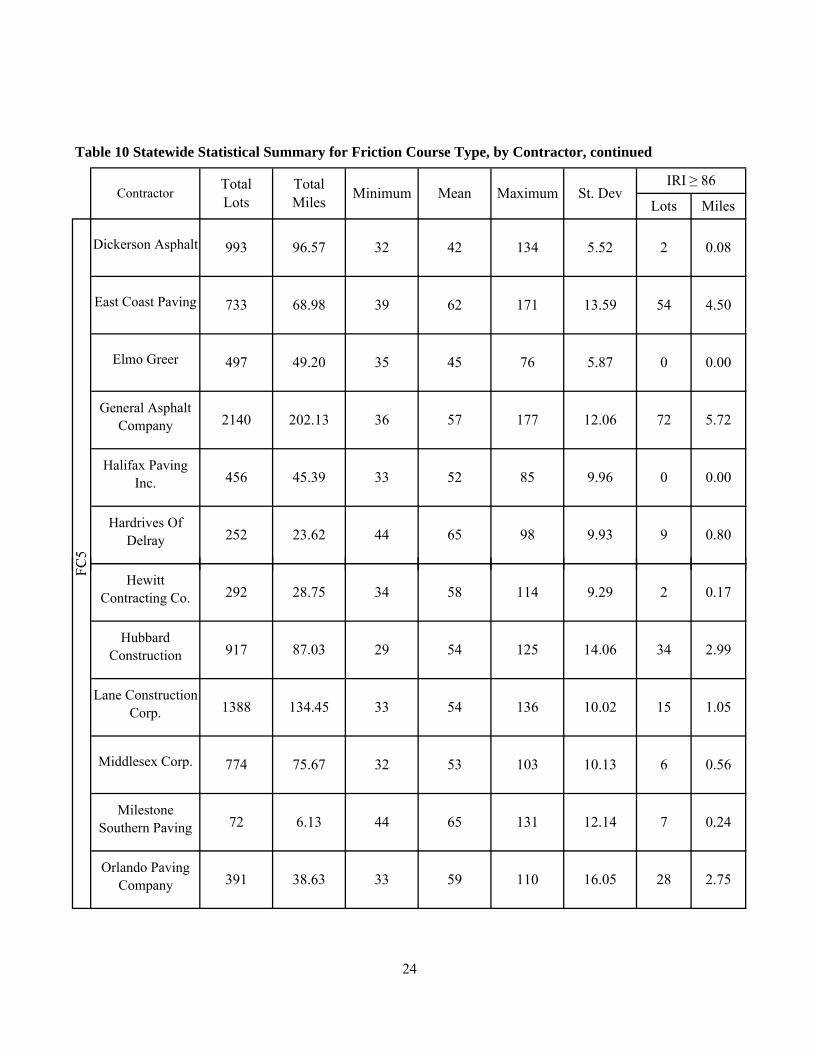
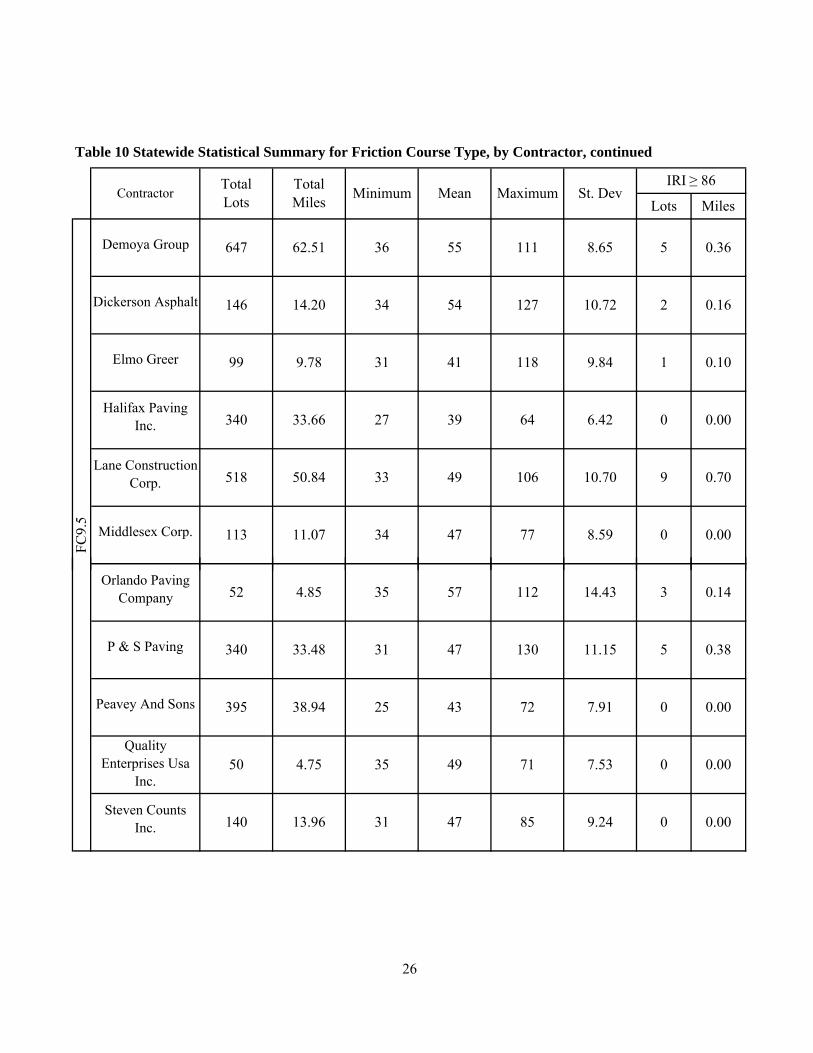
Table 10 Statewide Statistical Summary for Friction Course Type, by Contractor
ContractorTotalLots
TotalMiles Minimum
Lots Miles
The Asphalt
18.8621913.392285426842.52
8010.5514247281047.5510620Anderson Columbia
#
#
#
#
#
#
#
23
784Atlantic Coast 99462975.05
0.3679.5919847
715041.41
10.45
1.4216
1416Better Roads Inc.
0.0216.81
D.A.B. Constructors
2226C.W.Roberts Contracting
138.76
14.93
873825218.44
0.5668.791015235101.96
0.325
440The Asphalt
Group
FC5
Condotte America 1177145
30
1030
144
8.5591
19.7722012.731666333360.403722Community
Asphalt Corp.
3.624310.64
#
#
#
#
#
#
5736202.132140
0.0009.9685523345.39456
C5
East Coast Paving
0.0825.52134423296.57993Dickerson Asphalt
Table 10 Statewide Statistical Summary for Friction Course Type, by Contractor, continued
ContractorTotalLots
TotalMiles Minimum Mean Maximum St. Dev
IRI ≥ 86
Lots Miles
68.98733 4.505413.591716239
0.0005.8776453549.20497Elmo Greer
General Asphalt Company 5.72
Hardrives Of Delray
Halifax Paving Inc.
252 23.62 44 65 98 9.93 9 0.80
7212.06177
#
#
3
#
#
#
#
14.06125
38.63391
72 6.13 44
24
65 131 12.14 7 0.24
0.56610.13103533275.67774
0.1729.29
5933 2.7528
FC
16.05110
1388
34
134.45 33 54 136 10.02 15 1.05
2.99542987.03917
Hewitt Contracting Co.
Orlando Paving Company
Milestone Southern Paving
Middlesex Corp.
Lane Construction Corp.
Hubbard Construction
114583428.75292

#
#
4
#
#
#
TotalMiles Minimum Mean Maximum St. Dev
IRI ≥ 86
Table 10 Statewide Statistical Summary for Friction Course Type, by Contractor, continued
ContractorTotalLots Lots Miles
0.0005.9974473459.87605Whitehurst
0.32610.07101664810.75114Weekly Asphalt
Paving
18.5821013.141515731549.555671Ranger
Construction
48 125 11.95 18 1.52
639
0.39511.59151422552.22528A.P.A.C.
1759 173.40 28
FC5
Peavey And Sons
P & S Paving
0.0217.56130433061.20
#
#
1
#
#
#
#
29
0.5718944
25
Better Roads Inc.
Atlantic Coast
0.80138Community
Asphalt Corp.
855C.W.Roberts Contracting
165
811.50105654213.49
0.3557.91101422684.04
1.952211.261475433126.211281
15.92
69.72712
FC9.
5
0.021
Anderson Columbia
7.82204432729.36297Ajax Paving
Industry
29
0.0007.677041
710.16
#
#
#
#
#
#
Maximum St. DevIRI ≥ 86
LotsMean
Miles
0.36562.51647Demoya Group
Dickerson Asphalt
33.66340Halifax Paving
Inc.
0.1019.8411841319.7899Elmo Greer
210.72127543414.20146
11.07113Middlesex Corp.
Lane Construction Corp. 0.70910.7010649
0.00
3350.84
0.16
TotalLots
TotalMiles MinimumContractor
08.59774734
518
0.0006.42643927
FC9.
5
8.651115536
Table 10 Statewide Statistical Summary for Friction Course Type, by Contractor, continued
#
#
#
#
#
#
13.96
7149354.7550
Steven Counts Inc.
0.0007.9172
Quality Enterprises Usa
Inc.
09.24854731
P & S Paving
0.14314.4311257354.8552Orlando Paving
Company
432538.94395Peavey And Sons
0.38511.15130473133.48340
0.00140
26
0.0007.53

#
#
1
#
#
#
Maximum St. DevIRI ≥ 86
ContractorTotalLots
TotalMiles Minimum Mean
Table 10 Statewide Statistical Summary for Friction Course Type, by Contractor, continued
Lots Miles
3.653818.94207582663.63652Ajax Paving
Industry
2.372911.561235432136.271395
1139 111.65 31 51 94
421 41.51
Anderson Columbia 3413
9.48 32
24
96
4.835511.911615026336.61
0.5058.55
0.0007.827147
0.0008.737544C.W.Roberts Contracting
Better Roads Inc.
Atlantic Coast
12.5
A.P.A.C.
#
#
#
#
#
#
#
35 52
27
2 0.11
1.45
5 0.37251 24.35 33 51 121 10.71
4.77 59 81 114 12.86 16
0.40
Dickerson Asphalt 19 1.73 54 71 153 13.85
Halifax Paving Inc. 68 6.77 40
Elmo Greer 13.15 4
Duval Asphalt 50
0.00
121
37 59 101 11.56
18.27
57 75 8.20 0
188
250 24.85 0.505
D.A.B. Constructors
Community Asphalt Corp.
FC1

3
#
#
#
#
#
1 0.04
64
13.06 15 1.30
9.39
Lots Miles
Table 10 Statewide Statistical Summary for Friction Course Type, by Contractor, continued
Hubbard Construction 154 14.83 31 11.10
11.60 32 2.70Lane Construction
Corp. 643 62.73 36 61 120
2 0.11
Orlando Paving Company 104 10.28 29 42 109
0.95
Overstreet Paving 44 4.19
160 15.12 48
42
Minimum Mean
43 53 74 9.24 0 0.00John C. Hipp 10
48 91
Maximum St. DevIRI ≥ 86
FC12
.5
Middlesex Corp.
0.45514.3198
67 127
ContractorTotalLots
TotalMiles
#
#
4
#
41
55 97
28
Whitehurst
Ranger Construction 503 49.62 69 148 17.83 73 7.07
P & S Paving 724 71.07 33 10.41 9 0.75
56 93 8.15 1 0.053981.49820
L
#
#
1
#
#
#
Maximum St. DevIRI ≥ 86
85
13.25
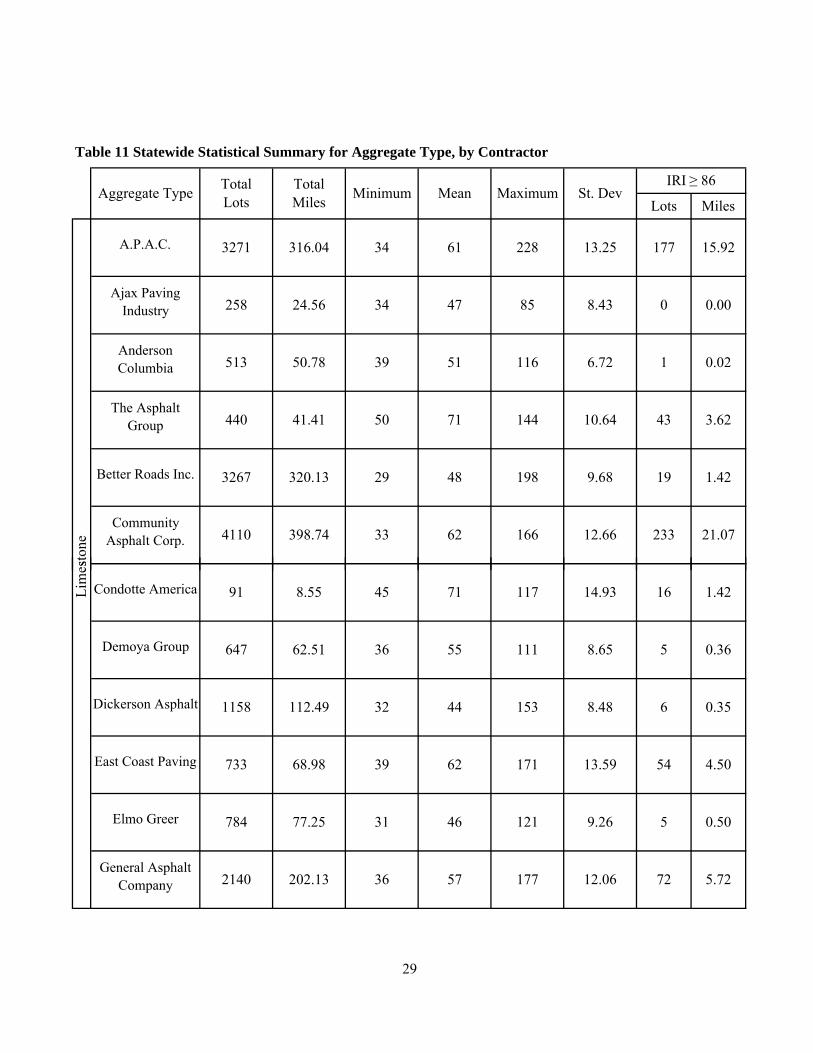
Table 11 Statewide Statistical Summary for Aggregate Type, by Contractor
8.43 0 0.00
Aggregate Type TotalLots
A.P.A.C. 3271 316.04 34
ston
e 33
1 0.02Anderson Columbia 513 50.78 39 51
Lots Miles
71 144 10.64 43 3.6241.41 50
116 6.72
Community Asphalt Corp. 4110 398.74
61 228 177 15.92
The Asphalt Group 440
62 166 12.66
320.13 29 48
233 21.07
3267 198 9.68 19 1.42
TotalMiles Minimum Mean
Ajax Paving Industry 258 24.56 34 47
Better Roads Inc.
#
#
#
#
#
#
#
Lim
es
Dickerson Asphalt 1158
55 111 8.65 5 0.36
Condotte America 11745 71 14.93 1691 8.55 1.42
8.48 6 0.35
Demoya Group 647 62.51 36
112.49 32 44 153
29
177 12.06 72 5.72General Asphalt
Company 2140 202.13 36 57
0.50Elmo Greer 784 77.25 31 46 121 9.26 5
39 62 171 13.59East Coast Paving 54 4.50733 68.98

L
#
3
#
#
#
#
Table 11 Statewide Statistical Summary for Aggregate Type, by Contractor, continued
LotsTotalMiles Minimum
Hubbard Construction 387 36.56 33 58 125
Lim
esto
ne
33 54
Milestone Southern Paving 72 6.13 44 65 131 12.14 7
Lane Construction Corp. 1850 179.28
0.24
45 125 11.15 10 0.88
10 0.95 43 53 74 9.24 0
28
0.00
136 10.05 28
P & S Paving 1214 119.92
TotalLots
2.02
2.32
John C. Hipp
2615.45
23.62 44 65 98 9.93 9Hardrives Of
Delray 252 0.80
Mean Maximum St. DevIRI ≥ 86
MilesAggregate Type
#
#
4
#G
#
#
1
7.53 0 0.00
48 66 101 10.07 6 0.32Weekly Asphalt
Paving 114 10.75
11.95 75 5.67164
Ranger Construction 3788 366.55 61
Gra
nite
30
48 161 11.24 156 13.92
Ajax Paving Industry 3286 317.72 26 48 269 13.36 56 4.96
Anderson Columbia 14801 1459.59 26
Quality Enterprises Usa
Inc.50 4.75 35 49 71
A.P.A.C. 7237 704.21 25 50
151 14.78 250 22.6831

G
#
#
#
#
#
#nite
St. DevIRI ≥ 86
Halifax Paving Inc. 864 85.83 27 47 85 10.89 0 0.00
Aggregate Type TotalLots
TotalMiles Minimum Mean
Lots MilesMaximum
24 40 101 7.75 6 0.37
58 114 9.29 2 0.17
Table 11 Statewide Statistical Summary for Aggregate Type, by Contractor, continued
Atlantic Coast 1045 100.45 29
C.W.Roberts Contracting
103.82 35
45 99 9.99 5 0.32
3502 343.98
D.A.B. Constructors 1050
Hewitt Contracting Co.
Duval Asphalt 50 4.77 59 81 114
52 121 8.94 7 0.61
12.86 16 1.45
292 28.75 34
#
3
#
#
#
#
#
Gra
n
5
32
Hubbard Construction
Lane Construction Corp.
Overstreet Paving
Orlando Paving Company
684 12.01 10 0.78
653
547
44 14.31
64.36 33
65.30 29 50 106
55 120 14.52
2.93
Middlesex Corp. 1047
1069 104.88 33 53 108
31
42 64 98
1.09
0.45
16.23 32
P & S Paving
101.85
53.76 29 55 112
4.19
10.52 14
2.4328
55 127 11.90 21 1.86

G
#
4
#
#B
#
#
Gra
nite
1034 100.14 25 43 130 7.70Peavey And Sons
Table 11 Statewide Statistical Summary for Aggregate Type, by Contractor, continued
Mean Maximum St. DevAggregate Type TotalLots
TotalMiles
1 0.02
0.00
Lots Miles
Steven Counts Inc. 140 13.96 31
232.62 33 55 124 11.71
1 0.04
9.24 0
33 2.97
A.P.A.C. 114 10.77 37 56 95 9.70
Ajax Paving Industry 109 10.82
Minimum
Whitehurst 1425 141.35 34 53 93 8.58 1 0.05
Ranger Construction 2386
47
204 8.38
85
1 0.0233 45
IRI ≥ 86
#
#
#
#
33
Mix
ed 51 117 10.28 4 0.31
6.13 0 0.00
13.04
4.39 36 52 68
8 0.68P & S Paving 540 53.15 31 53 130
32
D.A.B. Constructors 231 22.49
Lane Construction Corp. 46
1District
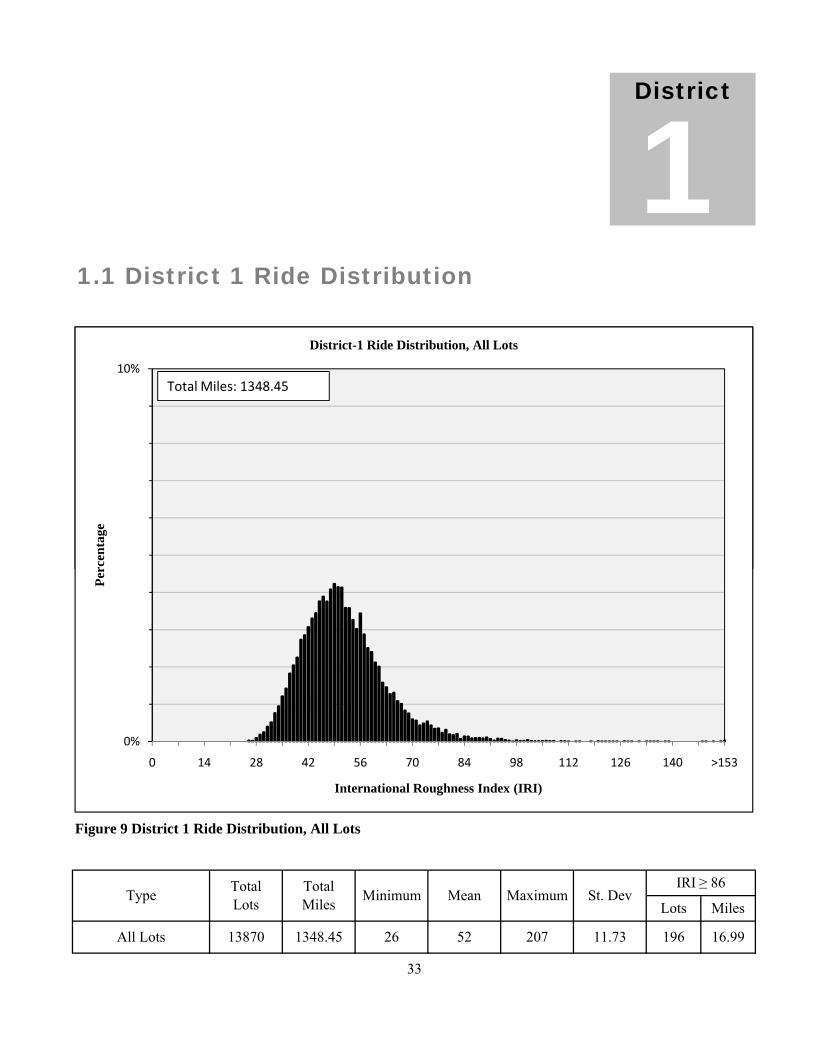
1.1 District 1 Ride Distribution
10%
rcen
tage
District-1 Ride Distribution, All Lots
Total Miles: 1348.45
Lots MilesTotalLots
TotalMiles Minimum Mean Maximum St. Dev
33
Figure 9 District 1 Ride Distribution, All Lots
IRI ≥ 86Type
26 52 207 11.73 196 16.99All Lots 13870 1348.45
0%
10%
0 14 28 42 56 70 84 98 112 126 140 >153
Perc
enta
ge
International Roughness Index (IRI)
District-1 Ride Distribution, All Lots
Total Miles: 1348.45

1.2 Ride Distribution by System Type
0%
10%
0 14 28 42 56 70 84 98 112
126
140
>153
Perc
enta
ge
International Roughness Index (IRI)
Primary System Lots
Total Miles: 921.64
0%
10%
0 14 28 42 56 70 84 98 112
126
140
>153
Perc
enta
geInternational Roughness Index (IRI)
Interstate System Lots
Total Miles: 426.81
Lots Miles
187
Type TotalLots
TotalMiles
12.52 16.31Primary 9439 921.64 26 53 207
9 0.68Interstate 4431 426.81 27 49
Minimum Mean Maximum
34
IRI ≥ 86
127 9.07
Figure 10 District 1 Ride Distribution, by System Type
St. Dev
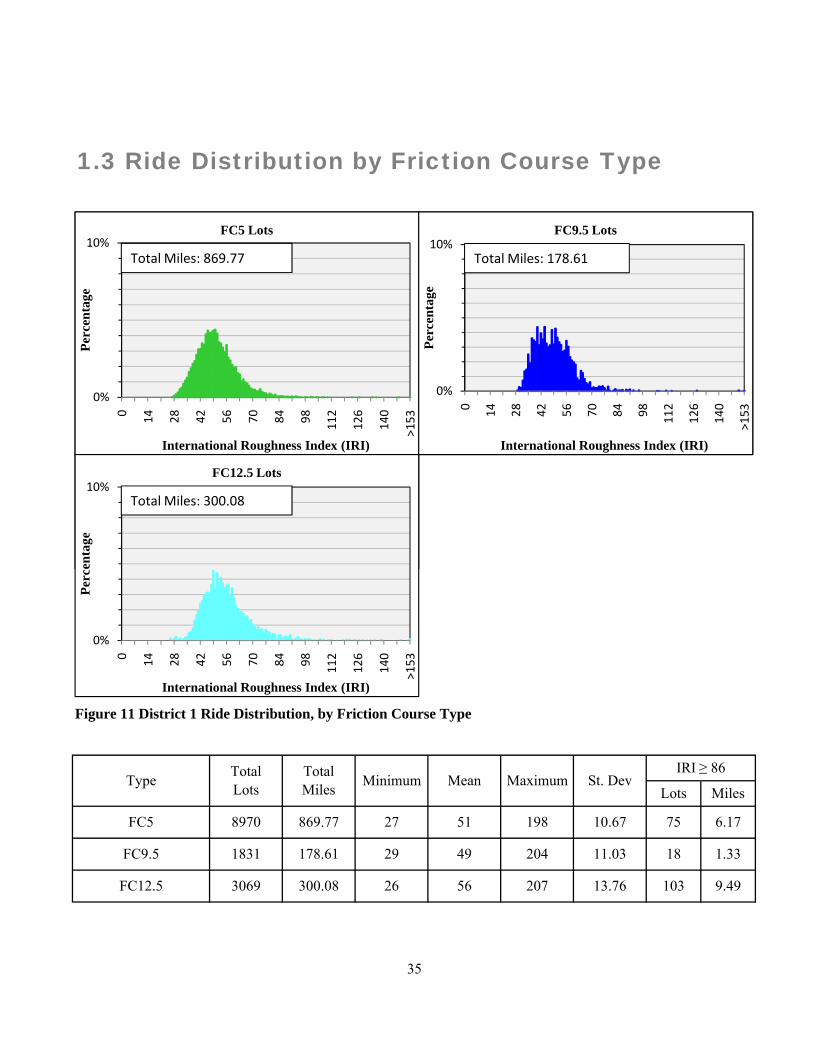
1.3 Ride Distribution by Friction Course Type
0%
10%
0 14 28 42 56 70 84 98 112
126
140
>153
Perc
enta
ge
International Roughness Index (IRI)
FC5 Lots
Total Miles: 869.77
0%
10%
0 14 28 42 56 70 84 98 112
126
140
>153
Perc
enta
geInternational Roughness Index (IRI)
FC9.5 Lots
Total Miles: 178.61
10%
enta
ge
FC12.5 Lots
Total Miles: 300.08
FC5 8970 869.77 27 51 198 10.67 75
Type TotalLots
TotalMiles Minimum Mean Maximum St. Dev
1.33
Figure 11 District 1 Ride Distribution, by Friction Course Type
IRI ≥ 86
6.17
Lots Miles
FC9.5 1831 178.61 29
56 207 13.76 103FC12.5 3069 300.08 26
35
9.49
49 204 11.03 18
0%
10%
0 14 28 42 56 70 84 98 112
126
140
>153
Perc
enta
ge
International Roughness Index (IRI)
FC5 Lots
Total Miles: 869.77
0%
10%
0 14 28 42 56 70 84 98 112
126
140
>153
Perc
enta
geInternational Roughness Index (IRI)
FC9.5 Lots
Total Miles: 178.61
0%
10%
0 14 28 42 56 70 84 98 112
126
140
>153
Perc
enta
ge
International Roughness Index (IRI)
FC12.5 Lots
Total Miles: 300.08

1
2878 275.46
225.74 30 51
2006
Lots Miles
122.70 33 55 207 15.73 44 3.94
123 10.36 17
48
198
4 47
Minimum Mean Maximum St. DevIRI ≥ 86
Lots Miles
1.4 District 1 Statistics
Table 12 District 1 Statistical Summary for Year
Year TotalLots
TotalMiles
2903 283.01 29
Prim
ary
2009 3942
Table 13 District 1 Statistical Summary for System Type, by Year
11.76 49 4.55
46 4.01
35 3.12
1853 181.12 33 55 207 13.552005
53 110 12 95
115 11.46
Minimum Mean Maximum St. Dev
53 198 11.67 46 3.68
Year TotalLots
TotalMiles
2007
IRI ≥ 86
2005 1258
1.40
52 115 12.37 32 2.822007 1566 154.02 30
26
46 3.682006 2757 269.71 29 53
1774 172.22 31 532008
2009 2084 203 00
383.12 26 49 110
2294
2008 9.68 20 1.65
11.74
31 52 123
4
0.30
48 4.47
54 127 6.92 2 0.062005
0.00
53 110 12.95
101 8.25 3
52 85 10.27 0
26
41
35
8.56 1 0.072009 1858 180.12 27 45 88
101 8.92 3
0.25
71.72 30 50
Inte
rsta
te 2006
36
595 58.43
146 13.30
2009 2084 203.00
728
103.24 33 512008 1104
2007

127
9
FC5
2007 2067 203.78 30
56
Minimum Mean Maximum
40
67.43 33 55 207 18.65
Table 14 District 1 Statistical Summary for Friction Course Type, by Year
0
FC9.
5
2005
St. DevIRI ≥ 86
Lots MilesYear Total
LotsTotalMiles
684
2008 1538 145.13
699 68.36
31
11.30 38 3.54
29 46 189 11.92
162
8.76 8 0.58
8 0.25
10.36 11 1.01
52
2007 0
15.82 33 49 204 10.39 2
0.74
12 1.17
0.00
2008 958
61
123 9.61 10
2 0.18
989 95.25 34 53 198
50 107
2009 3369
2006 1215 119.39
40 55 89 16.742009
2005
153 11.58
0.05
2006
31
5 0 50
115
9.16
0.00 0 0 0 0.00
56
37
FC12
.5
29 2.69
2007 227 21.96
0.3693.25 31 51 111 9.70 5
2005 1007 97.87
36 3.38
16.00 24 2.10
2008 382 37 08 32 55 94 9 29
327.74 27 48 110
2006
0.78
1
4
1
4
1
4
FC5
18 1.33Interstate 0 0.00 0 0
37
49 204 11.03
9 0.8254.22 26 56 1062009 561
5 0.50
13.76 103
Table 15 District 1 Statistical Summary for Friction Course Type, by System Type
TotalMiles Minimum Mean Maximum
0 0.00 0 0.00
St. DevSystem Type TotalLots
0 0.00 0 0.00
207
2008 382 37.08 32 55 94 9.29
12.03
IRI ≥ 86
4539 442.96 29
26 56Interstate 0 0.00 0 0
Primary
Interstate 4431 426.81 27 49 127 9.07 9 0.68
53
Lots Miles
FC12
.5 Primary 3069 300.08
198 11.67 66 5.48
9.49
FC9.
5 Primary 1831 178.61 29

L
G
B
L
G
B
L
G
B
2.70
Aggregate Type TotalLots
0
16 1.29
198
TotalMiles Minimum Mean Maximum St. Dev
37 3.46
IRI ≥ 86
Lots Miles
50
0.00 0 0
11.01 3754
145.26 29
3.34
1 0.03
0.00
205.76 31 153
189 11.45
10.82 33
Mixed 0
1493Granite
Mixed 109
36 52 68 6.13
Table 17 District 1 Statistical Summary for Friction Course Type, by Binder Type
Granite 924 89.93 26
TotalMiles Minimum Mean Maximum
11.75
FC9.
5FC
5
8.36
Limestone 6255
Limestone
1
207 17.67 66
9.67 38
46 4.39
27
606.37 30Granite 2715 263.40 47 110
0.02
Mixed
Table 16 District 1 Statistical Summary for Friction Course Type, by Aggregate Type
45
229 22.53 33 47 106
0FC12
.5
204
61
0.00 0 0.00
8.38
2099Limestone
6.15
TotalLots
52
Binder TypeLots Miles
St. DevIRI ≥ 86
1
2
1
2
1
2
6110
179.75 31 55 207
593.14 27 50 110 10.77 55 4.98
141 13.76 33 52 189 9.19 1 0.02
1237 120.33 26 57 133 13.62 52 4.91
FC5
1832
20 1.18Asphalt-Rubber
Polymer-Modified
Asphalt-Rubber
Polymer-Modified
198 10.39
49 204 11.13 17 1.31
FC9.
5FC
12.5
1690 164.85 29
Asphalt-Rubber
Polymer-Modified
2860 276.63 30 51
13.80 51 4.59
38

1
3
1
3
1
3
FC5
Limited(Full Control)
Non-Limited(No Control)
4561 438.94 27 49 127 9.34 17 1.28
4409 430.83 29 52 198 11.60 58 4.88
Table 18 District 1 Statistical Summary for Friction Course Type, by Access Type
Access Type TotalLots
TotalMiles Minimum Mean Maximum St. Dev
IRI ≥ 86
Lots Miles
3069 300.08
0.00 0 0 0 0.00 0 0.00
49 204
0
11.03 18 1.33
9.49
Limited(Full Control)
Non-Limited(No Control)
0 0.00 0
26 56 207 13.76 103
0 0.00
FC12
.5
Limited(Full Control)
Non-Limited(No Control)
0
FC9.
5 0 0.00
1831 178.61 29
39

#
#
#
#
#
#
#108 10.62 36 50 81 9.70 0 0.00
1424 137.07 36 52 101 7.81 5 0.47
647 62.51 36 55 111 8.65 5 0.36
19 1.73 54 71 153 13.85 2 0.11
Better Roads Inc.
Community Asphalt Corp.
Demoya Group
Dickerson Asphalt
Elmo Greer
General Asphalt Company
3507 341.14 29 54 151 10.76 37 3.32
2395 231.17 26 48 207 14.12 46 4.14
3267 320.13 29 48 198 9.68 19 1.42
136 13.53 42 60 96 10.21 2 0.20
MilesContractor Total
LotsTotalMiles Minimum
1.5 District 1 Contractor Statistics
LotsMean Maximum St. Dev
IRI ≥ 86
Table 19 District 1 Statistical Summary for Contractors
Ajax Paving Industry
A.P.A.C.
#
#
#
#
4
50 4.75 35 49 71 7.53 0 0.00
6 0.60 94 113 133 15.03 6 0.60
2156 209.73 33 55 136 11.35 47 3.69
Company
Lane Construction Corp.
Orlando Paving Company
Quality Enterprises Usa Inc.
Ranger Construction
155 15.48 42 72 110 14.80 27 2.69
40

#
#
#
#
#
#
Contractor TotalLots
Table 20 District 1 Statistical Summary for Friction Course Type, by Contractor
42 72
7.81 5 0.47
TotalMiles Minimum
FC5
A.P.A.C. 2913 283.41
170.59
Better Roads Inc. 1416
107 9.95
Mean Maximum St. DevIRI ≥ 86
1778
Lots Miles
0.36
9 0.6727 45Ajax Paving
Industry
110
General Asphalt Company 1424 137.07 36
14.80 27 2.69Orlando Paving
Company 155 15.48
138.76
10.15 14 0.95Lane Construction
Corp. 1284
7
52
47 198 9.59
101
124.47 33 53 136
29 53 127 9.89 13 1.03
30
#
#
#
#
#
#
#
50 4.75 35
44 189 10.16 7 0.57
FC9.
5
Demoya Group 647 62.51 36
Better Roads Inc. 712 69.72 29
8.38 1 0.02Ajax Paving
Industry 109 10.82 33 45 204
16.97
55 111 8.65 5 0.36
8.36 1 0.03
0 0.00
41
7.53
8.27 36 56 151
71
Lane Construction Corp. 229 22.53 33 47 106
49Quality
Enterprises Usa Inc.
4 0.36A.P.A.C. 84

#
#
#
#
#
#
Mean Maximum St. DevIRI ≥ 86
37 59 111 12.64 20
FC12
.5
A.P.A.C. 510
Ajax Paving Industry 508 3.4549.77 26 58 207 20.54 36
136 13.53
36 50 81 9.70 0 0.00
1.93
2153 13.85
0.20Community
Asphalt Corp.
Elmo Greer
Contractor TotalLots
TotalMiles Minimum
0.111.73 54 71
94 8.55 5 0.50
108 10.62
Better Roads Inc. 1139 111.65 31 51
42 60 96 10.21 2
Table 20 District 1 Statistical Summary for Friction Course Type, by Contractor, continued
Dickerson Asphalt 19
Lots Miles
49.46
#
#
4
32Lane Construction
Corp. 643 2.7062.73 36 61 120 11.60
Ranger Construction 6
42
0.60 94 113 133 15.03 6 0.60
L
#
#
#
#
#
#
MilesAggregate Type Total
LotsTotalMiles Minimum Mean
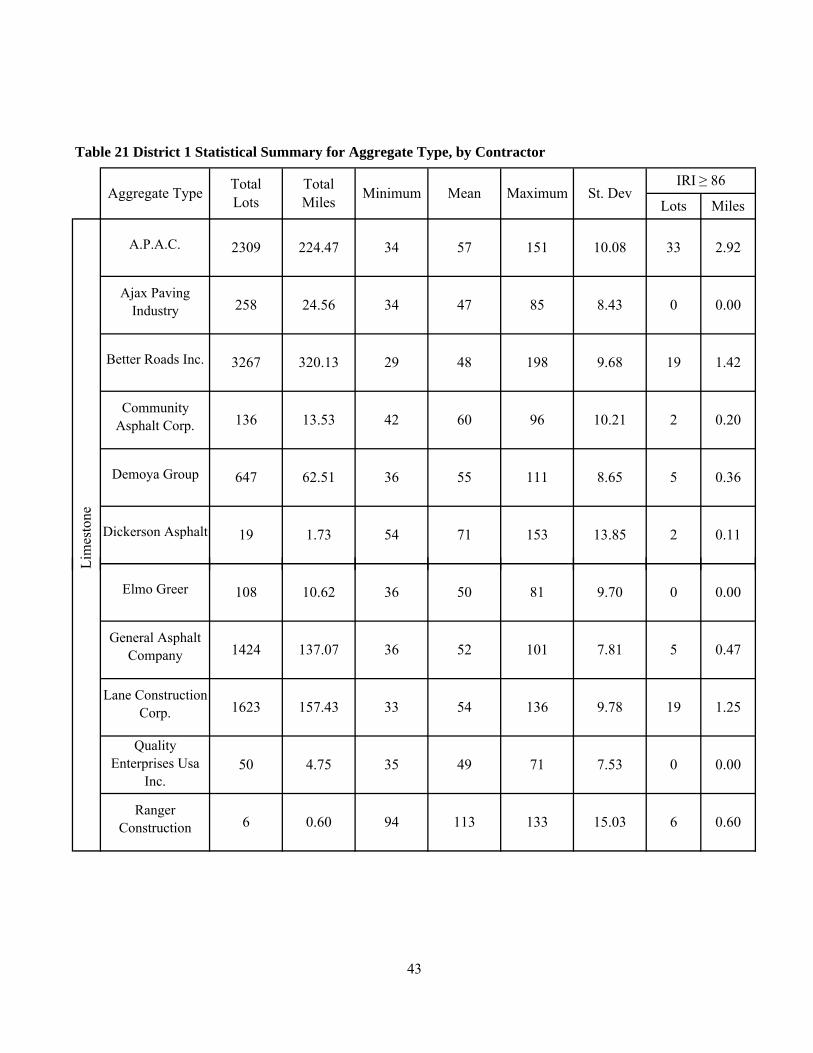
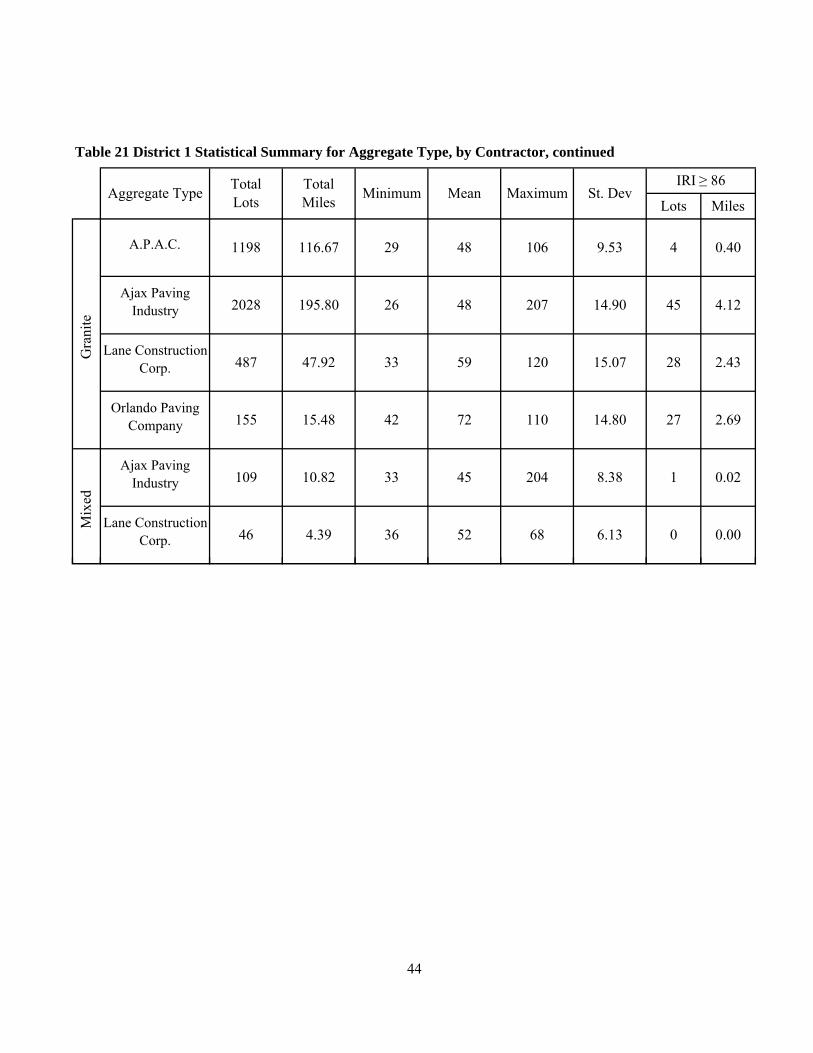
Table 21 District 1 Statistical Summary for Aggregate Type, by Contractor
Lim
esto
ne
42 60 96 10.21 2 0.20Community
Asphalt Corp. 136 13.53
2309 224.47 34 57
24.56 34 47 85Ajax Paving
Industry 258
Better Roads Inc. 3267 320.13
151 10.08 33 2.92
8.43 0 0.00
A.P.A.C.
111 8.65 5 0.36Demoya Group 647 62.51 36 55
13.85 2 0.11Dickerson Asphalt 19 1.73 54 71 153
Maximum
29 48 198 9.68 19 1.42
St. DevIRI ≥ 86
Lots
#
#
#
#
#
4
43
General Asphalt Company 1424 137.07 36 52
L
0 0.00
0.60
Lane Construction Corp. 1623 157.43 33 54
Quality Enterprises Usa
Inc.
Ranger Construction 6
136 9.78 19 1.25
50 4.75 35 49
0.60 94 113 133 15.03 6
9.70 0 0.00Elmo Greer 108 10.62 36 50 81
71
101 7.81 5 0.47
7.53
G
#
#
#
#b
#
#
28 2.43
A.P.A.C. 1198 29 48 106
2028 195.80
116.67
0.0210.82 33 45 204 8.38 1Ajax Paving
Industry
IRI ≥ 86
Lots MilesTotalLots
TotalMiles Minimum Mean Maximum St. DevAggregate Type
109
9.53 4 0.40
45 4.12
72 110 14.8015.48 42
Gra
nite
26 48 207 14.90
Lane Construction Corp.
Table 21 District 1 Statistical Summary for Aggregate Type, by Contractor, continued
Mix
ed
6.13 0 0.00Lane Construction
Corp. 46 4.39 36
Ajax Paving Industry
2.6927Orlando Paving
Company 155
52 68
487 47.92 33 59 120 15.07
#
44

2District
2.1 District 2 Ride Distribution
10%
rcen
tage
District-2 Ride Distribution, All Lots
Total Miles: 1404.05
24 49 161 10.97
Figure 12 District 2 Ride Distribution, All Lots
TotalMiles Minimum Mean Maximum St. Dev
IRI ≥ 86
Lots Miles
45
All Lots 14306 1404.05
Type TotalLots
140 10.97
0%
10%
0 14 28 42 56 70 84 98 112 126 140 >153
Perc
enta
ge
International Roughness Index (IRI)
District-2 Ride Distribution, All Lots
Total Miles: 1404.05
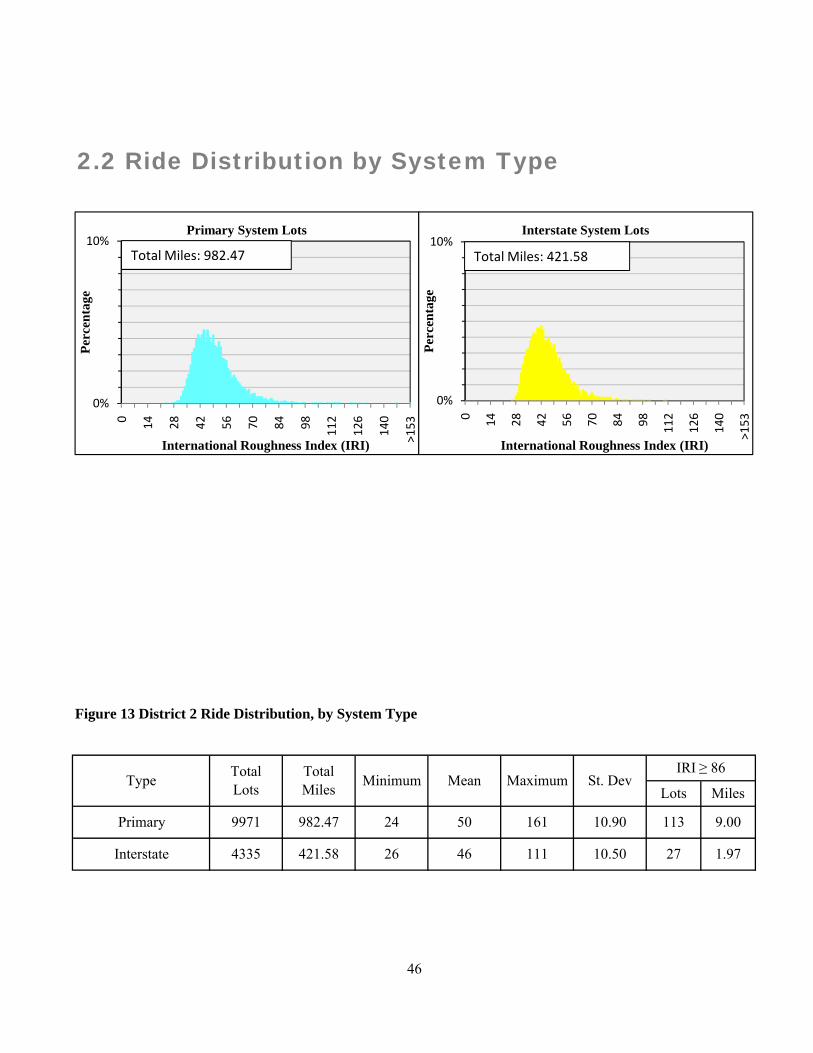
2.2 Ride Distribution by System Type
0%
10%
0 14 28 42 56 70 84 98 112
126
140
>153
Perc
enta
ge
International Roughness Index (IRI)
Primary System Lots
Total Miles: 982.47
0%
10%
0 14 28 42 56 70 84 98 112
126
140
>153
Perc
enta
geInternational Roughness Index (IRI)
Interstate System Lots
Total Miles: 421.58
TotalMiles Minimum Mean Maximum
Figure 13 District 2 Ride Distribution, by System Type
113 9.009971 982.47 24 50 161 10.90Primary
LotsSt. Dev
IRI ≥ 86Type Total
Lots
46 111 10.50 27 1.97Interstate 4335 421.58 26
46
Miles

2.3 Ride Distribution by Friction Course Type
0%
10%
0 14 28 42 56 70 84 98 112
126
140
>153
Perc
enta
ge
International Roughness Index (IRI)
FC5 Lots
Total Miles: 822.63
0%
10%
0 14 28 42 56 70 84 98 112
126
140
>153
Perc
enta
geInternational Roughness Index (IRI)
FC9.5 Lots
Total Miles: 76.82
10%
enta
ge
FC12.5 Lots
Total Miles: 504.60
8402 822.63 26 47
St. DevIRI ≥ 86
Mean MaximumType
76.82
6.25504.60 24 52 1615118
29FC9.5 786
Lots Miles
FC5
Figure 14 District 2 Ride Distribution, by Friction Course Type
TotalLots
TotalMiles Minimum
50 147 10.77 10 0.69
FC12.5
47
11.59 76
131 10.11 54 4.03
0%
10%
0 14 28 42 56 70 84 98 112
126
140
>153
Perc
enta
ge
International Roughness Index (IRI)
FC5 Lots
Total Miles: 822.63
0%
10%
0 14 28 42 56 70 84 98 112
126
140
>153
Perc
enta
geInternational Roughness Index (IRI)
FC9.5 Lots
Total Miles: 76.82
0%
10%
0 14 28 42 56 70 84 98 112
126
140
>153
Perc
enta
ge
International Roughness Index (IRI)
FC12.5 Lots
Total Miles: 504.60
1
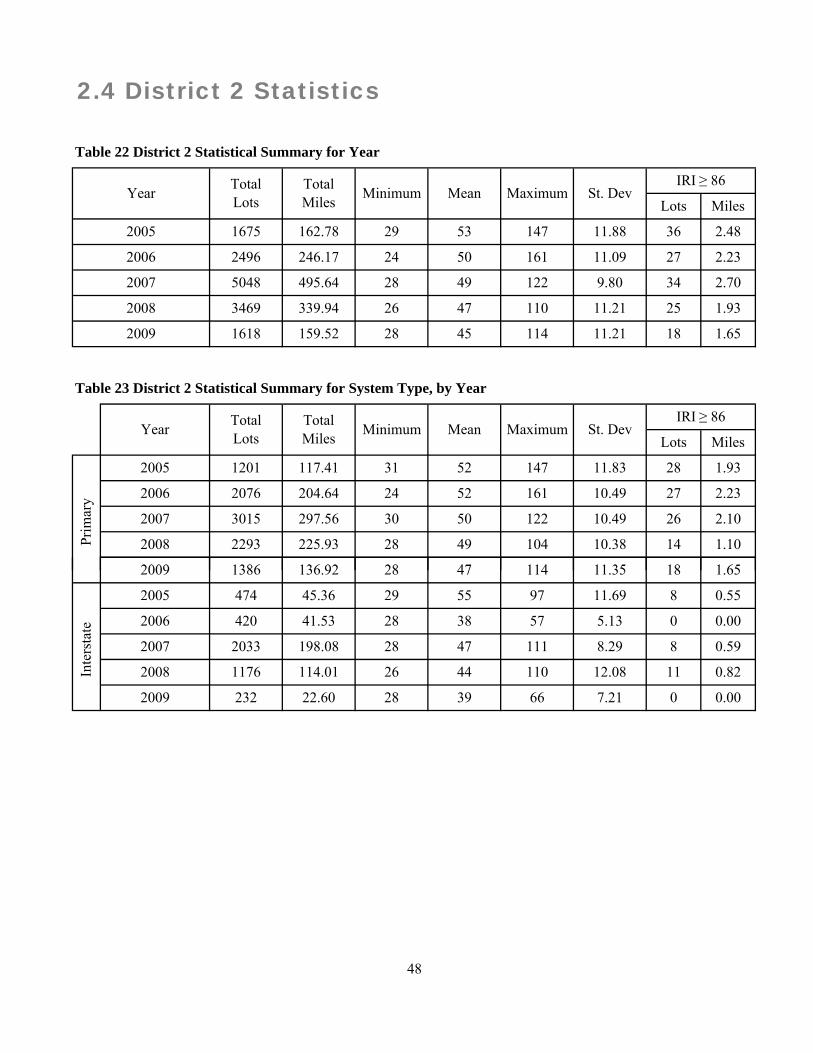
3015 297.56 30 50 122 10.49 26 2.10
2293 225.93 28 49 104 10.38 14 1.10
1386 136 92 28 47 114 11 35 18 1 65
11.09 27 2.23
9.80 34 2.70
11.21 25 1.93
11.21 18
2.23
2496 246.17 24 50 161
5048 495.64 28
52 161 10.49 27
47
49 122
3469 339.94 26
204.64 24
45 114 1.65
2076
110
1618 159.52 28
2008
2009
IRI ≥ 86
Prim
ary 2006
Minimum St. DevTotalLots
TotalMiles Lots Miles
Year Mean
29 53 147 11.88 36 2.48
Maximum
2005 1675 162.78
Table 22 District 2 Statistical Summary for Year
2007
IRI ≥ 86
2009
Year TotalLots
Table 23 District 2 Statistical Summary for System Type, by Year
2.4 District 2 Statistics
Lots Miles
2006
2007
TotalMiles Minimum Mean Maximum St. Dev
11.83
2008
28 1.932005 1201 117.41 31 52 147
41386 136.92 28 47 114 11.35 18 1.65
420 41.53 28 38 0.00
2033
57 5.13 0
22.60
198.08 28 47 111 8.29 8 0.59
1176 114.01 26 44 110 12.08 11 0.82
232 28 39 66 7.21 0 0.00
2009
2009
97 11.69 8
Inte
rsta
te
2008
2005 474 45.36 29 55
48
2006
2007
0.55

0 0.00 0 0.00
1355 133.32 24 51 161 10.29 16 1.17
1228 120.97 32 56 122 10.73 21 1.71
1688 166 53 28 49 104 10 83 12 0 90
1141 112.85 28 48 125 11.80 11 1.05
3596 352.63 28 46 111 8.07 11 0.85
1616 157.49 26 46 110 11.57 13 1.02
967 95.21 28 42 83 7.33 0 0.00
0 0.00 0 0 0 0.00 0 0.00
224 22.04 30 49 105 8.36 2 0.13
165 15.92 29 41 70 7.67
Table 24 District 2 Statistical Summary for Friction Course Type, by Year
TotalMiles Minimum Mean Maximum St. Dev
IRI ≥ 86
Lots MilesYear Total
Lots
FC5
2006
2008
11.88 19 1.11
2005 196 19.48 41 58 104 11.36 9 0.81
2007
2009
FC9.
5
2005 397 38.85 33 53 147 11.08 8 0.56
2007
131
2009
1082 104.45 29 51
2007
2005
2008
2008
2006
FC12
.5
2006
0 0.00
0 0.00 0 0
1
4
1
4
1
4
27 1.97
0 0.00 0 0 0 0.00 0 0.00
0 0.00 0 0 0 0.00 0 0.00
1688 166.53 28 49 104 10.83 12 0.90
651 64.31 28 50 114 14.08 18 1.65
4335 421.58 26 46 111 10.50
FC9.
5 Primary 786 76.82
2009
TotalLots
TotalMiles
2008
Table 25 District 2 Statistical Summary for Friction Course Type, by System Type
Lots Miles
IRI ≥ 86St. Dev
2.06131 9.56 27
29 50 147
Interstate
MaximumMinimum Mean
10.77 10 0.69
FC12
.5 Primary 5118 504.60Interstate
24 52 161
Interstate
FC5
11.59 76 6.25
Primary 4067 401.05 29 48
49
System Type
L
G
B
L
G
B
L
G
B
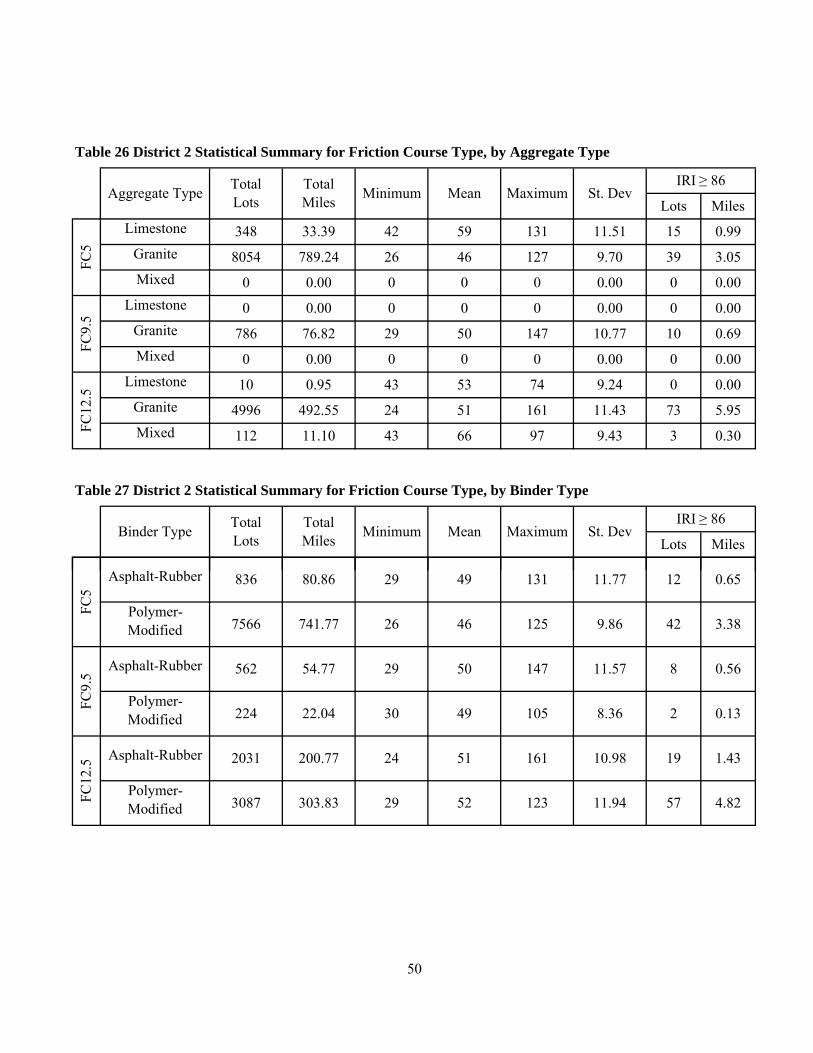
8054 789.24
0 0.00 0 0 0 0.00 0 0.00
4996 492.55 24 51 161 11.43 73 5.95
112 11.10 43 66 97 9.43 3 0.30
26 46 127 9.70 39 3.05
0 0.00 0 0 0 0.00 0 0.00
786 76.82 29 50 147 10.77 10 0.69
TotalLots
TotalMilesAggregate Type
IRI ≥ 86
0
Lots Miles
FC9.
5
Limestone 0
Minimum Mean Maximum St. Dev
FC5
Limestone
0 0.0000.00 0 0.00
FC12
.5
Granite
Mixed
43 53 74 9.24 0 0.00Limestone 10 0.95
Mixed
Lots Miles
Table 27 District 2 Statistical Summary for Friction Course Type, by Binder Type
Mixed
Granite
Granite42 59 131 11.51
Table 26 District 2 Statistical Summary for Friction Course Type, by Aggregate Type
348 33.39 15 0.99
Maximum St. DevIRI ≥ 86
Binder Type TotalLots
TotalMiles Minimum Mean
1
2
1
2
1
2
562 54.77 29 50 147 11.57 8 0.56
224 22.04 30 49 105 8.36 2 0.13
2031 200.77 24 51 161 10.98 19 1.43
3087 303.83 29 52 123 11.94 57 4.82
836 80.86 29 49 131 11.77 12 0.65
7566 741.77 26 46 125 9.86 42 3.38
FC5
FC9.
5
Asphalt-Rubber
Polymer-Modified
Asphalt-Rubber
Polymer-Modified
FC12
.5
Asphalt-Rubber
Polymer-Modified
50

1
3
1
3
1
3
4407
29 47 127 9.27 20 1.83
0 0.00 0 0 0 0.00 0 0.00
786 76.82 29 50 147 10.77 10 0.69
0 0.00 0 0 0 0.00 0 0.00
504.60 24 52 161 11.59 76 6.25
3995
427.71 26 46 131
394.92
FC5
FC9.
5FC
12.5
Limited(Full Control)
Non-Limited(No Control)
Limited(Full Control)
Non-Limited(No Control)
Limited(Full Control)
Non-Limited(No Control) 5118
10.76 34 2.21
Table 28 District 2 Statistical Summary for Friction Course Type, by Access Type
TotalMiles Minimum Mean Maximum St. DevAccess Type
IRI ≥ 86
MilesTotalLots Lots
51

#
1
#
#
#
#
3
4.77 59 81 114 12.86 16 1.45
574 55.40 29 49 94 11.04 4 0.31
10 0.95 43 53 74 9.24 0 0.00
50
220.30 26 46 123 11.46 23 1.39
7868 776.95 28 48 161 10.49 72 6.07
1045 100.45 29 45 99 9.99 5 0.32
225 22.27 24 45 75 8.86 0 0.00
372 37.12 37 50 87 6.45 1 0.10
2277A.P.A.C.
Anderson Columbia
Atlantic Coast
C.W.Roberts Contracting
D.A.B. Constructors
Duval Asphalt
Hubbard Construction
John C. Hipp
Contractor TotalLots
2.5 District 2 Contractor Statistics
Table 29 District 2 Statistical Summary for Contractors
TotalMiles Minimum Mean Maximum St. Dev
IRI ≥ 86
Lots Miles
#
#
#
#141.35 34
388 38.36 42 60 125 11.24 11
53 93 8.58 1 0.051425
72 6.13 44 65 131 12.14 7 0.24
1.05
Milestone Southern Paving
P & S Paving
Whitehurst
52

#
1
#
#
3
#
6.13 44 65 131 12.14 7 0.24
420 40.58 29 50 94 10.94 2 0.20
72
4409 436.10 28 46 127 9.00 16 1.38
784 75.05 29 46 99 10.45 5 0.32
372 37.12 37 50 87 6.45 1 0.10
Table 30 District 2 Statistical Summary for Friction Course Type, by Contractor
St. DevIRI ≥ 86
LotsTotalMiles Minimum Mean Maximum
D.A.B. Constructors
15 1.051464 140.53 26 11.98
FC5
A.P.A.C.
Anderson Columbia
Hubbard Construction
Milestone Southern Paving
Atlantic Coast
MilesContractor Total
Lots
11144
#
#
#
#
1
#
276 27.26 42 57 125 10.96 8 0.75
605 59.87 34 47 74 5.99 0 0.00
15.92 29 41 70 7.67 0 0.00
33 53 147 10.58 9 0.66
165
529 51.97
92 8.93 30 46 91 7.15
53
Whitehurst
A.P.A.C.
Anderson ColumbiaFC
9.5
0.03
Atlantic Coast
1
P & S Paving

#
1
#
#
#
3
0.11
2930 288.88 28 50 161 11.70 47 4.03
96 9.48 32 47 71 7.82 0 0.00
225 22.27 24 45 75 8.86 0 0.00
Atlantic Coast
IRI ≥ 86
Lots Miles
0.31
Duval Asphalt
Contractor TotalLots
TotalMiles Minimum
Table 30 District 2 Statistical Summary for Friction Course Type, by Contractor, continued
Mean
70.84 32 50 123 9.52 7
FC12
.5
A.P.A.C. 721
Anderson Columbia
Maximum St. Dev
Hubbard Construction
C.W.Roberts Contracting
50 4.77 59 81 114 12.86 16 1.45
154 14.83 31 48 91 11.10 2
3
#
#
#
0.30
820 81.49 39 56 93 8.15 1 0.05
10 0.95 43 53 74 9.24 0
112 43 66 97 9.43 3
0.00
11.10
Whitehurst
John C. Hipp
54
P & S Paving
L
#
#
#G
#
1
#
44 65 131 12.14 7 0.24
276 27.26 42 57 125 10.96 8 0.75
1045 100.45 29 45 99 9.99 5 0.32
7868
72
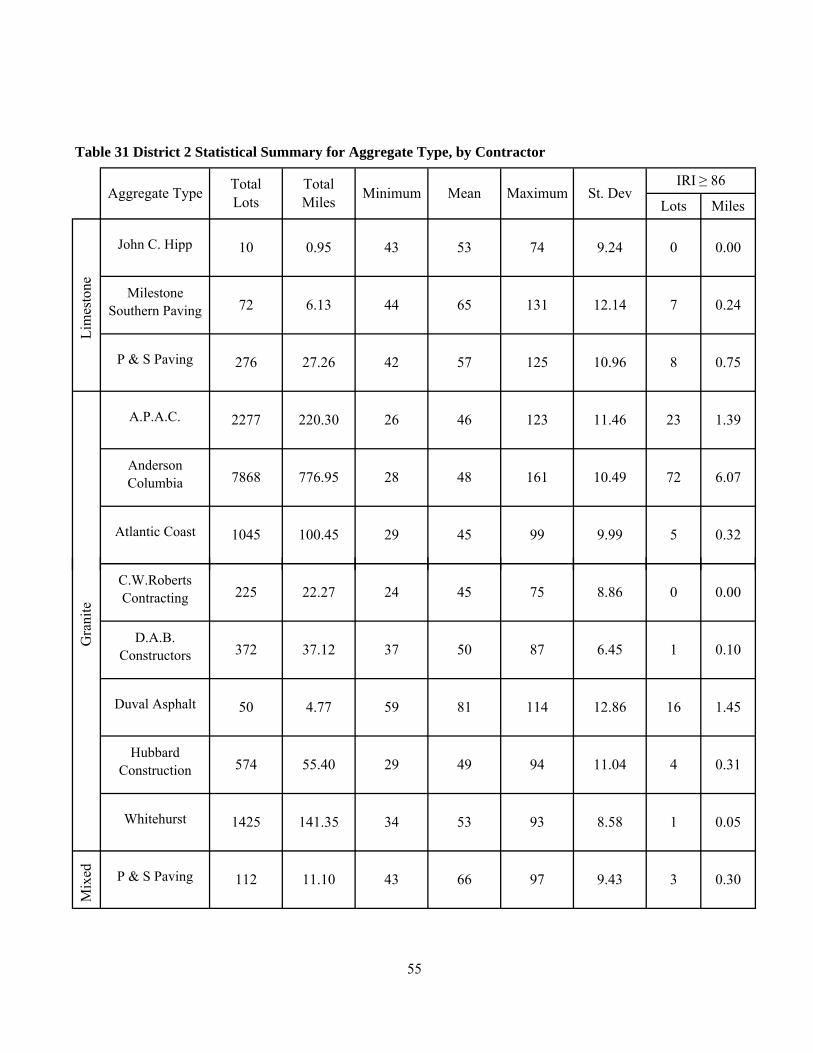
Table 31 District 2 Statistical Summary for Aggregate Type, by Contractor
Aggregate Type TotalLots
TotalMiles Minimum Mean Maximum St. Dev
IRI ≥ 86
Lots Miles
Anderson Columbia
43 53 74 9.24 0 0.00
P & S Paving
23 1.392277 220.30 26 46 123 11.46A.P.A.C.
Lim
esto
ne
John C. Hipp 10 0.95
Milestone Southern Paving
Atlantic Coast
776.95 28 48 161 10.49 72 6.07
6.13
#
#
#
#
3
#B
#
4.77 59 81 114 12.86 16 1.45
574 55.40 29 49 94 11.04 4 0.31
225 22.27 24 45 75 8.86 0 0.00
372
50
0.051425 141.35 34 53 93 8.58 1
C.W.Roberts Contracting
Gra
nite
P & S Paving 112
Hubbard Construction
9.43 3 0.30
Whitehurst
11.10
55
Mix
ed
37.12 37 50 87 6.45 1 0.10D.A.B.
Constructors
Duval Asphalt
43 66 97

PAGE
LEFT BLANK
56

3.1 District 3 Ride Distribution
3District
10%
rcen
tage
District-3 Ride Distribution, All Lots
Total Miles: 706.52
MilesType Total
LotsTotalMiles Minimum Mean
Figure 15 District 3 Ride Distribution, All Lots
57
LotsMaximum St. Dev
IRI ≥ 86
8.15 19 1.42All Lots 7199 706.52 25 41 130
0%
10%
0 14 28 42 56 70 84 98 112 126 140 >153
Perc
enta
ge
International Roughness Index (IRI)
District-3 Ride Distribution, All Lots
Total Miles: 706.52

3.2 Ride Distribution by System Type
0%
10%
0 14 28 42 56 70 84 98 112
126
140
>153
Perc
enta
ge
International Roughness Index (IRI)
Primary System Lots
Total Miles: 453.51
0%
10%
0 14 28 42 56 70 84 98 112
126
140
>153
Perc
enta
geInternational Roughness Index (IRI)
Interstate System Lots
Total Miles: 253.01
2601 253.01 27 41 130 7.87 7 0.44
Figure 16 District 3 Ride Distribution, by System Type
Type TotalLots
TotalMiles Minimum
1242 114 8.29 0.98
Lots MilesMean Maximum St. Dev
IRI ≥ 86
Primary 4598 453.51 25
Interstate
58
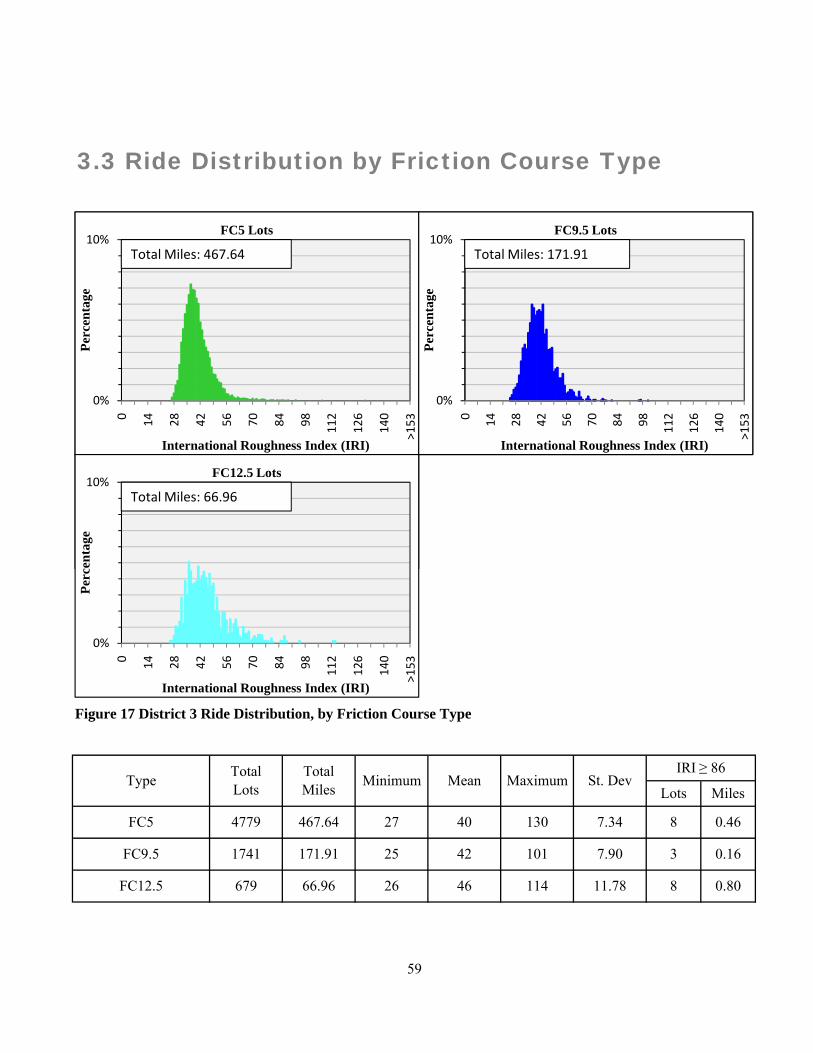
3.3 Ride Distribution by Friction Course Type
0%
10%
0 14 28 42 56 70 84 98 112
126
140
>153
Perc
enta
ge
International Roughness Index (IRI)
FC5 Lots
Total Miles: 467.64
0%
10%
0 14 28 42 56 70 84 98 112
126
140
>153
Perc
enta
geInternational Roughness Index (IRI)
FC9.5 Lots
Total Miles: 171.91
10%
cent
age
FC12.5 Lots
Total Miles: 66.96
1741 171.91 25 42 101 7.90 3 0.16
679 66.96 26 46 114 11.78 8 0.80
4779 467.64 27
FC9.5
FC12.5
Type TotalLots
TotalMiles Minimum Mean Maximum St. Dev
IRI ≥ 86
40 130 7.34 8 0.46
Lots Miles
FC5
59
Figure 17 District 3 Ride Distribution, by Friction Course Type
0%
10%
0 14 28 42 56 70 84 98 112
126
140
>153
Perc
enta
ge
International Roughness Index (IRI)
FC5 Lots
Total Miles: 467.64
0%
10%
0 14 28 42 56 70 84 98 112
126
140
>153
Perc
enta
geInternational Roughness Index (IRI)
FC9.5 Lots
Total Miles: 171.91
0%
10%
0 14 28 42 56 70 84 98 112
126
140
>153
Perc
enta
ge
International Roughness Index (IRI)
FC12.5 Lots
Total Miles: 66.96

1
8.14 8 0.66183.81
1669 164 46 25 41 97 7 89 2 0 12
27 42 114
32.78 34 46 77 5.67 0 0.00
2233 220.02 27 41 114 7.98 8 0.66
2103 206.16 25 40 107 7.87 7 0.53
2444 239.89 25 41 130 7.84 3 0.13
0 0.00 0 0 0 0.00 0 0.00
1863
87 10.13 1 0.10
988 97.57 25 40 95 7.20 1 0.10
341
Maximum St. DevIRI ≥ 86
Lots
3.4 District 3 Statistics
Year
1 0.1010.132005 78 7.67 41
TotalMiles Minimum MeanTotal
Lots
2008
Miles
2006
Lots Miles
Table 33 District 3 Statistical Summary for System Type, by Year
Maximum St. DevIRI ≥ 86
2007
Year TotalLots
TotalMiles Minimum Mean
Prim
ary
2008
2006
2009
59 87
Table 32 District 3 Statistical Summary for Year
2009
2005 78 7.67 41 59
2007
4
775 75.43 28 40 130 7.74 1 0.02
1669 164.46 25 41 97 7.89 2 0.12
341 32.78 34 46 77 5.67 0 0.00
0.00 0 0 0 0.00 0
370 36.21 28 37 75 5.28 0 0.00
1115 108.59 27 41 107 8.40 6 0.43
0.00
Inte
rsta
te 2006
2009
2008
2005 0
2007
60
2009
224 22 20 26 39 95 8 59 1 0 10
498 49.08 25 39 67 6.96 0 0.00
747 74.15 25 42 97 8.05 1 0.10
0 0.00 0 0 0 0.00 0 0.00
197 19.24 27 50 114 13.10 6 0.60
10.13 1 0.10
0 0.00 0 0.00
496 48.70 28 43 101 7.86 2 0.06
32.78 34 46 77 5.67 0 0.00
1540 152.09 28 40 79 6.07 0 0.00
1381 134.89 27 41 107 7.99 6 0.43
1517 147.89 27 40 130 7.65 2 0.03
0 0.00 0 0
341
Maximum St. DevIRI ≥ 86
2006
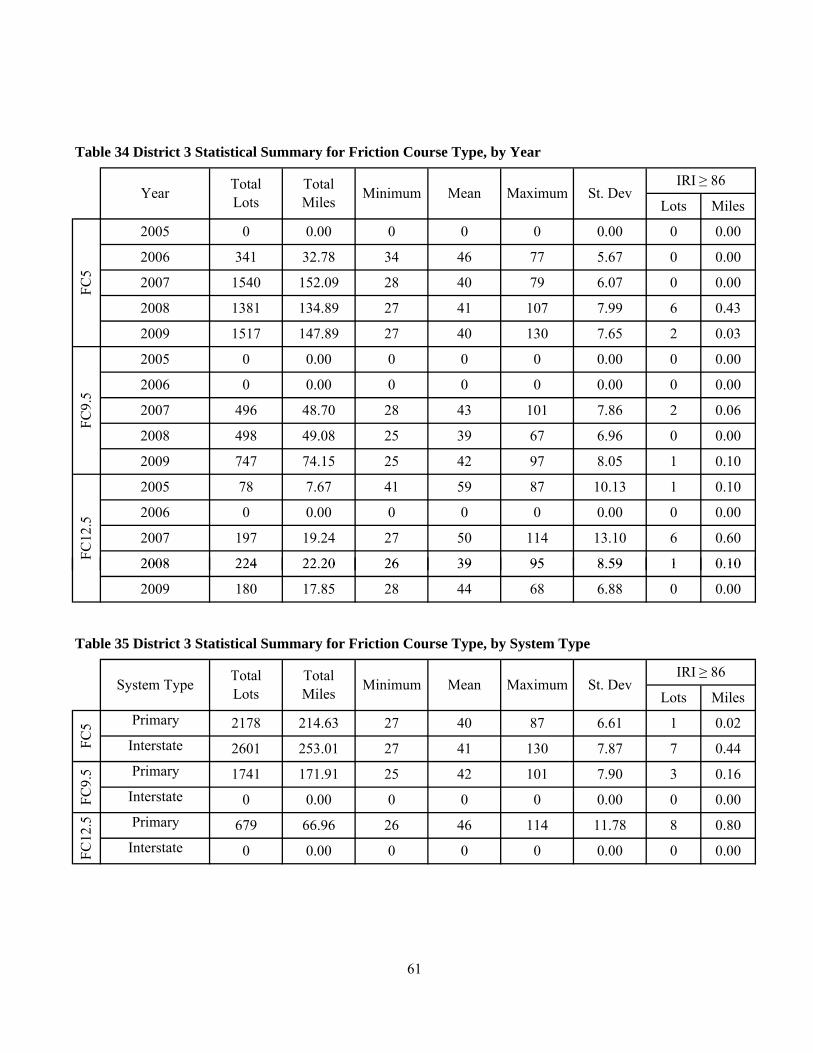
Table 34 District 3 Statistical Summary for Friction Course Type, by Year
Mean
2006
2008
2006
2009
0 0.00 0 0 0 0.00
FC5
2005 0 0.00
Lots MilesYear Total
LotsTotalMiles Minimum
0
2008
2007
0 0 0.00 0 0.00
2007
7.67 41 59 87
FC12
.5
2008
2007
2005 78
FC9.
5
2005 0 0.00
2009
1
4
1
4
1
4
224 22.20 26 39 95 8.59 1 0.10
180 17.85 28 44 68 6.88 0 0.00
2601 253.01 27 41 130 7.87 7 0.44
0 0.00 0 0 0 0.00 0 0.00
0 0.00 0 0 0 0.00 0 0.00
40 87 6.61 1
8 0.80
2008
2009
0.02
Lots
214.63 27
Miles
FC5 Primary 2178
System Type TotalLots
TotalMiles Minimum Mean
Table 35 District 3 Statistical Summary for Friction Course Type, by System Type
Maximum St. DevIRI ≥ 86
FC9.
5 Primary 1741 171.91
Interstate
Interstate25 42 101 7.90 3 0.16
66.96Interstate
61
FC12
.5 Primary 679 26 46 114 11.78
L
G
B
L
G
B
L
G
B0 0 0.00 0
7.34
0 0 0.000.00 0 0 0 0.00
114
0 0
Granite 4779 467.64 27 40 130
11.78
0.00
Limestone 0 0.00 0
0.00 0
0 0 0.00
FC5
0.00
0 0.00
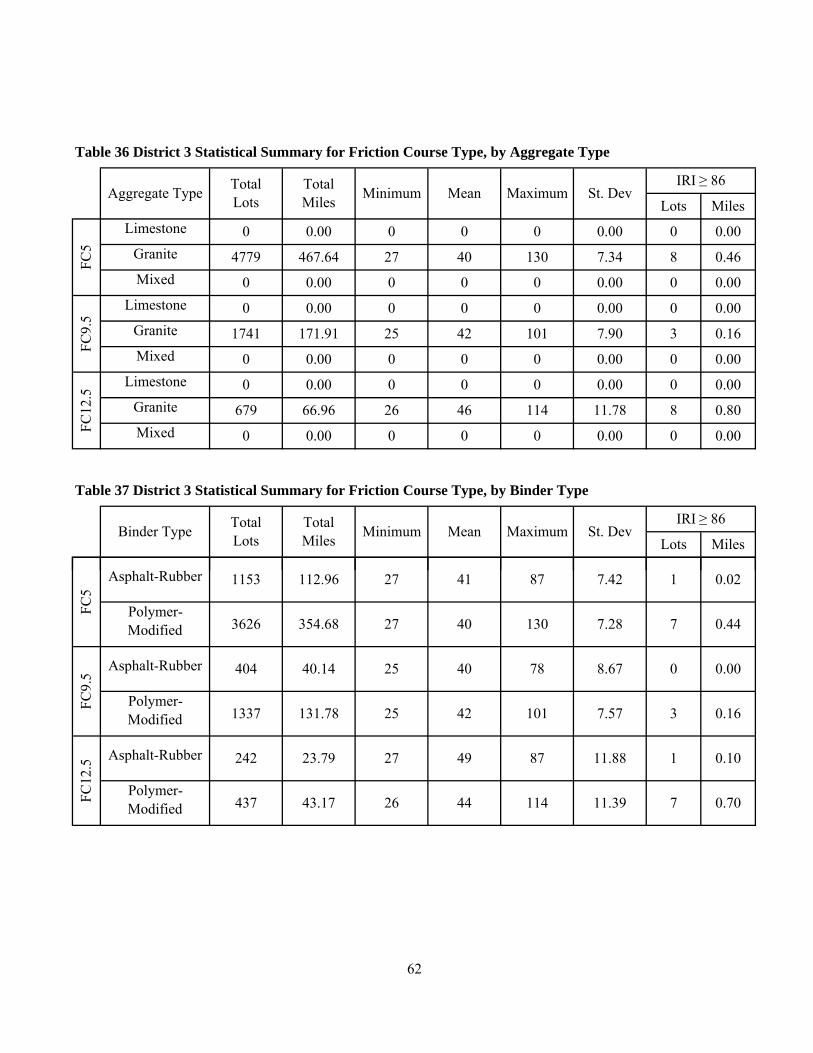
Binder Type TotalLots
TotalMiles Minimum Mean
FC9.
5
26 46
0 0.00 0Limestone
8 0.46
0
0
0.00 0
FC12
.5
0.00 0 0.00
Table 37 District 3 Statistical Summary for Friction Course Type, by Binder Type
0
Limestone 0
0 0.00
8 0.80
0.00
Lots Miles
Mixed
Maximum St. DevIRI ≥ 86
MilesAggregate Type Total
LotsTotalMiles Minimum Mean
Mixed25
0
3 0.16
Granite 679 66.96
Lots
Table 36 District 3 Statistical Summary for Friction Course Type, by Aggregate Type
Mixed
0 0.00 0 0
Granite 1741 171.91
0 0.00
42 101 7.90
Maximum St. DevIRI ≥ 86
1
2
1
2
1
2437 43.17 26 44 114 11.39 7 0.70
3626 354.68 27 40 130 7.28 7 0.44
404 40.14 25 40 78 8.67 0 0.00
1337 131.78 25 42 101 7.57 3 0.16
242 23.79 27 49 87 11.88 1 0.10
1153 112.96 27 41 87 7.42 1 0.02
FC5
FC9.
5FC
12.5
Asphalt-Rubber
Polymer-Modified
Asphalt-Rubber
Polymer-Modified
Asphalt-Rubber
Polymer-Modified
62
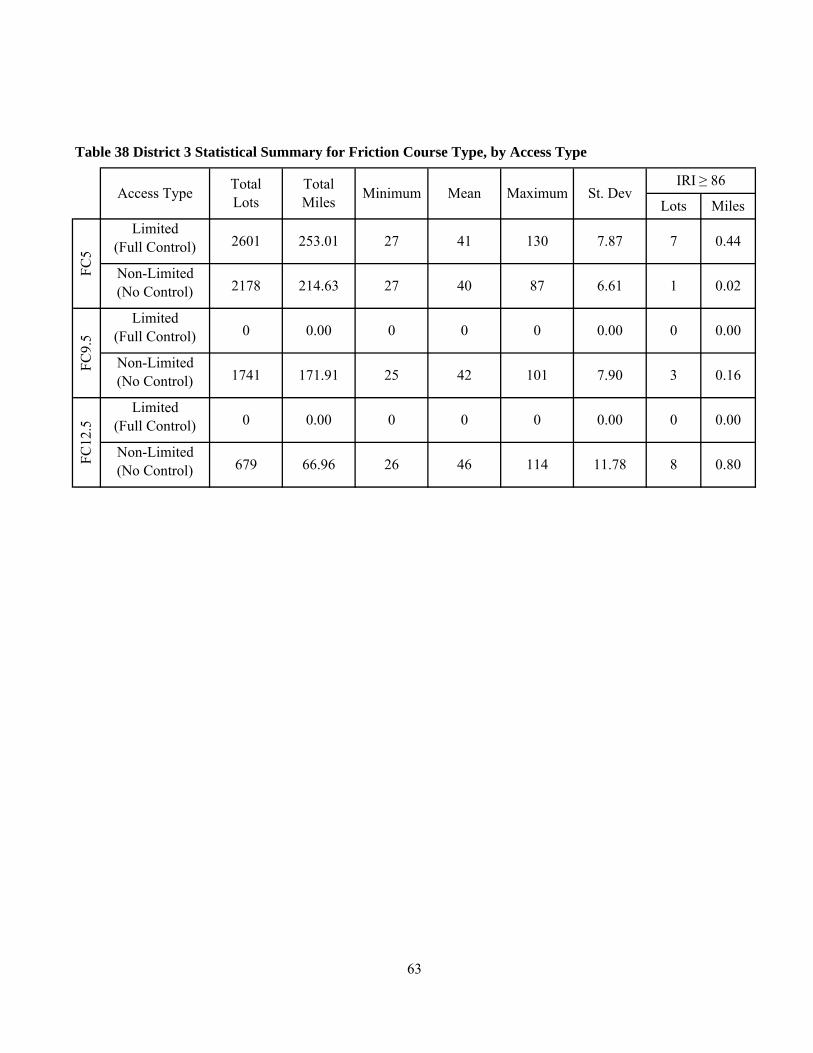
1
3
1
3
1
3
679 66.96 26 46 114 11.78 8 0.80
2178 214.63 27 40 87 6.61 1 0.02
0 0.00 0 0 0 0.00 0 0.00
1741 171.91 25 42 101 7.90 3 0.16
0 0.00 0 0 0 0.00 0 0.00
2601 253.01 27 41 130 7.87 7 0.44
FC5
FC9.
5FC
12.5
Limited(Full Control)
Table 38 District 3 Statistical Summary for Friction Course Type, by Access Type
Maximum St. DevIRI ≥ 86
Lots MilesAccess Type Total
LotsTotalMiles Minimum Mean
Non-Limited(No Control)
Limited(Full Control)
Non-Limited(No Control)
Non-Limited(No Control)
Limited(Full Control)
63

#
1
#
#
1
2461 241.44 28 41 107 7.15 6 0.43
3120 306.56 26 43 114 8.61 14 1.22
2693 264.80 26 40 101 7.45 4 0.18
352 35.02 25 37 63 6.81 0 0.00
1034 100.14 25 43 130 7.70 1 0.02
Lots MilesSt. Dev
IRI ≥ 86Contractor Total
LotsTotalMiles Minimum Mean Maximum
Table 39 District 3 Statistical Summary for Contractors
3.5 District 3 Contractor Statistics
A.P.A.C.
Anderson Columbia
C.W.Roberts Contracting
Peavey And Sons
Contractor TotalLots
TotalMiles Minimum Mean
Lots Miles
Table 40 District 3 Statistical Summary for Friction Course Type, by Contractor
Anderson Columbia
IRI ≥ 86St. DevMaximum
#
#
#
1
#
#
395 38.94 25 43 72 7.91 0 0.00
1679 165.00 27 38 87 6.91 1 0.02
639 61.20 30 43 130 7.56 1 0.02
176 17.39 35 47 78 7.74 0 0.00
818 80.56 26 42 101 7.45 3 0.16
352 35.02 25 37 63 6.81 0 0.00
64
FC5
Anderson Columbia
Peavey And Sons
FC9.
5
A.P.A.C.
Peavey And Sons
C.W.Roberts Contracting
C.W.Roberts Contracting
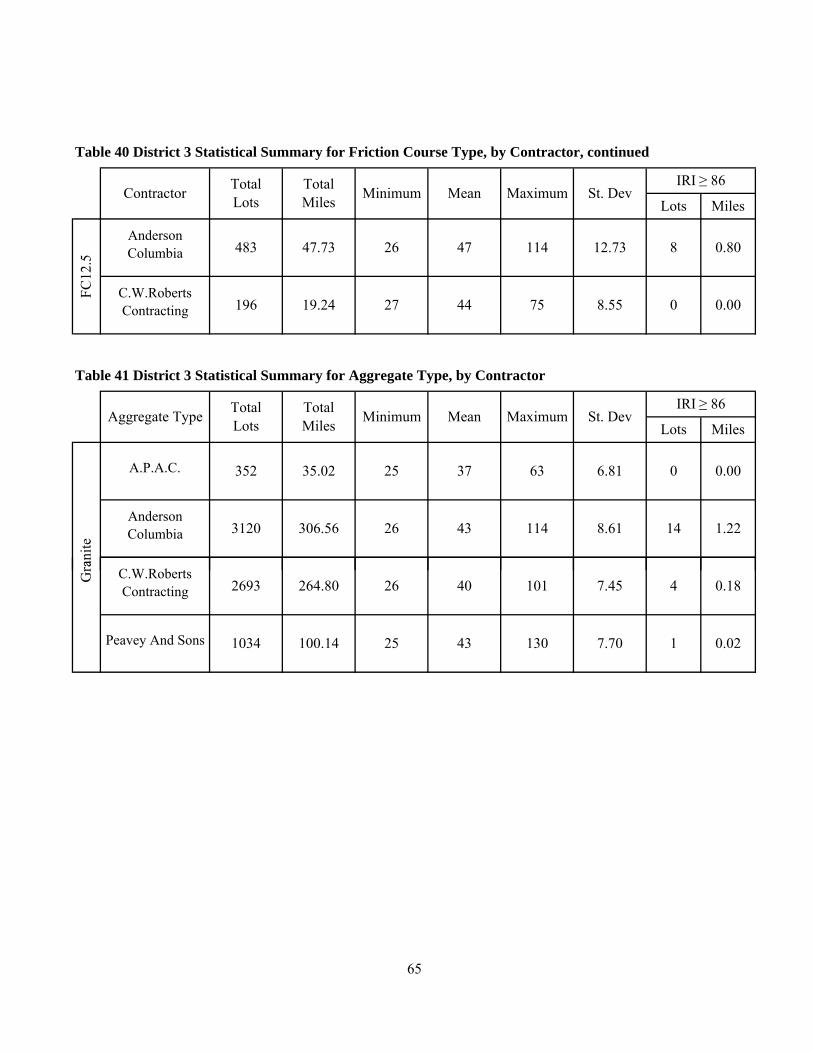
1
#
G
#
1
Contractor TotalLots
TotalMiles Minimum Mean Maximum St. Dev
IRI ≥ 86
Lots Miles
Table 40 District 3 Statistical Summary for Friction Course Type, by Contractor, continued
3120 306.56 26 43 114 8.61 14 1.22
St. DevIRI ≥ 86
114 12.73 8 0.80
FC12
.5
Anderson Columbia 483 47.73 26 47
75 8.55 0
Aggregate Type TotalLots
TotalMiles Minimum
anite
19.24 27 44
Lots Miles
196 0.00C.W.Roberts Contracting
Mean Maximum
Table 41 District 3 Statistical Summary for Aggregate Type, by Contractor
0.00A.P.A.C. 352 35.02 63 6.81 025
Anderson Columbia
37
#
#
1034 100.14 25 43 130 7.70 1 0.02
2693 264.80 26 40 101 7.45 4 0.18Gra
65
C.W.Roberts Contracting
Peavey And Sons

PAGE
LEFT BLANK
66

4District
4.1 District 4 Ride Distribution
10%
rcen
tage
District-4 Ride Distribution, All Lots
Total Miles: 851.52
Lots Miles
Figure 18 District 4 Ride Distribution, All Lots
67
Minimum Mean Maximum St. DevIRI ≥ 86
Type TotalLots
TotalMiles
32 61 171 14.24 527 46.65All Lots 8857 851.52
0%
10%
0 14 28 42 56 70 84 98 112 126 140 >153
Perc
enta
ge
International Roughness Index (IRI)
District-4 Ride Distribution, All Lots
Total Miles: 851.52

4.2 Ride Distribution by System Type
0%
10%
0 14 28 42 56 70 84 98 112
126
140
>153
Perc
enta
ge
International Roughness Index (IRI)
Primary System Lots
Total Miles: 283.96
0%
10%
0 14 28 42 56 70 84 98 112
126
140
>153
Perc
enta
geInternational Roughness Index (IRI)
Interstate System Lots
Total Miles: 567.56
5969 567.56 32 62 166 15.14 418 36.50
Figure 19 District 4 Ride Distribution, by System Type
Interstate
109 10.152888 283.96 33 59 171 11.99
Type TotalLots
68
Miles
Primary
LotsTotalMiles Minimum Mean Maximum St. Dev
IRI ≥ 86
0%
10%
0 14 28 42 56 70 84 98 112
126
140
>153
Perc
enta
ge
International Roughness Index (IRI)
Primary System Lots
Total Miles: 283.96
0%
10%
0 14 28 42 56 70 84 98 112
126
140
>153
Perc
enta
geInternational Roughness Index (IRI)
Interstate System Lots
Total Miles: 567.56

4.3 Ride Distribution by Friction Course Type
0%
10%
0 14 28 42 56 70 84 98 112
126
140
>153
Perc
enta
ge
International Roughness Index (IRI)
FC5 Lots
Total Miles: 812.50
0%
10%
0 14 28 42 56 70 84 98 112
126
140
>153
Perc
enta
geInternational Roughness Index (IRI)
FC9.5 Lots
Total Miles: 27.70
10%
cent
age
FC12.5 Lots
Total Miles: 11.32
284 27.70 34 60 127 12.53 10 0.96
114 11.32 37 57 101 12.74 3 0.30
FC9.5
FC12.5
8459 812.50 32 61
Mean MaximumType
FC5
TotalLots
TotalMiles Minimum
MilesLots
171 14.30 514 45.39
69
St. DevIRI ≥ 86
Figure 20 District 4 Ride Distribution, by Friction Course Type
0%
10%
0 14 28 42 56 70 84 98 112
126
140
>153
Perc
enta
ge
International Roughness Index (IRI)
FC5 Lots
Total Miles: 812.50
0%
10%
0 14 28 42 56 70 84 98 112
126
140
>153
Perc
enta
geInternational Roughness Index (IRI)
FC9.5 Lots
Total Miles: 27.70
0%
10%
0 14 28 42 56 70 84 98 112
126
140
>153
Perc
enta
ge
International Roughness Index (IRI)
FC12.5 Lots
Total Miles: 11.32

1
1365 133.32 42 67 141 12.62 105 10.03
2224 214.59 37 65 166 12.12 154 13.55
2072 197.40
36 58 171 11.56 22 1.79
1040 102 81 33 57 127 11 50 23 2 15
32 53 127 13.22 50 4.34
0 0.00 0 0 0 0.00 0 0.00
0.00
2390 231.85
6.21
14.29
0 0 0.00 02005
1226 121.03 37 62 112 11.98 64
622 60.12
35 61 171 14.91 166
Minimum Mean Maximum St. DevIRI ≥ 86
Lots MilesYear Total
LotsTotalMiles
4.4 District 4 Statistics
42 67 119 11.17 52 4.432005 806 74.37
2008
2006
2009
Lots Miles
Table 43 District 4 Statistical Summary for System Type, by Year
0
TotalMiles Minimum Mean Maximum St. Dev
IRI ≥ 86Year Total
Lots
2007
Prim
ary
0
2008
2006
Table 42 District 4 Statistical Summary for Year
2009
0.00
2007
4
1450 137.28 35 62 151 16.02 144 12.51
1350 129.04 32 50 105
7.34
13.77 27 2.19
1040 102.81 33 57 127 11.50 23 2.15
1365 133.32 42 67 141 12.62 105 10.03
998 93.55 44 69 166 11.10 90
2005 806
Inte
rsta
te
2009
2008
74.37
2006
42 67 119 11.17 52 4.43
2009
70
2007
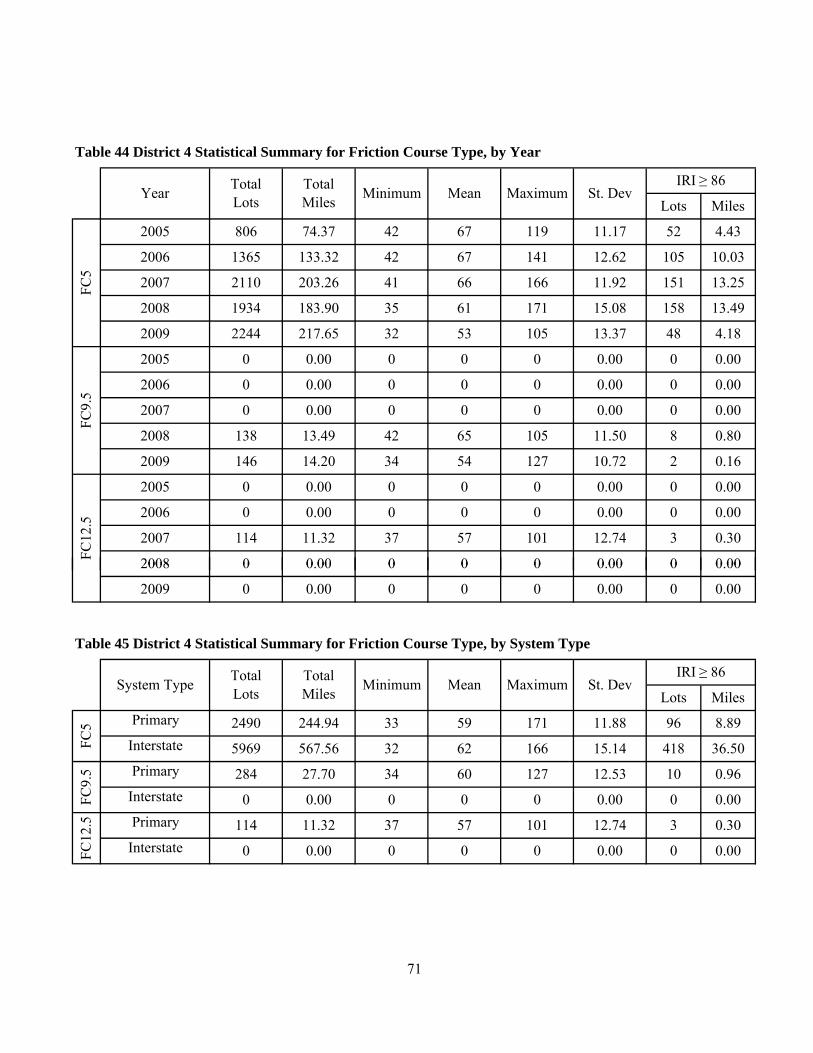
146 14.20 34 54 127 10.72 2 0.16
0 0.00 0 0 0 0.00 0 0.00
114 11.32 37 57 101 12.74 3 0.30
0
0 0 00 0 0 0 0 00 0 0 00
1365 133.32 42 67 141 12.62 105 10.03
2110 203.26 41 66 166 11.92 151 13.25
1934 183.90 35 61 171 15.08 158 13.49
2244 217.65 32 53 105 13.37 48 4.18
0 0.00 0 0 0 0.00 0 0.00
0 0.00 0 0 0 0.00 0 0.00
138 13.49 42 65 105 11.50 8 0.80
Table 44 District 4 Statistical Summary for Friction Course Type, by Year
2006
2008
42 67 119 11.17 52 4.43
2006
2009
FC5
2005 806 74.37
Lots MilesYear Total
LotsTotalMiles Minimum Mean
2008
0.00
2009
0.00 0 0 0 0.00
0.00 0 0.002005
2007
2007
0 0.00 0 0 0
FC9.
5FC
12.5
2005 0
2007
2006
2008
Maximum St. DevIRI ≥ 86
1
4
1
4
1
4
0 0.00 0 0 0 0.00 0 0.00
5969 567.56 32 62 166 15.14 418 36.50
0 0.00 0 0 0 0.00 0 0.00
0 0.00 0 0 0 0.00 0 0.00
0 0.00 0 0 0 0.00 0 0.00
FC5 96
Minimum Mean MaximumLots Miles
2490
127 12.53
2008
244.94 33 59 171 11.88
Table 45 District 4 Statistical Summary for Friction Course Type, by System Type
St. DevIRI ≥ 86
System Type TotalLots
TotalMiles
8.89Primary
Interstate
2009
10 0.96
FC9.
5 Primary 284 27.70 34 60
101 12.74 3 0.30
Interstate
71
FC12
.5 Primary 114 11.32 37 57Interstate
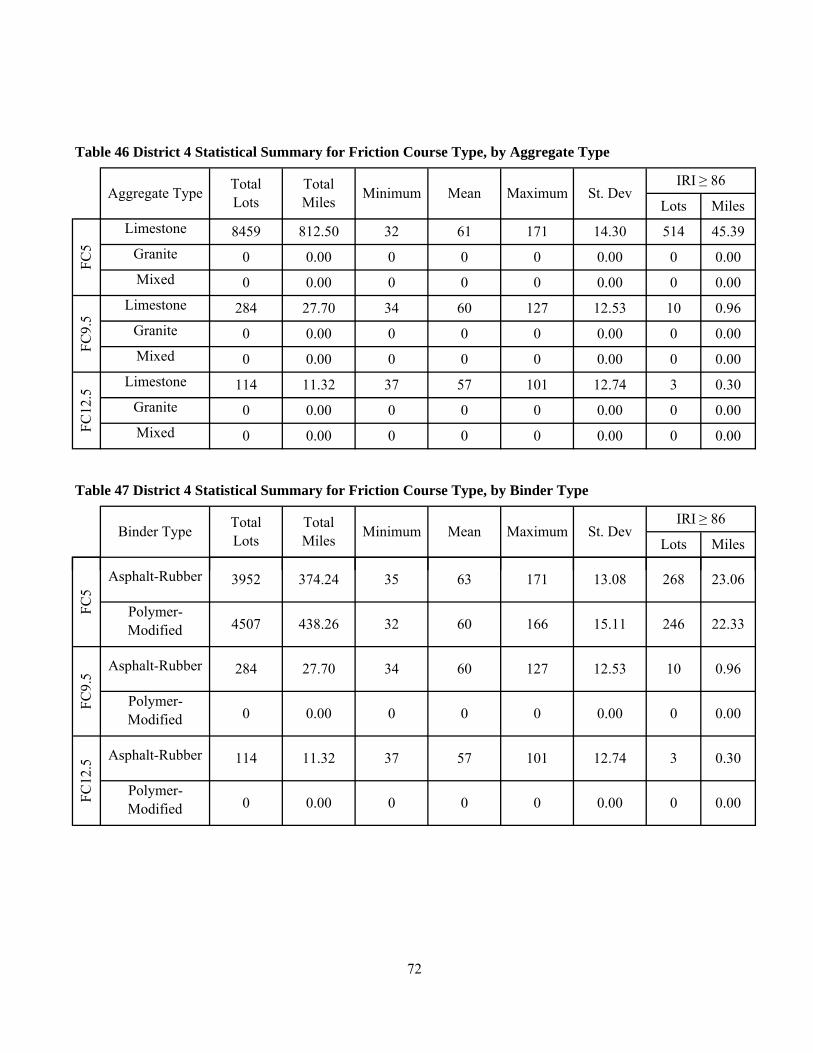
L
G
B
L
G
B
L
G
B
0 0.00 0 0 0 0.00 0 0.00
0 0.00 0 0 0 0.00 0 0.00
0 0.00 0 0 0 0.00 0 0.00
0 0.00 0 0 0 0.00 0 0.00
0 0.00 0 0 0 0.00 0 0.00
37
0 0.00 0 0 0 0.00 0 0.00Mixed
TotalMiles Minimum Mean Maximum St. Dev
IRI ≥ 86
Lots Miles
FC5
Limestone 32 61
3 0.30
8459 812.50
FC12
.5
Limestone 114 11.32
Granite
Granite
MixedFC9.
5
Limestone 284 27.70 34 60
Table 47 District 4 Statistical Summary for Friction Course Type, by Binder Type
57 101 12.74
Lots Miles
127 12.53 10 0.96
Aggregate Type TotalLots
Granite
Table 46 District 4 Statistical Summary for Friction Course Type, by Aggregate Type
TotalLots
171 14.30 514
Mixed
Binder Type
45.39
TotalMiles Minimum Mean Maximum St. Dev
IRI ≥ 86
1
2
1
2
1
20 0.00 0 0 0 0.00 0 0.00
3952 374.24 35 63 171 13.08 268 23.06
4507 438.26 32 60 166 15.11 246 22.33
284 27.70 34 60 127 12.53 10 0.96
0 0.00 0 0 0 0.00 0 0.00
114 11.32 37 57 101 12.74 3 0.30
FC5
FC9.
5FC
12.5
Asphalt-Rubber
Polymer-Modified
Asphalt-Rubber
Polymer-Modified
Asphalt-Rubber
Polymer-Modified
72

1
3
1
3
1
3
5969 567.56 32 62 166 15.14 418 36.50
2490 244.94 33 59 171 11.88 96 8.89
0 0.00 0 0 0 0.00 0 0.00
284 27.70 34 60 127 12.53 10 0.96
0 0.00 0 0 0 0.00 0 0.00
114 11.32 37 57 101 12.74 3 0.30
FC5
FC9.
5FC
12.5
Limited(Full Control)
Non-Limited(No Control)
Limited(Full Control)
Non-Limited(No Control)
Limited(Full Control)
Non-Limited(No Control)
Table 48 District 4 Statistical Summary for Friction Course Type, by Access Type
Access Type TotalLots
TotalMiles Minimum Mean Maximum St. Dev
IRI ≥ 86
Lots Miles
73
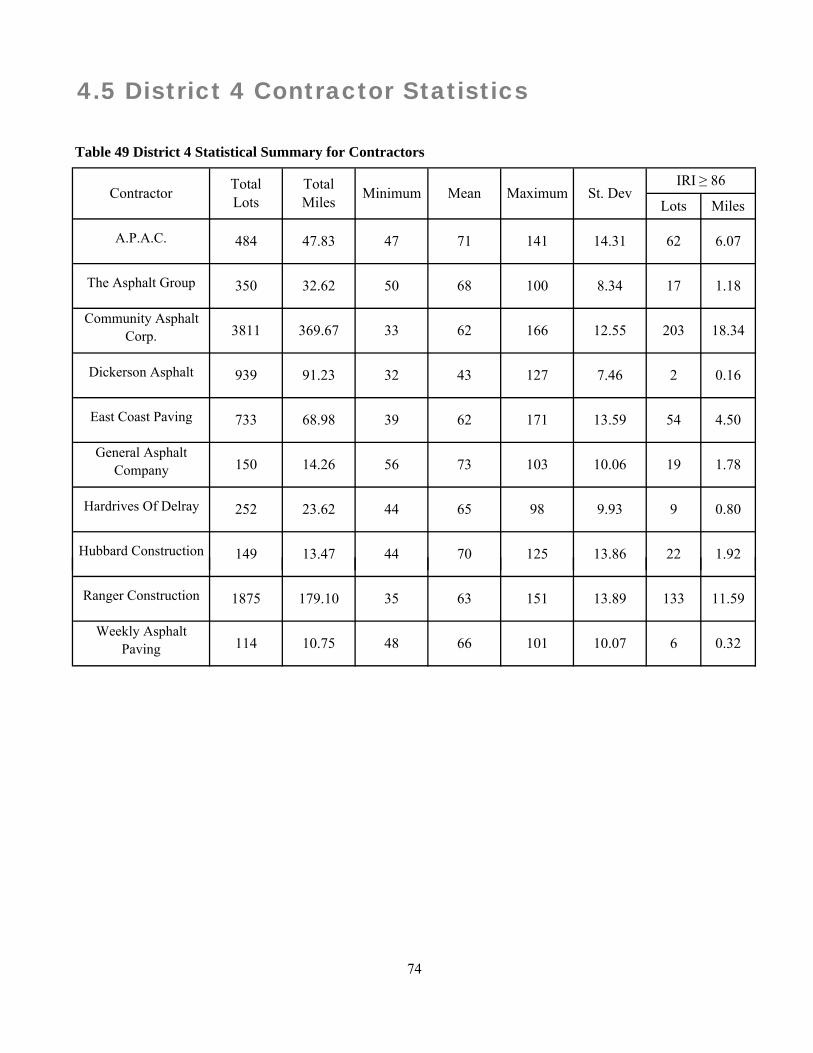
#
#
#
#
#
#
#
12.55 203 18.34
939 91.23 32 43 127 7.46 2 0.16
733 68.98 39 62 171 13.59 54 4.50
150 14.26 56 73 103 10.06 19 1.78
252 23.62 44
71 141 14.31 62 6.07
350 32.62 50 68 100 8.34 17 1.18
149 13.47 44 70 125 13.86 22 1.92
65 98 9.93 9 0.80
484 47.83 47
General Asphalt Company
Hardrives Of Delray
Hubbard Construction
A.P.A.C.
The Asphalt Group
Community Asphalt Corp.
Dickerson Asphalt
East Coast Paving
Lots Miles
4.5 District 4 Contractor Statistics
Contractor TotalLots
TotalMiles Minimum
Table 49 District 4 Statistical Summary for Contractors
Mean Maximum St. DevIRI ≥ 86
3811 369.67 33 62 166
3
4
#
1875 179.10 35 63 151 13.89 133 11.59
114 10.75 48 66 101 10.07 6 0.32
Ranger Construction
Weekly Asphalt Paving
74

#
#
#
#
#
#
793 77.03 32 40 74 4.09 0 0.00
733 68.98 39 62 171 13.59 54 4.50
150 14.26 56 73 103 10.06 19 1.78
350 32.62 50 68 100 8.34 17 1.18
3559 344.85 33 62 166 12.53 192 17.24
Lots Miles
Table 50 District 4 Statistical Summary for Friction Course Type, by Contractor
484
TotalMiles Minimum Mean
A.P.A.C. 62 6.07
Community Asphalt Corp.
FC5
47.83
East Coast Paving
47 71
Dickerson Asphalt
The Asphalt Group
General Asphalt Company
141 14.31
Maximum St. DevIRI ≥ 86
Contractor TotalLots
#
#
3
4
#
#
#
10.72 2 0.16
252 23.62 44 65 98 9.93 9 0.80
149 13.47 44 70 125 13.86 22 1.92
10.07 6 0.32
146 14.20 34 54 127
1875 179.10 35 63 151 13.89 133 11.59
114 10.75 48 66 101
Hubbard Construction
Weekly Asphalt Paving
13.49 42 65 105 11.50 8
FC9.
5
Community Asphalt Corp. 138
Dickerson Asphalt
75
Ranger Construction
0.80
Hardrives Of Delray
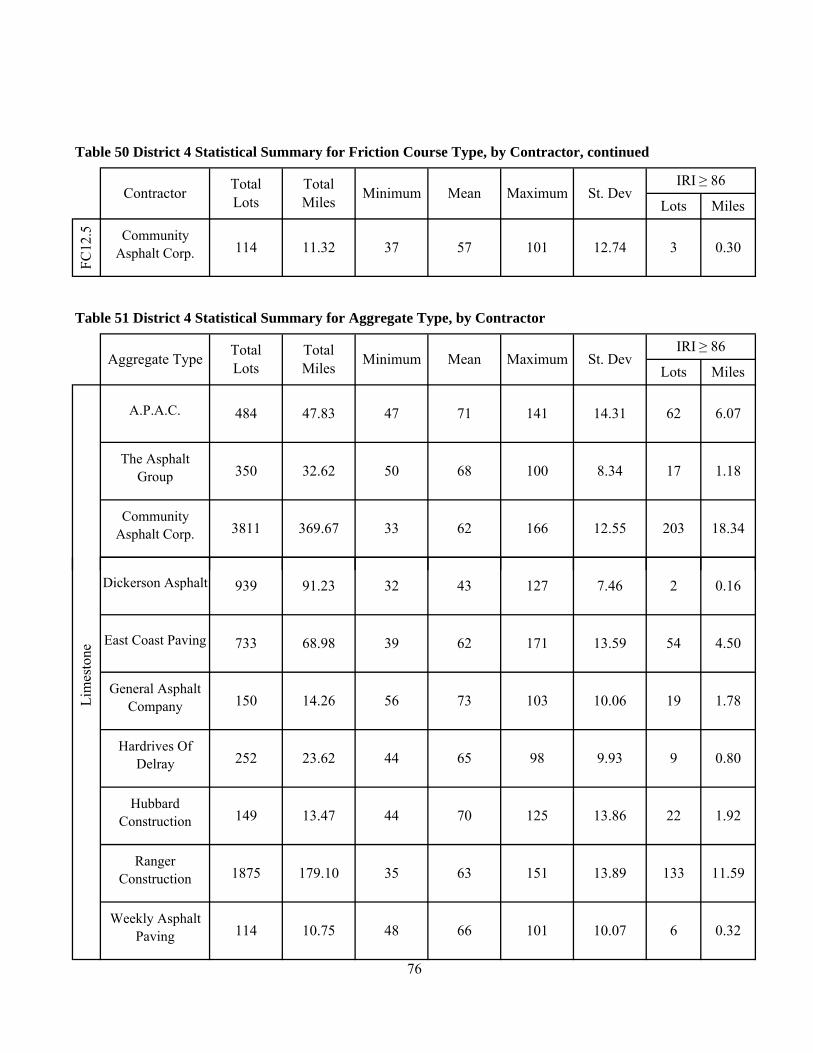
#
L
#
#
#
350 32.62 50
62
12.55 203 18.34
14.31 6.07
The Asphalt Group
Contractor
11.32
IRI ≥ 86
Lots MilesTotalLots
TotalMiles Minimum Mean Maximum St. Dev
Table 50 District 4 Statistical Summary for Friction Course Type, by Contractor, continued
Community Asphalt Corp. 114
TotalMiles
FC12
.5
TotalLots
A.P.A.C. 484 47.83
Table 51 District 4 Statistical Summary for Aggregate Type, by Contractor
71 141
Minimum Mean Maximum St. DevIRI ≥ 86
Lots MilesAggregate Type
37 57 101 12.74 3 0.30
369.67 33 62 166Community
Asphalt Corp. 3811
47
100 8.3468 17 1.18
#
#
#
#
3
4
#
114 10.75 48 66 101 10.07Weekly Asphalt
Paving
76
Dickerson Asphalt
General Asphalt Company 150 14.26 56
939 91.23 32 43
0.80
10.06 19 1.7873 103Lim
esto
ne
East Coast Paving 733 68.98
127 7.46 2 0.16
Hardrives Of Delray 252 23.62 44
13.86 22Hubbard
Construction 149 13.47 44 70 125
39
179.10 35 63 151
54 4.50
Ranger Construction 1875 13.89 133 11.59
62 171 13.59
1.92
6 0.32
65 98 9.93 9

5District
5.1 District 5 Ride Distribution
10%
rcen
tage
District-5 Ride Distribution, All Lots
Total Miles: 1518.78
Maximum St. Dev
Figure 21 District 5 Ride Distribution, All Lots
Lots MilesType Total
LotsTotalMiles
All Lots 15490 1518.78
Minimum Mean
77
IRI ≥ 86
25 51 228 12.56 258 22.58
0%
10%
0 14 28 42 56 70 84 98 112 126 140 >153
Perc
enta
ge
International Roughness Index (IRI)
District-5 Ride Distribution, All Lots
Total Miles: 1518.78
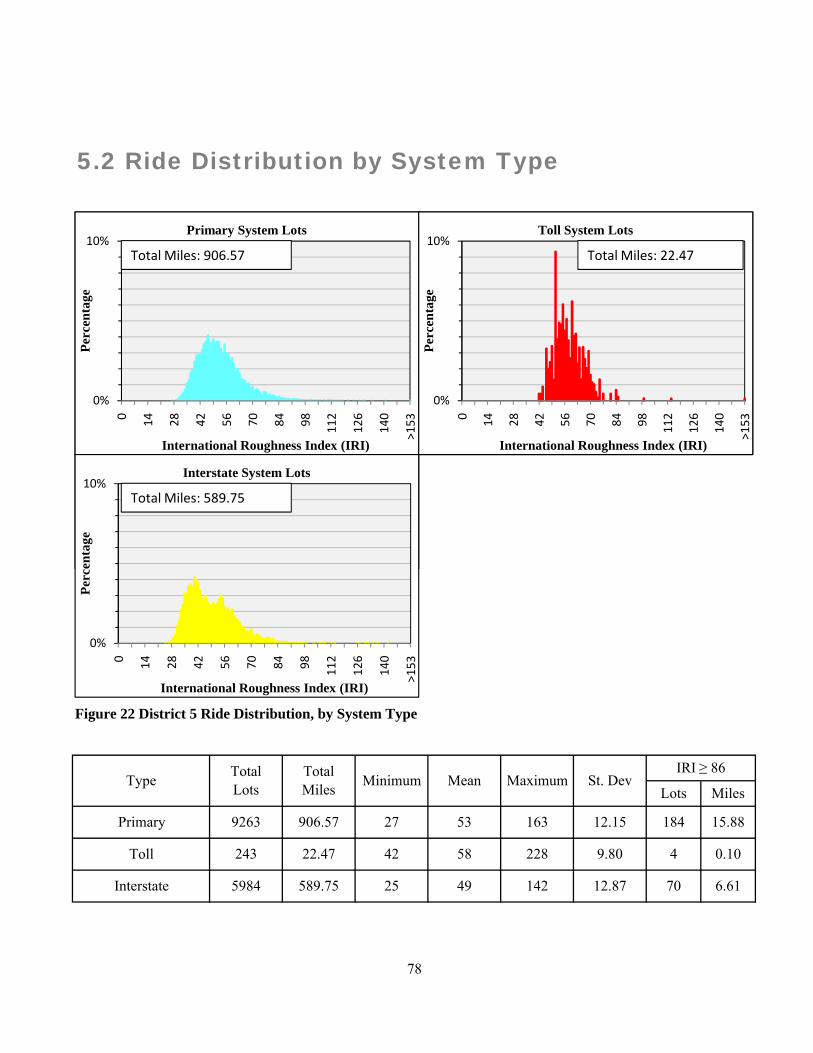
5.2 Ride Distribution by System Type
0%
10%
0 14 28 42 56 70 84 98 112
126
140
>153
Perc
enta
ge
International Roughness Index (IRI)
Primary System Lots
Total Miles: 906.57
0%
10%
0 14 28 42 56 70 84 98 112
126
140
>153
Perc
enta
geInternational Roughness Index (IRI)
Toll System Lots
Total Miles: 22.47
10%
enta
ge
Interstate System Lots
Total Miles: 589.75
243 22.47 42 58 228 9.80 4 0.10
5984 589.75 25 49 142 12.87 70 6.61
Toll
9263Primary
Type TotalLots
TotalMiles
163
Minimum Mean Maximum St. Dev
906.57 27 53
Interstate
12.15 184 15.88
Figure 22 District 5 Ride Distribution, by System Type
IRI ≥ 86
Lots Miles
78
0%
10%
0 14 28 42 56 70 84 98 112
126
140
>153
Perc
enta
ge
International Roughness Index (IRI)
Primary System Lots
Total Miles: 906.57
0%
10%
0 14 28 42 56 70 84 98 112
126
140
>153
Perc
enta
geInternational Roughness Index (IRI)
Toll System Lots
Total Miles: 22.47
0%
10%
0 14 28 42 56 70 84 98 112
126
140
>153
Perc
enta
ge
International Roughness Index (IRI)
Interstate System Lots
Total Miles: 589.75

5.3 Ride Distribution by Friction Course Type
0%
10%
0 14 28 42 56 70 84 98 112
126
140
>153
Perc
enta
ge
International Roughness Index (IRI)
FC5 Lots
Total Miles: 1198.89
0%
10%
0 14 28 42 56 70 84 98 112
126
140
>153
Perc
enta
geInternational Roughness Index (IRI)
FC9.5 Lots
Total Miles: 167.14
10%
cent
age
FC12.5 Lots
Total Miles: 152.76
1697 167.14 27 49 130 12.32 24 2.10
1565 152.76 29 56 127 12.94 43 3.73
Type TotalLots
TotalMiles Minimum
Lots Miles
25 51 228
FC9.5
Figure 23 District 5 Ride Distribution, by Friction Course Type
St. DevIRI ≥ 86
1198.89
MaximumMean
FC5 12228
FC12.5
12.38 191 16.75
79
0%
10%
0 14 28 42 56 70 84 98 112
126
140
>153
Perc
enta
ge
International Roughness Index (IRI)
FC5 Lots
Total Miles: 1198.89
0%
10%
0 14 28 42 56 70 84 98 112
126
140
>153
Perc
enta
geInternational Roughness Index (IRI)
FC9.5 Lots
Total Miles: 167.14
0%
10%
0 14 28 42 56 70 84 98 112
126
140
>153
Perc
enta
ge
International Roughness Index (IRI)
FC12.5 Lots
Total Miles: 152.76

1
1913 185 65 29 53 124 11 55 30 2 61
4358 429.69 25 46 141 10.20 19 1.31
2431 235.98 29 51 124 11.37 30 2.61
1767 173.11 31 55 130 12.65 49 4.50
1714 168.54 35 58 163 11.23 46 4.19
2693 265.59 27 46 141 8.66 12 0.70
TotalMiles Minimum Mean Maximum St. Dev
Table 53 District 5 Statistical Summary for System Type, by Year
3316 324.06 31 58 228 12.52 104 9.55
3405 335.75 28 53 163 12.03 58 5.23
2006
Table 52 District 5 Statistical Summary for Year
14.00193.30 28 50 134
2005 1176
47 3.872005 1980
5.4 District 5 Statistics
113.68 32 57 134 13.43 47 3.87
Prim
ary
2009
Year TotalLots
IRI ≥ 86
2006
2009
Lots Miles
2008
2007
St. DevIRI ≥ 86
Lots MilesYear Total
LotsTotalMiles Minimum Mean Maximum
2007
2008
3
4
1.04
1665 164.10 25 46 108 12.29 7 0.61
518 50.33 31 44 71 6.88 0 0.00
1913 185.65 29 53 124 11.55 30 2.61
243 22.47 42 58 228 9.80 4 0.10
0 0.00 0 0 0 0.00 0 0.00
0 0.00 0 0 0 0.00 0 0.00
0 0.00 0 0 0 0.00 0 0.00
1306 128.49 41 61 142 11.83 51 4.96
1691 167.21 28 49 127 11.13 12
2009
2007
0
2009
2006
0.002005 0
2008
0.00 0 0 0 0.00
2009
80
2006
40 75 6.23 0 0.00
Inte
rsta
te
2005 804 79.62 28
Toll
2007
2008
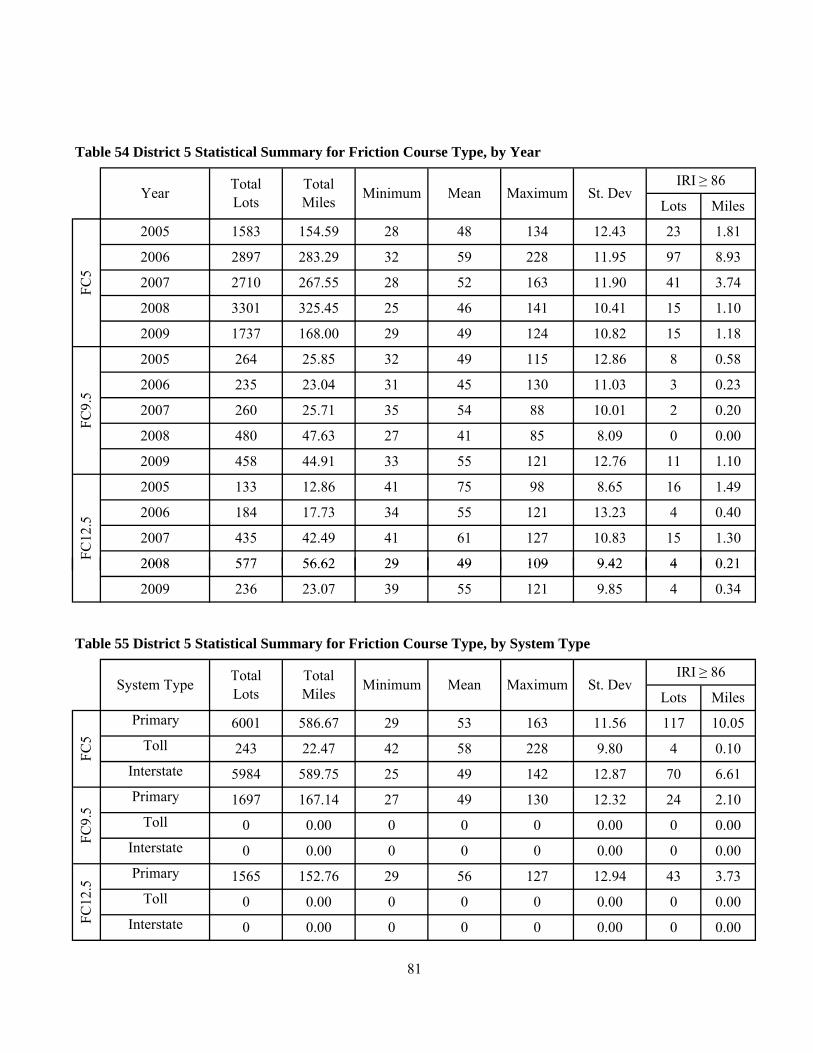
0 21
41 85 8.09 0 0.00
458 44.91 33 55 121 12.76 11 1.10
184 17.73 34 55 121 13.23 4 0.40
435 42.49 41 61 127 10.83 15 1.30
577 56 62 29 49 109 9 42 4
16
2897 283.29 32 59 228 11.95 97 8.93
2710 267.55 28 52 163 11.90 41 3.74
3301 325.45 25 46 141 10.41 15 1.10
1737 168.00 29 49 124 10.82 15 1.18
235 23.04 31 45 130 11.03 3
480 47.63 27
0.23
260 25.71 35 54 88 10.01 2 0.202007
2005
2008
133 12.86 41 75 98 8.65
FC12
.5
Table 54 District 5 Statistical Summary for Friction Course Type, by Year
23 1.81
25.85 32 49 115
2007
2008
1583 154.59 28 48 134 12.43
FC5
2005
2006
2009
FC9.
5
0.58
2007
2009
2006
1.49
2005 264
2006
12.86 8
2008
Maximum St. DevIRI ≥ 86
Lots MilesYear Total
LotsTotalMiles Minimum Mean
1
3
4
1
3
4
1
3
40 0 0.00 0 0.00
0.21
236 23.07 39 55
0 0.00 0 0 0 0.00 0 0.00
0 0.00 0 0 0 0.00 0 0.00
0 0.00 0
243 22.47 42 58 228 9.80 4 0.10
5984 589.75 25 49 142 12.87 70 6.61
0 0.00 0 0 0 0.00 0 0.00
577 56.62 29 49 109 9.42 4
121 9.85 4 0.34
130 12.32 24 2.10
FC9.
5
43 3.73
FC12
.5
Primary 1565 152.76 29 56
53 163 11.56 117 10.05
2008
Lots MilesTotalLots
TotalMiles
49
Table 55 District 5 Statistical Summary for Friction Course Type, by System Type
Primary 1697 167.14 27
12.94
2009
IRI ≥ 86System Type
Toll
Interstate
Toll
Interstate
127
81
Minimum Mean Maximum St. Dev
FC5
Primary 6001 586.67 29Toll
Interstate

L
G
B
L
G
B
L
G
B
18 1.62
340 33.48 31 47 130 11.15 5 0.38
1284 125.66 29 57 127 12.86 39 3.33
Table 57 District 5 Statistical Summary for Friction Course Type, by Binder Type
Granite
8846 867.94 25 52 142 12.20 111 10.00
330.94
0 0.00 0 0 0 0.00 0 0.00
201 19.44 33 51 82 10.24 0 0.00
1258 123.88 27 50 121 12.55
St. DevIRI ≥ 86
Limestone 3382
Miles
TotalMiles
28 50 228 12.69 80 6.75
FC5
Minimum Mean MaximumLots Miles
Table 56 District 5 Statistical Summary for Friction Course Type, by Aggregate Type
Aggregate Type TotalLots
MixedFC9.
5
Limestone
Granite9.84 1 0.10
FC12
.5
Limestone 80 7.65 35
Mixed
Granite
53 121 16.67 4 0.40
11841
LotsMinimumBinder Type Total
LotsTotalMiles Mean Maximum St. Dev
IRI ≥ 86
99 9.78 31
Mixed
1
2
1
2
1
2
0 0.00
1266 123.60 29 56 121 12.39 30 2.44
299 29.16 33 56 127 15.05 13 1.29
1697 167.14 27 49
5702 555.24 28 52 228 12.51 116 9.83
6526 643.64 25 50 142 12.22 75 6.92
130 12.32 24 2.10
0 0.00 0 0 0 0.00
FC5
Asphalt-Rubber
Polymer-Modified
FC9.
5FC
12.5
Polymer-Modified
Asphalt-Rubber
Polymer-Modified
Asphalt-Rubber
82

1
3
1
3
1
3
5889 576.28 29 53 163 11.59 114 9.94
0 0.00 0 0 0 0.00 0 0.00
1697 167.14 27 49 130 12.32 24 2.10
0 0.00 0 0 0 0.00 0 0.00
1565 152.76 29 56 127 12.94 43 3.73
6339 622.61 25 50 228 12.84 77 6.81
FC5
FC9.
5
Limited(Full Control)
Non-Limited(No Control)
Limited(Full Control)
Non-Limited(No Control)
Limited(Full Control)
Non-Limited(No Control)
FC12
.5
Access Type TotalLots
TotalMiles Minimum
Table 58 District 5 Statistical Summary for Friction Course Type, by Access Type
Mean Maximum St. DevIRI ≥ 86
Lots Miles
83
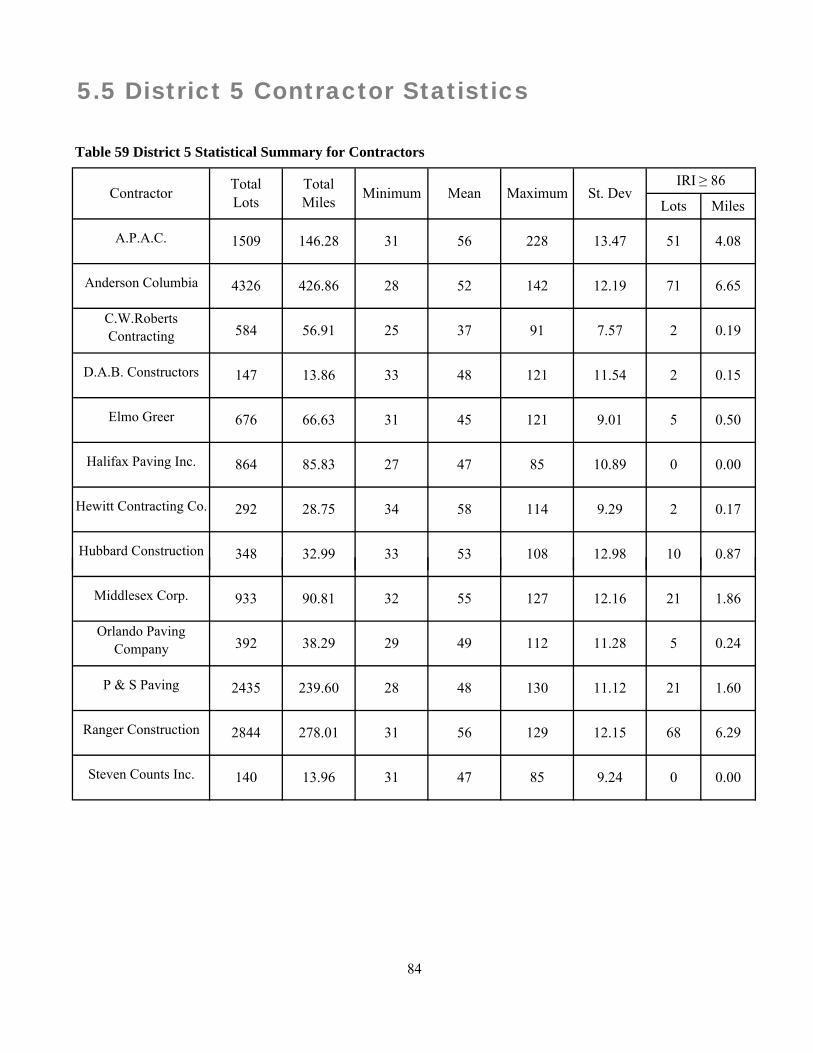
#
1
#
#
#
#
#
864 85.83 27 47 85 10.89 0 0.00
292 28.75 34 58 114 9.29 2 0.17
348 32.99 33 53 108 12.98 10 0.87
1509 146.28 31 56 228 13.47 51 4.08
4326 426.86 28 52 142 12.19 71 6.65
584 56.91 25 37 91 7.57 2 0.19
147 13.86 33 48 121 11.54 2 0.15
676 66.63 31 45 121 9.01 5 0.50
A.P.A.C.
Anderson Columbia
C.W.Roberts Contracting
D.A.B. Constructors
Elmo Greer
Halifax Paving Inc.
Hewitt Contracting Co.
Hubbard Construction
Table 59 District 5 Statistical Summary for Contractors
IRI ≥ 86
Lots MilesTotalLots
TotalMiles Minimum Mean Maximum St. DevContractor
5.5 District 5 Contractor Statistics
3
#
#
#
4
#
2435 239.60 28 48 130 11.12 21 1.60
2844 278.01 31 56 129 12.15 68 6.29
140 13.96 31 47 85 9.24 0 0.00
933 90.81 32 55 127 12.16 21 1.86
392 38.29 29 49 112 11.28 5 0.24
Middlesex Corp.
Orlando Paving Company
P & S Paving
Ranger Construction
Steven Counts Inc.
84
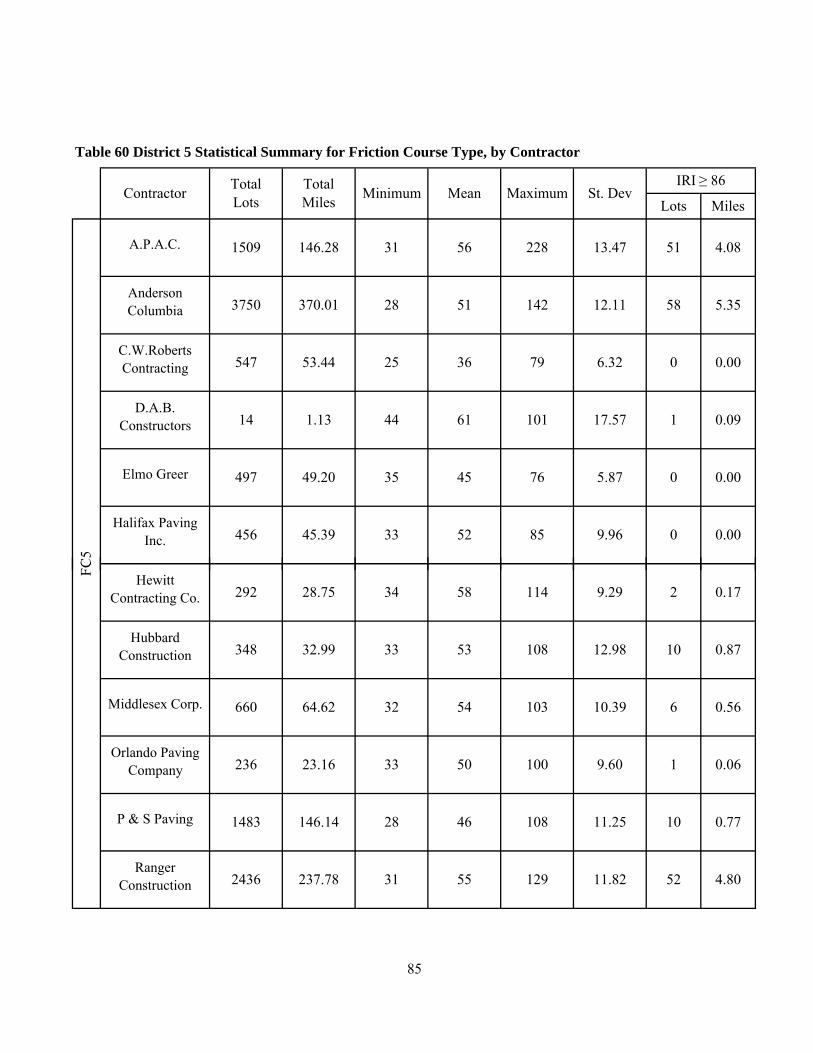
#
1
#
#
#
#
14 1.13 44 61 101 17.57 1 0.09
497 49.20 35 45 76 5.87 0 0.00
456 45.39 33 52 85 9.96 0 0.00
3750 370.01 28 51 142 12.11 58 5.35
547 53.44 25 36 79 6.32 0 0.00
IRI ≥ 86
Table 60 District 5 Statistical Summary for Friction Course Type, by Contractor
Lots MilesContractor Total
LotsTotalMiles
C5
A.P.A.C. 1509 146.28 31 56
Anderson Columbia
228 13.47 51 4.08
C.W.Roberts Contracting
Minimum Mean Maximum St. Dev
D.A.B. Constructors
Elmo Greer
Halifax Paving Inc.
#
#
3
#
#
#
4
660 64.62 32 54 103 10.39 6 0.56
236 23.16 33 50 100 9.60 1 0.06
1483 146.14 28 46 108 11.25 10 0.77
2436 237.78 31 55 129 11.82 52 4.80
292 28.75 34 58 114 9.29 2 0.17
348 32.99 33 53 108 12.98 10 0.87
85
FC
Middlesex Corp.
Hewitt Contracting Co.
Hubbard Construction
Orlando Paving Company
P & S Paving
Ranger Construction
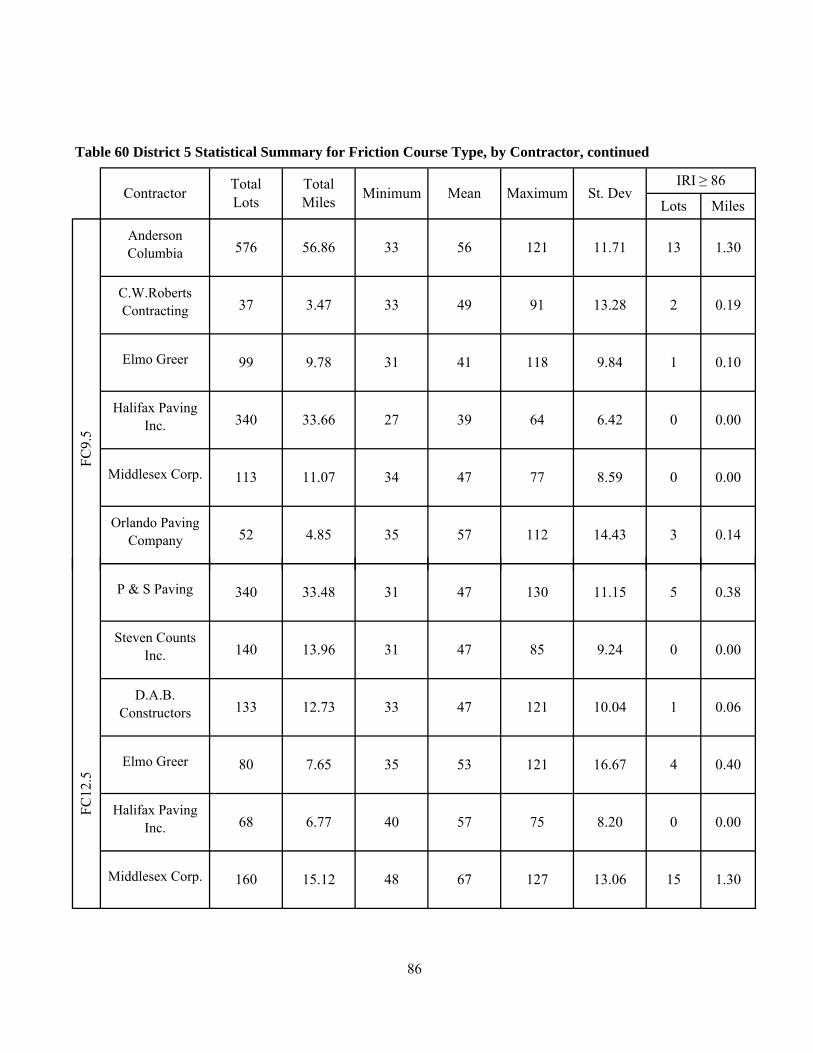
1
#
#
#
#
#
99 9.78 31 41 118 9.84 1 0.10
340 33.66 27 39 64 6.42 0 0.00
113 11.07 34 47 77 8.59 0 0.00
52 4.85 35 57 112 14.43 3 0.14
37 3.47 33 49 91 13.28 2 0.19
Table 60 District 5 Statistical Summary for Friction Course Type, by Contractor, continued
Contractor TotalLots
TotalMiles
56.86 33 56 121 11.71 13
FC9.
5
Anderson Columbia 576
Elmo Greer
Middlesex Corp.
Minimum Mean Maximum St. DevIRI ≥ 86
Lots Miles
1.30
Orlando Paving Company
C.W.Roberts Contracting
Halifax Paving Inc.
#
#
#
#
#
#
#
140 13.96 31 47 85 9.24 0 0.00
80 7.65 35 53 121 16.67 4 0.40
68 6.77 40 57 75 8.20 0 0.00
160 15.12 48 67 127 13.06 15 1.30
340 33.48 31 47 130 11.15 5 0.38P & S Paving
D.A.B. Constructors 133 12.73 33 47 121
FC12
.5
10.04 1 0.06
Halifax Paving Inc.
86
Steven Counts Inc.
Middlesex Corp.
Elmo Greer
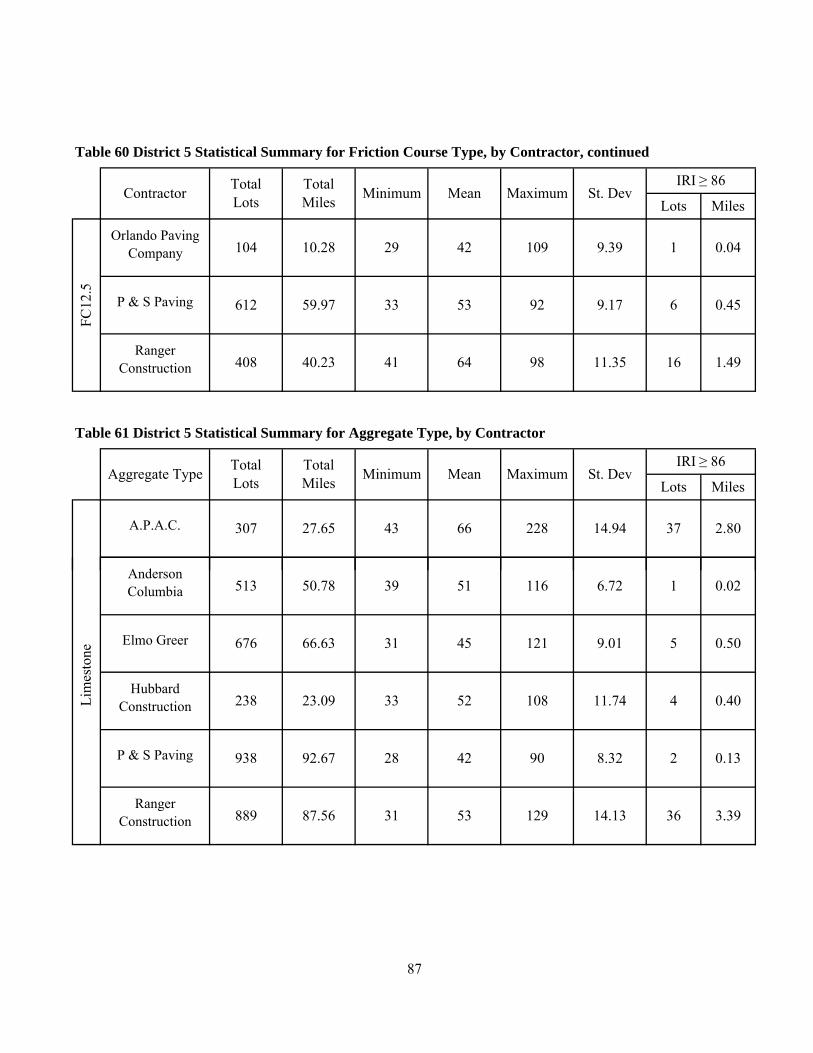
#
#
4
L
#
612 59.97 33 53 92 9.17 6 0.45
408 40.23 41 64 98 11.35 16 1.49
104 10.28 29 42 109 9.39 1 0.04
Table 60 District 5 Statistical Summary for Friction Course Type, by Contractor, continued
Contractor TotalLots
TotalMiles Minimum Mean Maximum St. Dev
IRI ≥ 86
Lots Miles
Aggregate Type TotalLots
TotalMiles
FC12
.5
Orlando Paving Company
P & S Paving
Ranger Construction
Table 61 District 5 Statistical Summary for Aggregate Type, by Contractor
43 66 228 14.94
Lots MilesMinimum Mean Maximum St. Dev
IRI ≥ 86
37 2.80A.P.A.C. 307 27.65
1
#
3
#
4
938 92.67 28 42 90 8.32 2 0.13
889 87.56 31 53 129 14.13 36 3.39
513 50.78 39 51 116 6.72 1 0.02
676 66.63 31 45 121 9.01 5 0.50
238 23.09 33 52 108 11.74 4 0.40
Anderson Columbia
Elmo Greer
Lim
esto
ne
Hubbard Construction
P & S Paving
Ranger Construction
87
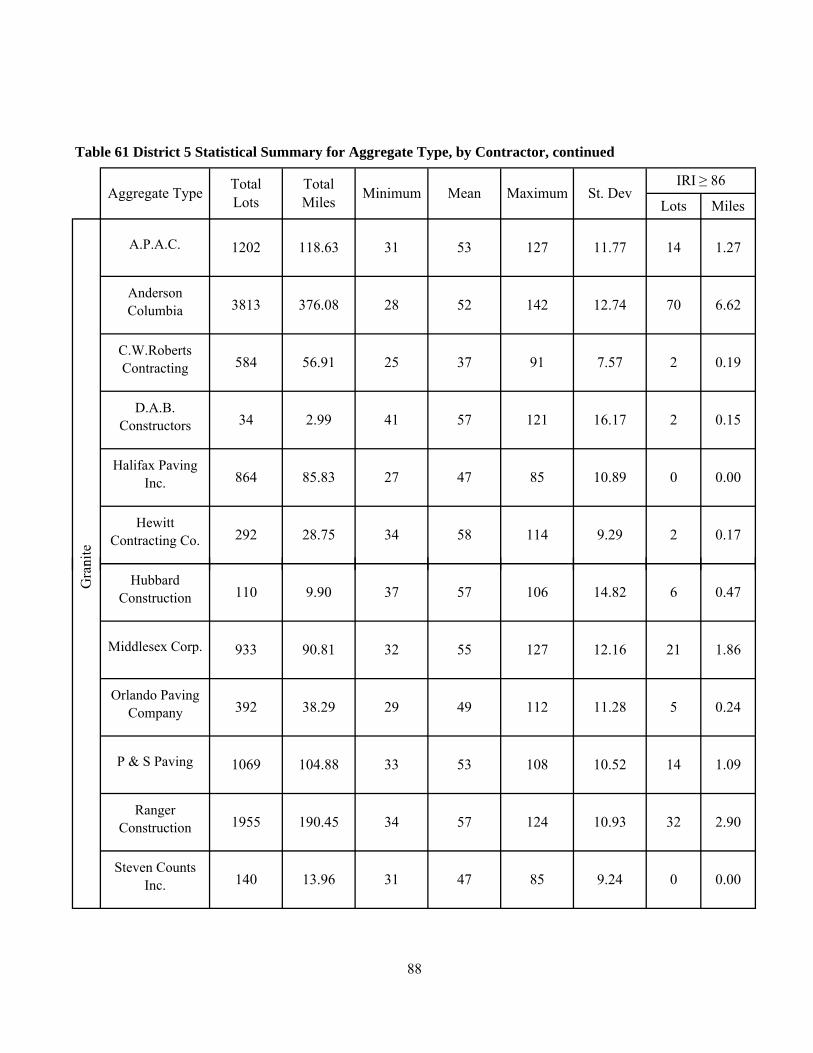
G
#
1
#
#
#
#
864 85.83 27 47 85 10.89 0 0.00
292 28.75 34 58 114 9.29 2 0.17
3813 376.08 28 52 142 12.74 70 6.62
584 56.91 25 37 91 7.57 2 0.19
34 2.99 41 57 121 16.17 2 0.15
nite
C.W.Roberts Contracting
D.A.B. Constructors
A.P.A.C. 1202 118.63 31 53 127
Anderson Columbia
11.77 14 1.27
Table 61 District 5 Statistical Summary for Aggregate Type, by Contractor, continued
Aggregate Type TotalLots
Hewitt Contracting Co.
Halifax Paving Inc.
Lots MilesTotalMiles Minimum Mean Maximum St. Dev
IRI ≥ 86
#
3
#
#
#
4
#
140 13.96 31 47 85 9.24 0 0.00
32 55 127 12.16 21 1.86
392 38.29 29 49 112 11.28 5 0.24
1069 104.88 33 53 108 10.52 14 1.09
1955 190.45 34 57 124 10.93 32 2.90
110 9.90 37 57 106 14.82 6 0.47
933 90.81
Gra
n
Orlando Paving Company
Steven Counts Inc.
P & S Paving
Middlesex Corp.
Hubbard Construction
Ranger Construction
88
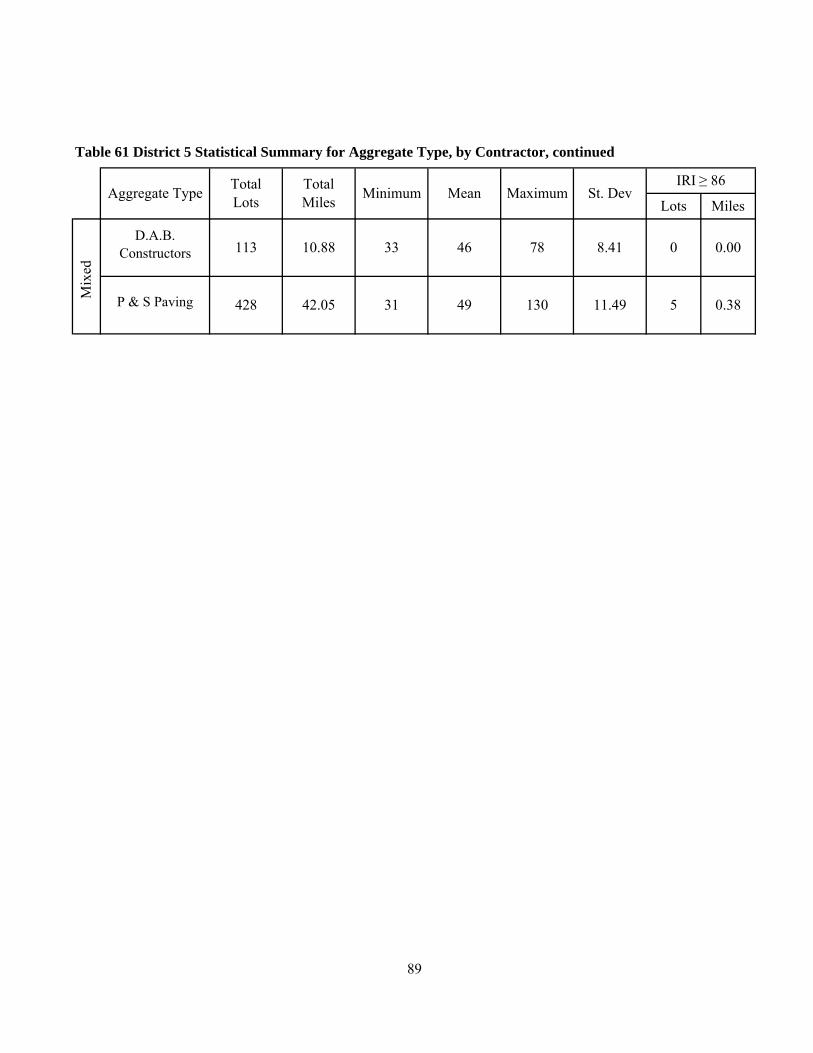
B
#
#
428 42.05 31 49 130 11.49 5 0.38
Mean Maximum St. Dev
Table 61 District 5 Statistical Summary for Aggregate Type, by Contractor, continued
Mix
ed
D.A.B. Constructors 113 10.88
Minimum
33 46 78 8.41
P & S Paving
0 0.00
IRI ≥ 86
Lots MilesAggregate Type Total
LotsTotalMiles
89

PAGE
LEFT BLANK
90
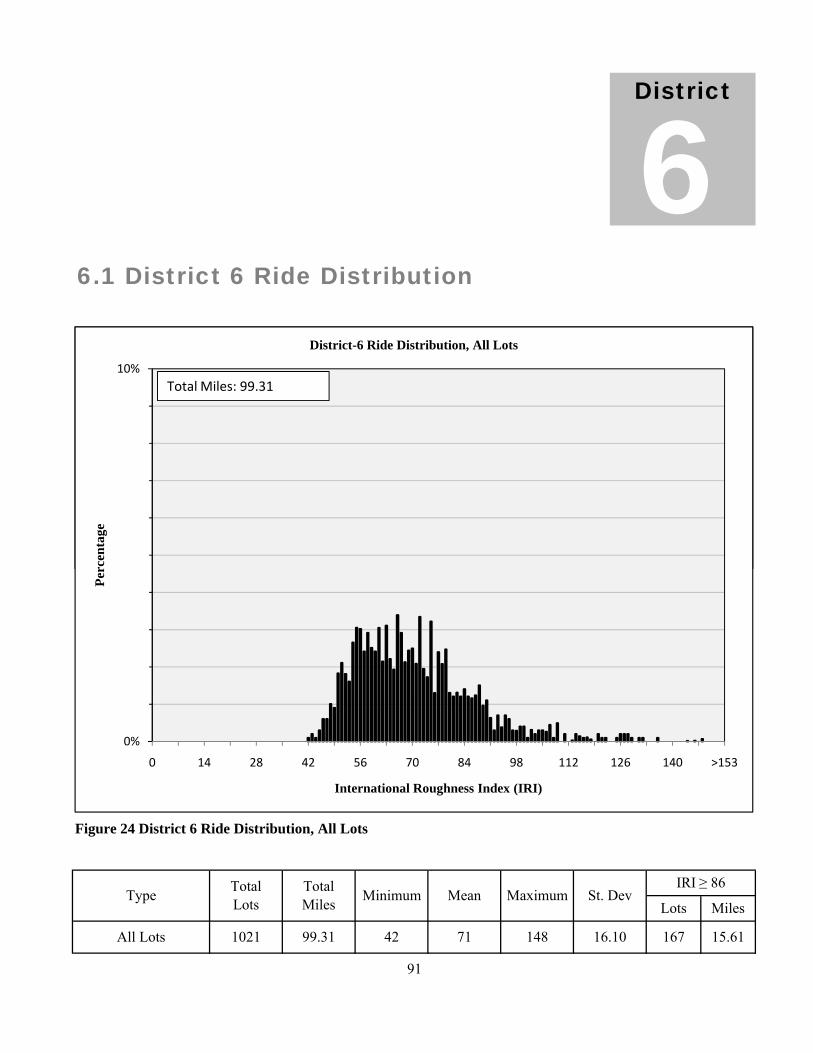
6District
6.1 District 6 Ride Distribution
10%
rcen
tage
District-6 Ride Distribution, All Lots
Total Miles: 99.31
Lots Miles
Figure 24 District 6 Ride Distribution, All Lots
St. DevType TotalLots
TotalMiles Minimum
IRI ≥ 86
16.10 167 15.61All Lots 1021 99.31 42 71 148
Mean Maximum
91
0%
10%
0 14 28 42 56 70 84 98 112 126 140 >153
Perc
enta
ge
International Roughness Index (IRI)
District-6 Ride Distribution, All Lots
Total Miles: 99.31

6.2 Ride Distribution by System Type
0%
10%
0 14 28 42 56 70 84 98 112
126
140
>153
Perc
enta
ge
International Roughness Index (IRI)
Primary System Lots
Total Miles: 42.14
0%
10%
0 14 28 42 56 70 84 98 112
126
140
>153
Perc
enta
geInternational Roughness Index (IRI)
Interstate System Lots
Total Miles: 57.17
Figure 25 District 6 Ride Distribution, by System Type
Type TotalLots
TotalMiles Minimum Mean
431 42.14
Lots Miles
Primary 16.43 109
St. DevIRI ≥ 86
10.3150 78 148
Interstate
92
Maximum
590 57.17 42 65 121 13.41 58 5.30
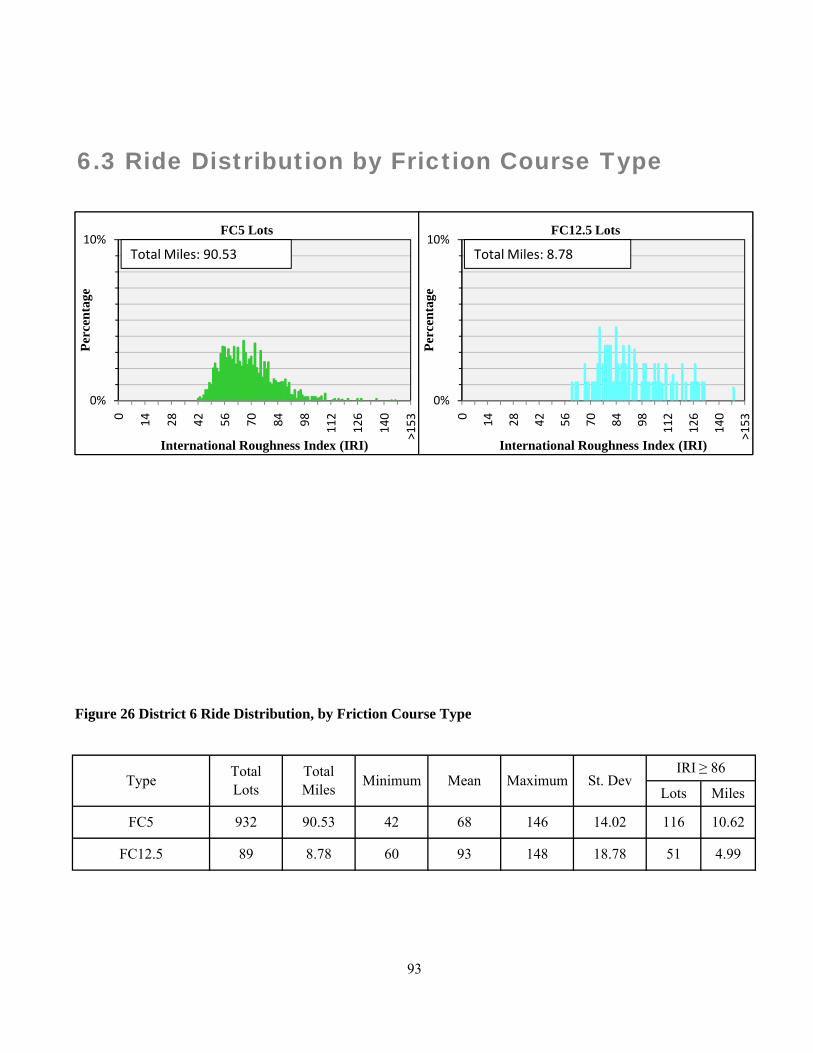
6.3 Ride Distribution by Friction Course Type
0%
10%
0 14 28 42 56 70 84 98 112
126
140
>153
Perc
enta
ge
International Roughness Index (IRI)
FC5 Lots
Total Miles: 90.53
0%
10%
0 14 28 42 56 70 84 98 112
126
140
>153
Perc
enta
geInternational Roughness Index (IRI)
FC12.5 Lots
Total Miles: 8.78
FC12.5
Maximum St. Dev
Figure 26 District 6 Ride Distribution, by Friction Course Type
IRI ≥ 86Type Total
LotsTotalMiles Minimum Mean
14.02 116 10.62FC5 932 90.53 42 68 146
Lots Miles
93
89 8.78 60 93 148 18.78 51 4.99
0%
10%
0 14 28 42 56 70 84 98 112
126
140
>153
Perc
enta
ge
International Roughness Index (IRI)
FC5 Lots
Total Miles: 90.53
0%
10%
0 14 28 42 56 70 84 98 112
126
140
>153
Perc
enta
geInternational Roughness Index (IRI)
FC12.5 Lots
Total Miles: 8.78

1
20.79 52 82 148 18.57 70 6.73
144 13 92 55 79 144
TotalMiles
0
Table 62 District 6 Statistical Summary for Year
6.4 District 6 Statistics
2007
2008
0 0.00 0 0.002005 0
Minimum Mean Maximum St. DevIRI ≥ 86
Lots MilesYear Total
Lots
2006
Prim
ary
Table 63 District 6 Statistical Summary for System Type, by Year
2008
2009
0.00 0 0
Year TotalLots
TotalMiles Minimum Mean Maximum St. Dev
IRI ≥ 86
Lots Miles
0.00 0 0.002005 0 0.00 0 0 0
2007
2006
2009 12 18 36 3 38
0 0.00
76 7.43
69 144 14.34 45 4.19
0.00 0 0 0
0 0.00 0 0 0 0.00 0 0.00
247 23.52 47 74 121 13.01 48 4.34
417 40.89 43 70 148 18.65 74 7.08
357 34.91 42
102 8.41 3 0.21
211
0.00
50 65
4144 13.92 55 79 144
2006
0.000 0.00 0 0 0 0.002005
2009
2008
2007
94
2009
Inte
rsta
te
0
0.00 0 0.00
12.18 36 3.38
171 16.09 47 78 121 12.76 45 4.13
206 20.10 43 59 94 8.86 4 0.35
213
0 0.00 0 0 0
20.99 42 61 117 10.87 9 0.81

51 4.99
0 0 0 0.00 0 0.00
0 0.00
2008
2007
0.00 0 0 0 0.00 0
FC5
2005 0
0.00
Table 64 District 6 Statistical Summary for Friction Course Type, by Year
Year MinimumTotalLots
TotalMiles
2006
Lots
2009
2006
0
Miles
0.00
Mean Maximum
2008
2007
FC12
.5
2005 0 0.00
System TypeL Mil
2009
23.52 47 74 121 13.01 48
TotalLots
TotalMiles Minimum Mean Maximum
St. DevIRI ≥ 86
St. DevIRI ≥ 86
0
Table 65 District 6 Statistical Summary for Friction Course Type, by System Type
357 34.91
0 0.00
0 0.00
89 8.78
0 0.00
328
148 18.78
32.10 43
42
0
0
60
0
64 146 13.07 23 2.10
69 144 14.34 45 4.19
0 0 0.00
0 0.00 0 0 0 0.00 0 0.00
247
0 0.00
0 0 0.00 0 0.00
93
4.34
1
4
1
4
58 5.30
0 0.00 0 0 0 0.00 0 0.00
5.33
FC5 Primary 342 33.36 50 74 146 13.19 58
y ypLots Miles
Interstate
Lots Miles
FC12
.5 Primary 89 148 18.78 51 4.998.78 60 93
95
Interstate 590 57.17 42 65 121 13.41
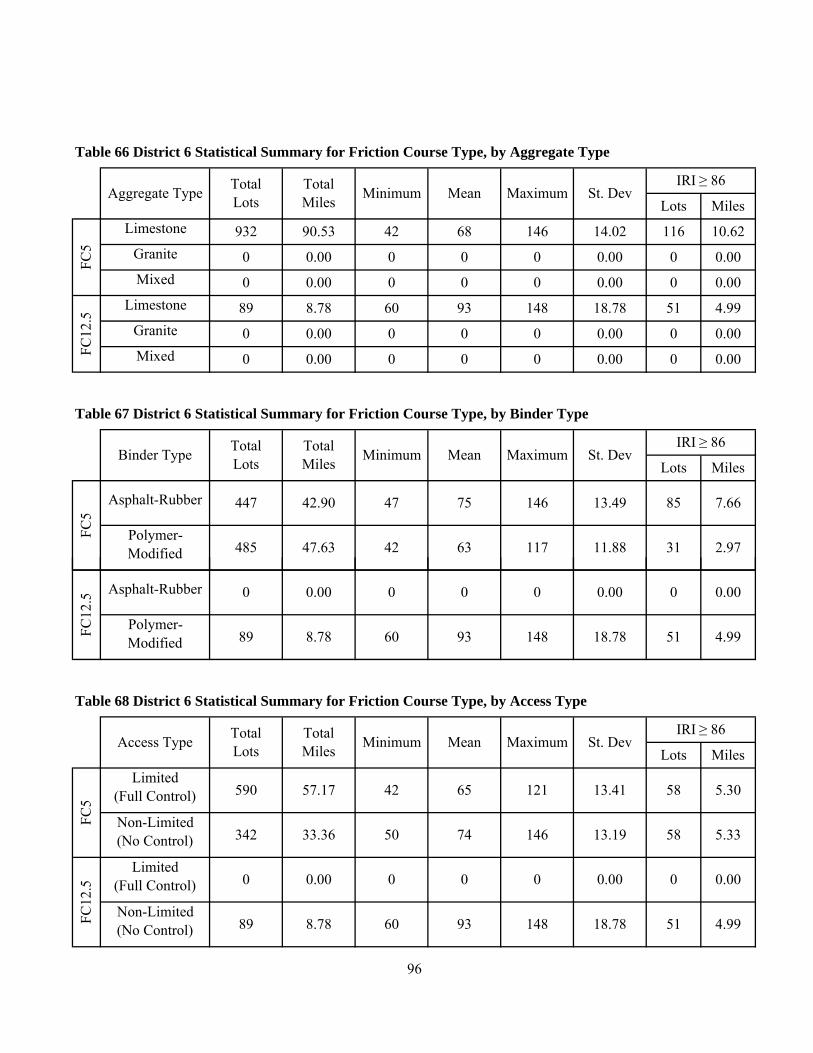
L
G
B
L
G
B
1
2
68 146 14.02
0 0 0.00 0 0.00
447 42.90 47
FC5
Asphalt-Rubber
Polymer-Modified
FC12
.5
Aggregate Type
0
TotalLots
Table 66 District 6 Statistical Summary for Friction Course Type, by Aggregate Type
4.99
TotalMiles Minimum
Granite
Minimum Mean
Limestone 89 8.78 60 93 148
0 0.00
Mean Maximum St. DevIRI ≥ 86
Lots MilesLimestone
Mixed
Table 67 District 6 Statistical Summary for Friction Course Type, by Binder Type
Maximum
FC5
116 10.62
0 0.00
932
Mixed
4290.53
Granite
IRI ≥ 86St. Dev
Lots MilesBinder Type
0 0.00 0 0.00
18.78 51
0 0.00 0 0 0 0.00 0 0.00
0 0 0 0.00 0 0.00
0 0.00 0 0
75 146 13.49 85 7.66
485 47.63 42 63 117 11.88 31 2.97
TotalLots
TotalMiles
2
1
2
1
3
1
3
Table 68 District 6 Statistical Summary for Friction Course Type, by Access Type
St. DevIRI ≥ 86
Lots MilesAccess Type Total
LotsTotalMiles Minimum Mean Maximum
FC12
.5
Asphalt-Rubber
Polymer-Modified
FC5
0.00
60 93 148 18.78 51 4.99FC12
.5
Limited(Full Control)
Non-Limited(No Control)
Limited(Full Control)
Non-Limited(No Control)
65 121 13.41 58 5.30
50 74 146 13.19 58 5.33
0 0 0 0.00 0
96
42590 57.17
342 33.36
0 0.00
89 8.78
0 0.00
89 8.78 60 93 148 18.78 51 4.99
0 0 0 0.00 0 0.00

#
#
#
#
4
6.5 District 6 Contractor Statistics
Table 69 District 6 Statistical Summary for Contractors
Lots MilesContractor Total
Lots Maximum St. DevIRI ≥ 86
Minimum MeanTotalMiles
IRI ≥ 86
Table 70 District 6 Statistical Summary for Friction Course Type, by Contractor
St. DevMaximum
Ranger Construction
Lots MilesContractor Total
LotsTotalMiles Minimum Mean
47 78 121 12.76 45 4.13
8.79 58 80 144 12.97 26
A.P.A.C.
The Asphalt Group
Community Asphalt Corp.
General Asphalt Company
90
171 16.09
2.45
108 10.61 52 71 146 11.56 11 0.94
144 13.96 50 72 116 13.27 21 1.94
508 49.87 42 66 148 17.34 64 6.15
#
#
#
#
4
4
10.61 52 71 146 11.56 11Community
Asphalt Corp. 108 0.94
116
148 18.78 51 4.99
FC12
.5 Ranger Construction 89
72 13.27
58 26 2.458.79 80 144 12.97
97
12.76
The Asphalt Group
A.P.A.C. 16.09 47 78 121
General Asphalt Company
171
90
FC5
4.13
21144 13.96 50
8.78 60 93
10.03 13 1.17Ranger
Construction
45
1.94
419 41.08 42 60 117

L
#
#
#
#
4
MilesAggregate Type Total
LotsTotalMiles
Table 71 District 6 Statistical Summary for Aggregate Type, by Contractor
Lim
esto
ne
A.P.A.C.
Ranger Construction
Minimum Mean Maximum
Community Asphalt Corp.
General Asphalt Company
The Asphalt Group
St. DevIRI ≥ 86
Lots
14490 8.79 58 80 12.97 26 2.45
108 10.61 52 71 146 11.56 11 0.94
144 13.96 50 72 116 13.27 21
16.09171 47 78 121 12.76 45 4.13
1.94
508 49.87 42 66 148 17.34 64 6.15
98

77.1 District 7 Ride Distribution
District
10%
rcen
tage
District-7 Ride Distribution, All Lots
Total Miles: 426.71
TotalMiles Minimum Mean Maximum St. Dev
IRI ≥ 86
MilesType Total
Lots
Figure 27 District 7 Ride Distribution, All Lots
27 53 269 11.06 63 5.05All Lots 4395 426.71
Lots
99
0%
10%
0 14 28 42 56 70 84 98 112 126 140 >153
Perc
enta
ge
International Roughness Index (IRI)
District-7 Ride Distribution, All Lots
Total Miles: 426.71

7.2 Ride Distribution by System Type
0%
10%
0 14 28 42 56 70 84 98 112
126
140
>153
Perc
enta
ge
International Roughness Index (IRI)
Primary System Lots
Total Miles: 269.81
0%
10%
0 14 28 42 56 70 84 98 112
126
140
>153
Perc
enta
geInternational Roughness Index (IRI)
Interstate System Lots
Total Miles: 156.90
Figure 28 District 7 Ride Distribution, by System Type
Mean Maximum St. DevIRI ≥ 86
Lots MilesType Total
LotsTotalMiles Minimum
11.89 55 4.48Primary 2766 269.81 27 54 269
100
Interstate 33 52 100 9.22 8 0.571629 156.90

7.3 Ride Distribution by Friction Course Type
0%
10%
0 14 28 42 56 70 84 98 112
126
140
>153
Perc
enta
ge
International Roughness Index (IRI)
FC5 Lots
Total Miles: 334.23
0%
10%
0 14 28 42 56 70 84 98 112
126
140
>153
Perc
enta
geInternational Roughness Index (IRI)
FC9.5 Lots
Total Miles: 46.85
10%
cent
age
FC12.5 Lots
Total Miles: 45.63
FC9.5
FC12.5
Figure 29 District 7 Ride Distribution, by Friction Course Type
Type TotalLots
TotalMiles Minimum Mean
Lots Miles
27 53 269 10.74 42 3.29FC5 3448 334.23
Maximum St. DevIRI ≥ 86
101
477 46.85 27 48 100 11.31 8 0.67
470 45.63 35 58 117 10.64 13 1.08
0%
10%
0 14 28 42 56 70 84 98 112
126
140
>153
Perc
enta
ge
International Roughness Index (IRI)
FC5 Lots
Total Miles: 334.23
0%
10%
0 14 28 42 56 70 84 98 112
126
140
>153
Perc
enta
geInternational Roughness Index (IRI)
FC9.5 Lots
Total Miles: 46.85
0%
10%
0 14 28 42 56 70 84 98 112
126
140
>153
Perc
enta
ge
International Roughness Index (IRI)
FC12.5 Lots
Total Miles: 45.63

1
Year
0
7.4 District 7 Statistics
MaximumLots Miles
Year St. DevIRI ≥ 86
Table 72 District 7 Statistical Summary for Year
TotalLots
TotalMiles
2006
0.0335.90 36 51 100 8.08 12005 378
2007
2008
Prim
ary
Table 73 District 7 Statistical Summary for System Type, by Year
TotalLots
TotalMiles Minimum Mean
2009
Maximum St. DevIRI ≥ 86
Lots Miles
2008
0 0 0.00 0 0.002005 0 0.00
2006
2009
2007
561 54.41 35 58 269 14.05 33 2.79
212 20.73 38 53 98 8.75 4 0.31
1233 121.27 27 54 103 10.50 7 0.66
MeanMinimum
760 73 39 27 52 164 12 34 11 0 72
1072 105.02 33 55 269 12.77 35 2.99
307 29.42 38 55 98 9.45 7 0.52
1357 133.21 27 54 103 10.28 8 0.76
1281 123.16 27 52 164 11.10 12 0.75
4 378 35.90 36
Inte
rsta
te 2006
2009
2007
2008
102
51 100 8.08 1 0.03
2009
2005
95 8.69
511 50.61 33 50 90 9.66 2 0.20
760 73.39 27 52 164 12.34 11 0.72
42 58 93 10.14 3 0.21
124 0.10
521 49.77 33 51 90 8.87 1 0.03
11.93 45 57 91 7.29 1
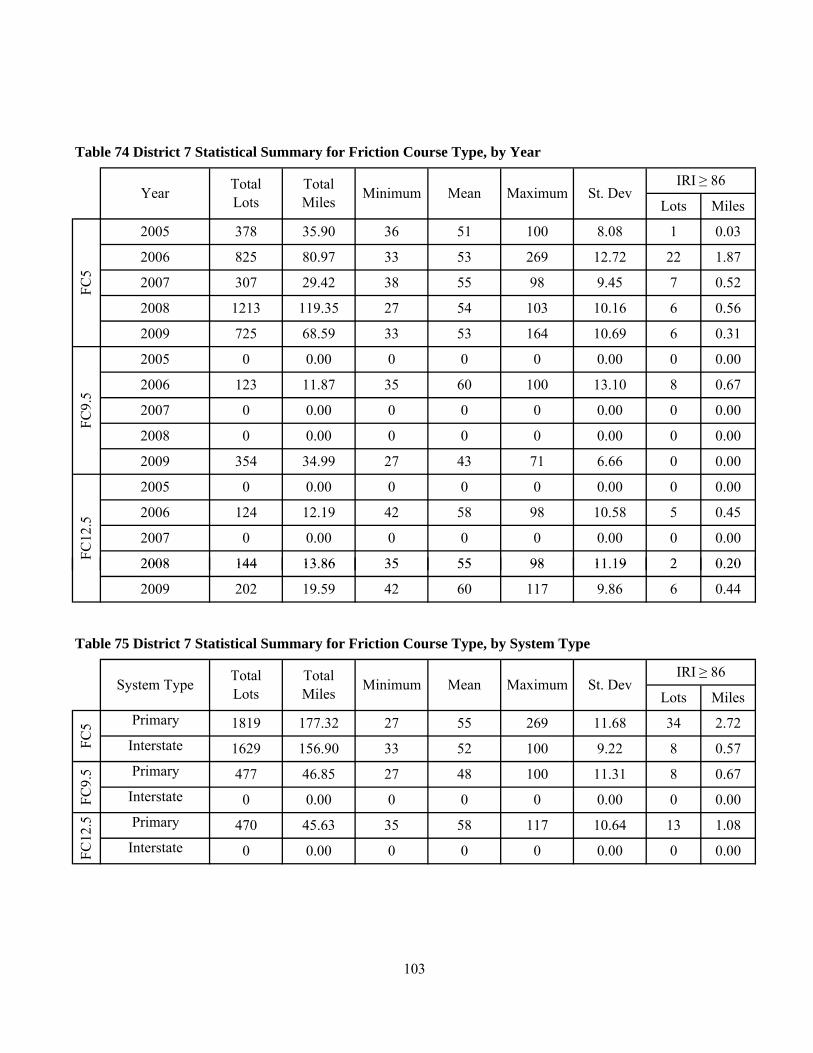
2005
FC9.
5
378 35.90 36
2007
2006
2008
0 0.00 0 0 0 0.00
IRI ≥ 86
51 100 8.08 1 0.03
FC5
2005
2009
Lots MilesTotalLots
TotalMiles Minimum Mean Maximum St. Dev
2007
2008
2008
Year
0.00 0 0.002005 0 0.00 0 0 0
FC12
.5
2007
2006
2006
2009
0 0.00
825 80.97 33 53 269 12.72 22 1.87
307 29.42 38 55 98 9.45 7 0.52
1213 119.35 27 54 103 10.16 6 0.56
Table 74 District 7 Statistical Summary for Friction Course Type, by Year
725 68.59 33 53 164 10.69 6 0.31
123 11.87 35 60 100 13.10 8 0.67
0 0.00 0 0 0 0.00 0 0.00
0 0.00 0 0 0 0.00 0 0.00
354 34.99 27 43 71 6.66 0 0.00
124 12.19 42 58 98 10.58 5 0.45
0 0.00 0 0 0 0.00 0 0.00
144 13 86 35 55 98 11 19 2 0 20
1
4
1
4
1
4
100 9.22 8
0 0.00 0 0 0 0.00 0
0 0.00 0 0 0 0.00 0
33 52Interstate
FC9.
5
Lots Miles
55
2008
Table 75 District 7 Statistical Summary for Friction Course Type, by System Type
TotalLots
TotalMiles Minimum Mean
27 269 11.68 34 2.72
Maximum St. DevIRI ≥ 86
System Type
FC5 Primary 1819 177.32
InterstateFC12
.5
27 48 100 11.31 8 0.67
10.64 13 1.0858 117
103
Primary 470
2009
1629 156.90 0.57
0.00
0.00
Interstate
144 13.86 35 55 98 11.19 2 0.20
202 19.59 42 60 117 9.86 6 0.44
45.63 35
Primary 477 46.85

L
G
B
L
G
B
L
G
B
Minimum Mean Maximum St. DevAggregate Type
FC5
Table 76 District 7 Statistical Summary for Friction Course Type, by Aggregate Type
MilesTotalLots Lots
TotalMiles
IRI ≥ 86
FC9.
5
123Granite
104 9.99Granite
Mixed
0.67
Mixed
0.00 0 0 0 0.00 0 0.00
Limestone
Mixed
FC12
.5
Limestone 0Granite
Lots MilesBinder Type
Limestone
Table 77 District 7 Statistical Summary for Friction Course Type, by Binder Type
Total Lots TotalMiles Minimum Mean Maximum St. Dev
IRI ≥ 86
114 10.77
354 34.99
3230 313.47 27 53 269 10.83 40 3.15
37 56 95 9.70 1 0.04
118 11.61 42 56 117 9.32 4 0.31
11.87 35 60 100 13.10 8
45 56 91 7.48 1 0.10
27 43 71 6.66 0 0.00
0 0.00 0 0 0 0.00 0 0.00
352 34.02 35 59 98 10.99 9 0.77
1
2
1
2
1
2
FC5
FC9.
5FC
12.5
Asphalt-Rubber
Polymer-Modified
Asphalt-Rubber
Polymer-Modified
Asphalt-Rubber
Polymer-Modified
104
1667 162.39 269 11.11 26 2.11
1781 171.84 33 53 164 10.35 16 1.19
477 46.85 27 48 100 11.31 8 0.67
27 54
0 0.00 0 0 0 0.00 0 0.00
208 20.16 42 61 98 10.25 7 0.57
262 25.47 35 56 117 10.38 6 0.51

1
3
1
3
1
3
FC5
FC9.
5FC
12.5
Limited(Full Control)
Non-Limited(No Control)
Limited(Full Control)
Non-Limited(No Control)
Limited(Full Control)
Non-Limited(No Control)
Table 78 District 7 Statistical Summary for Friction Course Type, by Access Type
Minimum Mean Maximum St. DevIRI ≥ 86
Lots MilesAccess Type Total
LotsTotalMiles
1629 156.90 33 52 100 9.22
117 10.64 13 1.08
0 0.00 0 0 0 0.00 0 0.00
477 46.85 27 48 100 11.31 8 0.67
0 0.00 0 0 0 0.00 0 0.00
470 45.63 35 58
8 0.57
1819 177.32 27 55 269 11.68 34 2.72
105
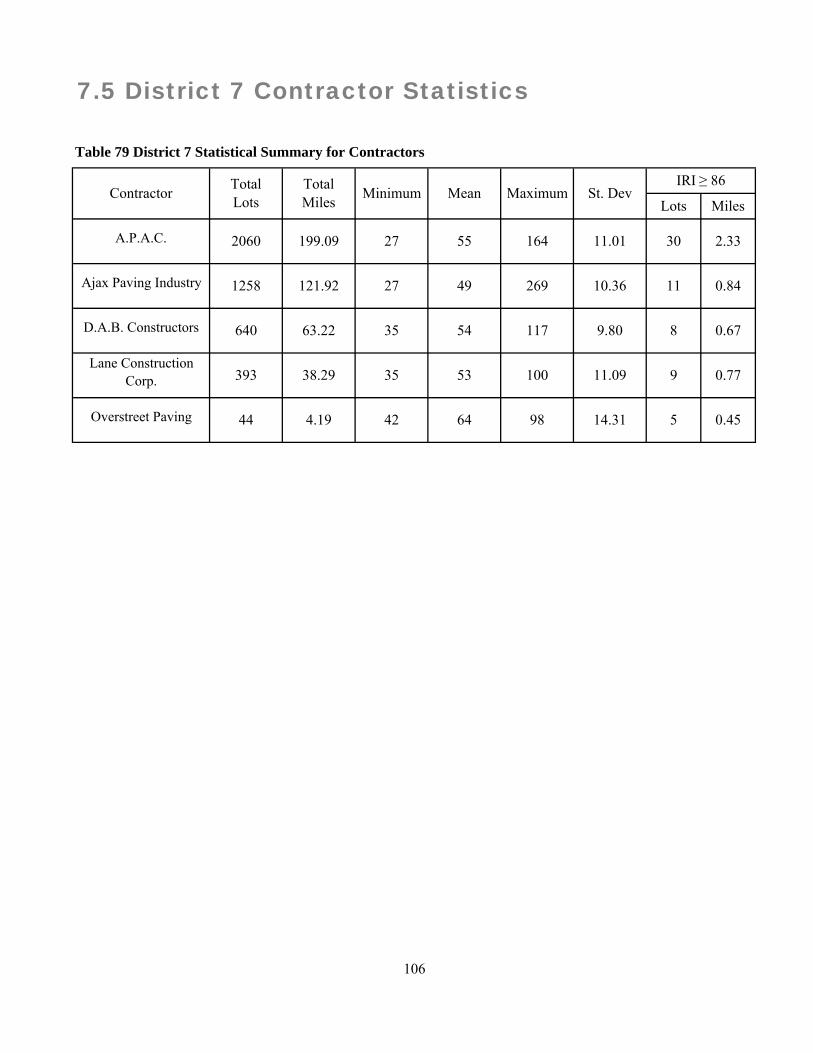
#
#
#
#
#
A.P.A.C.
Ajax Paving Industry
D.A.B. Constructors
Lane Construction Corp.
Overstreet Paving
7.5 District 7 Contractor Statistics
Table 79 District 7 Statistical Summary for Contractors
St. DevIRI ≥ 86
Lots MilesContractor Total
LotsTotalMiles Minimum Mean Maximum
44 4.19
393 38.29 35 53 100 11.09 9 0.77
2060 199.09 27 55 164 11.01 30 2.33
42 64 98 14.31 5 0.45
1258 121.92 27 49 269 10.36 11 0.84
640 63.22 35 54 117 9.80 8 0.67
106

#
#
#
#
#
#
Lane Construction Corp. 289 8 0.6728.30 35 51 100
Table 80 District 7 Statistical Summary for Friction Course Type, by Contractor
101 9.82 4
9 0.64Ajax Paving
Industry 926 89.52 33
Maximum St. DevIRI ≥ 86
Lots MilesTotalMiles Minimum Mean
55 164 11.10 28 2.20
0.109.99 45 56 91 7.48 1
D.A.B. Constructors 522 51.60 35 53
0.0018.55 27 42 64 7.15 0
FC9.
5
Ajax Paving Industry 188
FC5
A.P.A.C. 1896 183.12 27
Contractor TotalLots
269 9.90
0.36
Lane Construction Corp. 104
50
11.85
#
#
#
#
#
13.86
Overstreet Paving 44 4.19 42
A.P.A.C. 164 15.97
Ajax Paving Industry
2 0.13
FC12
.5
2 0.20
4 0.31118 11.61 42 56 117 9.32D.A.B.
Constructors
64 98 14.31 5 0.45
55 9835
8.6745 60 89
107
11.19144

L
#
G
#
#
#
#
Maximum St. DevIRI ≥ 86
27 55
11.03 9 0.77
53
Minimum Mean
Lim
esto
ne Lane Construction Corp. 227
35
A.P.A.C. 1946
21.85 35 58 100
45 71 5.43 0
164 11.08 29 2.29
Table 81 District 7 Statistical Summary for Aggregate Type, by Contractor
Gra
nite
11 0.84
D.A.B. Constructors 522 51.60
Ajax Paving Industry 1258 121.92 27 49 269 10.36
101
0.00
9.82 4 0.36
Lane Construction Corp. 166 16.44 36
42 64 98 14.31 5 0.45Overstreet Paving 44 4.19
Lots Miles
188.32
Aggregate Type TotalLots
TotalMiles
#B
#
#
A.P.A.C. 114 10.77 37 56
D.A.B. Constructors 118 11.61 42 56 117
108
4 0.319.32
95 9.70 1 0.04
Mix
ed
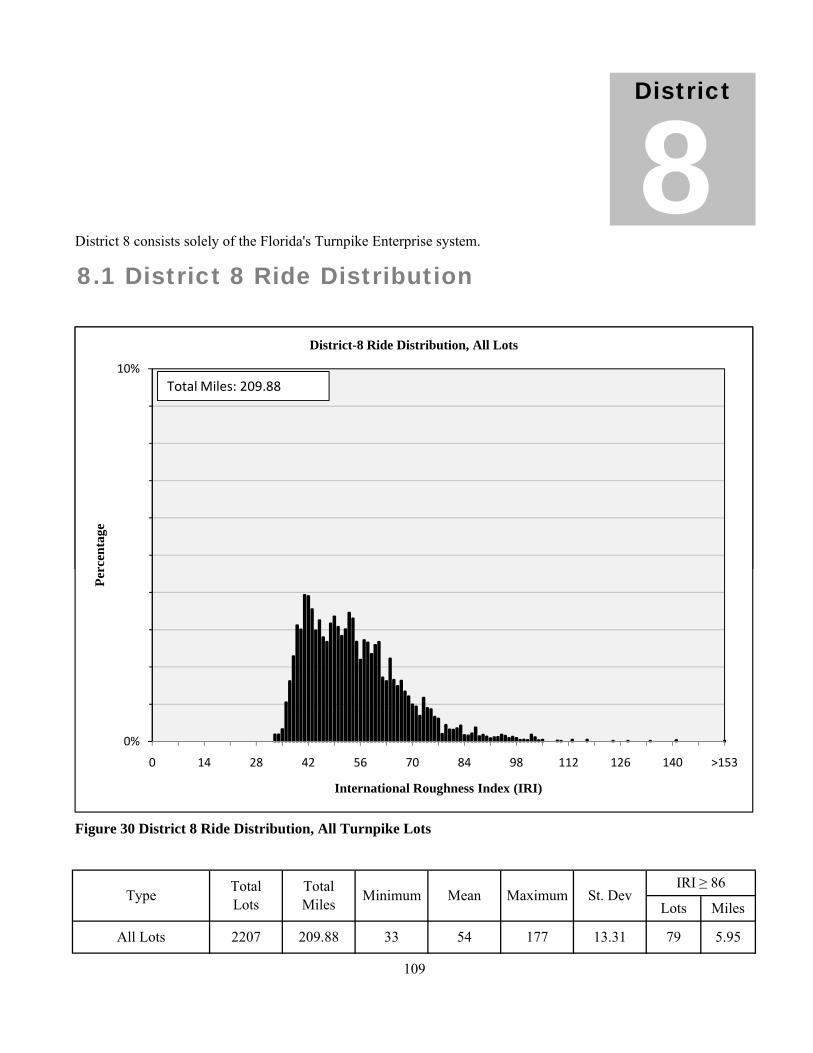
88.1 District 8 Ride DistributionDistrict 8 consists solely of the Florida's Turnpike Enterprise system.
District
10%
rcen
tage
District-8 Ride Distribution, All Lots
Total Miles: 209.88
IRI ≥ 86Minimum Mean Maximum St. Dev
Lots MilesTotalLots
TotalMiles
All Lots 2207 209.88 33 54 177 79 5.95
109
Figure 30 District 8 Ride Distribution, All Turnpike Lots
13.31
Type
0%
10%
0 14 28 42 56 70 84 98 112 126 140 >153
Perc
enta
ge
International Roughness Index (IRI)
District-8 Ride Distribution, All Lots
Total Miles: 209.88
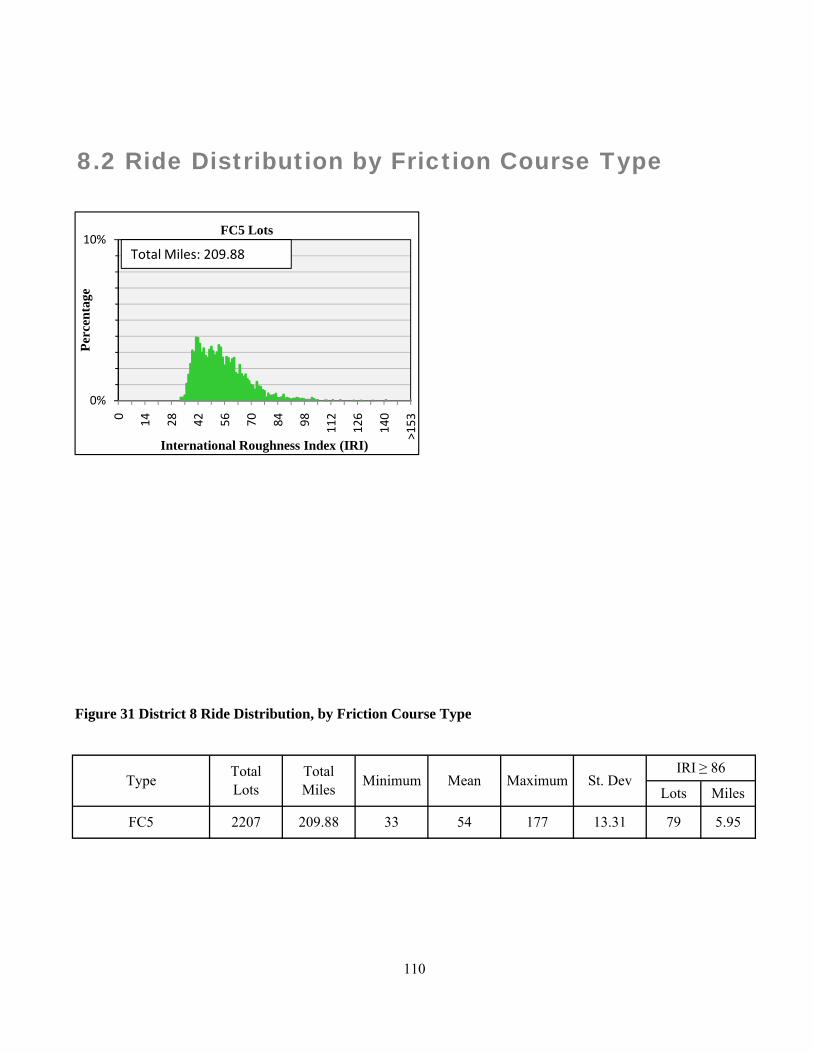
8.2 Ride Distribution by Friction Course Type
0%
10%
0 14 28 42 56 70 84 98 112
126
140
>153
Perc
enta
ge
International Roughness Index (IRI)
FC5 Lots
Total Miles: 209.88
Figure 31 District 8 Ride Distribution, by Friction Course Type
Type
79
TotalLots
FC5 2207 209.88
110
Mean Maximum St. DevIRI ≥ 86
Lots
5.9533 54 177 13.31
TotalMiles Minimum
Miles

Lots Miles
8.3 District 8 Statistics
50 82
TotalLots
TotalMiles Minimum Mean Maximum St. DevYear
Table 82 District 8 Statistical Summary for Year
2005 158 15.55 37
2009
7.82 0 0.00
No Statistical Summaries for Friction Course Type will be shown since all data is FC5 only.
2006
2007
No Statistical Summaries for System Type will be shown since all data is Turnpike system only.
IRI ≥ 86
Aggregate Type TotalLots
TotalMiles Minimum Mean Maximum
0 0.00 0 0 0 0.00 0 0.00
420 41.05 42 62 102 8.94 7 0.67
353 33.82 33 58 124 14.23 21 1.74
1276 119.47 33 51 177 13.66 51 3.55
177 13 19 73 5 56
Lots Miles
Table 83 District 8 Statistical Summary for Aggregate Type
2008
Limestone 1278 119 30 33 60
St. DevIRI ≥ 86
L
G
B
1
2
Asphalt-Rubber
Polymer-Modified
Table 84 District 8 Statistical Summary for Binder Type
Maximum St. DevIRI ≥ 86
Mixed
Binder Type TotalLots
TotalMiles
No Statistical Summaries for Access Type will be shown since all data is Limited (Full Control) only.
111
LotsMinimum Mean
Miles
929 90.59 33 47 124 9.24 6 0.40
177 13.19 73 5.56Limestone 1278 119.30 33 60Granite
0 0.00 0 0 0 0.00 0 0.00
36 3.44 41 56 75 8.40 0 0.00
2171 206.45 33 54 177 13.38 79 5.95

#
#
#
#
#
#
#
A.P.A.C.
Community Asphalt Corp.
Condotte America
D.A.B. Constructors
Dickerson Asphalt
General Asphalt Company
Middlesex Corp.
Ranger Construction
Contractor TotalLots
TotalMiles
0.32
4.94 51 75 109 14.80 17 1.59
Mean Maximum St. DevIRI ≥ 86
Lots Miles
Table 85 District 8 Statistical Summary for Contractors
Minimum
8.4 District 8 Contractor Statistics
91 8.55 45 71 117 14.93 16 1.42
122 12.11 37 49 82 6.89 0 0.00
262 25.26 33 54 124 11.15 5
55
200 19.54 33 46 134 7.80 2 0.08
422 36.85 41 62 177 12.40 27 1.53
114 11.04 37 48 66 6.08 0 0.00
941 91.59 33 52 103 12.24 12 1.024
112
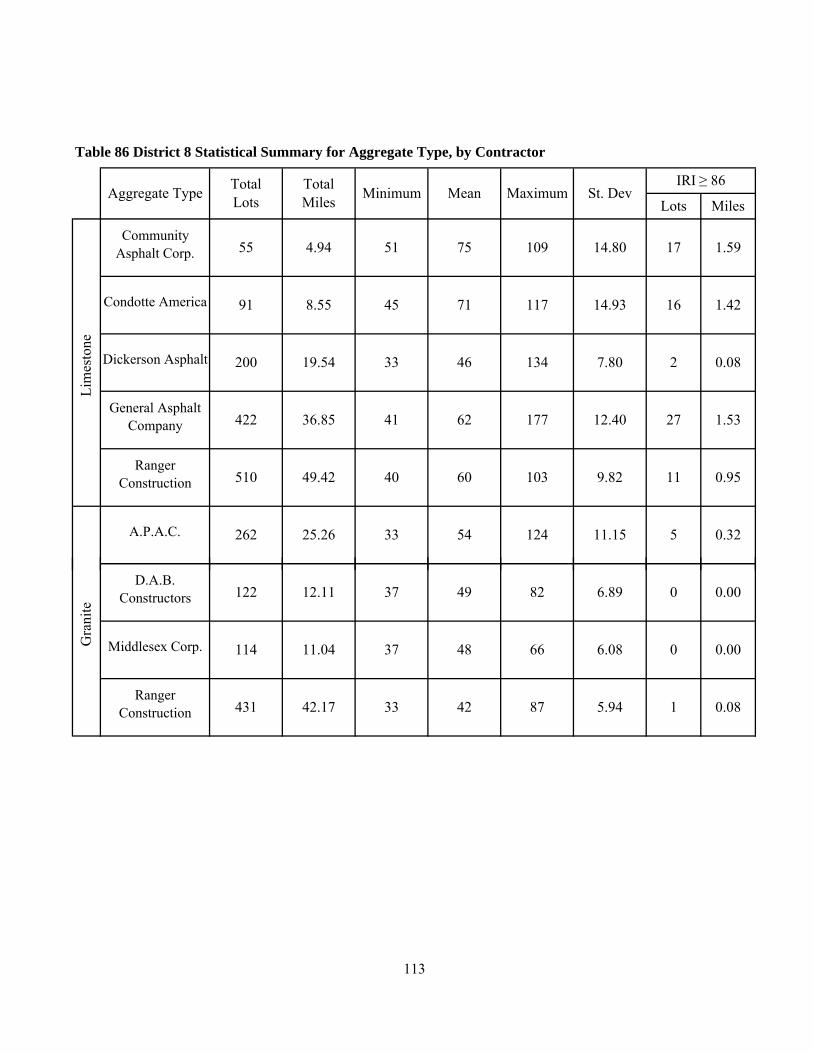
L
#
#
#
#
4G
#
Maximum St. DevIRI ≥ 86
Condotte America
Lim
esto
ne
16 1.4291 8.55 45 71 117 14.93
36.85 41 62
Mean
Table 86 District 8 Statistical Summary for Aggregate Type, by Contractor
Lots MilesAggregate Type
17 1.5955 4.94 51 75 109 14.80Community
Asphalt Corp.
54 124
TotalLots
TotalMiles Minimum
Ranger Construction 510 49.42 40 60
12.40 27 1.53
Dickerson Asphalt 200 19.54 33 46 134
General Asphalt Company 422 177
3325.26
7.80 2 0.08
103 9.82 11 0.95
11.15 5 0.32A.P.A.C. 262
#
#
#
4
0 0.00D.A.B.
Constructors 122 12.11 37 49
113
6.08 0Middlesex Corp. 114 11.04 37 48 66
82 6.89
0.00
Ranger Construction 431 42.17 33 42 87 5.94 1 0.08
Gra
nite

PAGE
LEFT BLANK
114

AAppendix
CUSTOMER SERVICE FORM
A-1
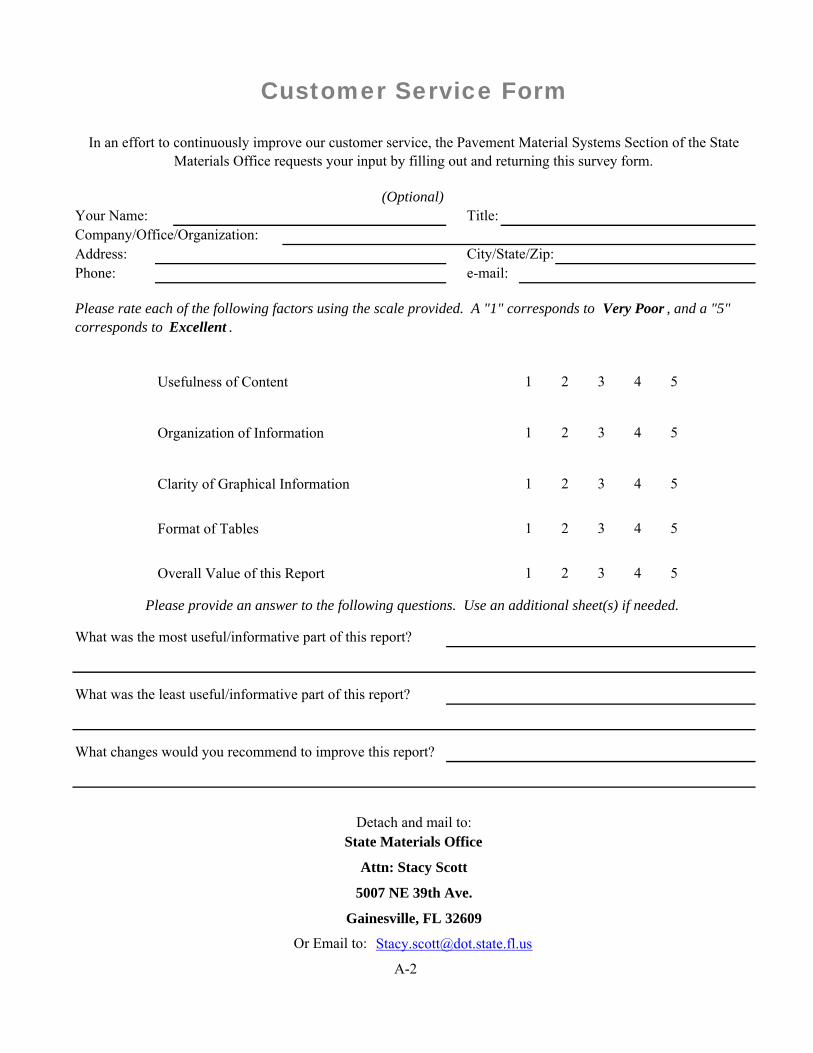
Your Name:
e-mail:
Company/Office/Organization:City/State/Zip:Address:
Phone:
Title:
1 2 3 4
1 2 3 4 5Usefulness of Content
Organization of Information
4 5
Clarity of Graphical Information 2 3 4 5
Format of Tables
1
2 31
5
Please rate each of the following factors using the scale provided. A "1" corresponds to Very Poor , and a "5" corresponds to Excellent .
In an effort to continuously improve our customer service, the Pavement Material Systems Section of the State Materials Office requests your input by filling out and returning this survey form.
Customer Service Form
(Optional)
What was the least useful/informative part of this report?
3 4 5
What was the most useful/informative part of this report?
2
What changes would you recommend to improve this report?
1
A-2
Overall Value of this Report
Or Email to: [email protected]
Gainesville, FL 32609
5007 NE 39th Ave.
Attn: Stacy Scott
State Materials OfficeDetach and mail to:
Please provide an answer to the following questions. Use an additional sheet(s) if needed.