Embed Size (px)
Citation preview
RESEARCH PAPER
Flexible automation with compact NMR spectroscopy for continuousproduction of pharmaceuticals
Simon Kern1,2& Lukas Wander1 & Klas Meyer1 & Svetlana Guhl1 & Anwesh Reddy Gottu Mukkula3 & Manuel Holtkamp4
&
Malte Salge4& Christoph Fleischer4 & Nils Weber5 & Rudibert King2
& Sebastian Engell3 & Andrea Paul1 &
Manuel Pereira Remelhe5& Michael Maiwald1
Received: 16 January 2019 /Revised: 13 February 2019 /Accepted: 4 March 2019 /Published online: 23 March 2019
AbstractModular plants using intensified continuous processes represent an appealing concept for the production of pharmaceuticals. Itcan improve quality, safety, sustainability, and profitability compared to batch processes; besides, it enables plug-and-producereconfiguration for fast product changes. To facilitate this flexibility by real-time quality control, we developed a solution that canbe adapted quickly to new processes and is based on a compact nuclear magnetic resonance (NMR) spectrometer. The NMRsensor is a benchtop device enhanced to the requirements of automated chemical production including robust evaluation of sensordata. Beyond monitoring the product quality, online NMR data was used in a new iterative optimization approach to maximizethe plant profit and served as a reliable reference for the calibration of a near-infrared (NIR) spectrometer. The overall approachwas demonstrated on a commercial-scale pilot plant using a metal-organic reaction with pharmaceutical relevance.
Keywords NMR spectroscopy . NIR spectroscopy . Real-time process monitoring . Real-time quality control . Continuousprocesses
Introduction
The pharmaceutical industry is making considerable efforts toestablish continuous manufacturing of active pharmaceutical
ingredients (API) as an alternative to batch production. Astudy released by representatives of ten prominent phar-maceutical companies demonstrates the value of intensi-fied continuous manufacturing with regard to improvedquality, safety, sustainability, throughput time, speed ofimplementation, and profitability [1–3]. The combinationof continuous processes with a modular plant conceptsupporting plug-and-produce reconfiguration enables effi-cient and flexible production of different substances usingstandardized modular equipment [4, 5].
Online quality monitoring and model-based control of crit-ical quality attributes (CQAs) are required to ensure the de-sired product quality and to run a continuous process in anoptimal way [6]. The effort to develop such integrated controlsolutions slows down the implementation of new continuousAPI processes considerably and hampers flexibility whenmaking many different products. Process analytical methodssuch as online near infrared (NIR), UV/VIS, or Raman spec-troscopy are typically employed for online quality monitoring[7–9]. The calibration of such instruments is usually expen-sive and time consuming. A considerable set of different me-dium samples has to be obtained and a suitable reference an-alytical method has to be developed to determine the
Simon Kern and Lukas Wander contributed equally to this work.
Electronic supplementary material The online version of this article(https://doi.org/10.1007/s00216-019-01752-y) contains supplementarymaterial, which is available to authorized users.
* Michael [email protected]
1 Bundesanstalt für Materialforschung und -prüfung (BAM),Richard-Willstätter-Str. 11, 12489 Berlin, Germany
2 Department Measurement and Control, Institute of ProcessEngineering, Berlin University of Technology, Hardenbergstr. 36a,10623 Berlin, Germany
3 Department of Biochemical and Chemical Engineering, ProcessDynamics and Operations Group, Dortmund University ofTechnology, Emil-Figge-Str. 70, 44227 Dortmund, Germany
4 INVITE GmbH, CHEMPARK, 51368 Leverkusen, Germany5 Bayer AG, Kaiser-Wilhelm-Allee, 51368 Leverkusen, Germany
Analytical and Bioanalytical Chemistry (2019) 411:3037–3046https://doi.org/10.1007/s00216-019-01752-y
# The Author(s) 2019
compositions of the samples. Furthermore, a calibration mod-el correlating spectral sensor data to the corresponding chem-ical compositions has to be fitted, validated, and maintained.
Seeking for appropriate process analytical methods, quan-titative NMR spectroscopy was considered in this study,which features a high linearity between absolute peak areasin the spectra and the concentrations of analyte molecules inthe samples. This makes it an absolute analytical comparisonmethod being strictly independent on the sample matrix, e.g.,solvent effects. NMR spectroscopy provides informationabout the structure of the molecules in the sample as well asquantitative information. 1H NMR spectroscopy provides sev-eral concentration readings as well as structural informationper minute. The high rate of data points helps in understandingthe dynamics of the investigated pilot plant. Most NMR spec-trometers use cryo-cooled superconductors to establish a verystrong magnetic field (> 5 T), but they are not suitable forprocess applications because of the need for cryogenic liquids,the high operational costs, and the large size of these devices.Nowadays, compact NMR systems are available using perma-nent magnets with a lower magnetic flux density (i.e., 1 T) andsufficient field homogeneity below 1 Hz. These devices aresmall, relatively inexpensive, and very appealing for processapplications [10, 11]. Automated systems including compactNMR spectrometers have been reported in literature latelyfocusing on reaction monitoring [12], self-optimizing reactorsystems [13], or in combination with an organic synthesisrobot for the prediction of reactivities [14]. However, theseprototype devices and commercially available instrumentsare primarily intended for laboratory use.
In this contribution, we present a real-time quality controlsolution that can be adapted quickly to new processes. It in-cludes a compact NMR spectrometer for online quality mon-itoring and a new data and model-based process control ap-proach. The integrated solution was developed for a lithiationreaction running on a commercial-scale modular pilot plantand it was tested under industrial conditions within theEuropean Union’s Horizon 2020 project CONSENS(Integrated Control and Sensing for Sustainable Operation ofFlexible Intensified Processes, 2015–2017). A benchtopNMR spectrometer was converted into a smart, compact(57 × 57 × 85 cm), portable process analytical sensor whicheasily benefits the modular plant concept. It rapidly and non-invasively measures the chemical composition with minorcalibration effort and without the need for sample preparation,or deuterated solvents. The analytes are quantified with mod-ular, physically motivated models. These models can beadapted to new substances solely by the use of their corre-sponding pure component spectra. Beyond that, we compre-hensively calibrated an NIR spectrometer based on real NMRprocess data for the first time within an industrial plant. Theadvantage of this approach allowed us to include reactioncomponents, which are typically not accessible for offline
reference analytics. This comprises intermediates usually de-pleted after quenching of the technical samples and additionalcomponents such as contaminants and side products. The it-erative control approach leads to the economically optimaloperation of the plant even though the process model is notaccurate.
Materials and methods
Experimental setup in pilot scale
The pilot plant considered here was built in a previous re-search project to demonstrate the feasibility of mobile andmodular intensified continuous production [15]. It is charac-terized by a strictly modular architecture based on a standard20-ft shipping container with the dimensions 6.0 m × 2.4 m ×2.6 m (L ×W×H). The plant was designed to produce an APIintermediate with a capacity of several tons per year includingtwo reaction steps and two purification steps. In this study,only the first reaction unit is considered which is an air-cooled tubular reactor. A highly exothermal metal-organic re-action is used in which two aromatic compounds, aniline and1-fluoro-2-nitrobenzene (o-FNB), are coupled using lithiumhexamethyldisilazane (LiHMDS) as a base yielding lithium-2-nitrodiphenylamine (Li-NDPA) and lithium fluoride.
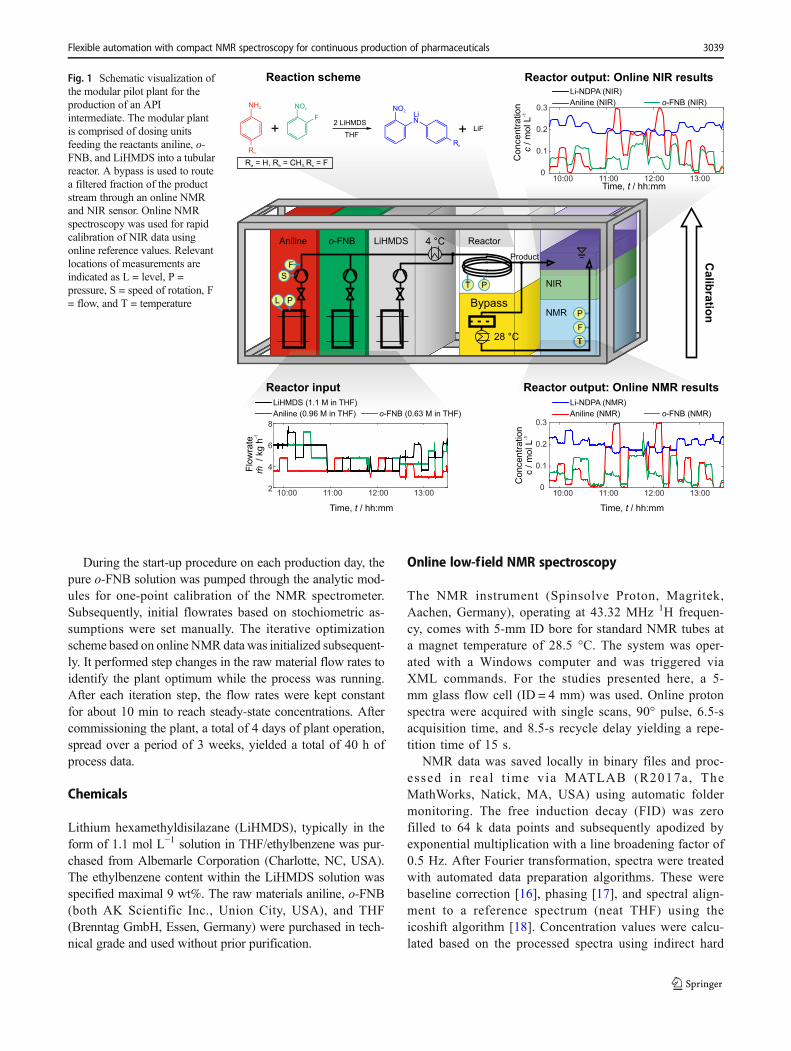
The setup of the relevant parts of the plant and the reactionscheme are illustrated in Fig. 1. Three separate dosing unitsprovide the reactants each dissolved in tetrahydrofuran (THF).After pre-mixing of anline and o-FNB, cooling to 4 °C isnecessary to avoid THF from boiling in the tubular reactor.At least 2 mol of LiHMDS has to be applied to 1 mol anilineand 1 mol o-FNB. Due to the rather loose raw material spec-ification of the lithium base and side reactions with residualmoisture, LiHMDS is used in excess. In this study, the initialstoichiometric factor of the lithium base was set to 2.14. Theflow rates for the THF solutions of o-FNB (5.60 kg h−1), an-iline (3.68 kg h−1) and LiHMDS (6.89 kg h−1) were selectedaccordingly, assuming concentrations 0.63, 0.96, and1.10 mol L−1 of the analytes, respectively. These concentra-tions may vary during production when the tanks of the dosingunits are filled up with new batches of raw material solutions.Hence, these flow rates are used for start-up and are adjustedduring production by the control algorithm to compensatevariations of feed compositions and temperatures, and to op-timize the operation of the plant. The pilot plant has to beconsidered as a hazardous area prone to explosive atmo-spheres, due to the use of THF and other organic substances.Thus, all devices used in the plant, including the online NMRsensor, are required to meet explosion protection regulationsfor zone 1 according to ATEX (European Directives for con-trolling explosive atmospheres).
3038 Kern S. et al.
During the start-up procedure on each production day, thepure o-FNB solution was pumped through the analytic mod-ules for one-point calibration of the NMR spectrometer.Subsequently, initial flowrates based on stochiometric as-sumptions were set manually. The iterative optimizationscheme based on online NMR data was initialized subsequent-ly. It performed step changes in the raw material flow rates toidentify the plant optimum while the process was running.After each iteration step, the flow rates were kept constantfor about 10 min to reach steady-state concentrations. Aftercommissioning the plant, a total of 4 days of plant operation,spread over a period of 3 weeks, yielded a total of 40 h ofprocess data.
Chemicals
Lithium hexamethyldisilazane (LiHMDS), typically in theform of 1.1 mol L−1 solution in THF/ethylbenzene was pur-chased from Albemarle Corporation (Charlotte, NC, USA).The ethylbenzene content within the LiHMDS solution wasspecified maximal 9 wt%. The raw materials aniline, o-FNB(both AK Scientific Inc., Union City, USA), and THF(Brenntag GmbH, Essen, Germany) were purchased in tech-nical grade and used without prior purification.
Online low-field NMR spectroscopy
The NMR instrument (Spinsolve Proton, Magritek,Aachen, Germany), operating at 43.32 MHz 1H frequen-cy, comes with 5-mm ID bore for standard NMR tubes ata magnet temperature of 28.5 °C. The system was oper-ated with a Windows computer and was triggered viaXML commands. For the studies presented here, a 5-mm glass flow cell (ID = 4 mm) was used. Online protonspectra were acquired with single scans, 90° pulse, 6.5-sacquisition time, and 8.5-s recycle delay yielding a repe-tition time of 15 s.
NMR data was saved locally in binary files and proc-essed in real t ime via MATLAB (R2017a, TheMathWorks, Natick, MA, USA) using automatic foldermonitoring. The free induction decay (FID) was zerofilled to 64 k data points and subsequently apodized byexponential multiplication with a line broadening factor of0.5 Hz. After Fourier transformation, spectra were treatedwith automated data preparation algorithms. These werebaseline correction [16], phasing [17], and spectral align-ment to a reference spectrum (neat THF) using theicoshift algorithm [18]. Concentration values were calcu-lated based on the processed spectra using indirect hard
Aniline o-FNB LiHMDS
Bypass
NIR
4 °C
Product
28 °C
S
L P
PT
F
no
it
ar
bil
aC
NMR P
F
T
Reactor input
eta
rw
olF
h g
k /-1
Aniline (0.96 M in THF) o-FNB (0.63 M in THF)
LiHMDS (1.1 M in THF)
Time, / hh:mmt
Reactor output: Online NMR results
Time, / hh:mmt
noit
art
ne
cn
oC
L lo
m / c
-1
Aniline (NMR) o-FNB (NMR)
0
0.1
0.2
0.3
10:00 11:00 12:00 13:0010:002
4
6
8
11:00 12:00 13:00
Li-NDPA (NMR)
noit
art
ne
cn
oC
L lo
m /c
-1
Time, / hh:mmt
Reactor output: Online NIR results
0
0.1
0.2
0.3
10:00 11:00 12:00 13:00
Aniline (NIR) o-FNB (NIR)
Li-NDPA (NIR)
Reactor
Reaction scheme
THF
NO2
F
NH2
Rn
NO2
Li
N
Rn
+2 LiHMDS
+ LiF
R = H, R = CH R = Fa b 3, c
Fig. 1 Schematic visualization ofthe modular pilot plant for theproduction of an APIintermediate. The modular plantis comprised of dosing unitsfeeding the reactants aniline, o-FNB, and LiHMDS into a tubularreactor. A bypass is used to routea filtered fraction of the productstream through an online NMRand NIR sensor. Online NMRspectroscopy was used for rapidcalibration of NIR data usingonline reference values. Relevantlocations of measurements areindicated as L = level, P =pressure, S = speed of rotation, F= flow, and T = temperature
Flexible automation with compact NMR spectroscopy for continuous production of pharmaceuticals 3039
modeling (IHM). For automation purposes, componentfitting and calculation of concentration values duringreal-time optimization experiments at the pilot plant wasimplemented in MATLAB. Reference concentrationvalues for calibrating the NIR spectrometer were calculat-ed offline with the PEAXACT software (SPACT GmbH,Aachen, Germany). Small differences exist between theMATLAB and PEAXACT (not shown) approach.
Model parameters for IHM were adopted from previousstudies of the same reaction system at lab-scale [19]. For theabsolute quantification method, the use of a concentrationconversion factor ξ was applied to convert signal areas tomolar concentration ci. ξ was determined via one-point cali-bration obtained from the known concentration of the o-FNBsolution using Eq. 1:
ci ¼ ξ∙Ai
νið1Þ
where ν is the number of nuclei and A is the correspondingabsolute integral.
Online NIR spectroscopy
FT-NIR absorbance spectra were measured with a fiberoptic transmission probe (Knauer A4081) using aMatrix-F spectrometer (Bruker Optik GmbH, Ettlingen,Germany). 64 consecutive sample scans were accumulat-ed in the spectral range of 4000–12,000 cm−1 with a spec-tral resolution of 8 cm−1. Zero filling with factor 2 andapodization using a Blackman-Harris-3-Term functionyielded a total of 2074 data points per spectrum.Measurement intervals were set to 160 s. Data evaluationincluding preprocessing and multivariate calibrations wasperformed using The Unscrambler X, Version 10.5(CAMO Software, Oslo, Norway).
Field integration of analytical instrumentations
The compact NMR spectrometer was integrated into an onlinesensor unit, equipped with a pressurized enclosure with nitro-gen purge (see Electronic SupplementaryMaterial (ESM) Fig.S2 and S3). The resulting sensor module was certified by anotified body according to ATEX regulations which allowsthe usage of the sensor in the hazardous area of the pilot plant.The product flow through the NMR instrument was controlledinside the module to 1.5 mL min−1 to assure complete pre-magnetization of the sample flow. A detailed piping and in-strumentation diagram (P&ID) and the spatial arrangementdepicted in Figs. S2 and S3 (see ESM) show the workingprinciple of the whole NMR sensor. The NMR unit was fullyautomated, including acquisition, processing, and communi-cation of data. The concentration values of the selected sub-stances were transmitted to the distributed control systemthrough the standardized communication protocol OPCUnified Architecture.
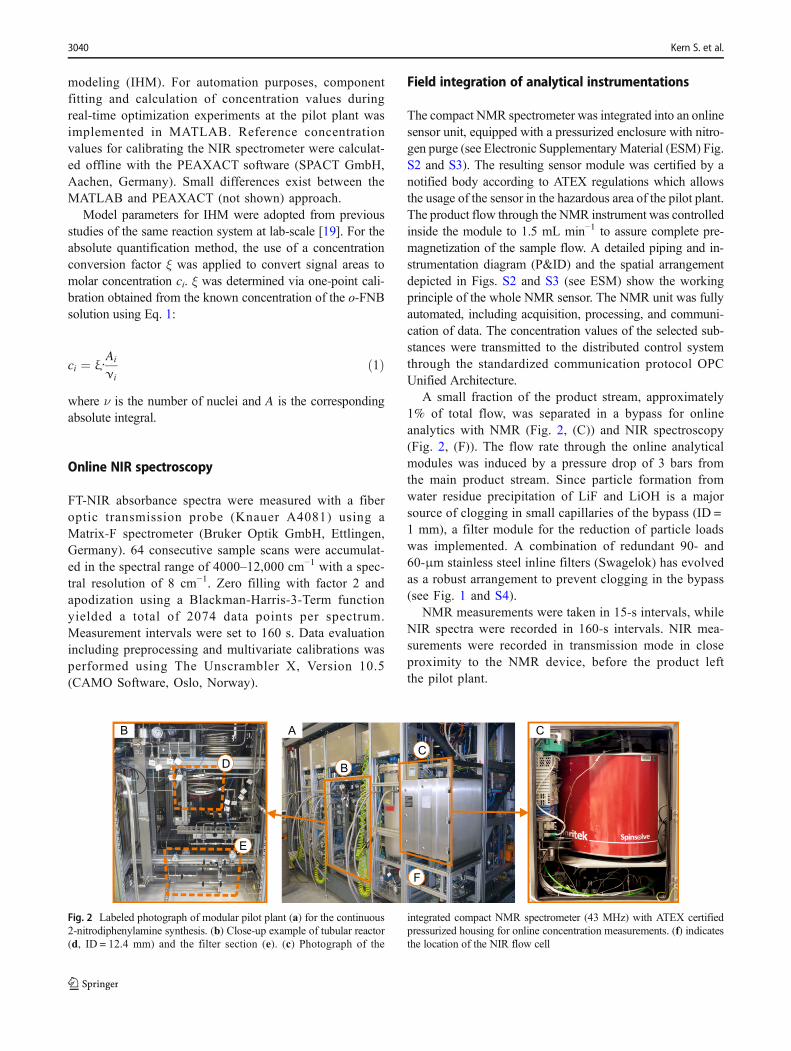
A small fraction of the product stream, approximately1% of total flow, was separated in a bypass for onlineanalytics with NMR (Fig. 2, (C)) and NIR spectroscopy(Fig. 2, (F)). The flow rate through the online analyticalmodules was induced by a pressure drop of 3 bars fromthe main product stream. Since particle formation fromwater residue precipitation of LiF and LiOH is a majorsource of clogging in small capillaries of the bypass (ID =1 mm), a filter module for the reduction of particle loadswas implemented. A combination of redundant 90- and60-μm stainless steel inline filters (Swagelok) has evolvedas a robust arrangement to prevent clogging in the bypass(see Fig. 1 and S4).
NMR measurements were taken in 15-s intervals, whileNIR spectra were recorded in 160-s intervals. NIR mea-surements were recorded in transmission mode in closeproximity to the NMR device, before the product leftthe pilot plant.
B1
C
A C
D
E
B
F
Fig. 2 Labeled photograph of modular pilot plant (a) for the continuous2-nitrodiphenylamine synthesis. (b) Close-up example of tubular reactor(d, ID = 12.4 mm) and the filter section (e). (c) Photograph of the
integrated compact NMR spectrometer (43 MHz) with ATEX certifiedpressurized housing for online concentration measurements. (f) indicatesthe location of the NIR flow cell
3040 Kern S. et al.
Real-time optimization experiments
In model-based optimization, exact non-linear process modelsare needed to determine the real optimum operating point of aplant. However, most often a lot of work is needed to describeall effects of the process behavior precisely enough. In thiscase, it is very costly to determine the reaction kinetics, sincethe reaction is very fast, and it is assumed that mixing effectsin the tubular reactor influence the conversion considerably.Instead, a simple control model was built based on the stoi-chiometry of the reaction system and using rough estimates ofthe kinetic parameters based on chemical understanding. Dueto the fast reaction and the short residence time in the reactor,the plant quickly reaches a steady state after changes of thefeed rates. Therefore, an iterative steady-state optimizationwas implemented. The objective function of the optimizationproblem considers the prices and the mass flows of, the rawmaterials fed to the reactor and the product obtained at theoutlet according to Eq. 2.
Profit ¼ w4∙MLi−NDPA∙cLi−NDPA=ρMixture∙ ∑3
i¼1ui− ∑
3
i¼1wiui; ð2Þ
where u1, u2, and u3 are the feed flowrates of the reactantsaniline, LiHMDS, and o-FNB in kg h−1, andMLi-NDPA as wellas cLi-NDPA are the molar mass in kg mol−1 and the measuredconcentration in mol m−3 of the product Li-NDPA. Weightsfor each term in the profit function (w1–w4) reflect the relativecosts of the reactants and the product and were set to 10,000,25,000, 12,000, and 450,000 kg−1, respectively. The densityof the reaction mixture (ρMixture) was set to 900 kg m−3.
In contrast to the traditional non-linear process modelingapproach, no estimation of model parameters was performed,but the optimization problem itself was adapted by introduc-ing correction terms, the so-called modifiers [20]. These mod-ifiers describe the differences between the observed stationarybehavior of the plant and its model and of the gradients of thecost function and of the constraints with respect to the
manipulated variables. In this manner, the necessary condi-tions for optimality of the true plant operation are satisfiedupon convergence. To use this kind of correction withoutidentifying model parameters was first proposed byTatjewski [21] and later extended to include the handling ofconstraints [22]. The critical element of this iterative optimi-zation algorithm is the computation of the gradients from theplan measurements. To compute the gradients from finite dif-ferences is vulnerable to measurement noise and can lead toerratic control moves. A recently proposed modifier adapta-tion with quadratic approximation (MAWQA), in which theiterative gradient correction [22] is combined with elementsfrom derivative-free optimization (DFO) to estimate the plantgradients [23], was adopted to the given optimizationproblem.
Results and discussion
Flexible data evaluation approach for NMR spectra
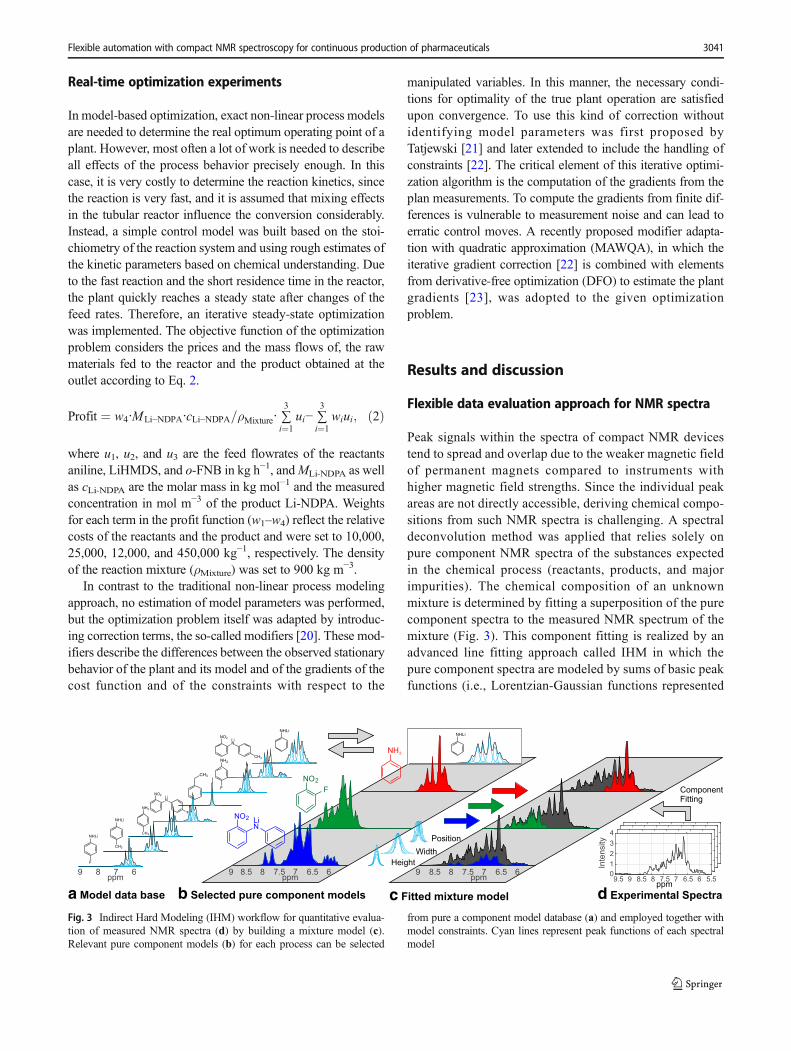
Peak signals within the spectra of compact NMR devicestend to spread and overlap due to the weaker magnetic fieldof permanent magnets compared to instruments withhigher magnetic field strengths. Since the individual peakareas are not directly accessible, deriving chemical compo-sitions from such NMR spectra is challenging. A spectraldeconvolution method was applied that relies solely onpure component NMR spectra of the substances expectedin the chemical process (reactants, products, and majorimpurities). The chemical composition of an unknownmixture is determined by fitting a superposition of the purecomponent spectra to the measured NMR spectrum of themixture (Fig. 3). This component fitting is realized by anadvanced line fitting approach called IHM in which thepure component spectra are modeled by sums of basic peakfunctions (i.e., Lorentzian-Gaussian functions represented
NH2
CH3
a Model data base d Experimental Spectrab Selected pure component models c Fitted mixture model
NH2
NO2
F
ppm5.566.577.588.599.5
0
1
2
3
4
Inte
nsity
66.577.588.59ppm
NO2
LiN
CH3
NH2
F
NHLi
CH3
NO2
LiN
F
NHLi
CH3
Component
Fitting
Li
N
NO2
66.577.588.59ppm
6789ppm
NHLi
Position
Height
Width
NHLi
F
Fig. 3 Indirect Hard Modeling (IHM) workflow for quantitative evalua-tion of measured NMR spectra (d) by building a mixture model (c).Relevant pure component models (b) for each process can be selected
from pure a component model database (a) and employed together withmodel constraints. Cyan lines represent peak functions of each spectralmodel
Flexible automation with compact NMR spectroscopy for continuous production of pharmaceuticals 3041
by Pseudo-Voigt functions). The IHM algorithm adjustsheights, widths, and positions of the basic peak functionswithin predefined model constraints to minimize the resid-uals between measured data and the mixture model, but itmaintains the peak area ratios in each pure componentmodel for physical plausibility [24, 25]. The compositionscan then be derived from the resulting areas of the sub-stance models. IHM applied to complex NMR spectra en-ables a calibration-free access to molar ratios and providesabsolute concentrations with low calibration effort (one-point calibration) [26].
Prior to deployment at the modular plant, the proof ofprinciple for the NMR sensor and of the flexibility of thedata evaluation concept was validated in the laboratoryfor various sets of starting materials and the resultingproducts. The functional groups R of the aromatic aminewithin the metal-organic reaction (Fig. 1) comprised ani-line (R = H), 4-flouroaniline (R = F), and toluidine (R =CH3). Initially, a spectral library of various analytes forthe investigated reaction system was created, includingpure component spectra measured offline in standardNMR tubes (ESM Fig. S1) and their derived spectralmodels (Fig. 3, (a)). For each experiment within the lab-oratory setup, relevant pure component models were se-lected (Fig. 3, (b)). The experimental setup of this studyas well as model constraints of IHM for the reaction sys-tem with R = H were recently published [19]. The inves-tigation of various starting materials revealed that modelconstraints from [19] could be universally applied for dataevaluation in all three cases. Root-mean-square errors(RMSE) for the concentration measurements of each re-action system are depicted in Table 1. RMSE values in therange of 5–16 mmol L−1 were achieved. Online high-fieldNMR spectroscopy (500 MHz) served as a referencemethod for validation since metal-organic reactants areproblematic to analyze via offline sampling due to theirsensitivity to air and moisture.
Iterative optimization of the plant performance
The goal of the control solution was to guarantee a consistentproduct quality, to make sure that the safety constraints of theprocess are not violated, and to drive the plant to its econom-ically optimal operating point at the same time. This is nottrivial, because there are external disturbances that need tobe compensated. For instance, when a feed buffer is refilledwith a new batch of raw material, the composition of therespective feed streammay shift. In addition, temperature var-iations in the cooling system and in the environment can in-fluence the process. The implemented control solution readstemperature measurements and the chemical compositionfrom the NMR sensor and manipulates the set points of thelocal flow controllers of the dosing units.
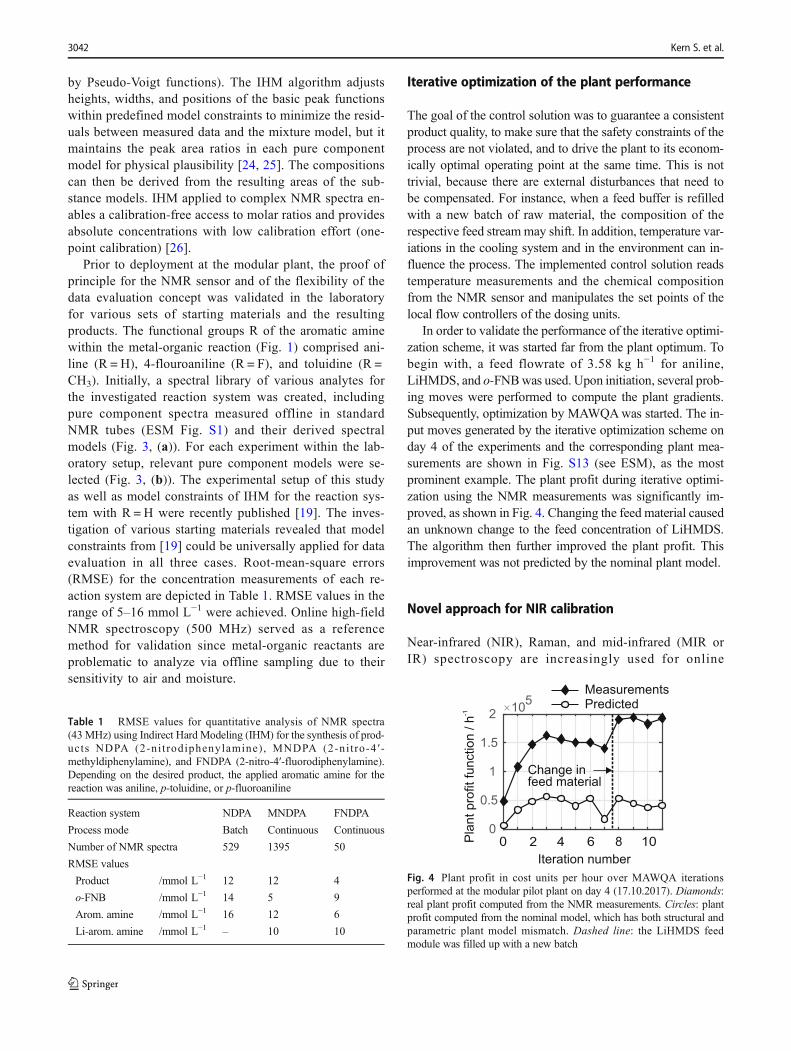
In order to validate the performance of the iterative optimi-zation scheme, it was started far from the plant optimum. Tobegin with, a feed flowrate of 3.58 kg h−1 for aniline,LiHMDS, and o-FNBwas used. Upon initiation, several prob-ing moves were performed to compute the plant gradients.Subsequently, optimization by MAWQAwas started. The in-put moves generated by the iterative optimization scheme onday 4 of the experiments and the corresponding plant mea-surements are shown in Fig. S13 (see ESM), as the mostprominent example. The plant profit during iterative optimi-zation using the NMR measurements was significantly im-proved, as shown in Fig. 4. Changing the feed material causedan unknown change to the feed concentration of LiHMDS.The algorithm then further improved the plant profit. Thisimprovement was not predicted by the nominal plant model.
Novel approach for NIR calibration
Near-infrared (NIR), Raman, and mid-infrared (MIR orIR) spectroscopy are increasingly used for online
Pla
nt
pro
fit
fun
ctio
n/
h-1
Measurements
Predicted
Iteration number
0
0.5
1
1.5
210
5
2 64 8 100
Change in
feed material
Fig. 4 Plant profit in cost units per hour over MAWQA iterationsperformed at the modular pilot plant on day 4 (17.10.2017). Diamonds:real plant profit computed from the NMR measurements. Circles: plantprofit computed from the nominal model, which has both structural andparametric plant model mismatch. Dashed line: the LiHMDS feedmodule was filled up with a new batch
Table 1 RMSE values for quantitative analysis of NMR spectra(43 MHz) using Indirect Hard Modeling (IHM) for the synthesis of prod-ucts NDPA (2-ni t rodiphenylamine) , MNDPA (2-ni t ro-4 ′ -methyldiphenylamine), and FNDPA (2-nitro-4′-fluorodiphenylamine).Depending on the desired product, the applied aromatic amine for thereaction was aniline, p-toluidine, or p-fluoroaniline
Reaction system NDPA MNDPA FNDPA
Process mode Batch Continuous Continuous
Number of NMR spectra 529 1395 50
RMSE values
Product /mmol L−1 12 12 4
o-FNB /mmol L−1 14 5 9
Arom. amine /mmol L−1 16 12 6
Li-arom. amine /mmol L−1 – 10 10
3042 Kern S. et al.
monitoring of product quality in the industry [7, 27]. NIRcan be easily implemented in industrial environments de-spite additional explosion protection requirements. Mostcomplex analytical sensors do not yet fulfill safety integ-rity level (SIL) demands. Similar chemical informationsimultaneously provided by NIR and NMR spectroscopymight improve their acceptance in safety functions due tothe redundancy they offer. In complex mixtures, such asthe lithiation reaction, calibration of NIR instruments of-ten relies on a multivariate approach. To cover all possiblechemical states of the reaction mixture in a calibrationmodel, design of experiments is typically applied. Foreach variation in the chemical structure of raw materials,near-infrared spectra combined with reference data is re-quired to develop new calibration models. Those refer-ence values are conventionally obtained from labor-intensive laboratory experiments and offline analytics(e.g., HPLC or GC-MS), which requires sampling fromthe continuous production stream. Since combined sam-pling errors are usually one or two orders of magnitudelarger than the analytical uncertainty, the dominant impacton data quality is the sampling process [28]. Using onlineanalytics for calibration also grants access to formerly (viaoffline methods) inaccessible intermediates (i.e., Li-ani-line), which are vanishing during sampling or quenchingof the reaction mixture.
By using the aforementioned calibration workflows for op-tical sensors, calibration model development for spectroscopicdata can be time-consuming and significantly slows downimplementation of the final process. Recent cost decreasesand performance improvements will increase the number ofNIR sensors in chemical plants [29], demanding innovativealternatives to reduce setup times and analytical lead time. Wepropose a new calibration approach of NIR sensors using con-centration values provided by an online NMR module as areference.
Selection of reference values
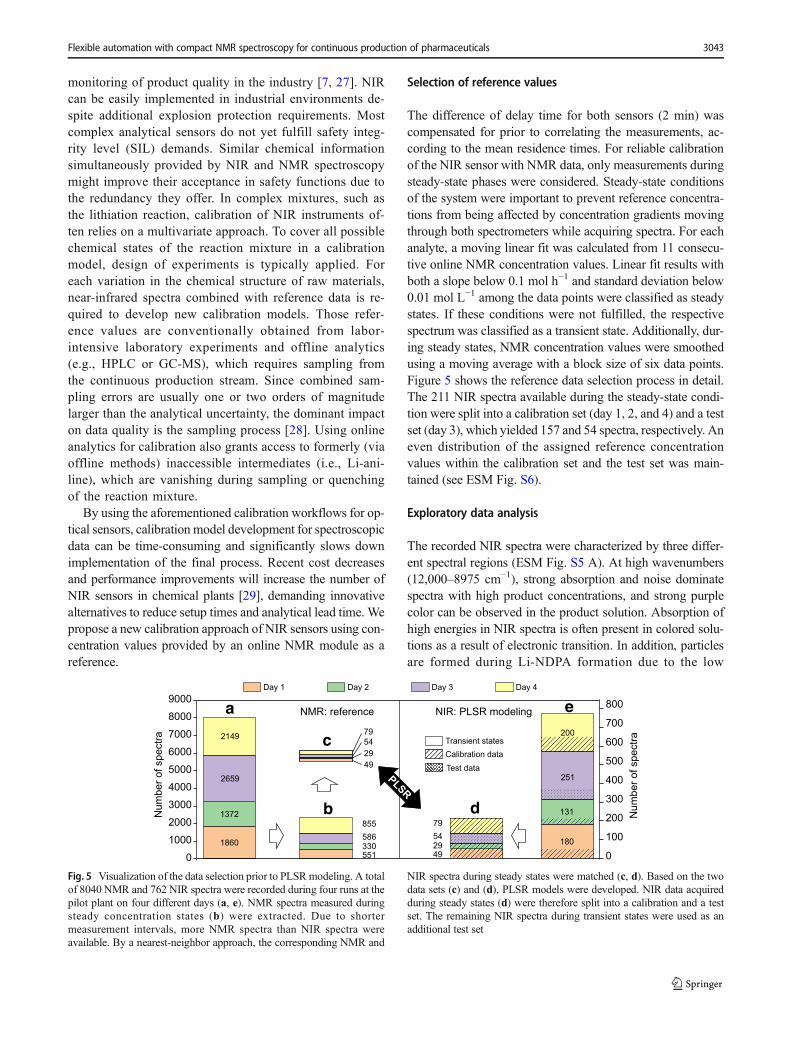
The difference of delay time for both sensors (2 min) wascompensated for prior to correlating the measurements, ac-cording to the mean residence times. For reliable calibrationof the NIR sensor with NMR data, only measurements duringsteady-state phases were considered. Steady-state conditionsof the system were important to prevent reference concentra-tions from being affected by concentration gradients movingthrough both spectrometers while acquiring spectra. For eachanalyte, a moving linear fit was calculated from 11 consecu-tive online NMR concentration values. Linear fit results withboth a slope below 0.1 mol h−1 and standard deviation below0.01 mol L−1 among the data points were classified as steadystates. If these conditions were not fulfilled, the respectivespectrum was classified as a transient state. Additionally, dur-ing steady states, NMR concentration values were smoothedusing a moving average with a block size of six data points.Figure 5 shows the reference data selection process in detail.The 211 NIR spectra available during the steady-state condi-tion were split into a calibration set (day 1, 2, and 4) and a testset (day 3), which yielded 157 and 54 spectra, respectively. Aneven distribution of the assigned reference concentrationvalues within the calibration set and the test set was main-tained (see ESM Fig. S6).
Exploratory data analysis
The recorded NIR spectra were characterized by three differ-ent spectral regions (ESM Fig. S5 A). At high wavenumbers(12,000–8975 cm−1), strong absorption and noise dominatespectra with high product concentrations, and strong purplecolor can be observed in the product solution. Absorption ofhigh energies in NIR spectra is often present in colored solu-tions as a result of electronic transition. In addition, particlesare formed during Li-NDPA formation due to the low
0
1000
2000
3000
4000
5000
6000
7000
8000
9000
art
ce
ps f
o r
eb
mu
N
0
100
200
300
400
500
600
700
800
art
ce
ps f
o r
eb
mu
N
1860
1372
2149
551
330
586
855
49
54
29
79 200
131
180
49
29
54
79
NMR: reference
2659 251
a
b
c
d
eDay 4Day 3Day 2Day 1
Calibration data
Test data
Transient states
NIR: PLSR modeling
PLSR
Fig. 5 Visualization of the data selection prior to PLSRmodeling. A totalof 8040 NMR and 762 NIR spectra were recorded during four runs at thepilot plant on four different days (a, e). NMR spectra measured duringsteady concentration states (b) were extracted. Due to shortermeasurement intervals, more NMR spectra than NIR spectra wereavailable. By a nearest-neighbor approach, the corresponding NMR and
NIR spectra during steady states were matched (c, d). Based on the twodata sets (c) and (d), PLSR models were developed. NIR data acquiredduring steady states (d) were therefore split into a calibration and a testset. The remaining NIR spectra during transient states were used as anadditional test set
Flexible automation with compact NMR spectroscopy for continuous production of pharmaceuticals 3043
solubility of LiF in THF. Despite the presence of a filter sec-tion, small particles (< 30 μm) are a possible source of lightscattering. Additional noise is present at the lower energy limitof the spectra (4611–4000 cm−1). The central region (8957–4611 cm−1) is feasible for quantitative analysis.
Multivariate data analysis
For quantitative prediction of each of the four analytes (ani-line, o-FNB, Li-NDPA, and Li-aniline), partial least squaresregression (PLSR) was performed. At first, PLSR models forpooled spectral data of runs occurring on day 1, day 2, and day4 were optimized by cross-validation over 20 randomly cho-sen segments. PLSR models were calculated for all analytesseparately using the resulting RMSE of cross-validation (cf.Table 2) as a figure of merit for model optimization. Amongthe mathematical pretreatments tested [30], the best resultswere obtained with standard normal variate (SNV) trans-formed spectra in the range of 8957–4611 cm−1 as an initialstep for aniline, Li-NDPA, and the lithiated aniline species.
For o-FNB, a baseline correction in the range 6307–5995 cm−1 using a third-order polynomial yielded best results.For aniline and Li-aniline, the performance of the PLSR mod-el was further improved by selecting characteristic absorptionfeatures followed by an additional baseline correction bysubtracting either a second-order polynomial or a constantoffset (see ESM Fig. S5 and Table S1). Unlike the threeanalytes mentioned, for Li-NDPA, the entire spectral rangewas evaluated.
The optimized PLSR models were validated using the re-maining data set (day 3) which was not part of the calibrationdata. The resulting RMSE for the test set were close to thoseobtained by random cross-validation (Table 2). Moreover, asystematic cross-validation over all four batches was per-formed yielding comparable RMSE values indicating highreproducibility among the runs tested.
Quantitative results
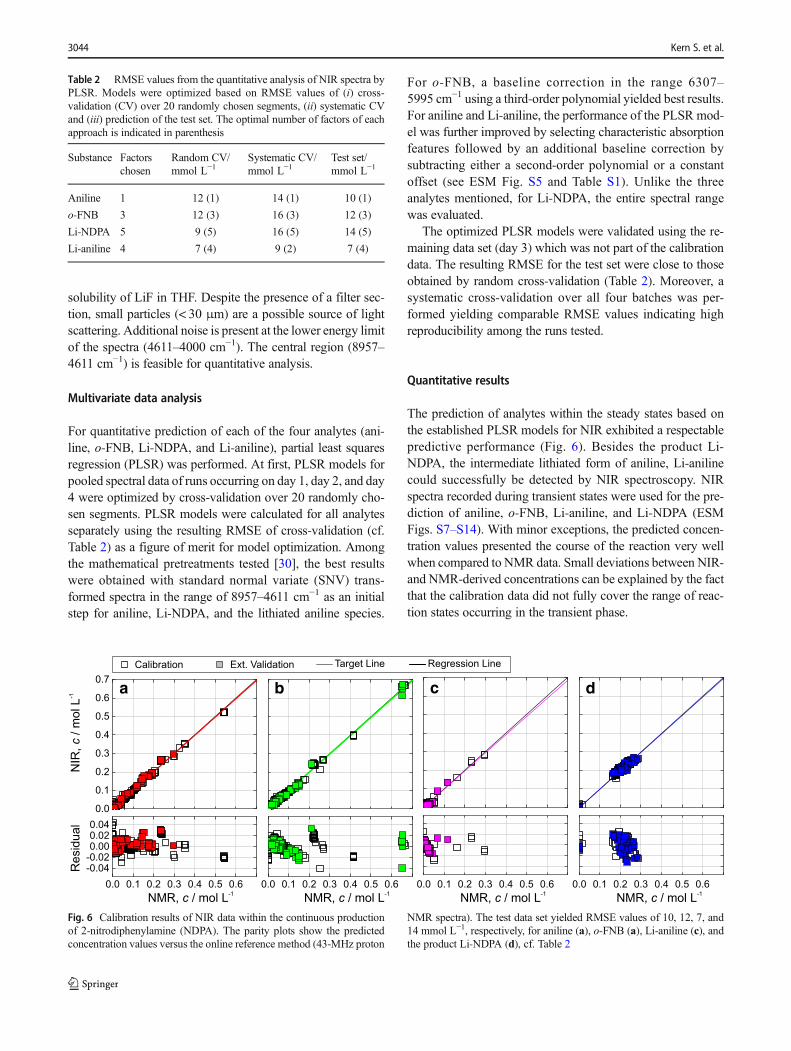
The prediction of analytes within the steady states based onthe established PLSR models for NIR exhibited a respectablepredictive performance (Fig. 6). Besides the product Li-NDPA, the intermediate lithiated form of aniline, Li-anilinecould successfully be detected by NIR spectroscopy. NIRspectra recorded during transient states were used for the pre-diction of aniline, o-FNB, Li-aniline, and Li-NDPA (ESMFigs. S7–S14). With minor exceptions, the predicted concen-tration values presented the course of the reaction very wellwhen compared to NMR data. Small deviations between NIR-and NMR-derived concentrations can be explained by the factthat the calibration data did not fully cover the range of reac-tion states occurring in the transient phase.
Table 2 RMSE values from the quantitative analysis of NIR spectra byPLSR. Models were optimized based on RMSE values of (i) cross-validation (CV) over 20 randomly chosen segments, (ii) systematic CVand (iii) prediction of the test set. The optimal number of factors of eachapproach is indicated in parenthesis
Substance Factorschosen
Random CV/mmol L−1
Systematic CV/mmol L−1
Test set/mmol L−1
Aniline 1 12 (1) 14 (1) 10 (1)
o-FNB 3 12 (3) 16 (3) 12 (3)
Li-NDPA 5 9 (5) 16 (5) 14 (5)
Li-aniline 4 7 (4) 9 (2) 7 (4)
Calibration Ext. Validation Target Line Regression Line
0.0 0.1 0.2 0.3 0.4 0.5 0.6
NMR, / mol Lc-1
0.0 0.1 0.2 0.3 0.4 0.5 0.6
NMR, / mol Lc-1
0.0 0.1 0.2 0.3 0.4 0.5 0.6
NMR, / mol Lc-1
0.0
0.1
0.2
0.3
0.4
0.5
0.6
0.7
0.0 0.1 0.2 0.3 0.4 0.5 0.6
-0.04
-0.02
0.00
0.02
0.04
NMR, / mol Lc-1
NIR
,/
mo
l L
c-1
Re
sid
ua
l
ba c d
Fig. 6 Calibration results of NIR data within the continuous productionof 2-nitrodiphenylamine (NDPA). The parity plots show the predictedconcentration values versus the online reference method (43-MHz proton
NMR spectra). The test data set yielded RMSE values of 10, 12, 7, and14 mmol L−1, respectively, for aniline (a), o-FNB (a), Li-aniline (c), andthe product Li-NDPA (d), cf. Table 2
3044 Kern S. et al.
The largest contribution to the observed uncertainty origi-nates from the reference data (low-field NMR, 43 MHz,Table 1), as is known from the validation of the presentedNMR module by high-field NMR spectroscopy at 500 MHz[19]. The RMSE values obtained during this validation cam-paign represent the deviation of the low-field from the high-field NMR data and range from 12 mmol L−1 for Li-NDPA to16 mmol L−1 for aniline. In fact, the RMSE values obtainedfrom systematic cross-validation of NIR spectra are in thesame order of magnitude suggesting a successful calibrationtransfer between both methods.
Conclusion
An explosion-proof online NMR sensor with sampling ratesof 15 s was used to monitor the chemical composition of theproduct stream of a metal-organic reaction in a pharmaceuticalpilot plant. The applied modularized data evaluation approachrequires only NMR spectra of the pure components as spectralmodel input. Absolute quantification was achieved in the pilotplant by one-point calibration based on a known raw materialconcentration. This method tremendously reduces set-uptimes of the NMR module. A quick adaption to new productscan be realized by exchanging the spectral models accordingto the altered chemistry.
Concentration values provided by the online NMR sensorwere utilized for iterative optimization of the plant perfor-mance. This approach has driven the process quickly to itseconomic optimum using a simple process model. Thescheme adapted autonomously to a sudden change of feedcomposition which was not measured. In addition, the NMRsensor was successfully used as an online reference methodfor the calibration of a NIR spectrometer. Unstable lithiatedintermediates, which could not be calibrated using conven-tional offline analytical methods like HPLC, were accessibleusing the online NMR sensor. Quantitative NMR spectrosco-py carried out with compact instruments has the potential tosubstitute offline laboratory analysis for calibration purposesby delivering quantitative reference data as an online method.However, the accuracy of NIR predictions is limited by theaccuracy of the NMR reference values.
It is to be expected that the accuracy of the NMR sensorprototype will increase due to current device developmentsfocusing on increasing magnetic field strengths and improvedline shape specifications. Online NMR spectroscopy extendsthe capabilities for measuring compositions to completelynew application areas where existing technologies (NIR,Raman, UV/VIS, etc.) cannot be applied due to a lack ofreference data. The online NMR sensor supports a very flex-ible operation of multi-product plants and model-based con-trol already in the launching phase of new products.
Acknowledgments We thank Alfons Steil (AGT-PSG) for technical im-plementation of the NMR instrument and Dirk Engel and ClemensMinnich (both S-PACT) for software support regarding Indirect HardModeling. We thank Ingo Nannen and Marjan Krizan (both KROHNEInnovation) for their support in testing the OPC UA communication. Wealso thank Martin Gerlach for conceptualization and funding acquisitionwithin the CONSENS project.
Funding information We acknowledge the financial support ofCONSENS by the European Union’s Horizon 2020 research and innova-tion program under grant agreement No. 636942.
Data availability The data reported in this paper are available in thearticle and the supplementary materials, as well as in a public data repos-itory (https://doi.org/10.5281/zenodo.1438233).
Compliance with ethical standards
Conflict of interest The authors declare that they have no competinginterests.
Open Access This article is distributed under the terms of the CreativeCommons At t r ibut ion 4 .0 In te rna t ional License (h t tp : / /creativecommons.org/licenses/by/4.0/), which permits unrestricted use,distribution, and reproduction in any medium, provided you giveappropriate credit to the original author(s) and the source, provide a linkto the Creative Commons license, and indicate if changes were made.
References
1. Poechlauer P, Colberg J, Fisher E, Jansen M, Johnson MD, KoenigSG, et al. Pharmaceutical roundtable study demonstrates the valueof continuous manufacturing in the design of greener processes.Org Process Res Dev. 2013;17(12):1472–8. https://doi.org/10.1021/op400245s.
2. Gutmann B, Cantillo D, Kappe CO. Continuous-flow technology-atool for the safe manufacturing of active pharmaceutical ingredi-ents. AngewChem Int Ed Engl. 2015;54(23):6688–728. https://doi.org/10.1002/anie.201409318.
3. Laue S, Haverkamp V, Mleczko L. Experience with scale-up oflow-temperature organometallic reactions in continuous flow. OrgProcess Res Dev. 2016;20(2):480–6. https://doi.org/10.1021/acs.oprd.5b00183.
4. Adamo A, Beingessner RL, Behnam M, Chen J, Jamison TF,Jensen KF, et al. On-demand continuous-flow production of phar-maceuticals in a compact, reconfigurable system. Science.2016;352(6281):61–7. https://doi.org/10.1126/science.aaf1337.
5. Bédard A-C, Adamo A, Aroh KC, Russell MG, Bedermann AA,Torosian J, et al. Reconfigurable system for automated optimizationof diverse chemical reactions. Science. 2018;361(6408):1220–5.https://doi.org/10.1126/science.aat0650.
6. Lee SL, O’Connor TF, Yang X, Cruz CN, Chatterjee S, MaduraweRD, et al. Modernizing pharmaceutical manufacturing: from batchto continuous production. J Pharm Innov. 2015;10(3):191–9.https://doi.org/10.1007/s12247-015-9215-8.
7. Simon LL, Pataki H, Marosi G, Meemken F, Hungerbühler K,Baiker A, et al. Assessment of recent process analytical technology(PAT) trends: a multiauthor review. Org Process Res Dev.2015;19(1):3–62. https://doi.org/10.1021/op500261y.
8. Chanda A, Daly AM, Foley DA, LaPack MA, Mukherjee S, OrrJD, et al. Industry perspectives on process analytical technology:tools and applications in API development. Org Process Res Dev.2014;19(1):63–83. https://doi.org/10.1021/op400358b.
Flexible automation with compact NMR spectroscopy for continuous production of pharmaceuticals 3045
9. Gouveia FF, Rahbek JP, Mortensen AR, Pedersen MT, FelizardoPM, Bro R, et al. Using PAT to accelerate the transition to contin-uous API manufacturing. Anal Bioanal Chem. 2017;409(3):821–32. https://doi.org/10.1007/s00216-016-9834-z.
10. Meyer K, Kern S, Zientek N, Guthausen G, Maiwald M. Processcontrol with compact NMR. Trends Anal Chem. 2016;83:39–52.https://doi.org/10.1016/j.trac.2016.03.016.
11. Singh K, Blümich B. NMR spectroscopy with compact instru-ments. Trends Anal Chem. 2016;83:12–26. https://doi.org/10.1016/j.trac.2016.02.014.
12. Zientek N, Laurain C, Meyer K, Paul A, Engel D, Guthausen G,et al. Automated data evaluation and modelling of simultaneous19F–1H medium-resolution NMR spectra for online reaction mon-itoring. Magn Reson Chem. 2016;54(6):513–20. https://doi.org/10.1002/mrc.4216.
13. Sans V, Porwol L, Dragone V, Cronin L. A self optimizing syntheticorganic reactor system using real-time in-line NMR spectroscopy.Chem Sci. 2015;6(2):1258–64. https://doi.org/10.1039/C4SC03075C.
14. Granda JM, Donina L, Dragone V, Long D-L, Cronin L.Controlling an organic synthesis robot with machine learning tosearch for new reactivity. Nature. 2018;559(7714):377–81.https://doi.org/10.1038/s41586-018-0307-8.
15. Bieringer T, Buchholz S, Kockmann N. Future production conceptsin the chemical industry: modular – small-scale – continuous. ChemEng Technol. 2013;36(6):900–10. https://doi.org/10.1002/ceat.201200631.
16. Mazet V, Carteret C, Brie D, Idier J, Humbert B. Background re-moval from spectra by designing and minimising a non-quadraticcost function. Chemom Intell Lab Syst. 2005;76(2):121–33. https://doi.org/10.1016/j.chemolab.2004.10.003.
17. Chen L, Weng Z, Goh L, Garland M. An efficient algorithm forautomatic phase correction of NMR spectra based on entropy min-imization. J Magn Reson. 2002;158(1):164–8. https://doi.org/10.1016/S1090-7807(02)00069-1.
18. Savorani F, Tomasi G, Engelsen SB. icoshift: a versatile tool for therapid alignment of 1D NMR spectra. J Magn Reson. 2010;202(2):190–202. https://doi.org/10.1016/j.jmr.2009.11.012.
19. Kern S, Meyer K, Guhl S, Gräßer P, Paul A, King R, et al. Onlinelow-field NMR spectroscopy for process control of an industriallithiation reaction—automated data analysis. Anal Bioanal Chem.2018;410(14):3349–60. https://doi.org/10.1007/s00216-018-1020-z.
20. Marchetti A, François G, Faulwasser T, Bonvin D. Modifier adap-tation for real-time optimization—methods and applications.Processes. 2016;4(4):55. https://doi.org/10.3390/pr4040055.
21. Tatjewski P. Iterative optimizing set-point control – the basic prin-ciple redesigned. IFAC ProcVol. 2002;35(1):49–54. https://doi.org/10.3182/20020721-6-ES-1901.00994.
22. Gao W, Engell S. Iterative set-point optimization of batch chroma-tography. Comput Chem Eng. 2005;29(6):1401–9. https://doi.org/10.1016/j.compchemeng.2005.02.035.
23. Gao W,Wenzel S, Engell S. A reliable modifier-adaptation strategyfor real-time optimization. Comput Chem Eng. 2016;91:318–28.https://doi.org/10.1016/j.compchemeng.2016.03.019.
24. Kriesten E, Alsmeyer F, Bardow A, Marquardt W. Fully automatedindirect hard modeling of mixture spectra. Chemom Intell Lab Syst.2008;91(2):181–93. https://doi.org/10.1016/j.chemolab.2007.11.004.
25. Alsmeyer F, Koß H-J, Marquardt W. Indirect spectral hard model-ing for the analysis of reactive and interacting mixtures. ApplSpectrosc. 2004;58(8):975–85. https://doi.org/10.1366/0003702041655368.
26. Michalik-Onichimowska A, Kern S, Riedel J, Panne U, King R,Maiwald M. BClick^ analytics for Bclick^ chemistry – a simplemethod for calibration–free evaluation of online NMR spectra. JMagn Reson. 2017;277:154–61. https://doi.org/10.1016/j.jmr.2017.02.018.
27. De Beer T, Burggraeve A, Fonteyne M, Saerens L, Remon JP,Vervaet C. Near infrared and Raman spectroscopy for the in-process monitoring of pharmaceutical production processes. Int JPharm. 2011;417(1):32–47. https://doi.org/10.1016/j.ijpharm.2010.12.012.
28. Esbensen KH, Paasch-Mortensen P. Process sampling: theory ofsampling - the missing link in process analytical technologies(PAT). In: Bakeev KA, editor. Process analytical technology.Oxford: Wiley; 2010. p. 37–80.
29. Pasquini C. Near infrared spectroscopy: a mature analytical tech-nique with new perspectives – a review. Anal Chim Acta.2018;1026:8–36. https://doi.org/10.1016/j.aca.2018.04.004.
30. Rinnan Å, Berg FVD, Engelsen SB. Review of the most commonpre-processing techniques for near-infrared spectra. Trends AnalChem. 2009;28(10):1201–22. https://doi.org/10.1016/j.trac.2009.07.007.
Publisher’s note Springer Nature remains neutral with regard to jurisdic-tional claims in published maps and institutional affiliations.
3046 Kern S. et al.