Embed Size (px)
Citation preview

1 | 20171 | 20172019|1
FLEX LNG Ltd.April 2019

2 | 20172 | 20172019|2
• THIS PRESENTATION (THE “PRESENTATION”) HAS BEEN PRODUCED BY FLEX LNG LTD. ("FLEX LNG" OR "THE COMPANY”), SOLELY FOR PRESENTATIONPURPOSES AND DOES NOTPURPORTE TO GIVE A COMPLETE DESCRIPTION OF THE COMPANY, ITS BUSINESS OR ANY OTHER MATTER DESCRIBED HEREIN.
• THE PRESENTATION DOES NOT CONSTITUTE AN OFFER, INVITATION OR SOLICITATION OF AN OFFER TO BUY, SUBSCRIBE OR SELL ANY SECURTIEIS. THIS PRESENTATION IS STRICTLYCONFIDENTIAL AND MAY NOT BE REPRODUCED OR REDISTRIBUTED, IN WHOLE OR IN PART, TO ANY OTHER PERSON.
• NO REPRESENTATION OR WARRANTY, EXPRESS OR IMPLIED, AS TO THE ACCURACY OR COMPLETENESS OF ANY INFORMATION INCLUDED HEREIN IS GIVEN BY THE COMPANY, AND THATNOTHING CONTAINED IN THIS PRESENTATION IS OR CAN BE RELIED UPON AS A PROMISE OR REPRESENTATION BY THE COMPANY, WHO DISCLAIM ALL AND ANY LIABILITY, WHETHERARISING IN TORT OR CONTRACT OR OTHERWISE.
• THE PRESENTATION SPEAKS AS OF THE DATE SET OUT ON ITS FRONT PAGE. THE COMPANY DOES NOT INTEND TO, OR WILL ASSUME ANY OBLIGATION TO, UPDATE THE PRESENTATIONOR ANY OF THE INFORMATION INCLUDED HEREIN.
• THE CONTENTS OF THE PRESENTATION ARE NOT TO BE CONSTRUED AS FINANCIAL, LEGAL, BUSINESS, INVESTMENT, TAX OR OTHER PROFESSIONALADVICE. EACH RECIPIENT SHOULDCONSULT WITH ITS OWN PROFESSIONAL ADVISORS FOR ANY SUCH MATTER AND ADVICE.
• AN INVESTMENT IN THE COMPANY INVOLVES RISK, AND SEVERAL FACTORS COULD CAUSE THE ACTUAL RESULTS, PERFORMANCE OR ACHIEVEMENTS OF THE COMPANY TO BEMATERIALLY DIFFERENT FROM ANY FUTURE RESULTS, PERFORMANCE OR ACHIEVEMENTS THAT MAY BE EXPRESSED OR IMPLIED BY STATEMENTS AND INFORMATION IN THISPRESENTATION.
• THE PRESENTATION CONTAINS CERTAIN FORWARD-LOOKING STATEMENTS RELATING TO THE BUSINESS, FINANCIAL PERFORMANCE AND RESULTS OF THE COMPANY AND/OR THEINDUSTRY IN WHICH IT OPERATES, SOMETIMES IDENTIFIED BY THE WORDS "BELIEVES”, "EXPECTS”, “INTENDS”, “PLANS”, “ESTIMATES” AND SIMILAR EXPRESSIONS. THE FORWARD-LOOKING STATEMENTS CONTAINED IN THIS PRESENTATION, INCLUDING ASSUMPTIONS, OPINIONS AND VIEWS OF THE COMPANY OR CITED FROM THIRD PARTY SOURCES, ARE SOLELYOPINIONS AND FORECASTS WHICH ARE SUBJECT TO RISKS, UNCERTAINTIES AND OTHER FACTORS THAT MAY CAUSE ACTUAL EVENTS TO DIFFER MATERIALLY FROM ANY ANTICIPATEDDEVELOPMENT. THE COMPANY DOES NOT PROVIDE ANY ASSURANCE THAT THE ASSUMPTIONS UNDERLYING SUCH FORWARD-LOOKING STATEMENTS ARE FREEFROM ERRORS NORDOES THE COMPANY ACCEPT ANY RESPONSIBILITY FOR THE FUTURE ACCURACY OF THE OPINIONS EXPRESSED IN THE PRESENTATION OR THE ACTUAL OCCURRENCE OF THEFORECASTED DEVELOPMENTS. NO OBLIGATION IS ASSUMED TO UPDATE ANY FORWARD-LOOKING STATEMENTS OR TO CONFORM THESE FORWARD-LOOKING STATEMENTS TO ACTUALRESULTS.
• THIS PRESENTATION IS SUBJECT TO NORWEGIAN LAW, AND ANY DISPUTE ARISING IN RESPECT OF THIS PRESENTATION IS SUBJECT TO THE EXCLUSIVE JURISDICTION OF THENORWEGIAN COURTS.
Disclaimer

3 | 20173 | 20172019|3
Introduction

4 | 20174 | 20172019|4
Investment HighlightsBrand New Fleet of 13 5th Gen. LNGC
Trading: 4 | On Order: 9
Unparalleled spot exposure
Geared to benefit growing LNG trade Favorable Unit Cost - US$ / MMBtu
-
0,50
1,00
1,50
2,00
2,50
138 ST (2nd Gen) 160k TFDE 174k SS-2S
Fuel Costs Boil-Off Port Charges Canal Fees Charter Hire
Source: Fearnleys, Bloomberg and Company
Play on Coal to Natural Gas switch29 %
71 %
Open Contracted

5 | 20175 | 20172019|5
Operating philosophy
• Keep it simple and focused• Lean & efficient management teams• Define where we are in the cycle• Consolidation & economy of scale works• Build credibility with customers, investors & financiers• Think and act like an investor• Solid cash position at holding company
Seatankers – a Marine Powerhouse
65
124
40
13 14 15
0
20
40
60
80
100
120
140
Tankers Dry Bulk Box Ships LNG LPG Other
271 Units
34 Million DWT

6 | 20176 | 20172019|6
Market for seaborne LNG transport is maturing
• 1960s to mid 2000s• Traditional liner model (P2P)• Back2back contracts 20yr+• Steam vessels ( 180tpd)• Leverage: 80-100%• Utility business• Libor spread yield
LNG 1.0 LNG 2.0 LNG 3.0
• Mid-2000s – about now• Portfolio players• Term contracts (7-15yr)• DFDE/TFDE vessels ( 135tpd)• Leverage: 70-80%• MLP business• MLP yield
• The way of the future• Commoditization of LNG• Short and medium term contracts• Two-stroke low-speed ( 100tpd)• Leverage: 50-75%• Capital market business• ROCE
2010: 200MMtpa2000: 100MMtpa 2020: 400MMtpa
Yearly liquefaction capacity:
7 | 20177 | 20172019|7
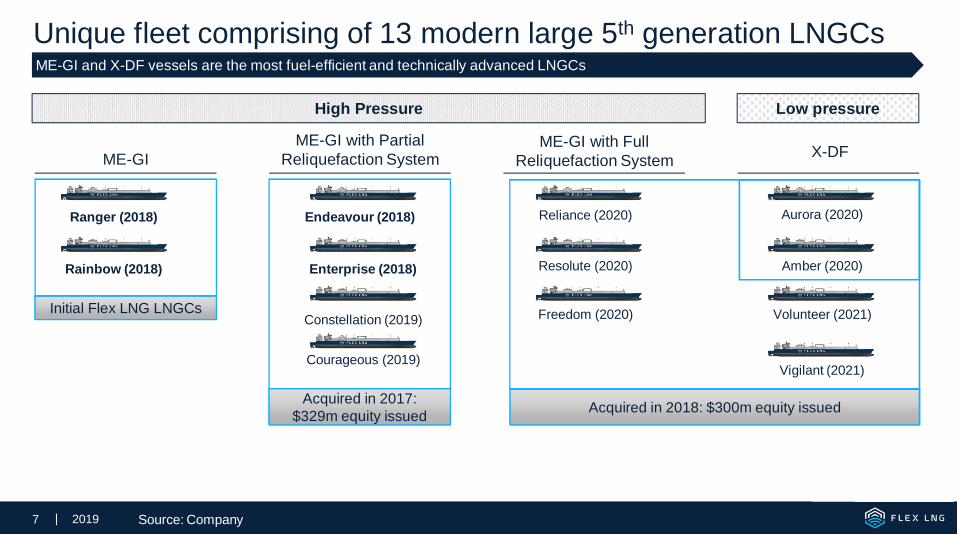
Unique fleet comprising of 13 modern large 5th generation LNGCs
ME-GI X-DFME-GI with FullReliquefaction System
ME-GI with PartialReliquefaction System
High Pressure Low pressure
Endeavour (2018)
Courageous (2019)
Freedom (2020)
Vigilant (2021)
ME-GI and X-DF vessels are the most fuel-efficient and technically advanced LNGCs
Source: Company
Enterprise (2018)
Ranger (2018)
Rainbow (2018)
Constellation (2019)
Resolute (2020)
Reliance (2020) Aurora (2020)
Amber (2020)
Volunteer (2021)Initial Flex LNG LNGCs
Acquired in 2017:$329m equity issued Acquired in 2018: $300m equity issued

8 | 20178 | 20172019|8
The LNG Market

9 | 20179 | 20172019|9
LNG Market Growing
250
450
650
850
1050
1250
1450
-
50
100
150
200
250
300
350
World Seaborne LNG Trade MT World Seaborne LNG Trade (Billion Tonne Miles)
MT
BillionTon-m
iles
Source: Clarkson

10 | 201710 | 20172019|10
Major LNG Flows in 2018
020406080100
Japan
China
South Korea
India
Taiwan
Spain
France
Turkey
Pakistan
Italy
Top 10 LNG Importers
0 20 40 60 80 100
Qatar
Australia
Malaysia
United States
Nigeria
Russian Federation
Indonesia
Trinidad and Tobago
Algeria
Oman
Top 10 LNG Exporters
Source: KPLER and Company
MT/year

11 | 201711 | 20172019|11
Glut of LNG coming to the market
Source: Bloomberg, KPLER and Company
Year on Year Change LNG Export Volumes Post FID AND Likely LNG Export Projects
0
100
200
300
400
500
600
2008
2009
2010
2011
2012
2013
2014
2015
2016
2017
2018
2019
2020
2021
2022
2023
2024
2025
2026
2027
2028
2029
2030
North America Other Russia AfricaIndonesia Malaysia Australia Qatar
Mmtpa
(10)
(5)
-
5
10
15
20
25
30
35
40
2019 2020 2021 2022 2023 2024 2025
Other
NorthAmericaRussia
Africa
Indonesia
Malaysia
Australia
Qatar
Mmtpa-Post FID

12 | 201712 | 20172019|12
LNG rates and regional prices
0
4
8
12
16
20
Dec-
15
Feb-
16
Apr-
16
Jun-
16
Aug-
16
Oct
-16
Dec-
16
Feb-
17
Apr-
17
Jun-
17
Aug-
17
Oct
-17
Dec-
17
Feb-
18
Apr-
18
Jun-
18
Aug-
18
Oct
-18
Dec-
18
Feb-
19
ARB - US -> Asia Henry HUB US
Delivered Asia NBP Europe
$ / Mmbtu
Estimated weekly average LNGC spot rates Natural Gas Prices by Region and Arbitrage US -> Asia
Source: Bloomberg
-
50 000
100 000
150 000
200 000
250 000
Dec-
15
Feb-
16
Apr-
16
Jun-
16
Aug-
16
Oct
-16
Dec-
16
Feb-
17
Apr-
17
Jun-
17
Aug-
17
Oct
-17
Dec-
17
Feb-
18
Apr-
18
Jun-
18
Aug-
18
Oct
-18
Dec-
18
Feb-
19
Spot $/Day
LNG 145K CBM Spot (Steam) LNG 160K CBM (TFDE) DF-2S
13 | 201713 | 20172019|13
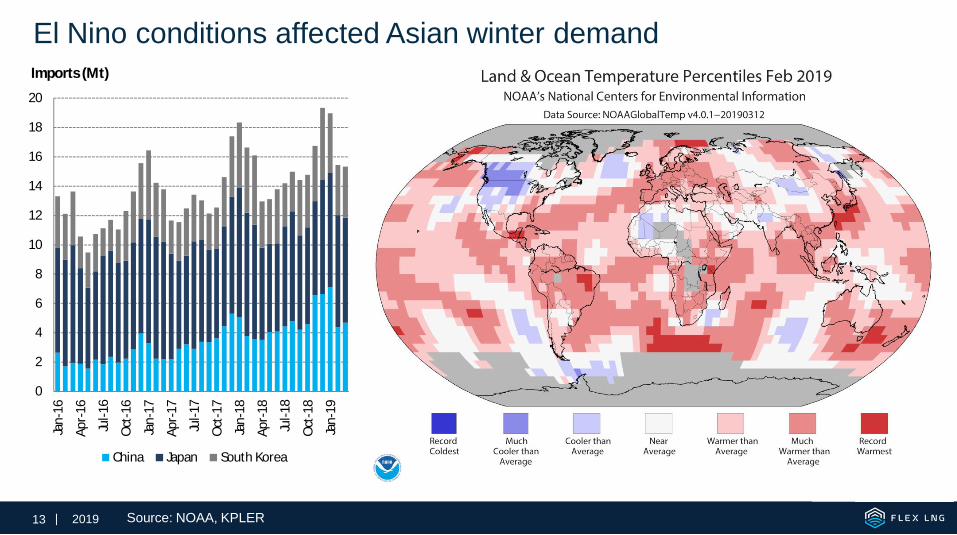
El Nino conditions affected Asian winter demand
Source: NOAA, KPLER
0
2
4
6
8
10
12
14
16
18
20
Jan-
16
Apr-
16
Jul-1
6
Oct
-16
Jan-
17
Apr-
17
Jul-1
7
Oct
-17
Jan-
18
Apr-
18
Jul-1
8
Oct
-18
Jan-
19
Imports (Mt)
China Japan South Korea

14 | 201714 | 20172019|14
Fleet Supply

15 | 201715 | 20172019|15
• We have registered 100 LNGC orders for delivery in the period until 2021 including 5 Arc 7 LNGCs
• About 27 vessels in total scheduled for delivery in 2019 as 14 vessels delivered so far in Q1
• Very limited open vessels before mid-2020
• Increased sailing distances supportive of LNGC demand
Few available vessels before 2020Order book for large LNG carriers Average sailing distances (laden)
Source: Fearnleys, Clarksons, DNB and Company
3 600
3 800
4 000
4 200
4 400
4 600
4 800
Nau
tical
Mile
s
1 1 1
5 5 6
12
86
25
96
43
9
4
6
1
2
2
1
0
2
4
6
8
10
12
14
16
Qtr1 Qtr2 Qtr3 Qtr4 Qtr1 Qtr2 Qtr3 Qtr4 Qtr1 Qtr2 Qtr3 Qtr4
2019 2020 2021
Committed Open
#Ve
ssel
s

16 | 201716 | 20172019|16
# of Vessels needed to deliver 1 MT of LNGgradually increasing as especially US andNorthern Russia (winter) volume grows.2018/2019 the multiplier is expected to increaseby 2,5%, absolute volume by 9%, fleet by ~10%
Tonnage demand by key LNG export areas
~1,4 x Vsl~2,2 x Vsl
~1,5 x Vsl
~2,2 x Vsl
~0,8 x Vsl
~1,2 x Vsl
Source: Poten, Kpler and Company
2018
New Export MT
2019ENew % split
SupplyCountry / Region % of Supply Multiplier Vessel DemandAfrica 10 % 1,46 0,70 9 %Australia 22 % 1,16 10,5 12,2 21 %Qatar 24 % 1,39 23 %South East Asia 15 % 0,83 14 %U.S. 7 % 2,19 15,0 32,9 10 %Row 22 % 1,50 7,0 15,4 23 %Volume weighted multiplier 1,34 33,2 60 1,37
15%
74%
10%11%
54%35%
Americas Asia/Middle East Europe
US LNG destination
Q4-17 Q4-18

17 | 201717 | 20172019|17
Appendix

18 | 201718 | 20172019|18
Income Statement
• Revenues of $36.1m in line with guidance of approx. $35m implying fleet TCE of about $95kpdr and spot earnings of
about $130kpdr
• Increased revenues due to burgeoning spot marked, with all-time high charter rates reported
• Net income of $15.2m and $11.8m for fourth quarter and full year 2018 respectively
Unaudited Figures in USD, 000 Q4 2018 Q3 2018 YTD 2018
Voyage revenues 36 101 19 008 77 209Voyage related costs -5 977 -5 167 -26 161Administrative expenses -1 781 -1 132 -4 639EBITDA 28 343 12 709 46 409Depreciation -6 872 -5 477 -17 412EBIT 21 471 7 232 28 997Finance income 283 72 607Finance cost -6 511 -6 124 -17 781Other financial items -17 -1 -54EBT 15 226 1 179 11 769Income tax 12 - 10Net Income (loss) 15 238 1 179 11 779

19 | 201719 | 20172019|19
• Balance sheet consist of four vessels on the water and nine newbuildings under construction
• Vessel purchase prepayments of $421m relates to the nine newbuildings
• Total interest bearing debt of $455m of which $23m is due next 12 months
• Equity ratio of 64% and very solid liquidity situation given availability of $270m Sterna RCF
Balance Sheet Unaudited Figures in USD, 000 YE 2018 YE 2017 YE 2018 YE 2017
Newbuildings and capitalized costs 0 594 937 Share capital 5 410 3 680Vessel purchase prepayment 421 472 72 000 Share premium 1 189 665 885 323Vessels 812 489 3 Other equity -367 751 -368 902Total non-current assets 1 233 961 666 940 Total equity 827 324 520 101
Other financial liabilities 431 602 160 000Total non-current liabilities 431 602 160 000
Inventory 915 1 041Other current assets 4 413 6 568 Current portion of long-term debt 23 365 0Cash and cash equivalents 55 097 9 961 Current liabilities 12 095 4 409Total current assets 60 425 17 570 Total current liabilities 35 460 4 409
Total liabilities 467 062 164 409TOTAL ASSETS 1 294 386 684 510 TOTAL EQUITY AND LIABILITIES 1 294 386 684 510

20 | 201720 | 20172019|20
Cashflow• Positive operational cashflow of about $23m and $ 34m for the fourth quarter
and 2018 respectively
• About $ 234m of newbuilding capex in connection with deliveries during 2018
• About $7m each for Flex Endeavour/Enterprise
• About $110m each for Flex Ranger/Rainbow
• Prepayment of $275m in connection with acquisition of five newbuildings inOctober 2018 in connection with the $300m private placement of new shares
• Raised $ 472.5m of external finance through bank loans and Rainbow SLBduring 2018
• Repaid Sterna RCF in full (outstanding $160m at beginning ofyear)
• Thus $270m is currently available under this facility
Unaudited Figures in USD, 000 Q4 2018 YTD 2018
Net Income (loss) 15 226 11 769Working capital adjustments 1 320 4 918Other non-cash items 6 839 17 392Net cash flow from operating 23 385 34 079Newbulding capex 1 010 -233 550Advanced payment for newbuilding assets -275 400 -349 000Net cash flow used in investing -274 390 -582 550Net proceeds from issue of shares 295 311 295 311Net proceeds from issuance of debt - 584 613Repayment of debt -5 906 -286 069Other 123 -248Net cash flow from financing 289 528 593 607
Net cash flow 38 523 45 136Cash balance at the beginning of period 16 574 9 961Cash balance at the end of period 55 097 55 097

21 | 201721 | 20172019|21
136100
125
306
020406080
100120140160
Averageremaning capex
Availableliquidity
Funding needper vessel
Bank leverage
Well capitalized for remaining newbuildings
728
918146275
1 225
0200400600800
1 0001 2001 4001 6001 800
Newbuilding capex Pre-paid capex Remaning capex
0 9 1827
3645
54
010
20304050
60
TCE50kpdr
TCE75kpdr
TCE100kpdr
TCE125kpdr
TCE150kpdr
TCE175kpdr
TCE200kpdr
$325m of available liquidity $421m of capex pre-paid
Leverage of $100-135m demonstrated And high FCF potential for our LNGCs
$m $m
$m pervessel
55
270325
050
100150200250300350
Cash 31.12.18 Sterna RCF availability Available liquidity
$m pervessel
22 | 201722 | 20172019|22
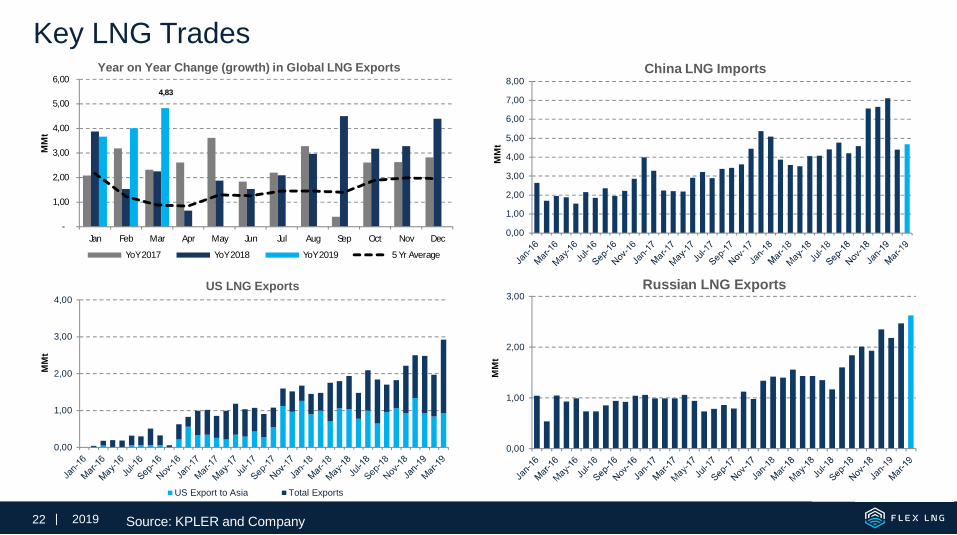
Key LNG Trades
4,83
-
1,00
2,00
3,00
4,00
5,00
6,00
Jan Feb Mar Apr May Jun Jul Aug Sep Oct Nov Dec
YoY 2017 YoY 2018 YoY 2019 5 Yr Average
Year on Year Change (growth) in Global LNG Exports
MM
t
0,00
1,00
2,00
3,00
4,00
5,00
6,00
7,00
8,00China LNG Imports
MM
t
0,00
1,00
2,00
3,00
4,00
US Export to Asia Total Exports
US LNG Exports
MM
t
0,00
1,00
2,00
3,00Russian LNG Exports
MM
t
Source: KPLER and Company
23 | 201723 | 20172019|23
Stay Cool !