Embed Size (px)
Citation preview
Fletcher Building Limited Private Bag 92114 Auckland 1142 810 Great South Road Penrose Auckland 1061 New Zealand
fletcherbuilding.com +64 9 525 9000
Fletcher Building Limited – 2021 Annual Results and Dividend
Auckland, 18 August 2021: Please find attached the following documents relating to Fletcher Building Limited’s full year results for the year ended 30 June 2021.
(a) News Release
(b) Results Announcement
(c) Investor Presentation
(d) Distribution Notice
The 2021 Annual Report is being loaded separately on ASX online and is also available to view on Fletcher Building website www.fletcherbuilding.com.
Dividend information filed on Appendix 3A.1 will follow.
Ends
Authorised by:
Chris Reid Company Secretary
For further information please contact:
MEDIA Christian May General Manger – Corporate Affairs +64 21 305 [email protected]
INVESTORS AND ANALYSTS Aleida White Head of Investor Relations +64 21 155 [email protected]
Fletcher Building Limited, Private Bag 92114, Auckland 1142, 810 Great South Road, Penrose, Auckland 1061, New Zealand
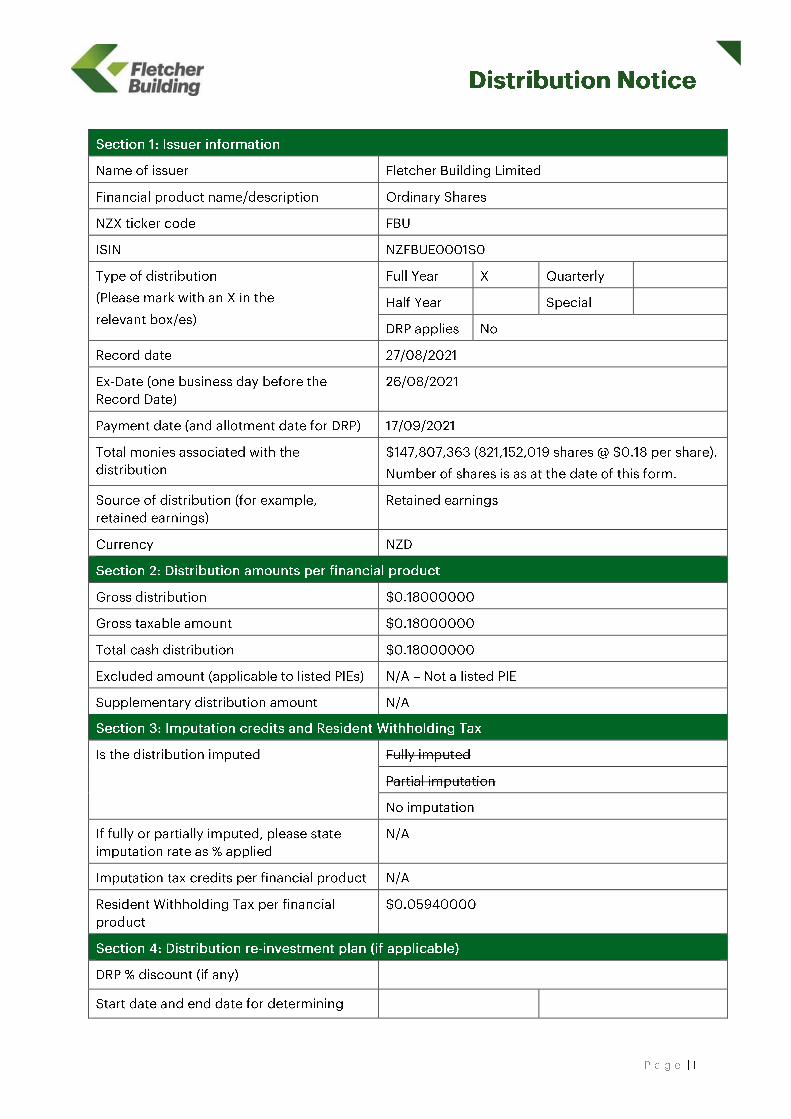
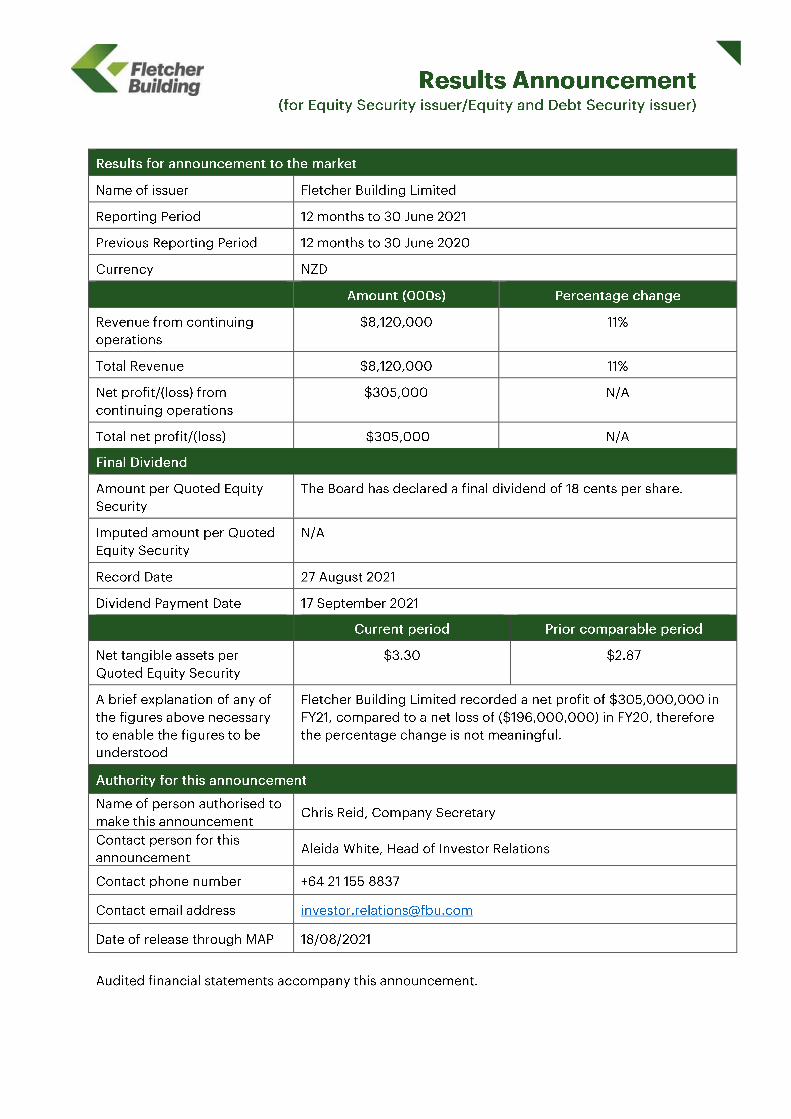
Fletcher Building delivers strong FY21 result, final dividend of 18 cps Auckland, 18 August 2021: Fletcher Building today announced its audited financial results for the year ended 30 June 2021 (FY21). Summary:
• Revenue of $8,120 million, up from $7,309 million in FY20 • Net Profit After Tax of $305 million, compared to a loss of $196 million in FY20 • EBIT before significant items of $669 million • Return on Funds Employed before significant items of 18.6% • Cash flows from operations of $889 million • Strong balance sheet with net debt of $173 million and liquidity of $1.6 billion • Final dividend 18 cents per share, bringing full-year FY21 dividend to 30 cps • On-market share buyback programme of up to NZ$300 million through to Jun-22
Chief executive Ross Taylor said: “Fletcher Building’s strong FY21 financial result reflects the significant work carried out over the past three years to reset and simplify the business. We are confident we have a sustainable base from which we can drive further performance improvements and growth. “FY21 saw increases across all our key financial metrics. EBIT before significant items of $669 million was ahead of our full-year guidance. EBIT margin of 8.2% and Return on Funds Employed of 18.6% were both materially higher than FY19 (our most recent comparable year). Cash flows from operating activities were very strong at $889 million, partially benefitting from low stock levels in our manufacturing and housing businesses, which we expect to rebuild through FY22. Our balance sheet finished the year in a strong position, with net debt of $173 million and $1.6 billion liquidity at 30 June 2021. Just after year end, we were pleased to reach an agreement to sell Rocla for AU$55 million. “Having delivered a strong earnings and cash flow result, the Board has approved a final dividend for the year ended 30 June 2021 of 18 cents per share (unimputed and unfranked) to be paid on 17 September 2021. Combined with the 12.0 cents per share interim dividend, this brings the total dividend to 30 cents per share for the FY21 year. Our share buyback programme of up to $300 million started in June and will continue through FY22. “We continue to make targeted investments to deliver on our strategy. This includes a mix of capital and operating spend, and remains focused in three areas: key maintenance investments, such as the new Winstone Wallboards plasterboard facility; initiatives which support our

P a g e | 2
sustainability ambition, such as the waste tyre recycling facility at our cement plant; and growth investments in product adjacencies and digital capabilities. Our focus on digital includes an acceleration of our programme to create a backbone system environment that is fit-for-purpose. “As we look ahead, we believe that the economic trends in our key markets remain supportive for further growth. In New Zealand, the activity pipeline continues to look ‘stronger for longer,’ especially in the residential sector. With ongoing supply chain and labour constraints having the effect of smoothing the recent sharp rises in building consents over a longer period, this is likely to mean an extended period of solid building activity through FY22 and beyond. In Australia, the residential outlook also remains resilient, particularly across detached housing and renovations, while the apartments, commercial and key civil sectors are likely to stabilise at current levels. “There does remain some uncertainty around the impact of COVID-19 on activity in our markets. We will continue to monitor and manage this closely. “Overall, the combination of a clear strategy, a favourable market outlook and a strong balance sheet means Fletcher Building is well-positioned to deliver future performance and growth. “Finally, there’s no doubt that the past year has seen many challenges and disruptions resulting from the global pandemic. Against this backdrop, I would like to thank our more than 14,500 people who have delivered this performance while remaining focused on supporting our customers and each other.” #Ends Authorised by Chris Reid Company Secretary
For further information please contact:
MEDIA Christian May General Manager – Corporate Affairs +64 21 305 398 [email protected]
INVESTORS AND ANALYSTS Aleida White Head of Investor Relations +64 21 155 8837 [email protected]

Fletcher Building Limited
Fletcher BuildingFull Year Results to30 June 2021
18 August 2021
Important Information
This presentation has been prepared by Fletcher Building Limited and its group of companies (“Fletcher Building”) for informational purposes. This disclaimer applies to thisdocument and the verbal or written comments of any person presenting it.
This presentation provides additional comment on the 2021 Financial Results dated 18 August 2021. As such, it should be read in conjunction with and subject to the explanationsand views given in that document. Unless otherwise specified, all information is for the year ended 30 June 2021.
In certain sections of this presentation, Fletcher Building has chosen to present certain financial information exclusive of the impact of significant items. A number of non-GAAPfinancial measures are used in this presentation which are used by management to assess the performance of the business and have been derived from Fletcher Building’s financialstatements for the 12 months ended 30 June 2021. You should not consider any of these statements in isolation from, or as a substitute for the information provided in theFinancial Statements for the 12 months ended 31 December 2021, which are available at www.fletcherbuilding.com.
The information in this presentation has been prepared by Fletcher Building with due care and attention, however, neither Fletcher Building nor any of its directors, employees,shareholders nor any other person given any representations or warranties (either express or implied) as to the accuracy or completeness of the information and to the maximumextent permitted by law, no such person shall have any liability whatsoever to any person for any loss (including, without limitation, arising from any fault or negligence) arisingfrom this presentation or any information supplied in connection with it.
This presentation may contain forward looking statements, that is statements related to future, not past, events or other matters. Forward looking statements may includestatements regarding our intent, belief or current expectations in connection with our future operating or financial performance, or market conditions. Such forward lookingstatements are based on current expectations, estimates and assumptions and are subject to a number of risks and uncertainties, including material adverse events, significant one-off expenses and other unforeseeable circumstances. There is no assurance that results contemplated in any of these projections and forward looking statements will berealised. Actual results may differ materially from those projected. Except as required by law, or the rules of any relevant stock exchange or listing authority, no person is under anyobligation to update this presentation at any time after its release or to provide further information about Fletcher Building.
The information in this presentation does not constitute financial product, legal, financial, investment, tax or any other advice or a recommendation.
Page 2 | Fletcher Building Limited Full Year Results Presentation | © August 2021
Fletcher Building Limited
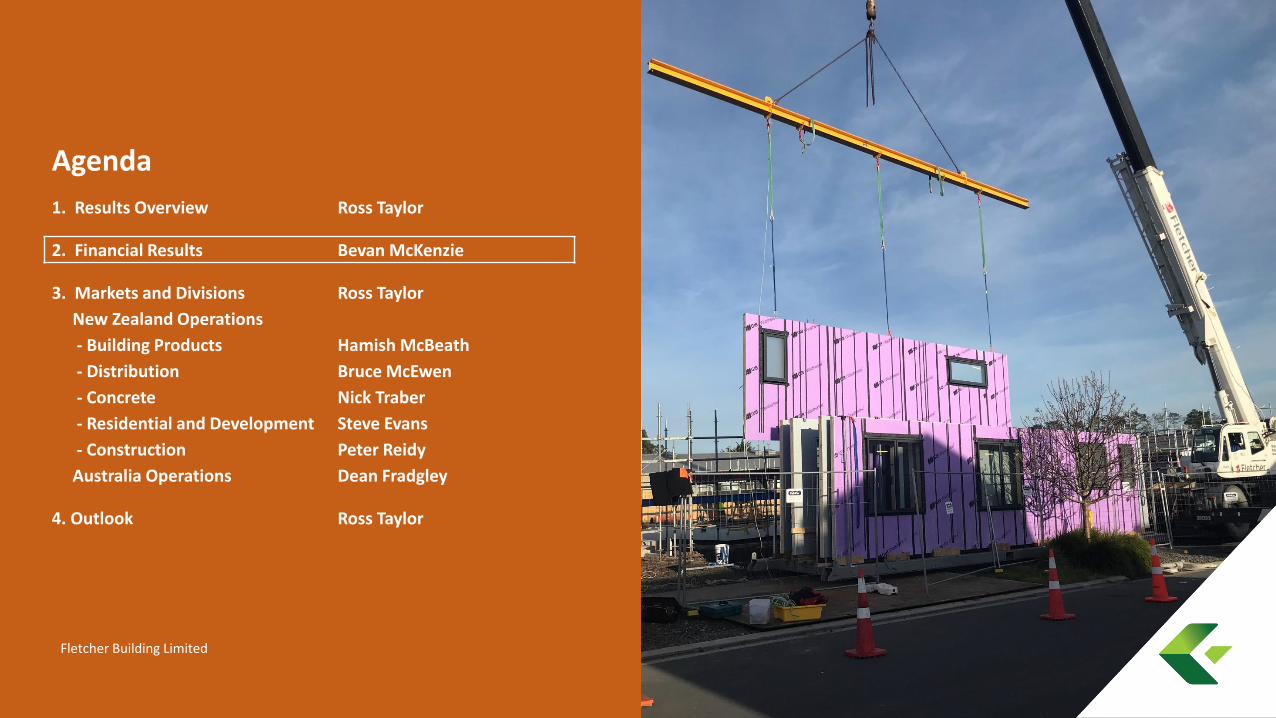
Agenda
1. Results Overview Ross Taylor
2. Financial Results Bevan McKenzie
3. Markets and Divisions Ross Taylor
New Zealand Operations
- Building Products Hamish McBeath
- Distribution Bruce McEwen
- Concrete Nick Traber
- Residential and Development Steve Evans
- Construction Peter Reidy
Australia Operations Dean Fradgley
4. Outlook Ross Taylor

FY21 performance deliveredDelivering on strategy, strong financial performance and returns to shareholders
➔ Delivered strong financial performance and ongoing operational improvements in FY21:
➔ EBIT before significant items $669m
➔ EBIT Margin up 100bps from FY191 to 8.2%
➔ Net earnings attributable to shareholders $305m
➔ Strong cash generation and strong balance sheet
➔ Capital returns delivered in FY21:
➔ Final Dividend of 18.0 cents per share, resulting in total FY21 dividends of 30.0 cents per share
➔ On-market share buyback underway
➔ Solid outlook with ongoing momentum and positive market backdrop:
➔ Forward indicators point to robust volumes
➔ Sustainable base to drive ongoing performance improvements and growth
PerformanceAnd Growth
Page 4 | Fletcher Building Limited Full Year Results Presentation | © August 2021 1. FY19 is a pro forma number adjusted for discontinued operations and IFRS16 to allow for like-for-like comparison
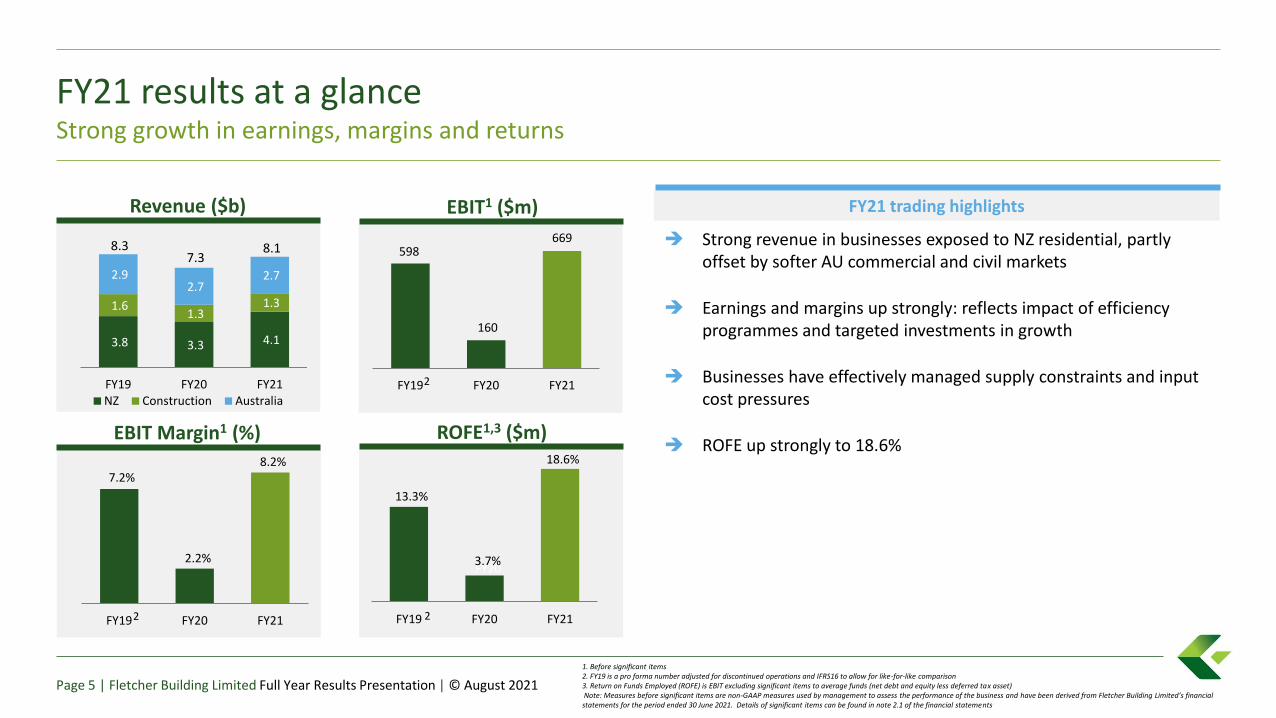
FY21 results at a glanceStrong growth in earnings, margins and returns
1. Before significant items 2. FY19 is a pro forma number adjusted for discontinued operations and IFRS16 to allow for like-for-like comparison3. Return on Funds Employed (ROFE) is EBIT excluding significant items to average funds (net debt and equity less deferred tax asset)Note: Measures before significant items are non-GAAP measures used by management to assess the performance of the business and have been derived from Fletcher Building Limited’s financial statements for the period ended 30 June 2021. Details of significant items can be found in note 2.1 of the financial statements
Page 5 | Fletcher Building Limited Full Year Results Presentation | © August 2021
➔ Strong revenue in businesses exposed to NZ residential, partly offset by softer AU commercial and civil markets
➔ Earnings and margins up strongly: reflects impact of efficiency programmes and targeted investments in growth
➔ Businesses have effectively managed supply constraints and input cost pressures
➔ ROFE up strongly to 18.6%EBIT Margin1 (%)
7.2%
2.2%
8.2%
FY19 FY20 FY21
3.8 3.3 4.1
1.6 1.3
1.3
2.9 2.7
2.7
FY19 FY20 FY21NZ Construction Australia
598
160
669
FY19 FY20 FY21
ROFE1,3 ($m)
FY21 trading highlightsEBIT1 ($m)
FY20
Revenue ($b)
8.37.3
8.1
2
2
13.3%
3.7%
18.6%
FY19 FY20 FY212
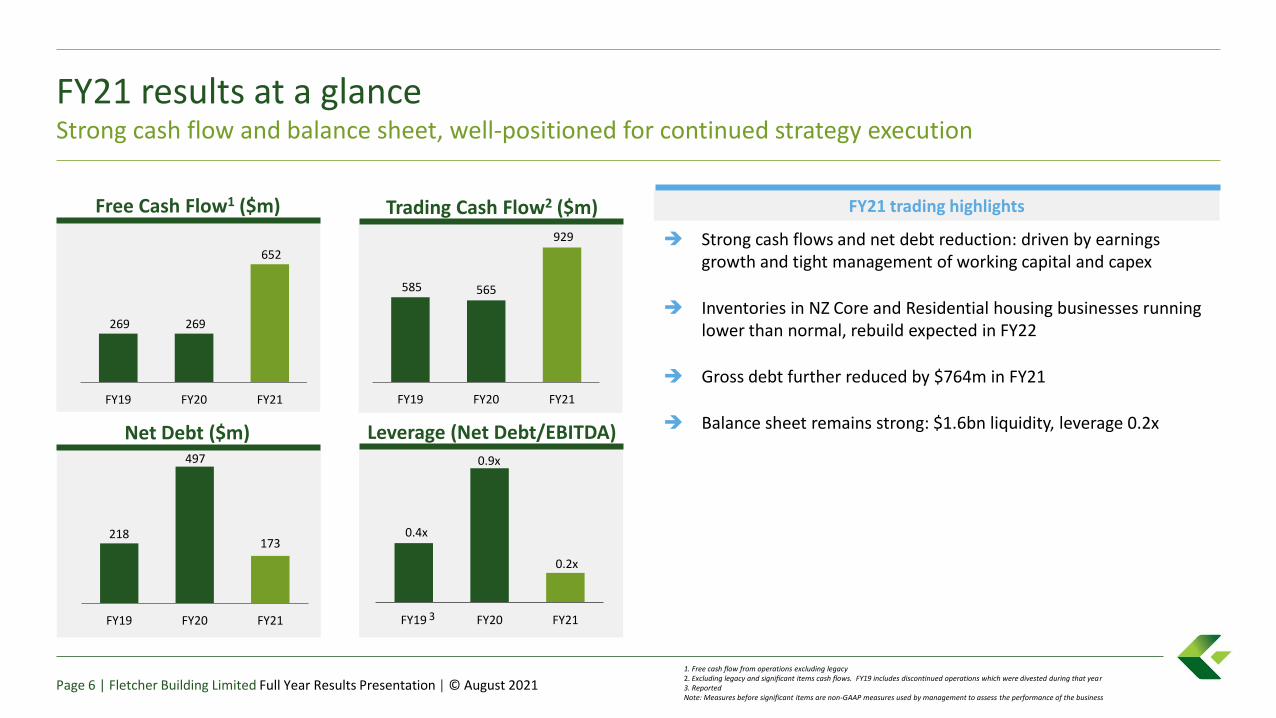
FY21 results at a glanceStrong cash flow and balance sheet, well-positioned for continued strategy execution
1. Free cash flow from operations excluding legacy2. Excluding legacy and significant items cash flows. FY19 includes discontinued operations which were divested during that year3. ReportedNote: Measures before significant items are non-GAAP measures used by management to assess the performance of the business
Page 6 | Fletcher Building Limited Full Year Results Presentation | © August 2021
Trading Cash Flow2 ($m)
Net Debt ($m)
218
497
173
FY19 FY20 FY21
➔ Strong cash flows and net debt reduction: driven by earnings growth and tight management of working capital and capex
➔ Inventories in NZ Core and Residential housing businesses running lower than normal, rebuild expected in FY22
➔ Gross debt further reduced by $764m in FY21
➔ Balance sheet remains strong: $1.6bn liquidity, leverage 0.2x
269 269
652
FY19 FY20 FY21
585 565
929
FY19 FY20 FY21
Free Cash Flow1 ($m)
Leverage (Net Debt/EBITDA)
0.4x
0.9x
0.2x
FY19 FY20 FY213
FY21 trading highlights
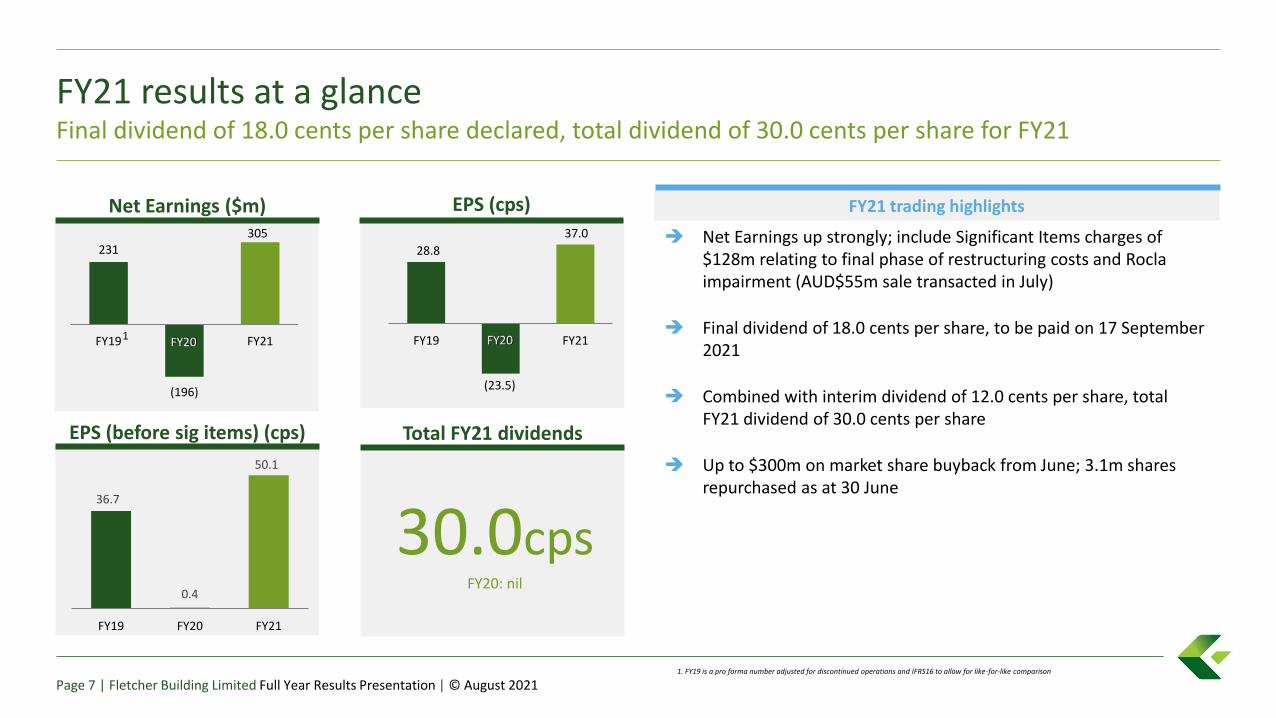
FY21 results at a glanceFinal dividend of 18.0 cents per share declared, total dividend of 30.0 cents per share for FY21
Page 7 | Fletcher Building Limited Full Year Results Presentation | © August 2021
36.7
0.4
50.1
FY19 FY20 FY21
Total FY21 dividends
➔ Net Earnings up strongly; include Significant Items charges of $128m relating to final phase of restructuring costs and Rocla impairment (AUD$55m sale transacted in July)
➔ Final dividend of 18.0 cents per share, to be paid on 17 September 2021
➔ Combined with interim dividend of 12.0 cents per share, total FY21 dividend of 30.0 cents per share
➔ Up to $300m on market share buyback from June; 3.1m shares repurchased as at 30 June
EPS (cps)
EPS (before sig items) (cps)
28.8
(23.5)
37.0
FY19 FY20 FY21
30.0cpsFY20: nil
FY20
231
(196)
305
FY19 FY20 FY21
Net Earnings ($m)
FY20
FY21 trading highlights
1
1. FY19 is a pro forma number adjusted for discontinued operations and IFRS16 to allow for like-for-like comparison
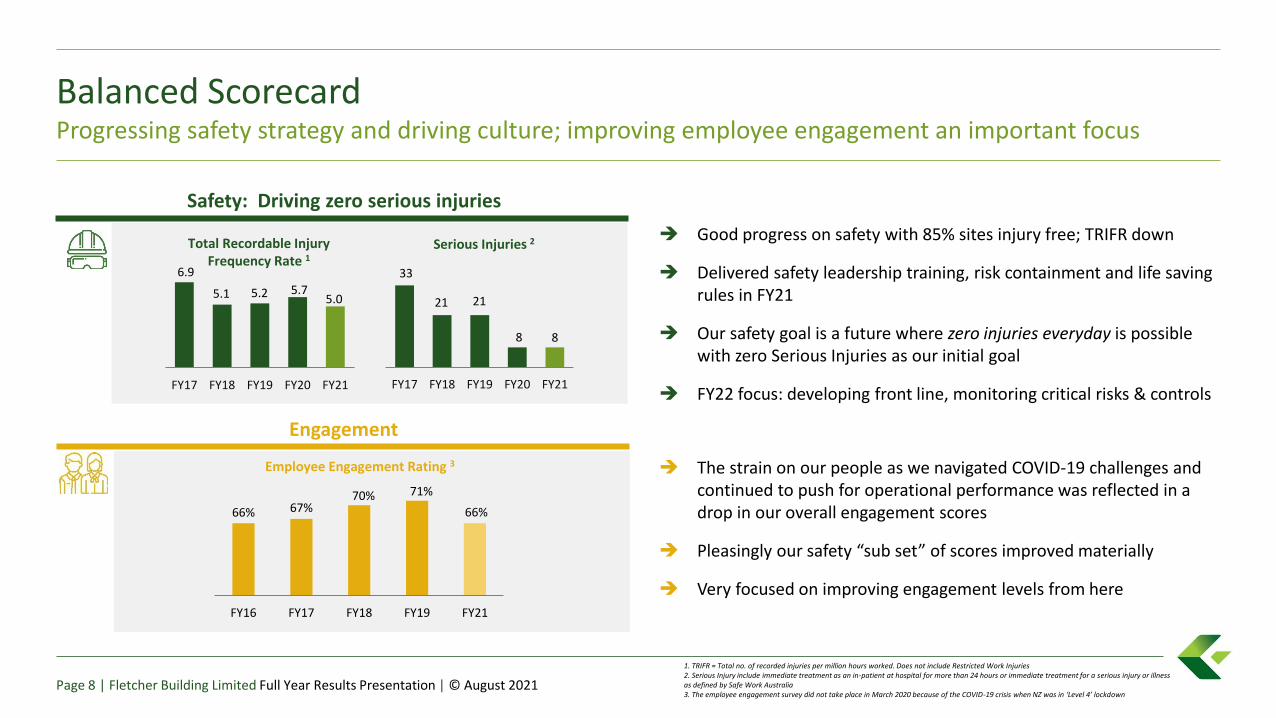
Balanced ScorecardProgressing safety strategy and driving culture; improving employee engagement an important focus
1. TRIFR = Total no. of recorded injuries per million hours worked. Does not include Restricted Work Injuries2. Serious Injury include immediate treatment as an in-patient at hospital for more than 24 hours or immediate treatment for a serious injury or illness as defined by Safe Work Australia3. The employee engagement survey did not take place in March 2020 because of the COVID-19 crisis when NZ was in ‘Level 4’ lockdown
Page 8 | Fletcher Building Limited Full Year Results Presentation | © August 2021
Engagement
Employee Engagement Rating 3
66% 67%70% 71%
66%
FY16 FY17 FY18 FY19 FY21
Safety: Driving zero serious injuries
Total Recordable Injury Frequency Rate 1
6.9
5.1 5.2 5.75.0
FY17 FY18 FY19 FY20 FY21
33
21 21
8 8
FY17 FY18 FY19 FY20 FY21
Serious Injuries 2➔ Good progress on safety with 85% sites injury free; TRIFR down
➔ Delivered safety leadership training, risk containment and life saving rules in FY21
➔ Our safety goal is a future where zero injuries everyday is possible with zero Serious Injuries as our initial goal
➔ FY22 focus: developing front line, monitoring critical risks & controls
➔ The strain on our people as we navigated COVID-19 challenges and continued to push for operational performance was reflected in a drop in our overall engagement scores
➔ Pleasingly our safety “sub set” of scores improved materially
➔ Very focused on improving engagement levels from here

Balanced ScorecardVerified science based target for carbon reduction of 30% by 2030; driving customer focus
1. Net Promoter Score (NPS) measures how satisfied our customers are with our business. Prior years restated to reflect business units currently in the NPS programme Page 9 | Fletcher Building Limited Full Year Results Presentation | © August 2021
Customer
Net Promoter Score 1
27 3340 40 41
FY17 FY18 FY19 FY20 FY21
Sustainability: Driving 30% carbon reduction from FY18
1,238
1,145
FY18 FY21
GBC shutdown forwaste tyre project(proforma)
Carbon Emissions
Carbon (CO2) Emissions (thousand Tonnes)
➔ Performance up slightly through tough period
➔ Driving to best in class net promoter score of ≥ 55
➔ GBC waste tyre completed (but additional shutdown to allow this resulted in a one-off lowering of carbon emissions), Australia solar and energy efficiency & Laminex rooftop solar projects completed in FY21
➔ 46% waste diverted from landfill, compared to 39% in FY20
➔ DJ Sustainability™ Asia Pacific Index and DJSI Australia index inclusion
➔ Improved CDP rating to B (from D in FY19) for approach to managing carbon emissions & climate change, most improved NZ company
-5%
Fletcher Building Limited
Agenda
1. Results Overview Ross Taylor
2. Financial Results Bevan McKenzie
3. Markets and Divisions Ross Taylor
New Zealand Operations
- Building Products Hamish McBeath
- Distribution Bruce McEwen
- Concrete Nick Traber
- Residential and Development Steve Evans
- Construction Peter Reidy
Australia Operations Dean Fradgley
4. Outlook Ross Taylor

1. Jun 2019 12 months pro forma is Jun 2019 12 months reported adjusted for discontinued operations and IFRS16 to allow for like-for-like comparison2. Reported adjusted to exclude discontinued operations
Income StatementEBIT before significant items $669 million, material uplift on prior years
NZ$m
Jun 201912 months pro forma1
Jun 202012 months
reported
Jun 202112 months
reported
Revenue 8,308 7,309 8,120
EBITDA 957 530 1,032
EBIT before significant items 598 160 669
Significant items (94) (276) (128)
EBIT 504 (116) 541
Lease interest expense (64) (69) (64)
Funding costs (116) (80) (44)
Tax expense (80) 81 (116)
Non-controlling interests (13) (12) (12)
Net earnings 231 (196) 305
Basic earnings per share before significant items (cents) 36.72 0.4 50.1
Basic earnings per share (cents) 28.82 (23.5) 37.0
Dividends per share (cents) 23.0 0.0 30.0
Page 11 | Fletcher Building Limited Full Year Results Presentation | © August 2021
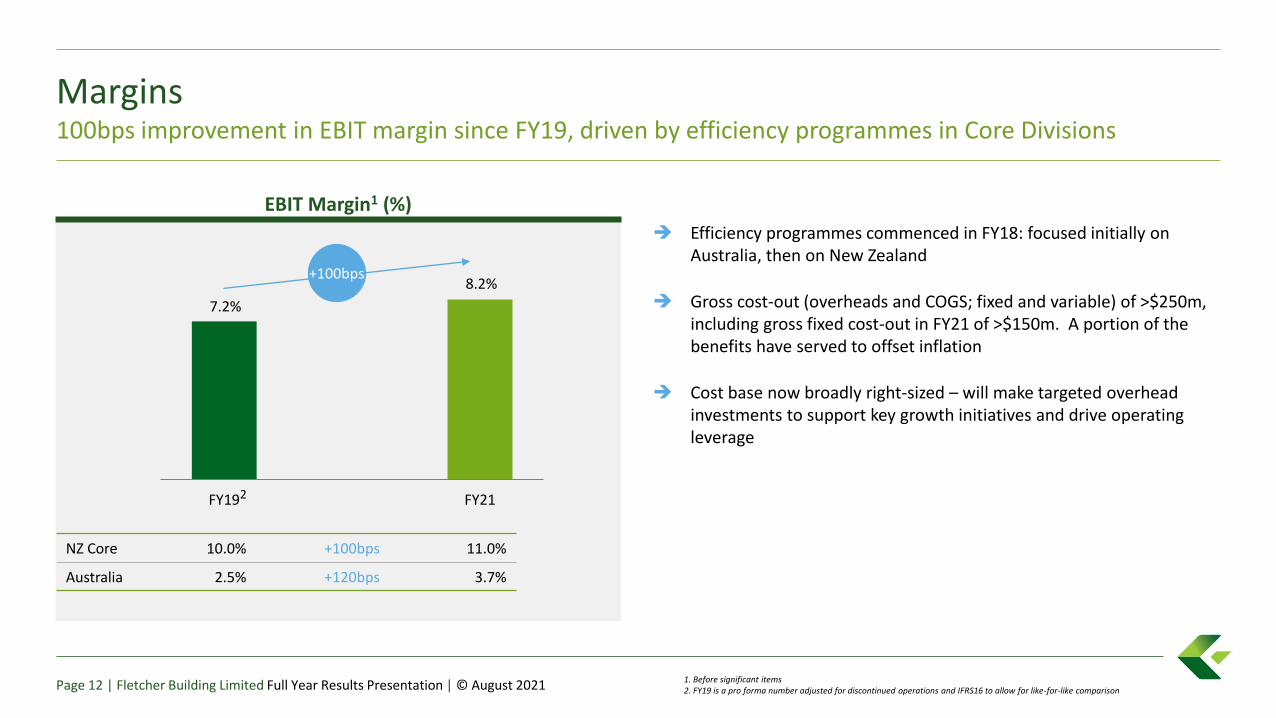
Margins 100bps improvement in EBIT margin since FY19, driven by efficiency programmes in Core Divisions
1. Before significant items2. FY19 is a pro forma number adjusted for discontinued operations and IFRS16 to allow for like-for-like comparisonPage 12 | Fletcher Building Limited Full Year Results Presentation | © August 2021
7.2%
8.2%
FY19 FY21
EBIT Margin1 (%)
➔ Efficiency programmes commenced in FY18: focused initially on Australia, then on New Zealand
➔ Gross cost-out (overheads and COGS; fixed and variable) of >$250m, including gross fixed cost-out in FY21 of >$150m. A portion of the benefits have served to offset inflation
➔ Cost base now broadly right-sized – will make targeted overhead investments to support key growth initiatives and drive operating leverage
+100bps
NZ Core 10.0% +100bps 11.0%
Australia 2.5% +120bps 3.7%
2
FY21 significant items (Profit and Loss Charges)
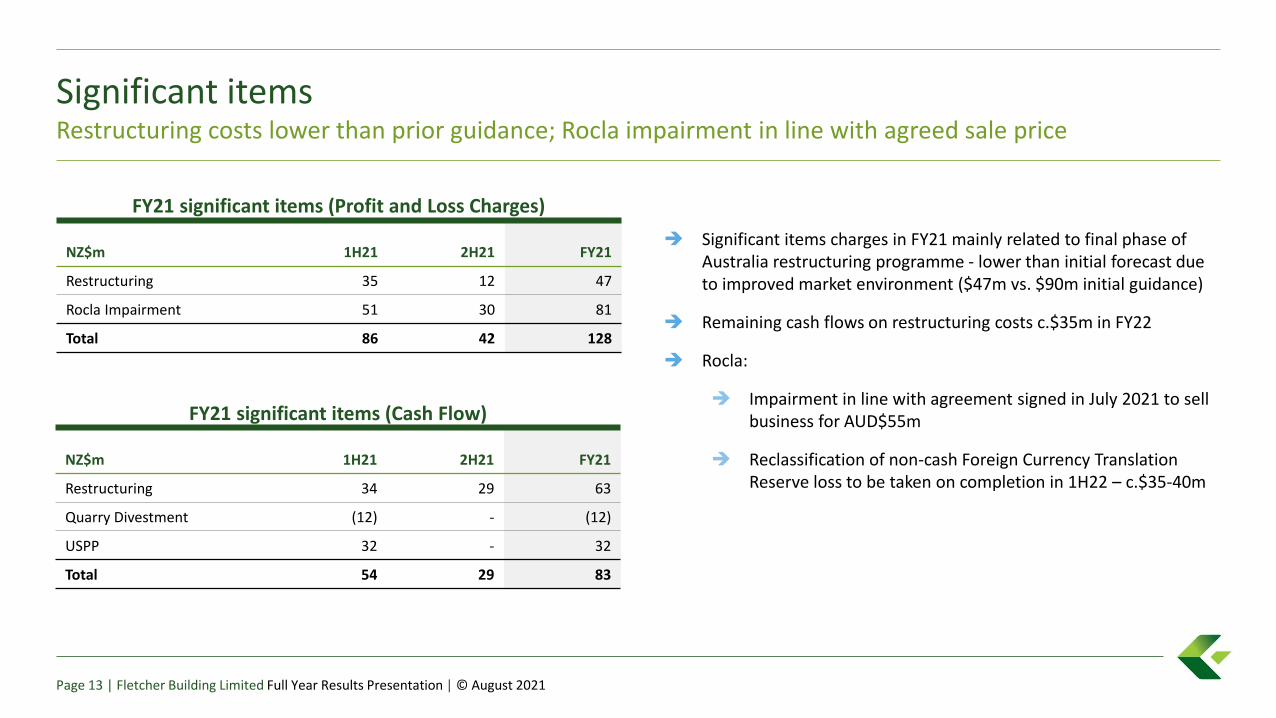
Significant itemsRestructuring costs lower than prior guidance; Rocla impairment in line with agreed sale price
Page 13 | Fletcher Building Limited Full Year Results Presentation | © August 2021
NZ$m 1H21 2H21 FY21
Restructuring 35 12 47
Rocla Impairment 51 30 81
Total 86 42 128
FY21 significant items (Cash Flow)
NZ$m 1H21 2H21 FY21
Restructuring 34 29 63
Quarry Divestment (12) - (12)
USPP 32 - 32
Total 54 29 83
➔ Significant items charges in FY21 mainly related to final phase of Australia restructuring programme - lower than initial forecast due to improved market environment ($47m vs. $90m initial guidance)
➔ Remaining cash flows on restructuring costs c.$35m in FY22
➔ Rocla:
➔ Impairment in line with agreement signed in July 2021 to sell business for AUD$55m
➔ Reclassification of non-cash Foreign Currency Translation Reserve loss to be taken on completion in 1H22 – c.$35-40m
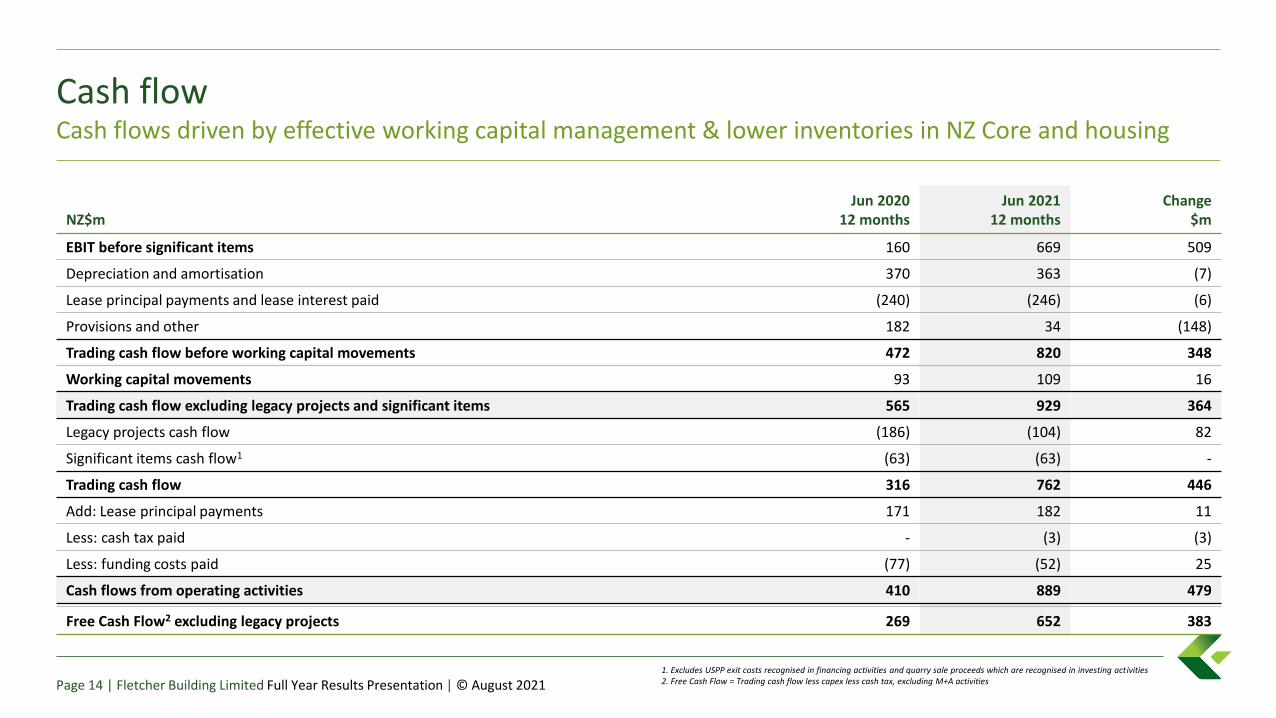
Cash flowCash flows driven by effective working capital management & lower inventories in NZ Core and housing
NZ$mJun 2020
12 monthsJun 2021
12 monthsChange
$m
EBIT before significant items 160 669 509
Depreciation and amortisation 370 363 (7)
Lease principal payments and lease interest paid (240) (246) (6)
Provisions and other 182 34 (148)
Trading cash flow before working capital movements 472 820 348
Working capital movements 93 109 16
Trading cash flow excluding legacy projects and significant items 565 929 364
Legacy projects cash flow (186) (104) 82
Significant items cash flow1 (63) (63) -
Trading cash flow 316 762 446
Add: Lease principal payments 171 182 11
Less: cash tax paid - (3) (3)
Less: funding costs paid (77) (52) 25
Cash flows from operating activities 410 889 479
Free Cash Flow2 excluding legacy projects 269 652 383
1. Excludes USPP exit costs recognised in financing activities and quarry sale proceeds which are recognised in investing activities2. Free Cash Flow = Trading cash flow less capex less cash tax, excluding M+A activitiesPage 14 | Fletcher Building Limited Full Year Results Presentation | © August 2021

Cash flow working capital movementsNZ$m
Jun 202012 months
Jun 202112 months
Residential and Development 50 105
Construction excluding legacy projects 16 (72)
Materials and Distribution Divisions
• Debtors 95 (62)
• Inventories (1) (22)
• Creditors (67) 160
Cash flow working capital movements excluding legacy projects 93 109
Working CapitalWell positioned with operating disciplines embedded, rebuild of NZ Core and housing inventories expected in FY22
Page 15 | Fletcher Building Limited Full Year Results Presentation | © August 2021
Key working capital metrics (days)As at
Jun 2020As at
Jun 2021Change
(days)
Debtors Days 39.0 37.9 (1.1)
Inventory Days 75.1 70.7 (4.4)
Payables Days 46.9 46.7 0.2
Materials and Distribution Total Cycle 67.2 61.9 (5.3)
➔ Rebuild of inventories expected in FY22: NZ Core c.$25-$50m, housing c$200m
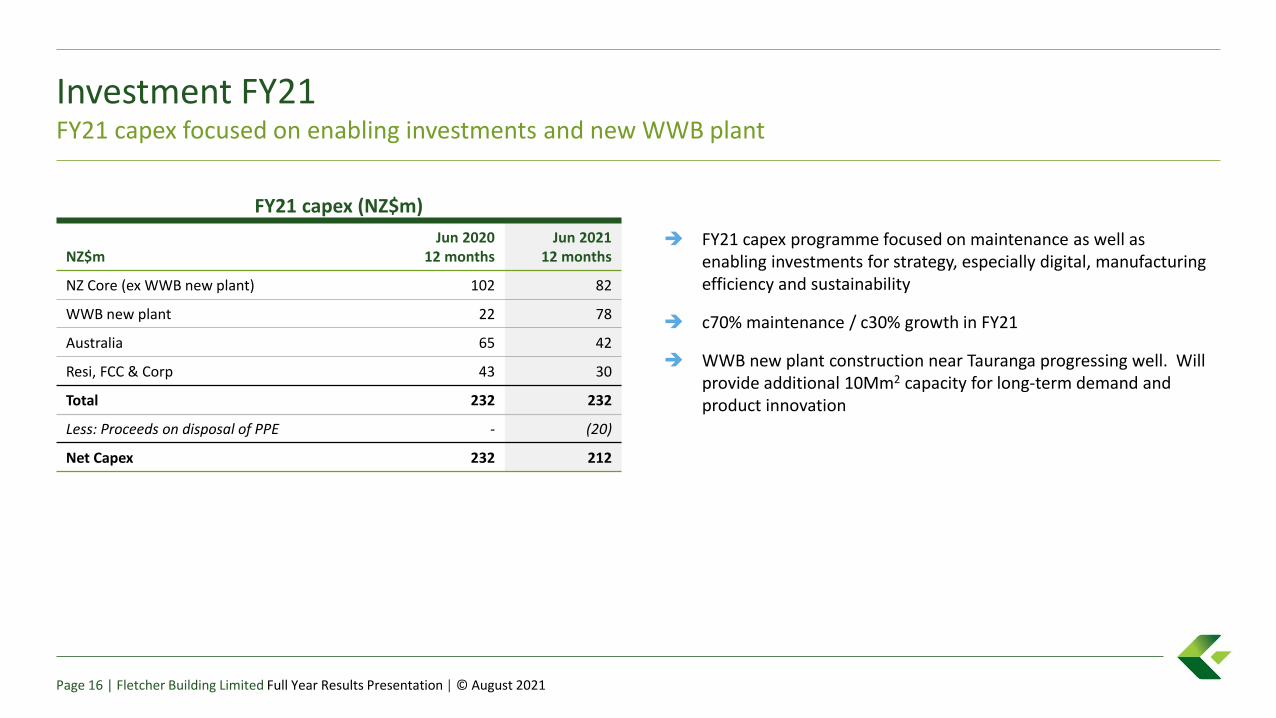
FY21 capex (NZ$m)
Investment FY21FY21 capex focused on enabling investments and new WWB plant
Page 16 | Fletcher Building Limited Full Year Results Presentation | © August 2021
NZ$mJun 2020
12 monthsJun 2021
12 months
NZ Core (ex WWB new plant) 102 82
WWB new plant 22 78
Australia 65 42
Resi, FCC & Corp 43 30
Total 232 232
Less: Proceeds on disposal of PPE - (20)
Net Capex 232 212
➔ FY21 capex programme focused on maintenance as well as enabling investments for strategy, especially digital, manufacturing efficiency and sustainability
➔ c70% maintenance / c30% growth in FY21
➔ WWB new plant construction near Tauranga progressing well. Will provide additional 10Mm2 capacity for long-term demand and product innovation
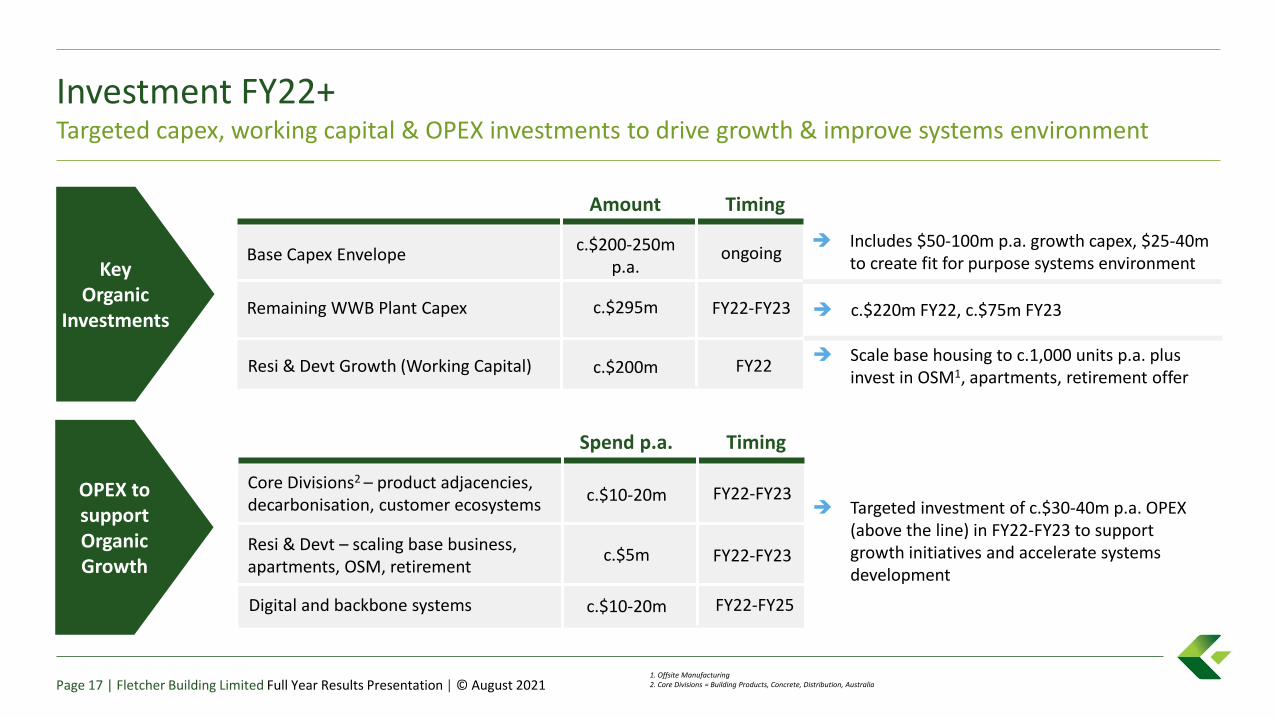
Investment FY22+Targeted capex, working capital & OPEX investments to drive growth & improve systems environment
Page 17 | Fletcher Building Limited Full Year Results Presentation | © August 2021
➔ Scale base housing to c.1,000 units p.a. plus invest in OSM1, apartments, retirement offer
OPEX to support Organic Growth
1. Offsite Manufacturing2. Core Divisions = Building Products, Concrete, Distribution, Australia
Key Organic
Investments
Core Divisions2 – product adjacencies, decarbonisation, customer ecosystems
c.$10-20m
Resi & Devt – scaling base business, apartments, OSM, retirement
c.$5m
Digital and backbone systems c.$10-20m
Spend p.a. Timing
FY22-FY23
FY22-FY25
FY22-FY23
➔ Targeted investment of c.$30-40m p.a. OPEX (above the line) in FY22-FY23 to support growth initiatives and accelerate systems development
Base Capex Envelopec.$200-250m
p.a.
Remaining WWB Plant Capex c.$295m
Resi & Devt Growth (Working Capital) c.$200m
Amount Timing
ongoing
FY22
FY22-FY23 ➔ c.$220m FY22, c.$75m FY23
➔ Includes $50-100m p.a. growth capex, $25-40m to create fit for purpose systems environment
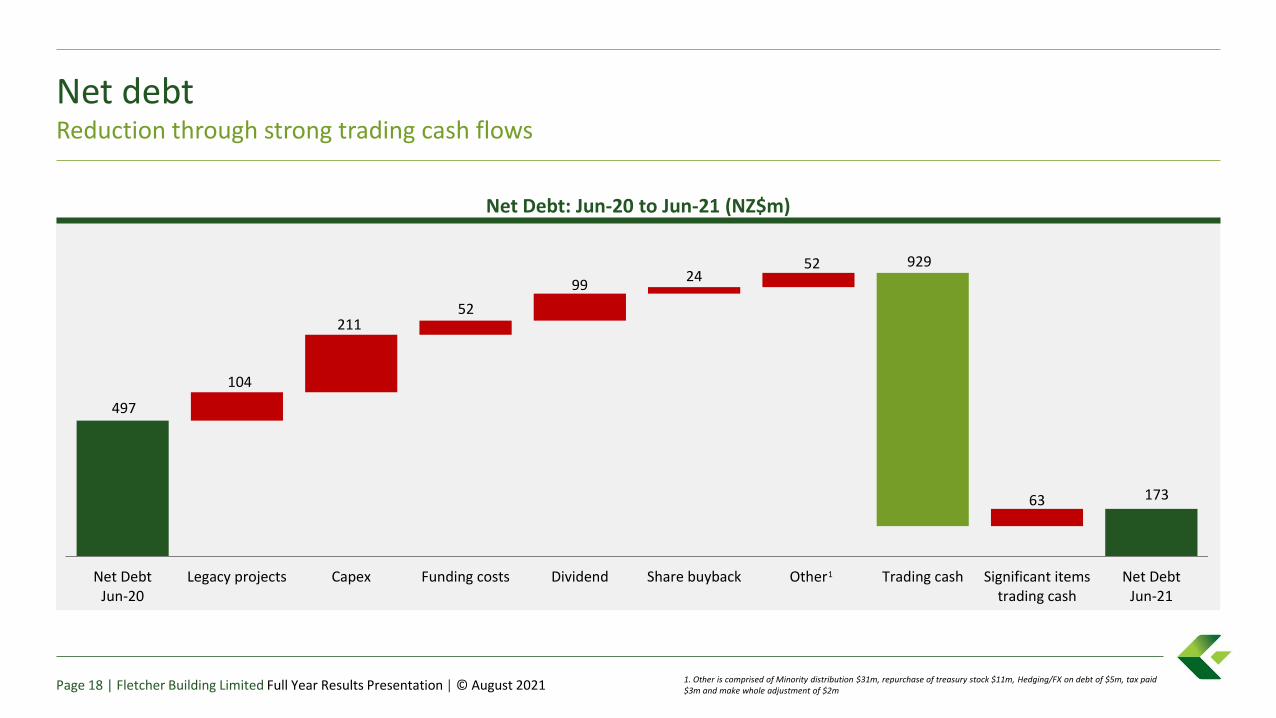
Net debtReduction through strong trading cash flows
1. Other is comprised of Minority distribution $31m, repurchase of treasury stock $11m, Hedging/FX on debt of $5m, tax paid $3m and make whole adjustment of $2mPage 18 | Fletcher Building Limited Full Year Results Presentation | © August 2021
Net Debt: Jun-20 to Jun-21 (NZ$m)
497
173
929
104
21152
9924
52
63
Net DebtJun-20
Legacy projects Capex Funding costs Dividend Share buyback Other Trading cash Significant itemstrading cash
Net DebtJun-21
1
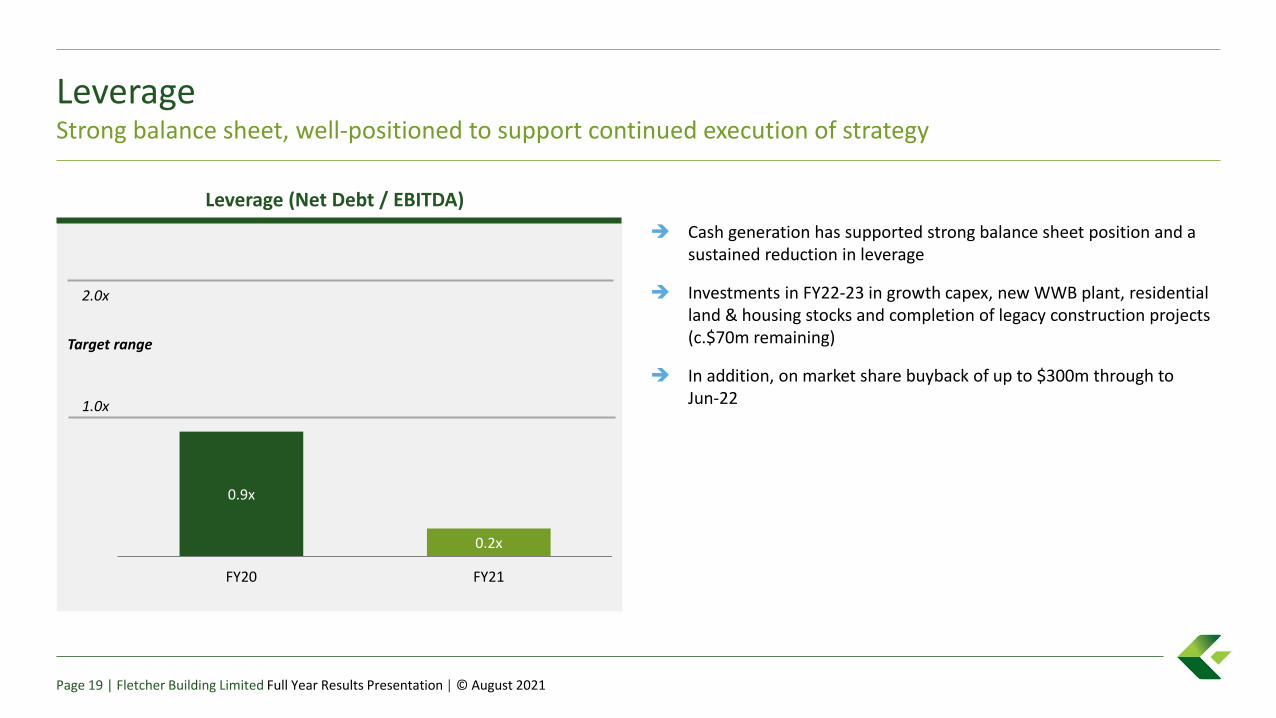
LeverageStrong balance sheet, well-positioned to support continued execution of strategy
➔ Cash generation has supported strong balance sheet position and a sustained reduction in leverage
➔ Investments in FY22-23 in growth capex, new WWB plant, residential land & housing stocks and completion of legacy construction projects (c.$70m remaining)
➔ In addition, on market share buyback of up to $300m through to Jun-22
Leverage (Net Debt / EBITDA)
0.2x
0.9x
FY20 FY21
Target range
2.0x
1.0x
Page 19 | Fletcher Building Limited Full Year Results Presentation | © August 2021
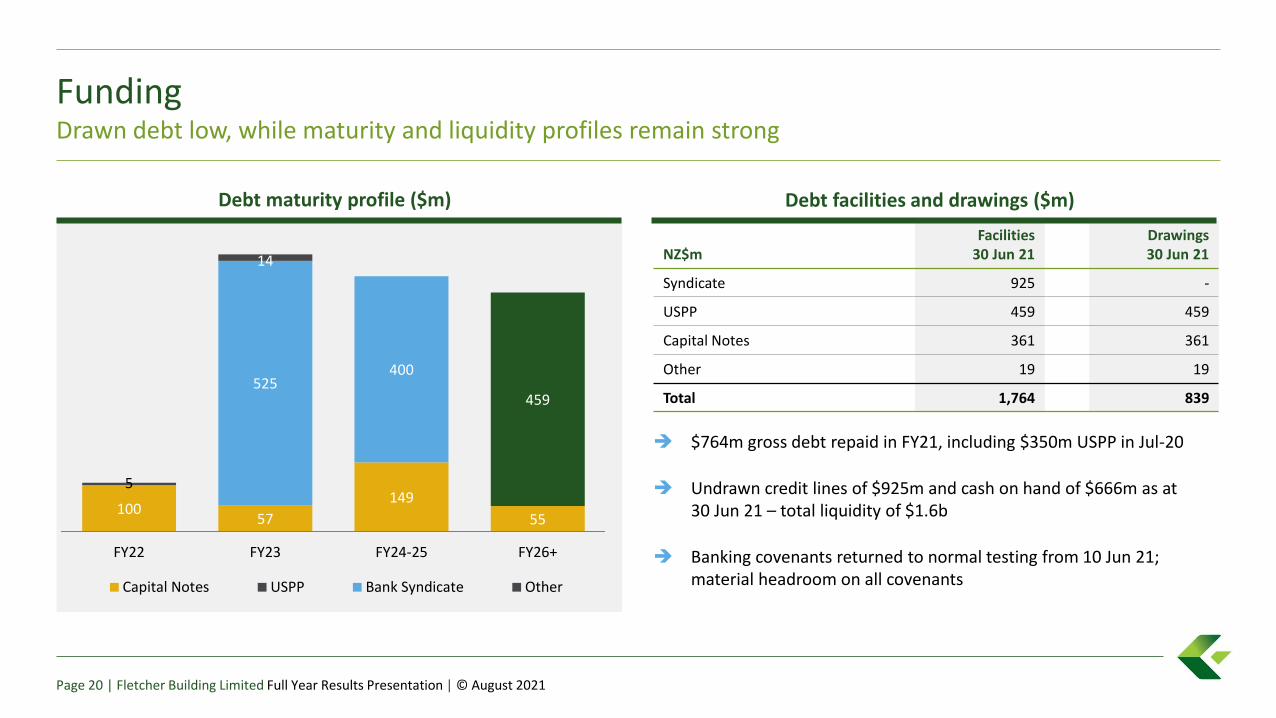
FundingDrawn debt low, while maturity and liquidity profiles remain strong
➔ $764m gross debt repaid in FY21, including $350m USPP in Jul-20
➔ Undrawn credit lines of $925m and cash on hand of $666m as at 30 Jun 21 – total liquidity of $1.6b
➔ Banking covenants returned to normal testing from 10 Jun 21; material headroom on all covenants
10057
149
55
459525
400
5
14
FY22 FY23 FY24-25 FY26+
Capital Notes USPP Bank Syndicate Other
Debt maturity profile ($m)
NZ$mFacilities
30 Jun 21Drawings 30 Jun 21
Syndicate 925 -
USPP 459 459
Capital Notes 361 361
Other 19 19
Total 1,764 839
Debt facilities and drawings ($m)
Page 20 | Fletcher Building Limited Full Year Results Presentation | © August 2021
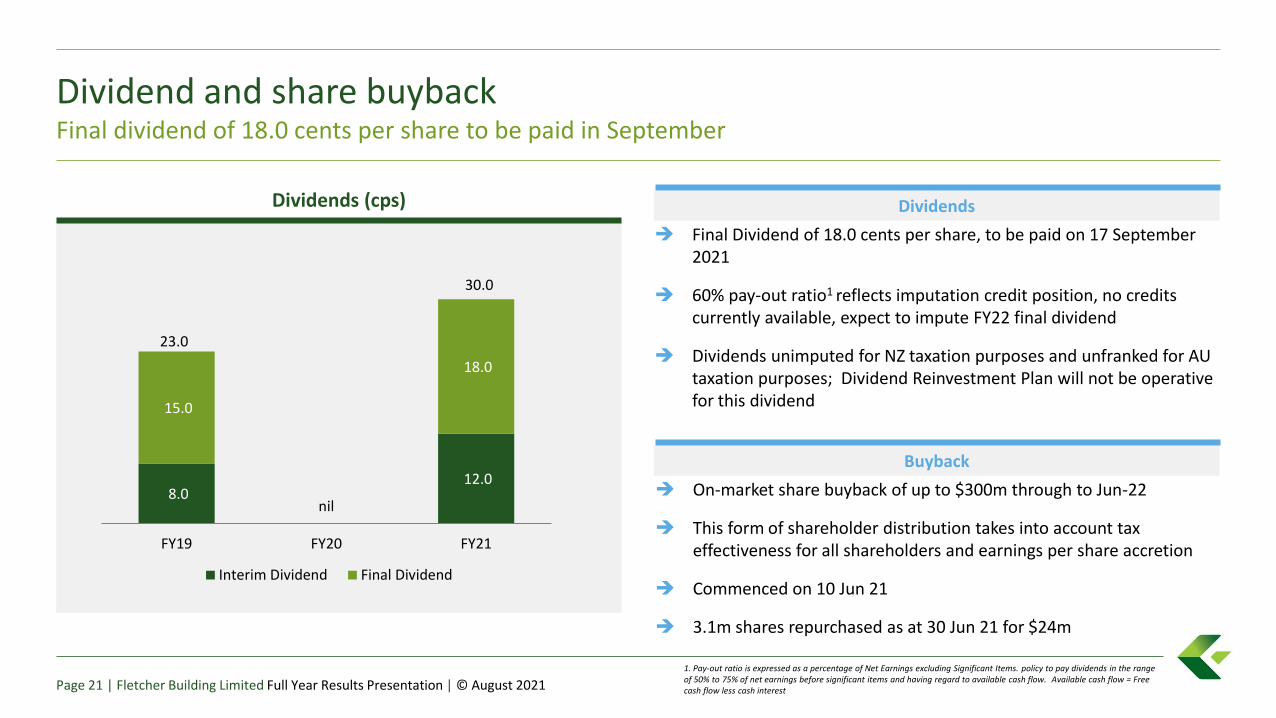
Dividend and share buybackFinal dividend of 18.0 cents per share to be paid in September
1. Pay-out ratio is expressed as a percentage of Net Earnings excluding Significant Items. policy to pay dividends in the range of 50% to 75% of net earnings before significant items and having regard to available cash flow. Available cash flow = Free cash flow less cash interestPage 21 | Fletcher Building Limited Full Year Results Presentation | © August 2021
8.0 nil
12.0
15.0
18.0
FY19 FY20 FY21
Interim Dividend Final Dividend
Dividends (cps)
➔ Final Dividend of 18.0 cents per share, to be paid on 17 September 2021
➔ 60% pay-out ratio1 reflects imputation credit position, no credits currently available, expect to impute FY22 final dividend
➔ Dividends unimputed for NZ taxation purposes and unfranked for AU taxation purposes; Dividend Reinvestment Plan will not be operative for this dividend
Buyback
Dividends
➔ On-market share buyback of up to $300m through to Jun-22
➔ This form of shareholder distribution takes into account tax effectiveness for all shareholders and earnings per share accretion
➔ Commenced on 10 Jun 21
➔ 3.1m shares repurchased as at 30 Jun 21 for $24m
30.0
23.0
SummaryStrong delivery against financial targets, investing for growth
Page 22 | Fletcher Building Limited Full Year Results Presentation | © August 2021
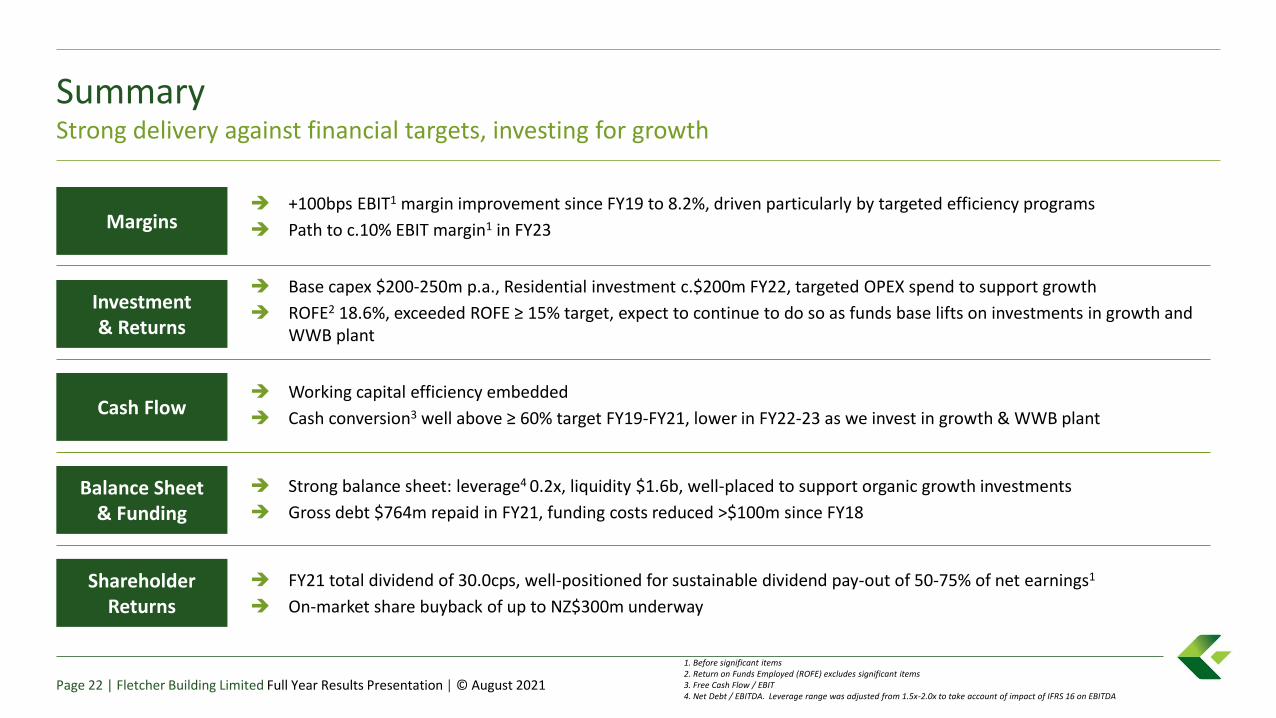
Margins➔ +100bps EBIT1 margin improvement since FY19 to 8.2%, driven particularly by targeted efficiency programs
➔ Path to c.10% EBIT margin1 in FY23
Investment & Returns
➔ Base capex $200-250m p.a., Residential investment c.$200m FY22, targeted OPEX spend to support growth
➔ ROFE2 18.6%, exceeded ROFE ≥ 15% target, expect to continue to do so as funds base lifts on investments in growth and WWB plant
Cash Flow➔ Working capital efficiency embedded
➔ Cash conversion3 well above ≥ 60% target FY19-FY21, lower in FY22-23 as we invest in growth & WWB plant
Balance Sheet& Funding
➔ Strong balance sheet: leverage4 0.2x, liquidity $1.6b, well-placed to support organic growth investments
➔ Gross debt $764m repaid in FY21, funding costs reduced >$100m since FY18
ShareholderReturns
➔ FY21 total dividend of 30.0cps, well-positioned for sustainable dividend pay-out of 50-75% of net earnings1
➔ On-market share buyback of up to NZ$300m underway
1. Before significant items2. Return on Funds Employed (ROFE) excludes significant items3. Free Cash Flow / EBIT4. Net Debt / EBITDA. Leverage range was adjusted from 1.5x-2.0x to take account of impact of IFRS 16 on EBITDA

Fletcher Building Limited
Agenda
1. Results Overview Ross Taylor
2. Financial Results Bevan McKenzie
3. Markets and Divisions Ross Taylor
New Zealand Operations:
- Building Products Hamish McBeath
- Distribution Bruce McEwen
- Concrete Nick Traber
- Residential and Development Steve Evans
- Construction Peter Reidy
Australia Operations Dean Fradgley
4. Outlook Ross Taylor
Divisional performance summaryStrong finish to year by all divisions
Page 24 | Fletcher Building Limited Full Year Results Presentation | © August 2021
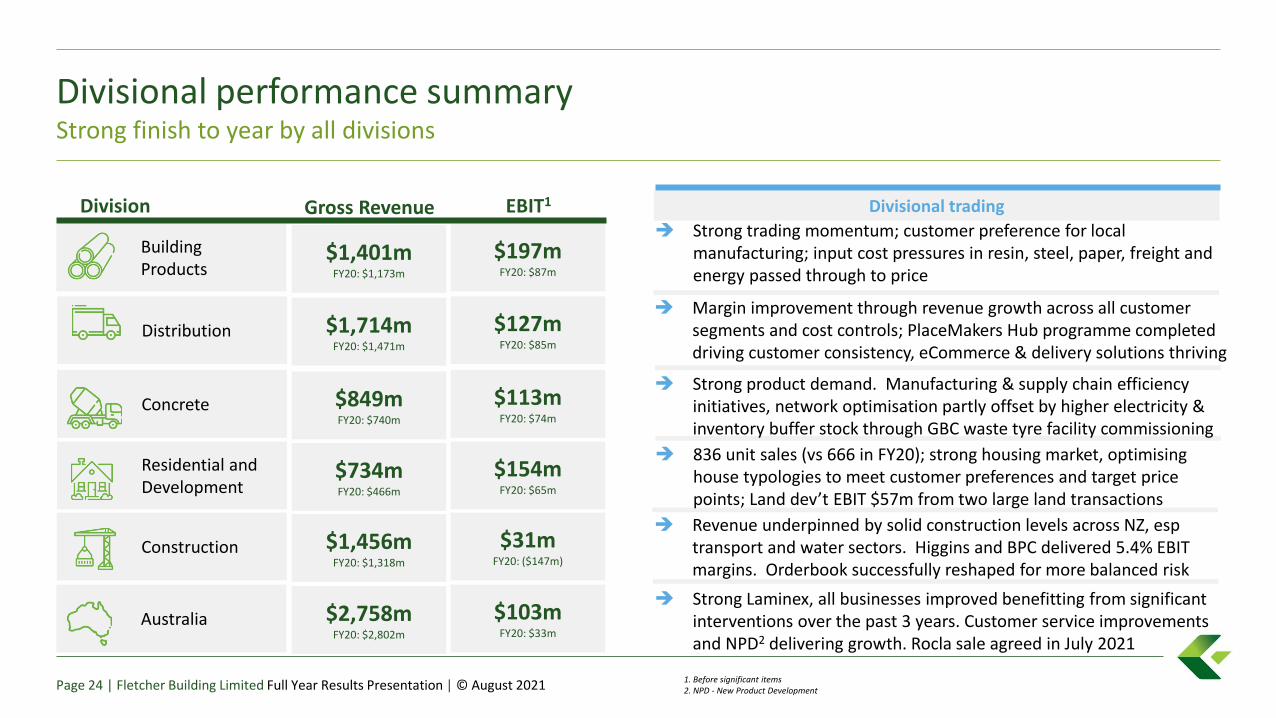
EBIT1
$113mFY20: $74m
$127mFY20: $85m
$197mFY20: $87m
$103mFY20: $33m
$31mFY20: ($147m)
$154mFY20: $65m
Distribution
Building Products
Concrete
Construction
Residential and Development
Australia
Division
1. Before significant items2. NPD - New Product Development
Divisional tradingGross Revenue
$849mFY20: $740m
$1,714mFY20: $1,471m
$1,401mFY20: $1,173m
$2,758mFY20: $2,802m
$1,456mFY20: $1,318m
$734mFY20: $466m
➔ Strong trading momentum; customer preference for local manufacturing; input cost pressures in resin, steel, paper, freight and energy passed through to price
➔ Margin improvement through revenue growth across all customer segments and cost controls; PlaceMakers Hub programme completed driving customer consistency, eCommerce & delivery solutions thriving
➔ Strong product demand. Manufacturing & supply chain efficiency initiatives, network optimisation partly offset by higher electricity & inventory buffer stock through GBC waste tyre facility commissioning
➔ 836 unit sales (vs 666 in FY20); strong housing market, optimising house typologies to meet customer preferences and target price points; Land dev’t EBIT $57m from two large land transactions
➔ Revenue underpinned by solid construction levels across NZ, esptransport and water sectors. Higgins and BPC delivered 5.4% EBIT margins. Orderbook successfully reshaped for more balanced risk
➔ Strong Laminex, all businesses improved benefitting from significant interventions over the past 3 years. Customer service improvements and NPD2 delivering growth. Rocla sale agreed in July 2021
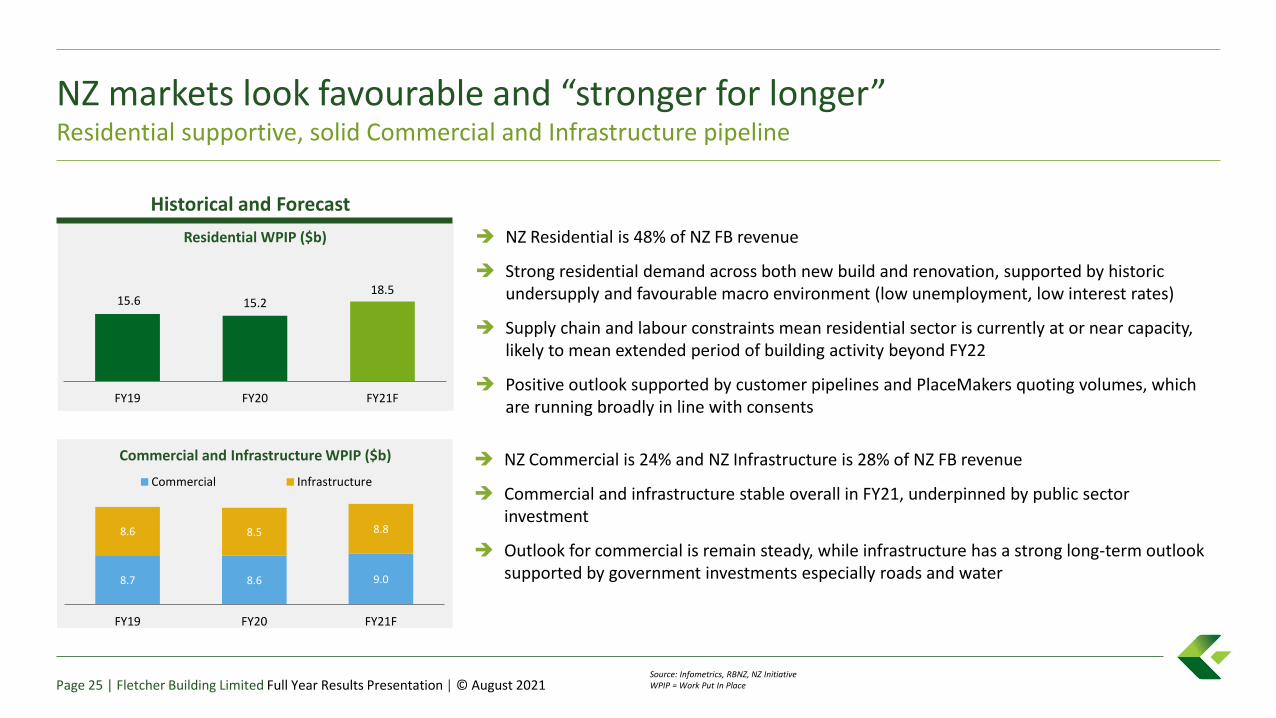
15.6 15.218.5
FY19 FY20 FY21F
NZ markets look favourable and “stronger for longer”Residential supportive, solid Commercial and Infrastructure pipeline
8.7 8.6 9.0
8.6 8.5 8.8
FY19 FY20 FY21F
Commercial Infrastructure
Residential WPIP ($b)
Historical and Forecast
Commercial and Infrastructure WPIP ($b)
Source: Infometrics, RBNZ, NZ InitiativeWPIP = Work Put In PlacePage 25 | Fletcher Building Limited Full Year Results Presentation | © August 2021
➔ NZ Residential is 48% of NZ FB revenue
➔ Strong residential demand across both new build and renovation, supported by historic undersupply and favourable macro environment (low unemployment, low interest rates)
➔ Supply chain and labour constraints mean residential sector is currently at or near capacity, likely to mean extended period of building activity beyond FY22
➔ Positive outlook supported by customer pipelines and PlaceMakers quoting volumes, which are running broadly in line with consents
➔ NZ Commercial is 24% and NZ Infrastructure is 28% of NZ FB revenue
➔ Commercial and infrastructure stable overall in FY21, underpinned by public sector investment
➔ Outlook for commercial is remain steady, while infrastructure has a strong long-term outlook supported by government investments especially roads and water
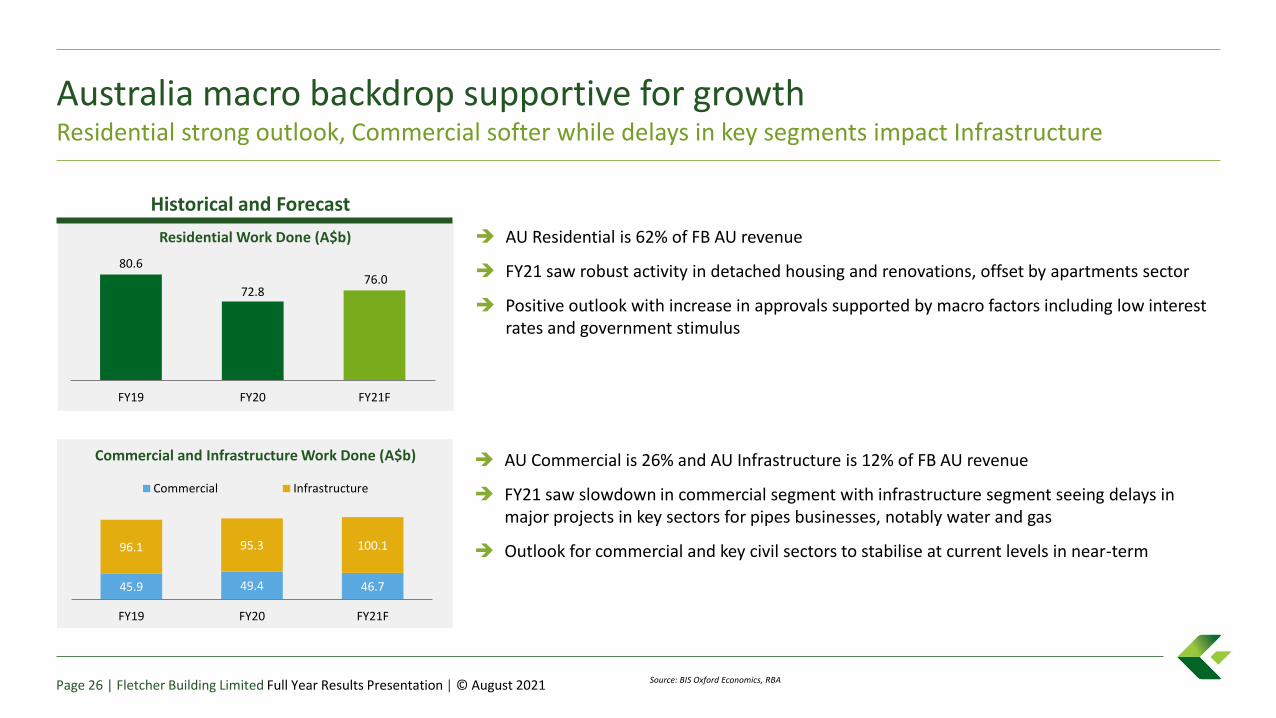
80.6
72.876.0
FY19 FY20 FY21F
Australia macro backdrop supportive for growthResidential strong outlook, Commercial softer while delays in key segments impact Infrastructure
Source: BIS Oxford Economics, RBA
Historical and Forecast
Commercial and Infrastructure Work Done (A$b)
45.9 49.4 46.7
96.1 95.3 100.1
FY19 FY20 FY21F
Commercial Infrastructure
Residential Work Done (A$b)
Page 26 | Fletcher Building Limited Full Year Results Presentation | © August 2021
➔ AU Residential is 62% of FB AU revenue
➔ FY21 saw robust activity in detached housing and renovations, offset by apartments sector
➔ Positive outlook with increase in approvals supported by macro factors including low interest rates and government stimulus
➔ AU Commercial is 26% and AU Infrastructure is 12% of FB AU revenue
➔ FY21 saw slowdown in commercial segment with infrastructure segment seeing delays in major projects in key sectors for pipes businesses, notably water and gas
➔ Outlook for commercial and key civil sectors to stabilise at current levels in near-term
FY21 trading performance
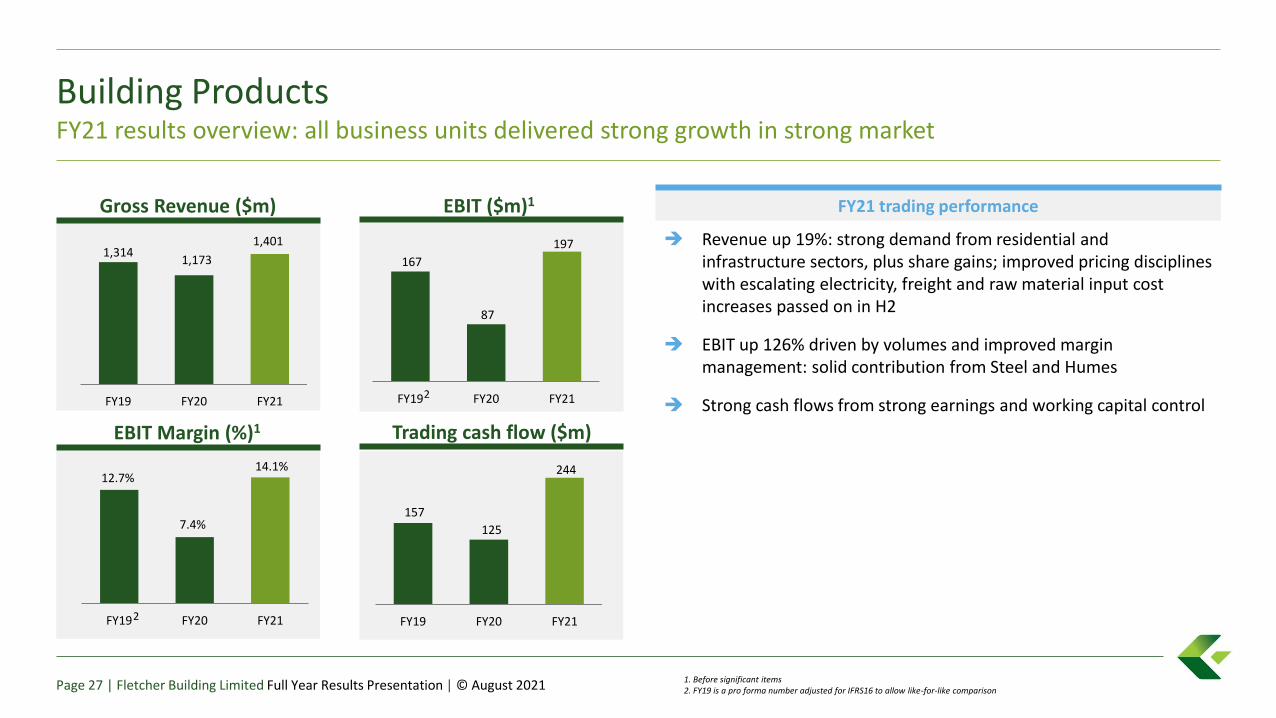
Building ProductsFY21 results overview: all business units delivered strong growth in strong market
1. Before significant items2. FY19 is a pro forma number adjusted for IFRS16 to allow like-for-like comparisonPage 27 | Fletcher Building Limited Full Year Results Presentation | © August 2021
EBIT Margin (%)1
12.7%
7.4%
14.1%
FY19 FY20 FY21
➔ Revenue up 19%: strong demand from residential and infrastructure sectors, plus share gains; improved pricing disciplines with escalating electricity, freight and raw material input cost increases passed on in H2
➔ EBIT up 126% driven by volumes and improved margin management: solid contribution from Steel and Humes
➔ Strong cash flows from strong earnings and working capital control
1,3141,173
1,401
FY19 FY20 FY21
167
87
197
FY19 FY20 FY21
Gross Revenue ($m)
157
125
244
FY19 FY20 FY21
Trading cash flow ($m)
EBIT ($m)1
2
2
Pro
du
cts
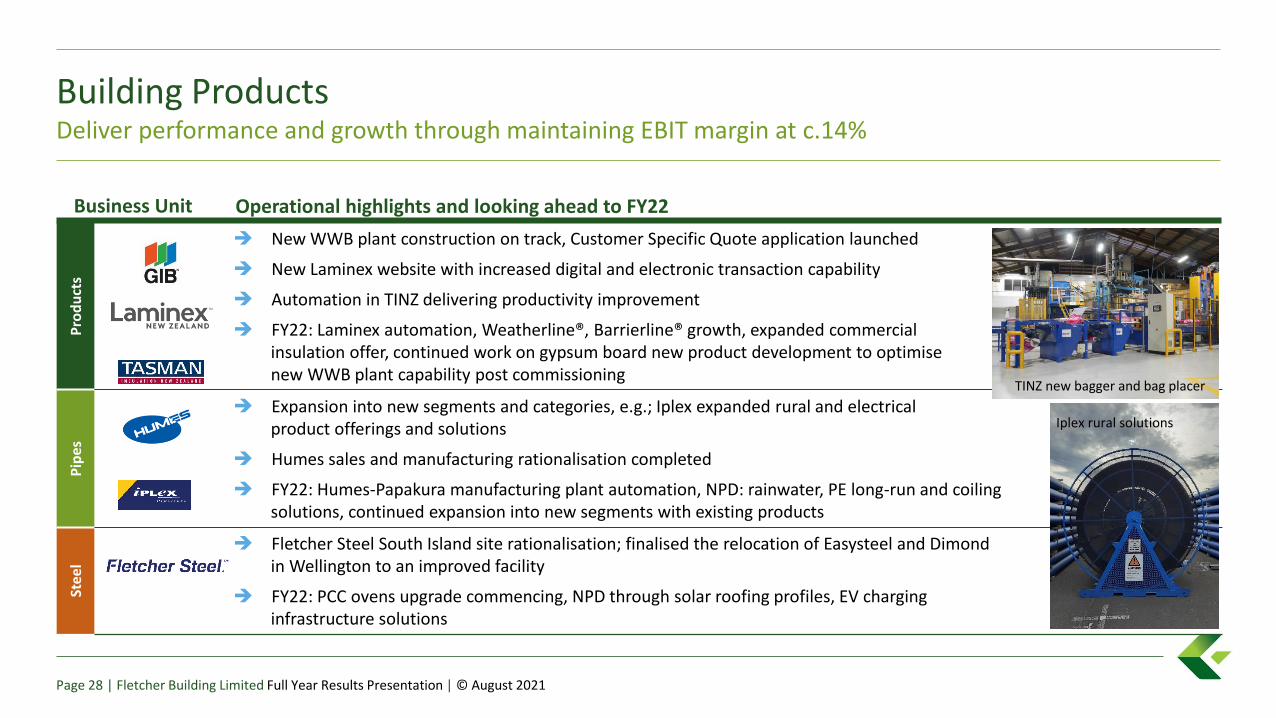
➔ New WWB plant construction on track, Customer Specific Quote application launched
➔ New Laminex website with increased digital and electronic transaction capability
➔ Automation in TINZ delivering productivity improvement
➔ FY22: Laminex automation, Weatherline®, Barrierline® growth, expanded commercial insulation offer, continued work on gypsum board new product development to optimise new WWB plant capability post commissioning
Pip
es
➔ Expansion into new segments and categories, e.g.; Iplex expanded rural and electrical product offerings and solutions
➔ Humes sales and manufacturing rationalisation completed
➔ FY22: Humes-Papakura manufacturing plant automation, NPD: rainwater, PE long-run and coiling solutions, continued expansion into new segments with existing products
Stee
l
➔ Fletcher Steel South Island site rationalisation; finalised the relocation of Easysteel and Dimond in Wellington to an improved facility
➔ FY22: PCC ovens upgrade commencing, NPD through solar roofing profiles, EV charginginfrastructure solutions
Building ProductsDeliver performance and growth through maintaining EBIT margin at c.14%
Page 28 | Fletcher Building Limited Full Year Results Presentation | © August 2021
INSERT IMAGETINZ new bagger and bag placer
Business Unit Operational highlights and looking ahead to FY22
Iplex rural solutions
1. Before significant items2. FY19 is a pro forma number adjusted for IFRS16 to allow like-for-like comparison
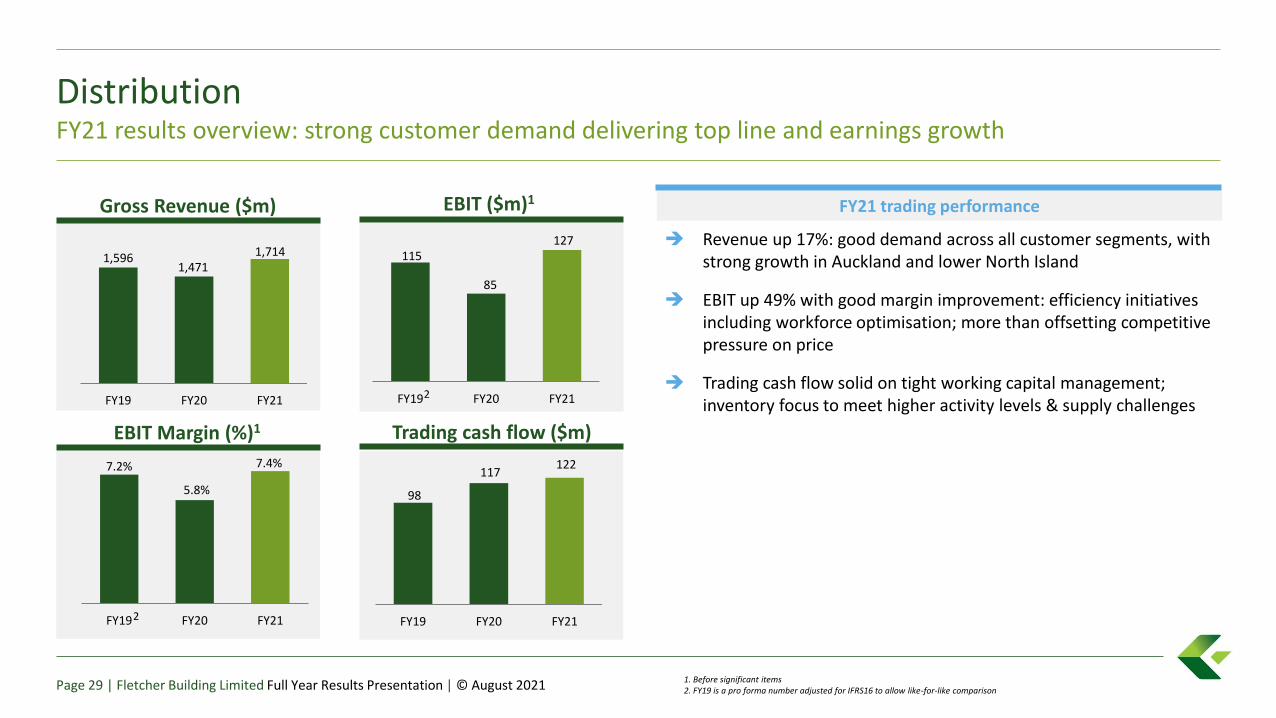
DistributionFY21 results overview: strong customer demand delivering top line and earnings growth
7.2%
5.8%
7.4%
FY19 FY20 FY21
➔ Revenue up 17%: good demand across all customer segments, with strong growth in Auckland and lower North Island
➔ EBIT up 49% with good margin improvement: efficiency initiatives including workforce optimisation; more than offsetting competitive pressure on price
➔ Trading cash flow solid on tight working capital management; inventory focus to meet higher activity levels & supply challenges
1,5961,471
1,714
FY19 FY20 FY21
115
85
127
FY19 FY20 FY21
Gross Revenue ($m)
98
117 122
FY19 FY20 FY21
EBIT Margin (%)1 Trading cash flow ($m)
EBIT ($m)1 FY21 trading performance
Page 29 | Fletcher Building Limited Full Year Results Presentation | © August 2021
2
2
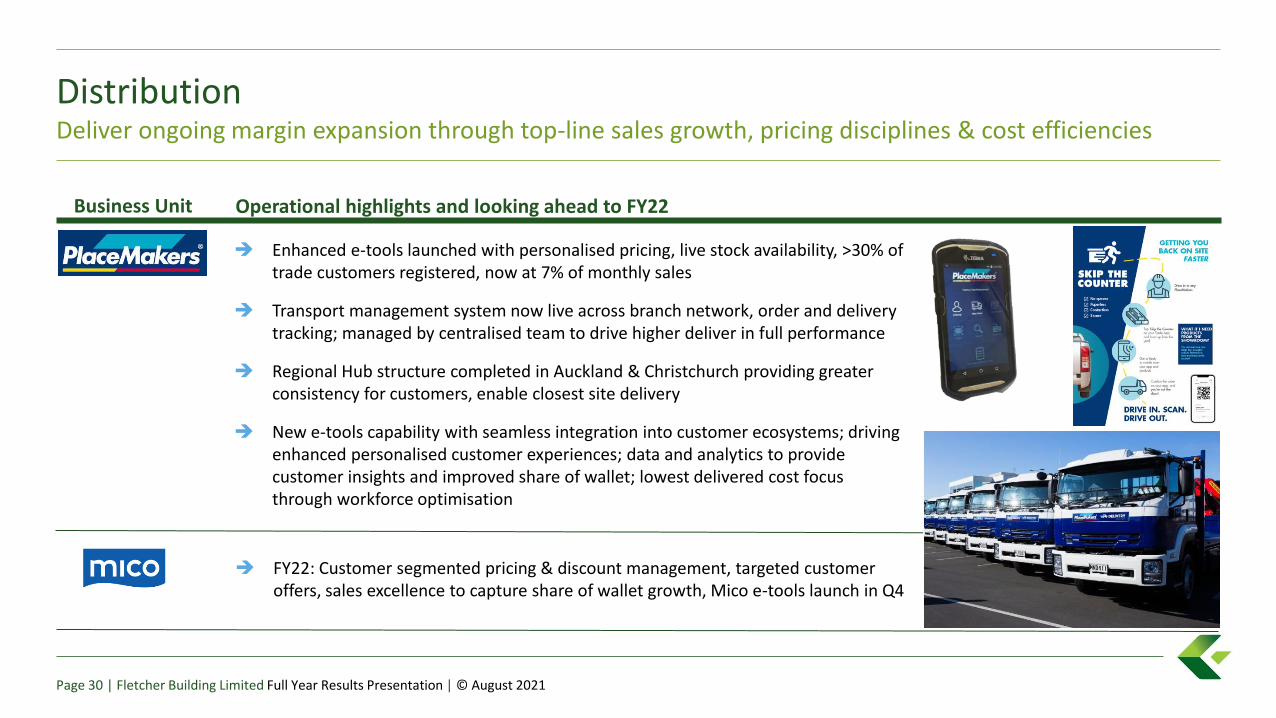
DistributionDeliver ongoing margin expansion through top-line sales growth, pricing disciplines & cost efficiencies
Page 30 | Fletcher Building Limited Full Year Results Presentation | © August 2021
➔ Enhanced e-tools launched with personalised pricing, live stock availability, >30% of trade customers registered, now at 7% of monthly sales
➔ Transport management system now live across branch network, order and delivery tracking; managed by centralised team to drive higher deliver in full performance
➔ Regional Hub structure completed in Auckland & Christchurch providing greater consistency for customers, enable closest site delivery
➔ New e-tools capability with seamless integration into customer ecosystems; driving enhanced personalised customer experiences; data and analytics to provide customer insights and improved share of wallet; lowest delivered cost focus through workforce optimisation
➔ FY22: Customer segmented pricing & discount management, targeted customer offers, sales excellence to capture share of wallet growth, Mico e-tools launch in Q4
Business Unit Operational highlights and looking ahead to FY22
1. Before significant items2. FY19 is a pro forma number adjusted for IFRS16 to allow like-for-like comparison
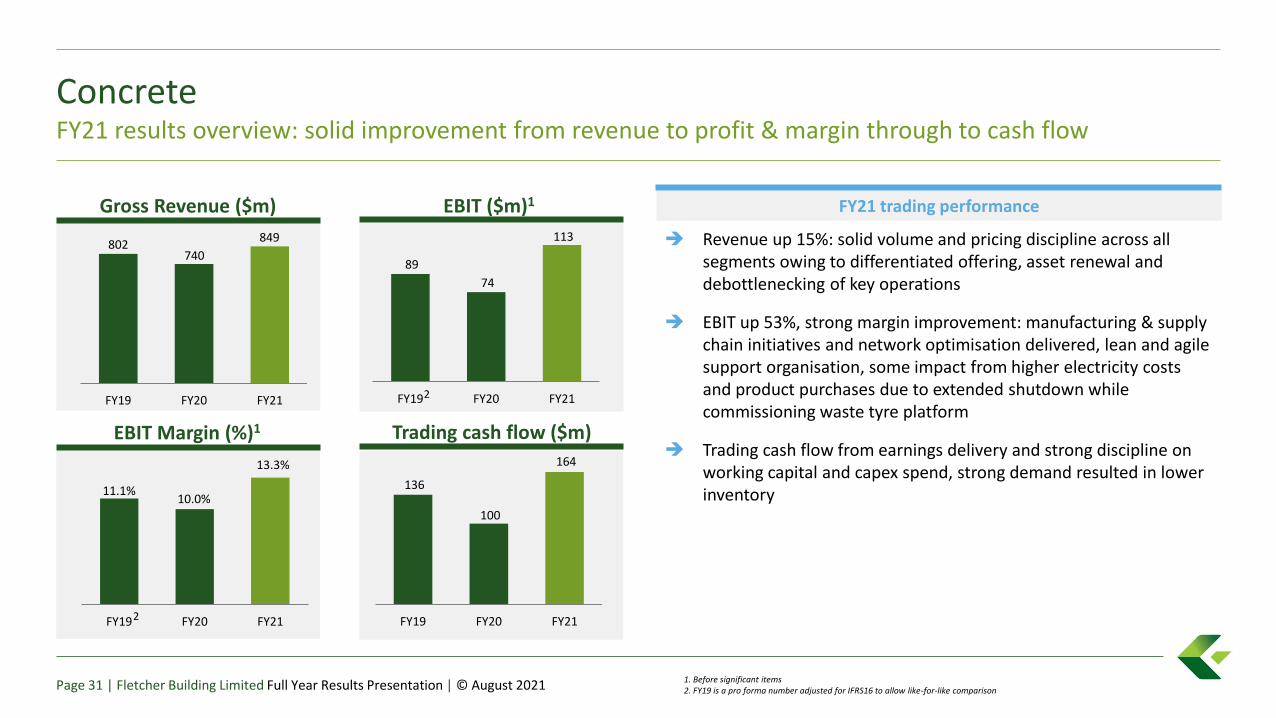
ConcreteFY21 results overview: solid improvement from revenue to profit & margin through to cash flow
11.1%10.0%
13.3%
FY19 FY20 FY21
802740
849
FY19 FY20 FY21
89
74
113
FY19 FY20 FY21
136
100
164
FY19 FY20 FY21
Gross Revenue ($m)
EBIT Margin (%)1 Trading cash flow ($m)
EBIT ($m)1 FY21 trading performance
Page 31 | Fletcher Building Limited Full Year Results Presentation | © August 2021
➔ Revenue up 15%: solid volume and pricing discipline across all segments owing to differentiated offering, asset renewal and debottlenecking of key operations
➔ EBIT up 53%, strong margin improvement: manufacturing & supply chain initiatives and network optimisation delivered, lean and agile support organisation, some impact from higher electricity costs and product purchases due to extended shutdown while commissioning waste tyre platform
➔ Trading cash flow from earnings delivery and strong discipline on working capital and capex spend, strong demand resulted in lower inventory
2
2

ConcretePerformance and growth by driving both margin expansion and above market growth
Page 32 | Fletcher Building Limited Full Year Results Presentation | © August 2021
Business Unit Operational highlights and looking ahead to FY22
➔ Topline: Full benefit from service extension and supply chain flexibility
➔ Bottom line: operational excellence, waste tyre project successfully commissioned
➔ Future growth: scale digital supply chain, drive alternative fuels and raw materials
➔ Topline: differentiation of products and solutions, benefit of asset renewal programme
➔ Bottom line: footprint and supply chain optimisation, lean and agile overhead organisation
➔ Future growth: 95% ready-mix products with Environmental Product Declarations, ready-mix online portal launched
➔ Topline: product portfolio optimisation, leverage footprint through debottlenecking
➔ Bottom line: Footprint and supply chain optimisation, operational excellence
➔ Future growth: digital design and quarry optimisation, fast scale of recycling
1. Before significant items2. FY19 is a pro forma number adjusted for IFRS16 to allow like-for-like comparison
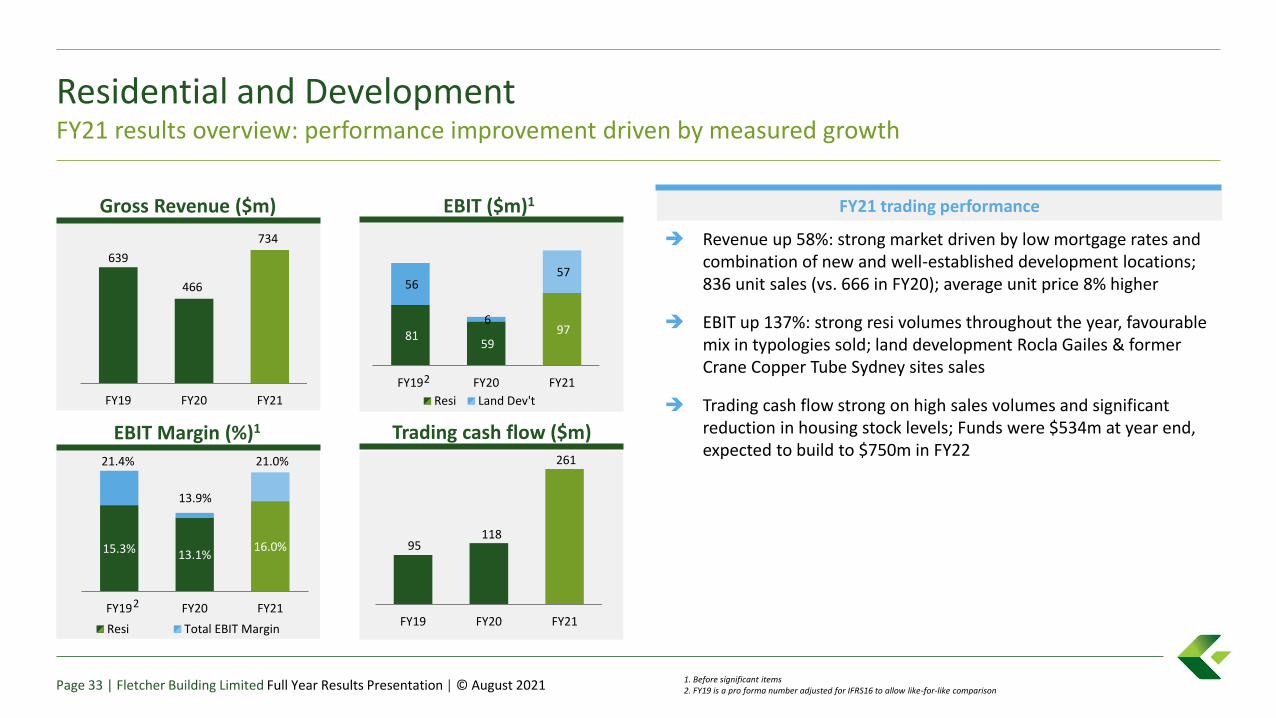
Residential and DevelopmentFY21 results overview: performance improvement driven by measured growth
15.3% 13.1%16.0%
FY19 FY20 FY21
Resi Total EBIT Margin
639
466
734
FY19 FY20 FY21
81 59
97
56
6
57
FY19 FY20 FY21
Resi Land Dev't
95 118
261
FY19 FY20 FY21
Gross Revenue ($m)
EBIT Margin (%)1 Trading cash flow ($m)
EBIT ($m)1 FY21 trading performance
Page 33 | Fletcher Building Limited Full Year Results Presentation | © August 2021
➔ Revenue up 58%: strong market driven by low mortgage rates and combination of new and well-established development locations; 836 unit sales (vs. 666 in FY20); average unit price 8% higher
➔ EBIT up 137%: strong resi volumes throughout the year, favourable mix in typologies sold; land development Rocla Gailes & former Crane Copper Tube Sydney sites sales
➔ Trading cash flow strong on high sales volumes and significant reduction in housing stock levels; Funds were $534m at year end, expected to build to $750m in FY22
2
2
21.4%
13.9%
21.0%
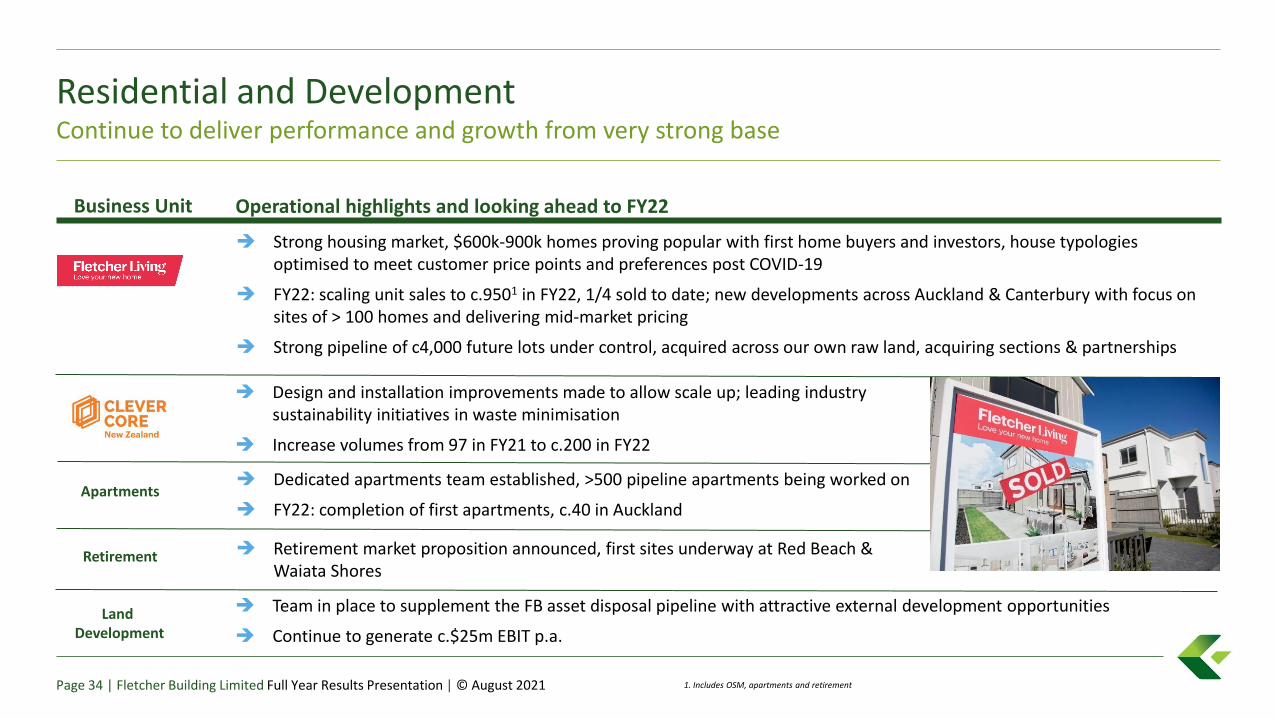
Residential and DevelopmentContinue to deliver performance and growth from very strong base
Page 34 | Fletcher Building Limited Full Year Results Presentation | © August 2021
Business Unit Operational highlights and looking ahead to FY22
➔ Strong housing market, $600k-900k homes proving popular with first home buyers and investors, house typologies optimised to meet customer price points and preferences post COVID-19
➔ FY22: scaling unit sales to c.9501 in FY22, 1/4 sold to date; new developments across Auckland & Canterbury with focus on sites of > 100 homes and delivering mid-market pricing
➔ Strong pipeline of c4,000 future lots under control, acquired across our own raw land, acquiring sections & partnerships
Apartments
Retirement ➔ Retirement market proposition announced, first sites underway at Red Beach & Waiata Shores
➔ Dedicated apartments team established, >500 pipeline apartments being worked on
➔ FY22: completion of first apartments, c.40 in Auckland
➔ Design and installation improvements made to allow scale up; leading industry sustainability initiatives in waste minimisation
➔ Increase volumes from 97 in FY21 to c.200 in FY22
➔ Team in place to supplement the FB asset disposal pipeline with attractive external development opportunities
➔ Continue to generate c.$25m EBIT p.a.Land
Development
1. Includes OSM, apartments and retirement
1. Before significant items2. FY19 is a pro forma number adjusted for IFRS16 to allow like-for-like comparison
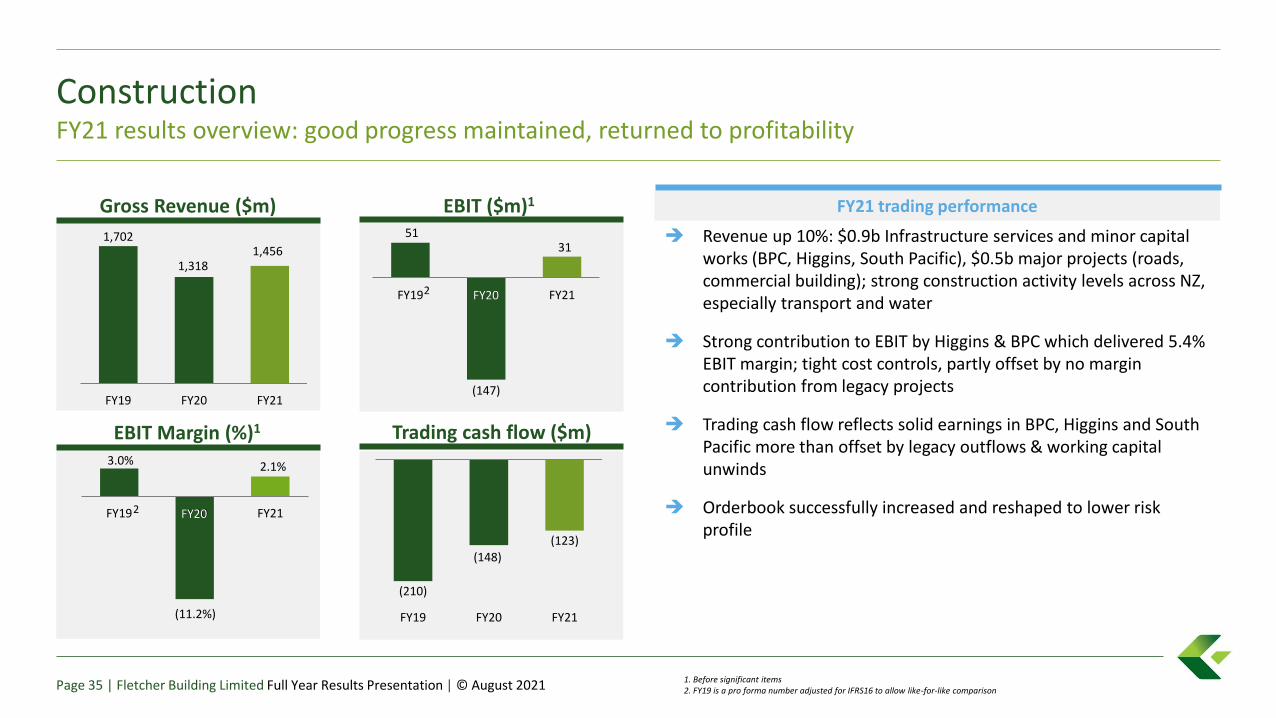
ConstructionFY21 results overview: good progress maintained, returned to profitability
3.0%
(11.2%)
2.1%
FY19 FY20 FY21
1,702
1,3181,456
FY19 FY20 FY21
51
(147)
31
FY19 FY20 FY21
(210)
(148)
(123)
FY19 FY20 FY21
Gross Revenue ($m)
EBIT Margin (%)1 Trading cash flow ($m)
EBIT ($m)1 FY21 trading performance
Page 35 | Fletcher Building Limited Full Year Results Presentation | © August 2021
FY20
FY20
➔ Revenue up 10%: $0.9b Infrastructure services and minor capital works (BPC, Higgins, South Pacific), $0.5b major projects (roads, commercial building); strong construction activity levels across NZ, especially transport and water
➔ Strong contribution to EBIT by Higgins & BPC which delivered 5.4% EBIT margin; tight cost controls, partly offset by no margin contribution from legacy projects
➔ Trading cash flow reflects solid earnings in BPC, Higgins and South Pacific more than offset by legacy outflows & working capital unwinds
➔ Orderbook successfully increased and reshaped to lower risk profile
2
2

ConstructionFY22 focus to deliver performance and growth: strong forward quality revenue secured with better EBIT margin
Page 36 | Fletcher Building Limited Full Year Results Presentation | © August 2021
Business Unit Operational highlights and looking ahead to FY22
➔ $1.2b 10 yr Watercare enterprise model
➔ $0.3b AMETI Eastern Busway 2,3,4 alliance project
➔ Fiji Roads Authority $80m various projects
➔ 67% represents low-to-medium risk style contracts – including multi-year alliance projects, longer term framework agreements, asset maintenance, smaller renewal & upgrade contracts
➔ Kāinga Ora $250m Eastern Porirua Regeneration programme
➔ Progress on major infrastructure & building projects continues, Commercial Bay, Biolabs and Te Nīkau Grey Hospital & Health Centre delivered; $0.3b work to complete on legacy projects (less than 10% forward orderbook)
➔ Strong activity levels supported by Water and Marine sectors, with material growth in the central & lower North Island
➔ Focus on self perform capability and specialised assets
➔ Record volumes of asphalt in FY21 and FY22 to supply major road projects, with new plants in Auckland and Napier
➔ Focus on roads maintenance contract performance, growth in Fiji, bitumen storage & distribution, enhanced digital asset management offering
$3.0b Order Book + $0.3b Preferred
➔ Underpins 75% of forecast revenue for FY22 and 50% of FY23Waikato 50 Water Project
1. Before significant items2. FY19 is a pro forma number adjusted for IFRS16 to allow like-for-like comparison
Gross Revenue ($m)
EBIT Margin (%)1 Trading cash flow ($m)
EBIT ($m)1
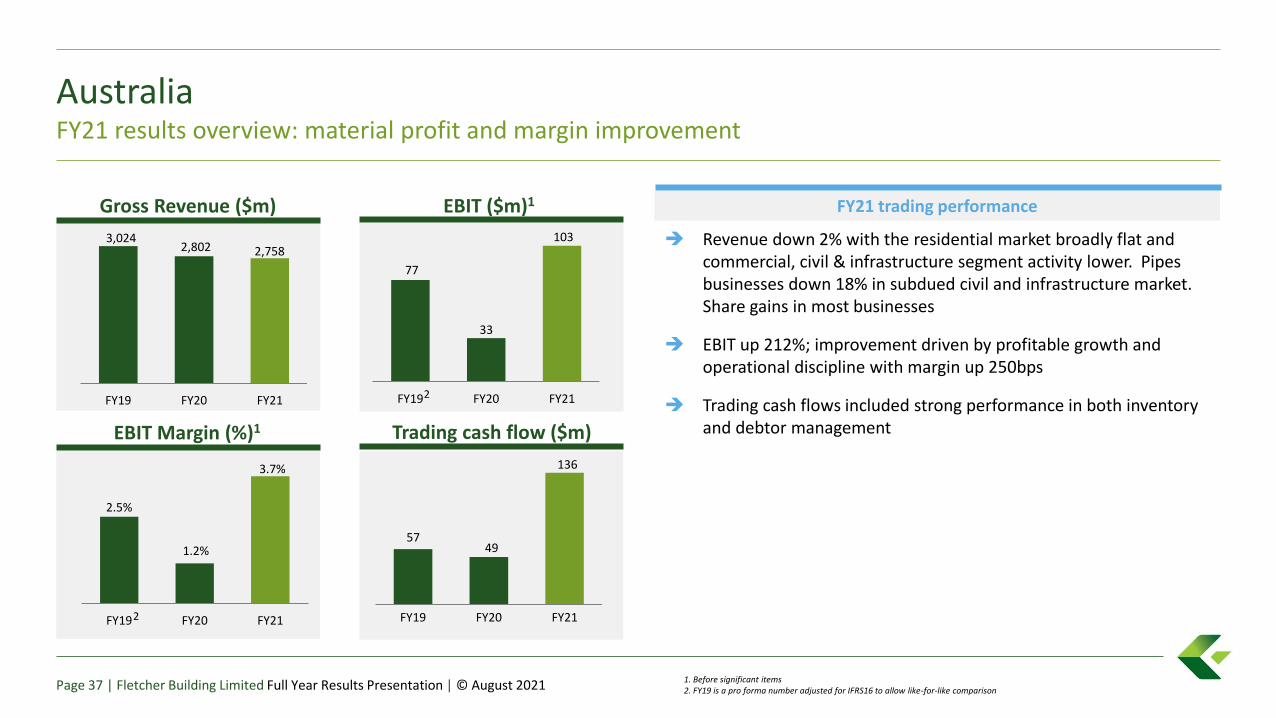
AustraliaFY21 results overview: material profit and margin improvement
2.5%
1.2%
3.7%
FY19 FY20 FY21
3,024 2,802 2,758
FY19 FY20 FY21
77
33
103
FY19 FY20 FY21
57 49
136
FY19 FY20 FY21
FY21 trading performance
Page 37 | Fletcher Building Limited Full Year Results Presentation | © August 2021
➔ Revenue down 2% with the residential market broadly flat and commercial, civil & infrastructure segment activity lower. Pipes businesses down 18% in subdued civil and infrastructure market. Share gains in most businesses
➔ EBIT up 212%; improvement driven by profitable growth and operational discipline with margin up 250bps
➔ Trading cash flows included strong performance in both inventory and debtor management
2
2
Pro
du
cts
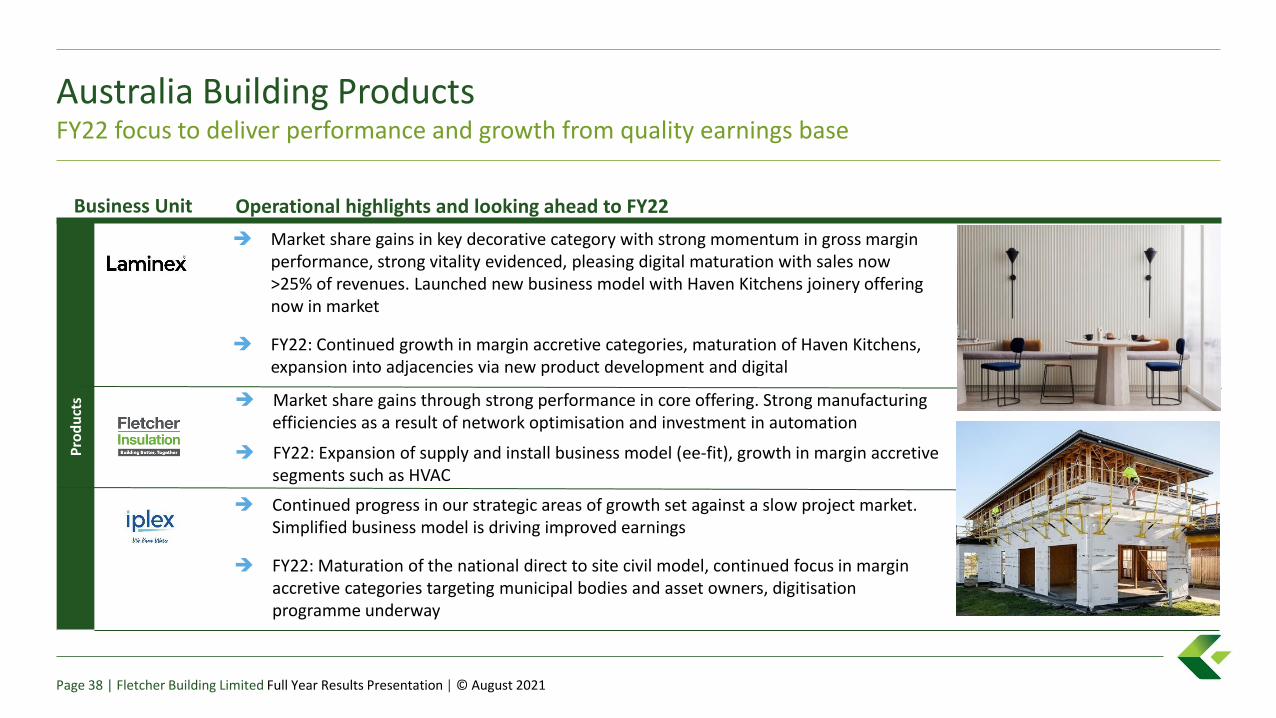
Australia Building ProductsFY22 focus to deliver performance and growth from quality earnings base
Page 38 | Fletcher Building Limited Full Year Results Presentation | © August 2021
Business Unit Operational highlights and looking ahead to FY22
➔ Market share gains in key decorative category with strong momentum in gross margin performance, strong vitality evidenced, pleasing digital maturation with sales now >25% of revenues. Launched new business model with Haven Kitchens joinery offering now in market
➔ FY22: Continued growth in margin accretive categories, maturation of Haven Kitchens, expansion into adjacencies via new product development and digital
➔ Market share gains through strong performance in core offering. Strong manufacturing efficiencies as a result of network optimisation and investment in automation
➔ FY22: Expansion of supply and install business model (ee-fit), growth in margin accretive segments such as HVAC
➔ Continued progress in our strategic areas of growth set against a slow project market. Simplified business model is driving improved earnings
➔ FY22: Maturation of the national direct to site civil model, continued focus in margin accretive categories targeting municipal bodies and asset owners, digitisation programme underway
Dis
trib
uti
on
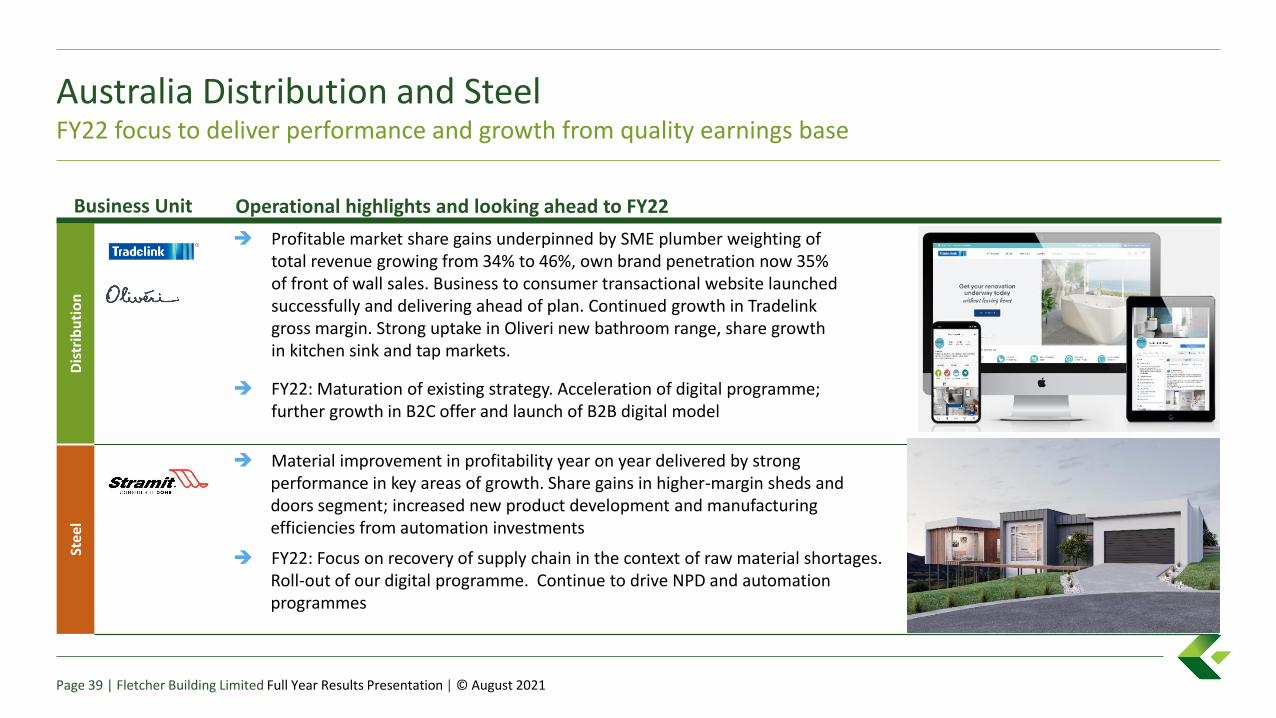
➔ Profitable market share gains underpinned by SME plumber weighting of total revenue growing from 34% to 46%, own brand penetration now 35% of front of wall sales. Business to consumer transactional website launched successfully and delivering ahead of plan. Continued growth in Tradelink gross margin. Strong uptake in Oliveri new bathroom range, share growth in kitchen sink and tap markets.
➔ FY22: Maturation of existing strategy. Acceleration of digital programme; further growth in B2C offer and launch of B2B digital model
Stee
l
➔ Material improvement in profitability year on year delivered by strong performance in key areas of growth. Share gains in higher-margin sheds and doors segment; increased new product development and manufacturing efficiencies from automation investments
➔ FY22: Focus on recovery of supply chain in the context of raw material shortages. Roll-out of our digital programme. Continue to drive NPD and automation programmes
Australia Distribution and SteelFY22 focus to deliver performance and growth from quality earnings base
Page 39 | Fletcher Building Limited Full Year Results Presentation | © August 2021
Business Unit Operational highlights and looking ahead to FY22
Fletcher Building Limited
Agenda
1. Results Overview Ross Taylor
2. Financial Results Bevan McKenzie
3. Markets and Divisions Ross Taylor
New Zealand Operations
- Building Products Hamish McBeath
- Distribution Bruce McEwen
- Concrete Nick Traber
- Residential and Development Steve Evans
- Construction Peter Reidy
Australia Operations Dean Fradgley
4. Outlook Ross Taylor

FY22 outlookContinue to drive performance and growth
Page 41 | Fletcher Building Limited Full Year Results Presentation | © August 2021
➔ New Zealand: activity pipeline continues to look “stronger for longer,” especially in Residential; supply chain and labour constraints mean Residential sector is currently at or near capacity, likely to mean extended period of building activity in FY22 and beyond
➔ Australia: macro backdrop supportive for growth; Residential outlook strong, detached housing and renovations supportive offset by apartments sector; Commercial and key civil sectors stabilising at current levels
➔ Input cost inflation and supply chain disruption remain key features of the NZ and AU operating environment; businesses well set up to recover costs through price
➔ COVID-19 outbreaks/lockdowns remain a risk. Sharp operational focus, strong response disciplines embedded
➔ We have a strong balance sheet, a favourable market outlook, and remain well-positioned to drive performance and growth
➔ Further update on trading and outlook to be provided at Annual Shareholders Meeting in October 2021
Fletcher Building Limited
Appendix
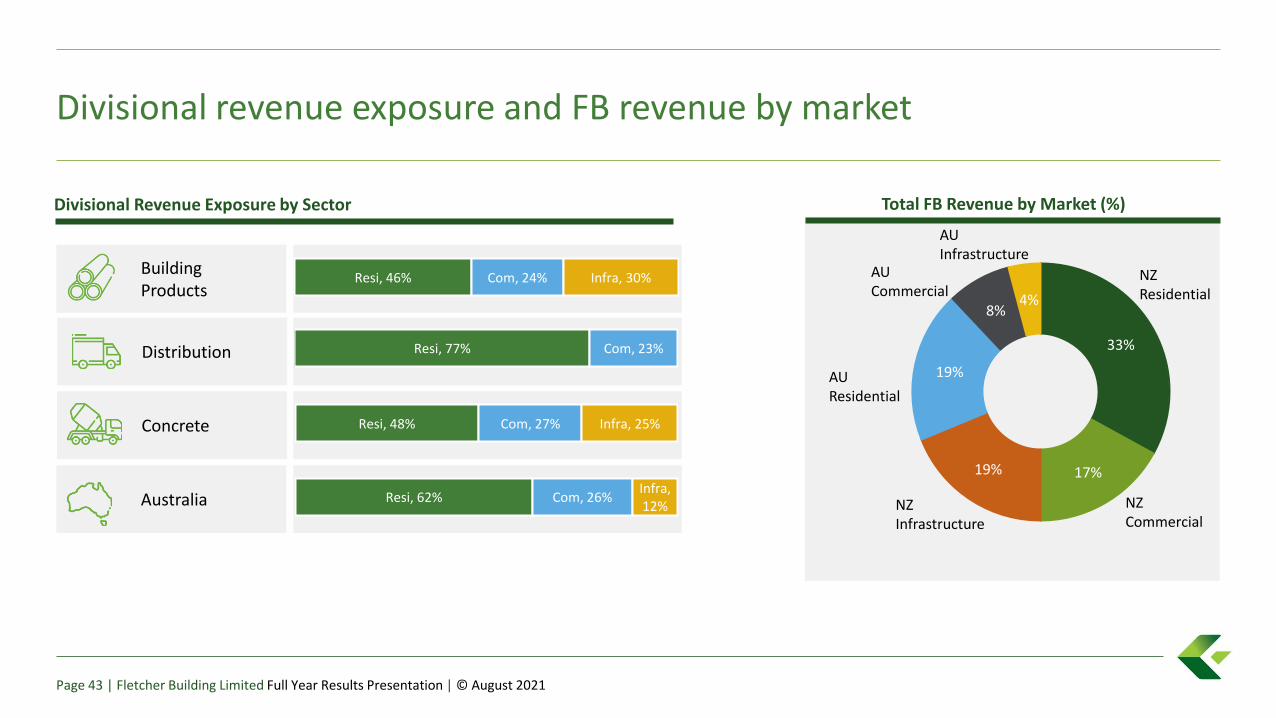
Divisional revenue exposure and FB revenue by market
Resi, 46% Com, 24% Infra, 30%
Resi, 77% Com, 23%
Resi, 48% Com, 27% Infra, 25%
Resi, 62% Com, 26%Infra, 12%
33%
17%19%
19%
8%4%
NZ Residential
NZ Commercial
NZInfrastructure
AU Infrastructure
AU Commercial
AUResidential
Total FB Revenue by Market (%)Divisional Revenue Exposure by Sector
Distribution
Building Products
Concrete
Australia
Page 43 | Fletcher Building Limited Full Year Results Presentation | © August 2021