Embed Size (px)
Citation preview
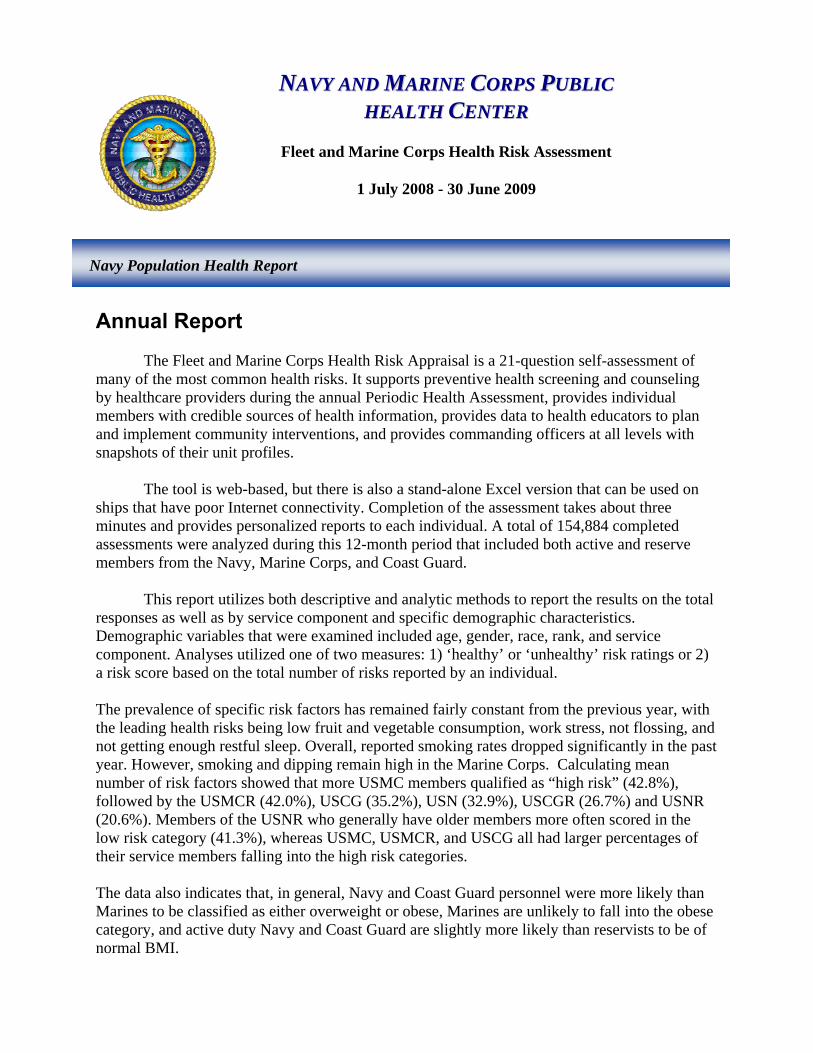
Annual Report
The Fleet and Marine Corps Health Risk Appraisal is a 21-question self-assessment of many of the most common health risks. It supports preventive health screening and counseling by healthcare providers during the annual Periodic Health Assessment, provides individual members with credible sources of health information, provides data to health educators to plan and implement community interventions, and provides commanding officers at all levels with snapshots of their unit profiles. The tool is web-based, but there is also a stand-alone Excel version that can be used on ships that have poor Internet connectivity. Completion of the assessment takes about three minutes and provides personalized reports to each individual. A total of 154,884 completed assessments were analyzed during this 12-month period that included both active and reserve members from the Navy, Marine Corps, and Coast Guard. This report utilizes both descriptive and analytic methods to report the results on the total responses as well as by service component and specific demographic characteristics. Demographic variables that were examined included age, gender, race, rank, and service component. Analyses utilized one of two measures: 1) ‘healthy’ or ‘unhealthy’ risk ratings or 2) a risk score based on the total number of risks reported by an individual. The prevalence of specific risk factors has remained fairly constant from the previous year, with the leading health risks being low fruit and vegetable consumption, work stress, not flossing, and not getting enough restful sleep. Overall, reported smoking rates dropped significantly in the past year. However, smoking and dipping remain high in the Marine Corps. Calculating mean number of risk factors showed that more USMC members qualified as “high risk” (42.8%), followed by the USMCR (42.0%), USCG (35.2%), USN (32.9%), USCGR (26.7%) and USNR (20.6%). Members of the USNR who generally have older members more often scored in the low risk category (41.3%), whereas USMC, USMCR, and USCG all had larger percentages of their service members falling into the high risk categories. The data also indicates that, in general, Navy and Coast Guard personnel were more likely than Marines to be classified as either overweight or obese, Marines are unlikely to fall into the obese category, and active duty Navy and Coast Guard are slightly more likely than reservists to be of normal BMI.
NNAAVVYY AANNDD MMAARRIINNEE CCOORRPPSS PPUUBBLLIICC
HHEEAALLTTHH CCEENNTTEERR
Fleet and Marine Corps Health Risk Assessment
1 July 2008 - 30 June 2009
Navy Population Health Report

Table of Contents Background..................................................................................................................................... 1 Methods........................................................................................................................................... 1
Survey Design............................................................................................................................. 1 Data Collection and Analyses..................................................................................................... 2
Results............................................................................................................................................. 3 Demographic Analysis Results ................................................................................................... 3 HRA Risk Factor Analysis.......................................................................................................... 8
BMI Status .............................................................................................................................. 8 Distribution of “Healthy” Versus “Unhealthy” Responses .................................................... 9 Distribution of Risk Categories ............................................................................................ 13 Change in Healthy Responses............................................................................................... 13 Perception of Health ............................................................................................................. 14 Mean Risk by Demographic Variables ................................................................................. 15 Days Away from Home Station............................................................................................ 18 Days Away from Home Station and Mean Risk................................................................... 20 Days Away from Home Station and Risk Score................................................................... 20 Days Away from Home Station and Unhealthy Behaviors .................................................. 21
Discussion..................................................................................................................................... 25 Strengths and Limitations ......................................................................................................... 25 Demographics ........................................................................................................................... 25 Risk Factors .............................................................................................................................. 26 Days Away from Home ............................................................................................................ 26
Conclusion .................................................................................................................................... 26

1
Background Health Risk Assessments (HRAs) became widely used both in military and civilian settings beginning in the mid-1980s. HRAs are tools that can be used to educate patients, to assist healthcare professionals in counseling patients, and to inform decision makers of the overall health status of their populations. Different versions of HRAs are available to assess a range of conditions and risk behaviors among specific population subgroups. The Fleet and Marine Corps HRA is a 21-question, self-reported, web-based assessment tool that assesses risk behaviors that are common to military members. However, the topics and scoring criteria are valid for the general adult population.
Methods
Survey Design The Fleet and Marine Corps HRA seeks to identify healthy lifestyle choices and various levels of risk that jeopardize health, either from disease or injury. The questions are based on other validated tools, such as the Alcohol Use Disorders Identification Test (AUDIT), the DoD Survey of Health Related Behaviors Among Military Personnel, and the National Health and Nutrition Examination Survey (NHANES), or are based on input from subject matter experts. The Fleet and Marine Corps HRA has one question on the general self-assessment of personal health, followed by 20 questions within 10 risk categories (See Appendix A). The general self-assessment question asks participants to rate their general health. The remaining 20 questions provide a snapshot of leading health indicators. The categories include:
1. tobacco use 2. alcohol use 3. safety 4. stress management 5. sexual health 6. physical activity 7. nutrition 8. supplement use 9. dental health 10. sleep problems

2
Data Collection and Analyses Data from 159,695 surveys were collected from the most recent 12-month period, 01 July 2008 through 30 June 2009. The data were analyzed by the EpiData Center at the Navy and Marine Corps Public Health Center (NMCPHC). Surveys were excluded from the analysis for the following reasons:
a. Records with blank fields were considered incomplete. There were a total of 1,141 incomplete records.
b. Surveys completed by service members other than the Navy, Marine Corps, and Coast Guard active duty and reserves were also excluded from the analyses. These included assessments completed by Army Active Duty/Reserves (613), Air Force Active Duty/Reserves (704), Civilian Mariners (1,108), and Civilians (710). In addition, members who identified themselves as Navy, Marine Corps, or Coast Guard members and had a rank of civilian were excluded (535).
The total number of surveys included in the analysis was 154,884. All analyses utilized one of two measures: 1) ‘healthy’ or ‘unhealthy’ risk ratings or 2) a risk score. For the 20 risk assessment questions, responses ranged from ‘a-f’ and were categorized “healthy” or “unhealthy” according to the standards listed in Appendix B. A risk score was tabulated based on the total number of risk categories in which one or more of the questions were reported as unhealthy. Risk scores ranged from 0-10 and were categorized into risk levels low, medium, and high. 0-2 risk categories = low risk 3-4 risk categories = medium risk 5 or more risk categories = high risk Risk scores do not predict early morbidity or mortality. Higher risk scores indicate that participants will more likely use more healthcare services in the future.
Descriptive analyses, frequencies, and percentages were used to describe survey respondents. T-tests and Tukey’s test (a nonparametric ANOVA test) were used to compare the mean risk scores among the various demographic groups. Logistic regression examining the relationship between days away from home station and risk number was conducted using SAS® software (Version 9.1.3 SAS Institute, Inc., Cary, North Carolina).
The HRA collects the following demographic variables: Age, gender, race, rank and service. The demographic of age was categorized using cut points of 17-19, 20-29, 30-39, 40-49, and 50 and over. Race was categorized as Caucasian, African Americans, Asian and Pacific Islanders, Hispanics or Other. Rank was categorized as enlisted service members (E1-E5 or E6-E9), officers, (O1-O3 or O4-O9), and warrant officers (W1-W5).
Body Mass Index (BMI) was another variable that was calculated from self-reported height and weight data, according to current Centers for Disease Control guidelines ([weight ÷ (height in inches)2] x 703)1. BMI values that exceed healthy levels have been shown in research studies to be an independent risk factor for certain diseases and all-cause mortality.

3
Results
First, the analysis examines who completed the survey by demographic characteristics. It then examines the distribution of BMI. BMI values between 25 and 29.9 were classified as overweight and BMI values of 30 and above were classified as obese1. The report also examines the distribution of “healthy” versus “unhealthy” responses for each question by service component and compares their Mean Risk by demographic variables. Finally, the analysis examines the association between Days Away from Home Station with both Mean Risk and the distribution of unhealthy behaviors for eight of the questions. The number of “Days Away from Home Station” was categorized into four groups: 0 days away, 1-29 days away, 30-179 days away, and 180-365 days away. These groups were chosen based on the Navy’s set points for TDY fiscal reimbursement. Logistic regression was also used to evaluate the relationship between days away from home station and risk score.
Demographic Analysis Results There were 159,695 surveys completed for the 2009 HRA, of which 154,884 surveys completed by members of the United States Navy (USN), United States Navy Reserves (USNR), United States Marine Corps (USMC), United States Marine Corps Reserves (USMCR), United States Coast Guard (USCG), and United States Coast Guard Reserve (USCGR) were included in the analysis. Surveys completed by other services (Army, Air Force, civilian Mariners, and civilians) represented 0.49% of all completed surveys. Descriptive analyses of service demographics showed that the majority (48.8%) of survey respondents were active duty Navy service members, while 21.7% were Navy Reserves, 16.6% were active duty and reserve Marines, and 11.97% were active duty and reserve Coast Guard members (Figure 1). Figure 1 : Percentage of HRAs Completed by Service
Distribution of Completed HRAs by Service Component (n=154,884)
49%
22%
13%
4%
10%2%
USN (n=76,277)
USNR (n=33,879)
USMC (n=19,983)
USMCR (n=6,028)
USCG (n=16,171)
USCGR (n=2,546)

4
Age distribution of survey respondents indicated 47.8% of the respondents were in the 20-29 year old age group (Figure 2). Figure 2: Age Distribution of HRA Survey Participants Overall, Navy and Coast Guard service member respondents were older than the Marines survey respondents (Figure 3). The mean age of service member respondents was USN=30.3 years of age (95% CI: 30.2-30.3); USNR=36.3 years of age (95% CI: 36.2-36.4); USMC=25.6 years of age (95% CI: 25.5-25.7); USMCR=25.7 years of age (95% CI: 25.5-25.8); USCG= 30.9 years of age (95% CI: 30.8-31.0); and USCGR= 36.6 (95% CI: 36.2- 34.0). Figure 3: Age by Service for HRA Survey Participants
Age Distribution of Completed HRAs by Service Component (N=154,884)
0%
20%
40%
60%
80%
100%
USN USNR USMC USMCR USCG USCGR
50+
40-49
30-39
20-29
17-19
Age Distribution of Completed HRA Survey (n=136, 167)
29.5
3.2
15.7
3.8
47.8
0
10
20
30
40
50
60
17-19 20-29 30-39 40-49 50+
Age Group
Perc
ent

5
With respect to gender, more males completed the HRA (82.7%), which reflects the general male/female ratio of military service members. Actual percentages of females range from about 6% in the USMC to 15% in the Navy. The gender difference was especially evident in the Marine Corps, with less than 10% of the HRAs completed by females. Figure 4: Gender Distribution of Survey Participants
Gender Distrubution of Completed HRAs by Service Component (N=154,884)
0102030405060708090
100
Male Female
Gender
USN
USNR
USMC
USMCR
USCG
USCGR
ALL
Distribution by rank of survey respondents indicated that 81.6 % were completed by enlisted members, 17.5% by officers, and less than 0.88% by warrant officers. Figures 5-7 displays the distribution of respondents’ rank by service. Figure 5: Distribution by Rank of Survey Participants-Enlisted
Rank (Enlisted Personnel) Distrubution of Completed HRAs by Service Component (N=126,403)
0%10%20%30%40%50%60%70%80%90%
100%
USN USNR USMC USMCR USCG USCGR ALL
Rank
Perc
ent E7-E9
E4-E6
E1-E3

6
Figure 6: Distribution by Rank of Survey Participants-Officer
Rank (Officer Personnel) Distrubution of Completed HRAs by Service Component (N=27,112)
0.0
10.0
20.0
30.0
40.0
50.0
60.0
70.0
80.0
USN USNR USMC USMCR USCG USCGR ALL
Rank
Perc
ent O1-O3
O4-O6
O7-O9
Figure 7: Distribution by Rank of Survey Participants-Warrant Officer
Rank (Warrant Officer) Distrubution of Completed HRAs by Service Component (N=1369)
0
10
20
30
40
50
60
USN USNR USMC USMCR USCG USCGR ALL
Rank
Perc
ent
W1
W2
W3
W4
W5

7
Race varied somewhat between service components, but across services, survey respondents were predominantly Caucasian, (60%). (Figure 8). Figure 8: Distribution of Completed HRAs by Race
Race Distribution of Completed HRAs by Service Component (N=151,645)
0
10
20
30
40
50
60
70
80
90
African-American Caucasian Asian/PI Hispanic Other
Race Category
Perc
ent
USN
USNR
USMC
USMCR
USCG
USCGR
ALL

8
HRA Risk Factor Analysis
BMI Status As a screening test, BMI usually correlates well in the U.S. population with the amount of body fat, although some individuals such as muscular athletes may have BMIs that identify them as overweight even though they do not have excess body fat. Therefore, this data should not necessarily lead to the conclusion that all individuals exceeding these levels are either overweight or obese. Rather, the data may support some general observations about weight across the services. For example, the data indicated that, in general, Navy and Coast Guard personnel were more likely than Marines to be classified as either overweight or obese, Marines are unlikely to fall into the obese category, and active duty Navy and Coast Guard are slightly more likely to be of normal BMI than reservists (Figure 9). Overall, 63% of service members were also classified as overweight and obese according to the CDC BMI standards for healthy adults. Figure 9: BMI Distribution by Service for Completed HRAs
Distribution of BMI Category for Completed HRAs by Service Component
(N=154,884)
010203040506070
USMC USMR USN USNR USCG USCGR ALL
Service Category
Per
cent
Underweight
Normal
Overweight
Obese

9
Distribution of “Healthy” Versus “Unhealthy” Responses
As shown in Appendix B, each HRA question was classified as ‘healthy’ or ‘unhealthy’ based on response to the question.
The next six graphs (Figures 10-16) display the results of these questions by service component.
Overall for all components, the two leading health risks (unhealthy ratings) were the same. The highest reported health risks were low daily intake of fruits and vegetables (84%) and work stress (51%). Figure 10 shows that among all respondents other significant areas of concern included lack of dental flossing (46%), lack of sleep (31%), smoking (26%), “dipping” (10%), heavy drinking (26%), lack of personal support (25%), and lack of aerobic activity (25%) . Overall, the most common healthy behaviors reported by members included teeth brushing (95%), use of safety equipment (96%), including helmets (91%) and seat belts, (93%). However, 6% of all members reported driving after drinking too much alcohol.
Figure 10: HRA Response Distribution, All Service Components
Distribution of Healthy vs. Unhealthy Responses on HRA Questions for All Service Components
0 20 40 60 80 100
SmokingDipping
Drinks/dayHeavy Drinking
Drinking & DrivingSeat Belts
Helmet UseSafety Equipment
Life SatisfactionWork Stress
Personal SupportCondom Use
Aerobic ActivityStrength Training
High Fat FoodsFruits &
SupplementsFlossingBrushing
Sleep
Percent
Unhealthy
Healthy

10
USN members reported significantly more risk factors than USNR members (Figures 11 & 12). As stated earlier, both groups shared their top two risk factors of low intake of fruits and vegetables (85% and 78% respectively) and work stress (55% and 43% respectively). In addition, 27% of USN and 21% of USNR members reported having little or no personal support to deal with stress. USN service members reported more frequent heavy drinking (19%), and a higher average number of drinks per day (26%) compared to USNR members (15% and 9%, respectively). The USN members reported higher rates of smoking (27.%) than did the USNR members (17%). USN members also reported they did not get enough restful sleep (34%) compared with USNR members (22%). Both USN and USNR members reported low rates of dental flossing (45% and 38%, respectively). Figure 11: HRA Response Distribution, USN
USN Distribution of Healthy vs. Unhealthy Responses on HRA Questions
0 20 40 60 80 100 120
SmokingDipping
Drinks/dayHeavy Drinking
Drinking & DrivingSeat Belts
Helmet UseSafety
Life SatisfactionWork Stress
Personal SupportCondom Use
Aerobic ActivityStrength Training
High Fat FoodsFruits &
SupplementsFlossingBrushing
Sleep
Percent
Unhealthy
Healthy
Figure 12: HRA Response Distribution, USNR
USNR Distribution of Healthy vs. Unhealthy Responses on HRA Questions
0 20 40 60 80 100
SmokingDipping
Drinks/dayHeavy Drinking
Drinking & DrivingSeat Belts
Helmet UseSafety
Life SatisfactionWork Stress
Personal SupportCondom Use
Aerobic ActivityStrength Training
High Fat FoodsFruits &
SupplementsFlossingBrushing
Sleep
Percent
Unhealthy
Healthy

11
The USMC and USMCR followed these same trends based on reported risks (Figures 13 & 14). Both groups reported low intake of fruits and vegetables (88% and 86%, respectively), low levels of flossing (57% and 59%, respectively), and high levels of work stress (48% and 42%, respectively). USMC and USMCR members both reported the same high rates of heavy drinking (40%), and high average number of drinks per day (about 30%). Members of both groups also reported high levels of tobacco use. Smoking was 38% and 31%, and dipping was 21% and 19%, respectively. Both groups of Marines reported they commonly did not get enough restful sleep (37% and 33%, respectively). Marines also reported similar rates of low personal support (27% and 22%, respectively) compared to Navy members. More USMCR members (14%) reported driving after drinking too much alcohol. Both groups of Marines also reported higher levels of unsafe sex (27% and 23%, respectively) compared with Navy members.
Figure 13: HRA Response Distribution, USMC
USMC Distribution of Healthy vs. Unhealthy Responses on HRA Questions
0 20 40 60 80 100
SmokingDipping
Drinks/dayHeavy Drinking
Drinking & DrivingSeat Belts
Helmet UseSafety
Life SatisfactionWork Stress
Personal SupportCondom Use
Aerobic ActivityStrength Training
High Fat FoodsFruits &
SupplementsFlossingBrushing
Sleep
Percent
Unhealthy
Healthy
Figure 14: HRA Response Distribution, USMCR
USMCR Distribution of Healthy vs. Unhealthy Responses on HRA Questions
0 20 40 60 80 100
SmokingDipping
Drinks/dayHeavy Drinking
Drinking &Seat Belts
Helmet UseSafety
LifeWork Stress
PersonalCondom Use
Aerobic ActivityStrength
High Fat FoodsFruits/Vegs.
SupplementsFlossingBrushing
Sleep
Percent
Unhealthy
Healthy

12
The USCG and USCGR showed similar results (Figures 15&16). Members of both groups reported low consumption of fruits and vegetables (86%), high levels of work stress (56% and 50% respectively), and low levels of flossing (52% and 45% respectively). Overall, both groups of Coast Guard members reported the lowest levels of aerobic activity 31% and 36%, respectively) and strength training (22% and 26%, respectively). USCG and USCGR members reported slightly lower rates of smoking (25% and. 16%, respectively) comparable to Navy members, but reported higher rates of alcohol use. They more often reported heavy alcohol consumption (28% and 21%, respectively) and a higher average number of drinks per day (22% and 16%, respectively). Like other service members, they frequently reported not getting enough restful sleep (32% and 22%, respectively). Figure 15: HRA Response Distribution, USCG
USCG Distribution of Healthy vs. Unhealthy Responses on HRA Questions
0 20 40 60 80 100
SmokingDipping
Drinks/dayHeavy Drinking
Drinking & DrivingSeat Belts
Helmet UseSafety
Life SatisfactionWork Stress
Personal SupportCondom Use
Aerobic ActivityStrength Training
High Fat FoodsFruits &
SupplementsFlossingBrushing
Sleep
Percent
Unhealthy
Healthy
Figure16: HRA Response Distribution, USMCR
USCGR Distribution of Healthy vs. Unhealthy Responses on HRA Questions
0 20 40 60 80 100
SmokingDipping
Drinks/dayHeavy Drinking
Drinking & DrivingSeat Belts
Helmet UseSafety
Life SatisfactionWork Stress
Personal SupportCondom Use
Aerobic ActivityStrength Training
High Fat FoodsFruits &
SupplementsFlossingBrushing
Sleep
Percent
Unhealthy
Healthy

13
Distribution of Risk Categories
Figure 17 displays risk categories for each service component, based on the number of members falling within each risk category. Each service member was categorized as low, medium, or high risk based on the number of risk categories in which they reported unhealthy responses. Members in higher risk categories are considered more likely to utilize healthcare services in the future.
Figure 17: Risk Category Distribution
Distribution of Risk Categories for Completed HRAs by Service Component
(N=154, 884)
0102030405060708090
100
LOW MEDIUM HIGH
Risk Category
Perc
ent USN
USNR
USMC
USMCR
USCG
USCGR
ALL
Calculating mean number of risk factors showed that more USMC members qualified as “high risk” (42.8%), followed by the USMCR (42.0%), USCG (35.2%), USN (32.9%), USCGR (26.7%) and USNR (20.6%). Members of the USNR who generally have older members most often scored in the low risk category (41.3%), whereas USMC, USMCR, and USCG all had larger percentages of their service members falling into the high risk categories.
Change in Healthy Responses Table 1 displays the percent of respondents that were classified healthy for both this year and the previous study period of July 1, 2007 to June 20, 2008. Percent change in the ‘healthy’ response was calculated and appears in the last column. Note that the previous study year excluded USCG and USCGR responses due to low participation numbers. Overall, most ‘healthy’ responses remained similar or slightly improved. Notable this year is a 7% increase in ‘healthy’ responses to the smoking question. Healthy responses to the dental hygiene question about flossing decreased this year by 8.9%. Table 1: Percent Change in Healthy HRA Responses, Total
2007-2008 (n=114,929)
2008-2009 (n=154,884) % Change
Smoking 73.7 78.83 6.96 Dipping 89.8 90.17 0.41

14
Drinks/day 80.38 80.91 0.66 Heavy Drinking 72.99 74.14 1.58 Drinking & Driving 92.55 93.99 1.56 Seat Belts 91.9 93.12 1.33 Helmet Use* 89.3 91.27 2.21 Safety Equipment* 95 95.94 0.99 Life Satisfaction 87.46 88.24 0.89 Work Stress 47.54 48.81 2.67 Personal Support 73.59 75.02 1.94 Condom Use 80.71 81.61 1.12 Aerobic Activity 73.68 74.79 1.51 Strength Training 83.96 84.22 0.31 High Fat Foods 83.95 84.74 0.94 Fruits & Vegetables 15.72 16.22 3.18 Supplements 83.09 83.1 0.01 Flossing 58.88 53.62 -8.93 Brushing 95.19 94.96 -0.24 Sleep 67.24 68.43 1.77
*excludes not applicable answers
Perception of Health Typically, perception of one’s current state of health has been shown to be fairly accurate. However, perception of good health may not accurately reflect future health for members who report significant risk factors that are major determinants of future health. Ninety-four percent of all members rated their “health in general” as either good or excellent (Figure 18), even though Figure 17 had shown many members reported risk factors that placed them in medium and high risk categories. Figure 18: Perception of Health by Service
Distribution of Perception of Health Category for Completed HRAs by Service Component
(N=154,884)
0102030405060708090
100
HEALTHY UNHEALTHY
Perc
ent
USNUSNRUSMCUSMCRUSCGUSCGRALL

15
The differences in perception of health and risk category were small but consistent, with lower risk groups having a higher perception of good health (98.8%). Nevertheless, many (90.2%) high-risk individuals also perceived their health as good. Of the small percentage of respondents who indicated their health was generally unhealthy (5.7%) the majority had risk scores that fell into the medium to high risk categories. Figure 19: Perception of Health Category v. Risk Category
Distribution of Perception of Health Category Compared to Risk Category for Completed HRAs
(N=154,884)
98.8
1.2
95.5
4.5
88.9
11.1
0
20
40
60
80
100
HEALTHY UNHEALTHY
Perception of Health
Perc
ent LOW
MEDIUM
HIGH
Mean Risk by Demographic Variables To repeat, the mean risk score refers to the number of risk categories in which individuals answer one or more questions as “unhealthy.” A statistically significant difference was observed between males and females (p-value < .0001), with males having a higher mean risk number (3.79) than females (3.1) (Table 2). Table 2: Mean risk by gender Mean
Risk Number
95% Confidence Interval
% in high risk Category
Female (n= 26,865)
3.1 3.08, 3.12 21.34
Male (n= 128,019)
3.79 3.78, 3.8 34.17
Age was examined as a second strong predictor of mean risk categories (Table 3). There was a statistically significant difference between virtually all age ranges, except between 17-19 year olds and 30-39 year olds. Not surprisingly, there was a trend of decreasing mean risk score with age after the age range 20-29. This may be due to survivor effect or healthy worker effect, indicating that those who remain in the military tend to be healthier than those who leave the service. It may also be that some individuals reduce their risky lifestyle behaviors as they mature. The youngest age group (17-19 years of age) had a mean risk score of 4.17 compared to the oldest age group, (50+ years of age) with a mean risk score of 3.46. Similarly, a greater

16
proportion of younger service members (age 20-29) were in the high-risk category. After age 29, as age increased, the percentage in the high risk category decreased. Table 3: Mean risk by age
Mean Risk Number
95% Confidence
Interval
% in high risk
Category 17-19 (n = 5,867)
4.17 4.13, 4.21 41.91
20-29 (n = 74,092)
4.5 4.48, 4.51 49.48
30-39 (n = 45,689)
4.18 4.17, 4.2 41.6
40-49 (n=24,294)
3.84 3.82, 3.87 33.3
50+ (n = 4, 942)
3.46 3.42,3.5 23.67
The same association between age and risk number was demonstrated by comparing rank with mean risk scores (Table 4). The E1-E5 group, which is generally comprised of younger service members, had a mean risk number of 4.43 and a greater percentage of members in the high risk category compared to E6-E9 and the officer ranks. Similarly, company grade officers had higher mean risk scores and a greater percentage of members in the high risk category compared to field grade officers. As a group, all enlisted members (4.38) and warrant officers (4.16) had a higher mean risk number than all commissioned officers (3.69). Table 4: Mean risk by rank Mean Risk
Number 95%
Confidence Interval
% in high risk
Category E1-E5 (n = 86,660)
4.43 4.41, 4.44 47.85
E6-E9 (n = 39,743)
4.27 4.26, 4.29 43.72
O1-O3 (n = 13,083)
3.85 3.82, 3.88 33.53
O4-O9 (n=14,029)
3.55 3.52, 3.57 25.7
W1-W5 (n=1,369)
4.16 4.08, 4.24 40.18

17
Race was examined as a predictor of mean risk number (Table 5). The Other group (American Indians, Native Alaskans, etc) had the highest mean risk numbers. Again, the nonparametric test Tukey’s was used to test for significance between the five race groups. Statistical significance between groups was also found among all race groups except between the African American and Asian population, Caucasian and Hispanic population, and the Caucasian and African American Population. The largest difference in means was between the Asian/Pacific Islander group and the Other race category. Much of the differences between the groups are likely due to sample size instead of a biological effect. Table 5: Mean risk by race
Mean Risk
Number
95% Confidence
Interval
% in high risk Category
African American (n = 10,817)
3.64 3.6, 3.67 31.15
Caucasian (n = 95,671)
3.66 3.65, 3.67 31.78
Asian/Pacific Islanders (n = 21,067)
3.61 3.59, 3.63 30.66
Hispanic (n = 18,258)
3.7 3.67, 3.73 32.9
Other (n=5,832)
3.84 3.79, 3.89 35.61

18
Days Away from Home Station The relationship between days away from home station and unhealthy behavior response was examined. Responses to questions about smoking, dipping, drinks per day, heavy drinking, life satisfaction, work stress, personal support, and sleep were examined over 4 time points (0 days, 1-29 days, 30-179 days, 180-365 days). In the entire population 42% of individuals did not spend any time away from the home station, 26% spent 1-29 days away, 21% spent 30-179 days away, and 11% spent 108-365 days away from the home station (Figure 20) Figure 20: Percentage of Days Away
Percentage of Days Spent Away from Home Station (n= 154,884)
42%
11%
21%
26%
0 Days
1-29 Days
30-179 Days
180-365 Days

19
Distribution of Risk Categories for Completed HRAs by Time Away From Home Station (n=154,884)
0
10
20
30
40
50
60
70
80
90
100
0 Days 1-29 Days 30-179 Days 180-365 Days
Perc
ent
Low
Medium
High
Time away from home station was examined by service component (Figure 21). At least 40% of all USN and USNR members reported 0 days away from home station while almost 50% of all reserve branches reported spending 0 days away from home station (47.5-51.6%). The USMC and USCG had the highest percentages for total days away with at least 73% of members reporting at least 1 day away. USMC members reported having the greatest percentage of members away from home station for 180-365 days (17.43%) while the USNR members only had 7.31% of individuals away from home station for 180-365 days. Figure 21: Days Away by Service
The distribution of risk categories was similar for people classified as a ‘medium’ risk across all categories. Both the ‘low’ risk and ‘high’ risk categories showed a percentage response change over time. The percent of members in the ‘low’ risk category decreased from 30.2% at 0 days away to 22.8% at 180-365 days away. The percentage of members in the ‘high’ risk category increased from 29.5% at 0 days away to 39.7% at 180-365 days away (Figure 22). Figure 22: Distribution of Risk Categories by Time Away
Days Away from Home Station by Service(n=154,884)
0
10
20
30
40
50
60
70
80
90
100
USN USNR USMC USMCR USCG USCGR
Perc
ent o
f Ser
vice
Bra
nch
0 Days
1-29 Days
30-179 Days
180-365Days

20
Days Away from Home Station and Mean Risk The mean risk number was compared with the amount of time away from home station. There were statistically significant differences in mean risk noted for all levels of time away from home station (Table 6). As time away from home station increased, both mean risk and percentage of members in the high risk category increased. Table 6: Mean Risk Number by Days Away From Home Station Mean
Risk Number
95% Confidence Interval
% in high risk Category
0 Days Away (n=63,687)
4.15 (4.14, 4.16) 29.52
1-29 Days Away (n=40,750)
4.22 (4.2, 4.23) 30.85
30-179 Days Away (n=32,946)
4.36 (4.34, 4.38) 33.88
180-365 Days Away (n=14,501)
4.55 (4.52, 4.57) 39.67
Days Away from Home Station and Risk Score To evaluate the relationship between length of days away from home station and risk number a logistic regression model was used. Risk score of greater than 2 (medium and high categories) was set as a dependent variable, while days away from home station was used as a predictive variable divided into 4 groups: 0 days away from home station, 1-29 days away from home station, 30-179 days away from home station, and 180-365 days away from home station. The model was found to be significant with the odds ratio increasing in each of the days away categories: OR 1.074 (1-29 days), OR 1.215 (30-179 days), and OR 1.466 (180-365).

21
Days Away from Home Station and Unhealthy Behaviors Eight different questions covering smoking, dipping, drinks per day, heavy drinking, life satisfaction, work stress, personal support, and sleep were examined to determine any time related differences in reporting of unhealthy behaviors. The next seven graphs (Figures 23-29) display the results of ‘unhealthy’ responses by self reported time away from home station. While the different services varied somewhat in respect to leading health risks (unhealthy ratings), several risk behaviors were similar across groups, with work stress, drinks per day, and heavy drinking showing the greatest increases in unhealthy behavior as time away from station increased. Although members in general reported higher levels of work stress as the number of days away from home station increased, an exception of this trend was visible among members of the USMC, USMCR, and USCGR (Figures 26, 27, and 29) who reported an increased ‘unhealthy’ response to the work stress question from 1-29 days, but after which, ‘unhealthy’ responses declined for the remaining day categories. Figure 23: Unhealthy Responses by all for Time Away from Home Station
Distribution of 'Unhealthy' Behaviors by Time Away From Home Station
(n=154,884)
020406080
100
Smok
ing
Dipping
Drinks
/Day
Heavy
Drin
king
Life
Satisf
actio
n
Wor
k Stre
ss
Perso
nal S
uppo
rt
Sleep
0 Days1-29 Days30-179 Days180-365 Days

22
Frequency of ‘unhealthy’ responses increased for all risk factors for USN members as days away from home station increased (Figures 24 and 25). Compared to USNR members, USN members reported higher levels of work stress, starting and 51.66% (0 days away) increasing to 60.87% (180-365 days away), higher levels of smoking, 25.79% (0 days away) to 31.57% (180-365 days away), and higher unhealthy sleep levels, 32.02% (0 days away) to 40.9% (180-365 days away). Figure 24: USN Distribution of ‘Unhealthy’ Response by Days Away from Home Station
USN Distribution of 'Unhealthy' Behaviors by Time Away From Home Station
(n=76,277)
0
20
40
60
80
100
Smok
ing
Dippin
g
Drinks
/Day
Heavy
Drin
king
Life
Sat
isfac
tion
Wor
k Stre
ss
Perso
nal S
uppo
rt
Sleep
0 Days1-29 Days30-179 Days180-365 Days
Figure 25: USNR Distribution of ‘Unhealthy’ Response by Days Away from Home Station
USNR Distribution of 'Unhealthy' Behaviors by Time Away From Home Station
(n=33,879)
0
20
40
60
80
100
Smok
ing
Dippin
g
Drinks
/Day
Heavy
Drin
king
Life
Sat
isfac
tion
Wor
k Stre
ss
Perso
nal S
uppo
rt
Sleep
0 Days1-29 Days30-179 Days180-365 Days

23
Compared to Navy and Coast Guard members, Marines tended to report a higher number of drinks per day and heavy drinking which, in general, increased as days away from home station increased (Figures 26 & 27). However, there were differences in trends between USMC and USMCR members, with USMCR smoking, drinks per day, and heavy drinking increasing between the first two categories of time away, decreasing during the 30-179 day category, and finally increasing again for the 180-365 days away category. This could be caused by low numbers of USMCR participants in these categories and not an actual trend. Both the USMC and USMCR responses show a peak in work stress at the 1-29 day category, after which responses decrease among the last two days away categories. Figure 26: USMC Distribution of ‘Unhealthy’ Response by Days Away from Home Station
USMC Distribution of 'Unhealthy' Behaviors by Time Away From Home Station
(n=19,983)
0
2040
6080
100
Smok
ing
Dippin
g
Drinks
/Day
Heavy
Drin
king
Life
Sat
isfac
tion
Wor
k Stre
ss
Perso
nal S
uppo
rt
Sleep
0 Days1-29 Days30-179 Days180-365 Days
Figure 27: UMCR Distribution of ‘Unhealthy’ Response by Days Away from Home Station
USMCR Distribution of 'Unhealthy' Behaviors by Time Away From Home Station
(n=6,028)
0
20
40
60
80
100
Smok
ing
Dipping
Drinks
/Day
Heavy
Drin
king
Life
Satisf
actio
n
Wor
k Stre
ss
Perso
nal S
uppo
rt
Sleep
0 Days1-29 Days30-179 Days180-365 Days

24
USCG and USCGR ‘unhealthy’ response profiles (Figures 28 & 29) are somewhat different. Both groups reported a 48% or greater ‘unhealthy’ response to work stress across the days away categories; however, USCG members percent ‘unhealthy’ response frequency increased among all of the days away categories, while USCGR members peaked in the 1-29 day category and then declined. Of note are percent increases among USCG members from 0 days away to 180-364 days away in reported ‘unhealthy’ responses to work stress (+17.37%), personal support (+10.26%), drinks per day (+9.05%), heavy drinking (+8.53%) that occurred among USCG members. Additionally, even though the USCG and USCGR members made up less than 12.9% of all participants in this survey, these service members had the largest percent increases among all service components for ‘unhealthy’ responses from “0 days” to the “180-364 days away” categories in all of the behaviors except heavy drinking. Figure 28: USCG Distribution of ‘Unhealthy’ Response by Days Away from Home Station
USCG Distribution of 'Unhealthy' Behaviors by Time Away From Home Station
(n=16,171)
020406080
100
Smok
ing
Dipping
Drinks
/Day
Heavy
Drin
king
Life
Satisf
actio
n
Wor
k Stre
ss
Perso
nal S
uppo
rt
Sleep
0 Days1-29 Days30-179 Days180-365 Days
Figure 29: USCGR Distribution of ‘Unhealthy’ Response by Days Away from Home Station
USCGR Distribution of 'Unhealthy' Behaviors by Time Away From Home Station
(n=2,546)
020406080
100
Smok
ing
Dipping
Drinks
/Day
Heavy
Drin
king
Life
Satisf
actio
n
Wor
k Stre
ss
Perso
nal S
uppo
rt
Sleep
0 Days1-29 Days30-179 Days180-365 Days

25
Discussion
Strengths and Limitations A strength of the results stems from the fact that the questionnaire does not ask for any personal identifiers, making it more likely that participants will answer honestly about risky behaviors they engage in. For the first time, the data analysis examines the association between military deployments and risk behaviors. In regards to sampling bias, the large number of responses this year is likely representative of the entire Navy and Marine Corps populations, based on the assumption that taking the assessment is merely a matter of commands’ implementation of the PHA process; thus, these responses would not represent merely a convenience sample. As implementation of the Periodic Health Assessment progresses, additional commands continue to adopt the HRA. Limitations of this report can be attributed to the limitations of the data collection tool. As a self-reported survey, the results can be biased due to participant recall or by the tendency to report socially desirable responses. As such, some overestimation of positive behaviors and underestimation of negative behaviors may occur. Although there is no reason to suspect that individuals complete the questionnaire multiple times, there is no way to block or detect duplicate entries. It is also difficult to directly compare service components because the demographic characteristics that influence health behavior, as described earlier, vary significantly.
Demographics Almost half of all responses were from active duty Navy members. This may be a reflection of the PHA process that was implemented first at the Navy MTFs. USNR had a strong advocacy and followed the active duty component with PHA implementation. Subsequently the Marine Corps and Coast Guard adopted the HRA. The use of the tool has grown substantially for most components this year: USN (+17,650), USNR (+1003), USMC (+4669), USMCR (-2063). (No data compared from last year for USCG and USCGR). When trying to interpret the results, it is important to use caution if comparing groups that are dissimilar. For example, the Marine Corps is comprised of significantly younger members whose mission and environment may affect the results. It would be expected that younger members would report different types and levels of risk behaviors compared to older members. Similar differences in results could be attributed to gender differences. Although specific risk behaviors were not analyzed in this report by age or gender, the total number of risk behaviors, the Mean Risk Number, was examined for both of these variables. Not surprisingly, increasing age was inversely associated with Mean Risk Number, and female members had a lower Mean Risk Number.

26
Risk Factors Collection and analysis of body composition was previously added to the HRA tool at the request of Navy customers. The tool uses Body Mass Index (BMI), which is a fairly reliable indicator of body fatness for most people, is based on self-reported height and weight and is an inexpensive and easy-to-perform method of screening for weight categories that may lead to health problems.1 Military height-weight tables use this approach but are more lenient for establishing official standards. BMI can also overestimate body fat in lean, muscular individuals. Therefore, these data should not necessarily lead to the conclusion that all individuals exceeding healthy levels are either overweight or obese. Rather, the data may support some general observations about weight across the services. For example, these data indicate that, in general, Navy and Coast Guard personnel were more likely than Marines to be classified as either overweight or obese, Marines are unlikely to fall into the obese category, and active duty Navy and Coast Guard are slightly more likely to be of normal BMI than reservists. The prevalence of specific risk factors has remained fairly constant, with the leading health risks being low fruit and vegetable consumption, work stress, not flossing teeth, and lack of restful sleep. Overall, reported smoking rates dropped significantly in the past year. However, smoking and dipping remain high in the Marine Corps. These results should be used to plan health promotion interventions that target priority areas. Although comparing results individual service results to the total of all services may be tempting, it may be more appropriate to seek realistic and incremental percentages improvements when setting goals for the future.
Days Away from Home The largest number of individuals that completed the HRA did not deploy at all last year. When added to the number of members that were away from home for less than 30 days, the total percentage was 68%. Marines were away from home for more days than members of other service components. As stated earlier, as time away from home station increased, both mean risk and percentage of members in the high risk category increased. Therefore, implementing health promotion activities may be even more important in a population that experiences more separations.
Conclusion The Fleet and Marine Corps HRA can be a valuable tool for tailoring health messages to individuals. The tailored feedback to participants on their individual reports and referral to credible health websites on each of the topics for more detailed information provides participants with the knowledge and skills to better manage their personal health. From a more global, population health approach, the aggregate data in this HRA report provides each of the service components with valuable information that can be incorporated into comprehensive community health assessments, which is a first step in planning effective health promotion programs. Local HRA Administrators have the ability to generate additional reports in even greater detail at the individual unit level.

27
Decision-makers can use the data in this report for strategic planning. Clearly, the results of this report have a bearing on recruitment, retention, readiness, and quality of military life. Reference:
1. Centers for Disease Control and Prevention BMI Web Site. Available at: http://www.cdc.gov/healthyweight/assessing/bmi/adult_bmi/#Interpreted. Accessed September 2, 2009

28
Appendix A:

29

30
Appendix B: CO Report Scoring Grid
Health Indicator
Health Behavior
Unhealthy Rating Healthy Rating
Perception 1. Perception of health c-d a-b
Tobacco Use 2. Smoking a-c d 3. Smokeless Tobacco a-c d Alcohol Use 4. Typical Drinking a-b c-d 5. Heavy Drinking a-c d-e 6. DUI a-c d Injury Prevention 7. Seat Belt b-e a 8. Vehicle Helmets* c-e a-b 9. Safety Equipment* c-e a-b Stress Mngt 10. Life Satisfaction c-d a-b 11. Work or Personal
Stress a-c d-e
12. Personal Support c-e a-b Sexual Health 13. Condom Use d-f a-c Physical Activity 14. Aerobic Exercise d-e a-c 15. Strength Exercise e a-d Nutrition 16. High Fat a-b c-e 17. Fruits & Vegetables Males: c-e
Females: d-e Males: a-b
Females: a-c Supplements 18. Supplements a-c d-e Dental 19. Flossing c-e a-b 20. Brushing c-e a-b Sleep 21. Sleep Deprivation c-e a-b BMI BMI>25 *Questions 8 & 9 allow respondents to select ‘f’ (Does not apply) as an answer. This answer is not included in the ratings.