Embed Size (px)
Citation preview
AGRI C5
Flax and hemp

� Flax area, production and stocks
� Flax trade
� Flax price development
� Linen yarn and textiles
� Hemp area and production
3
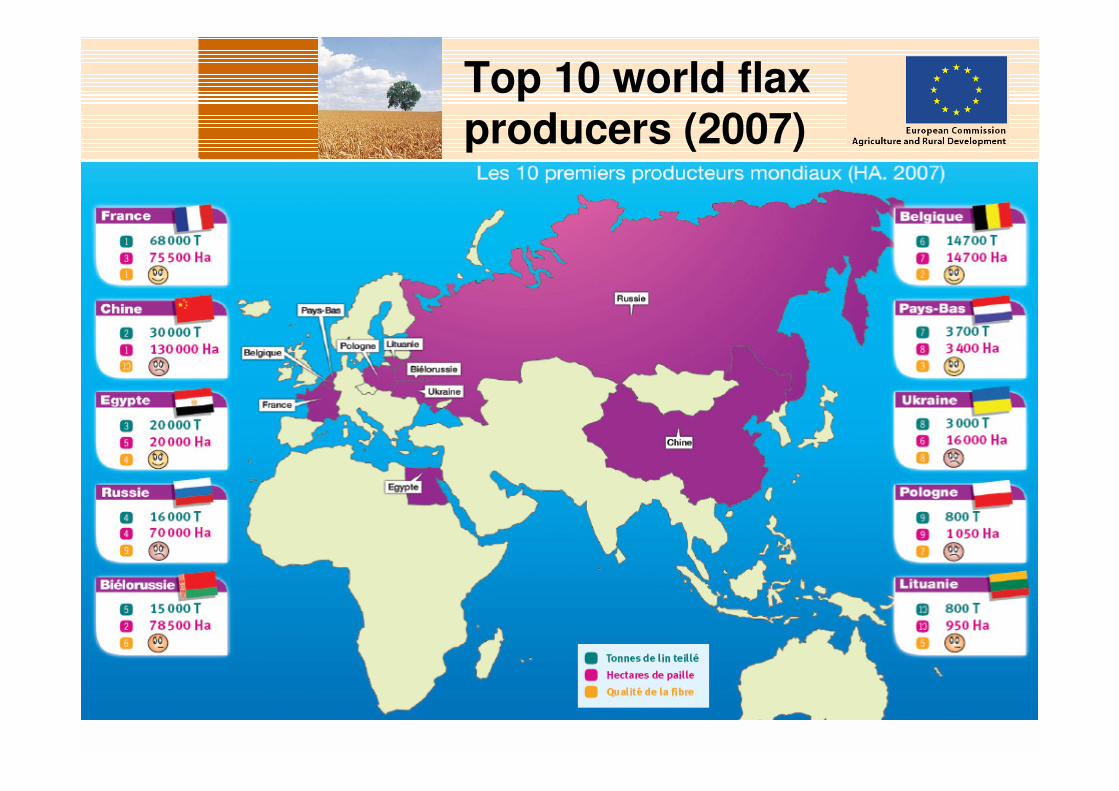
Top 10 world flaxproducers (2007)
4
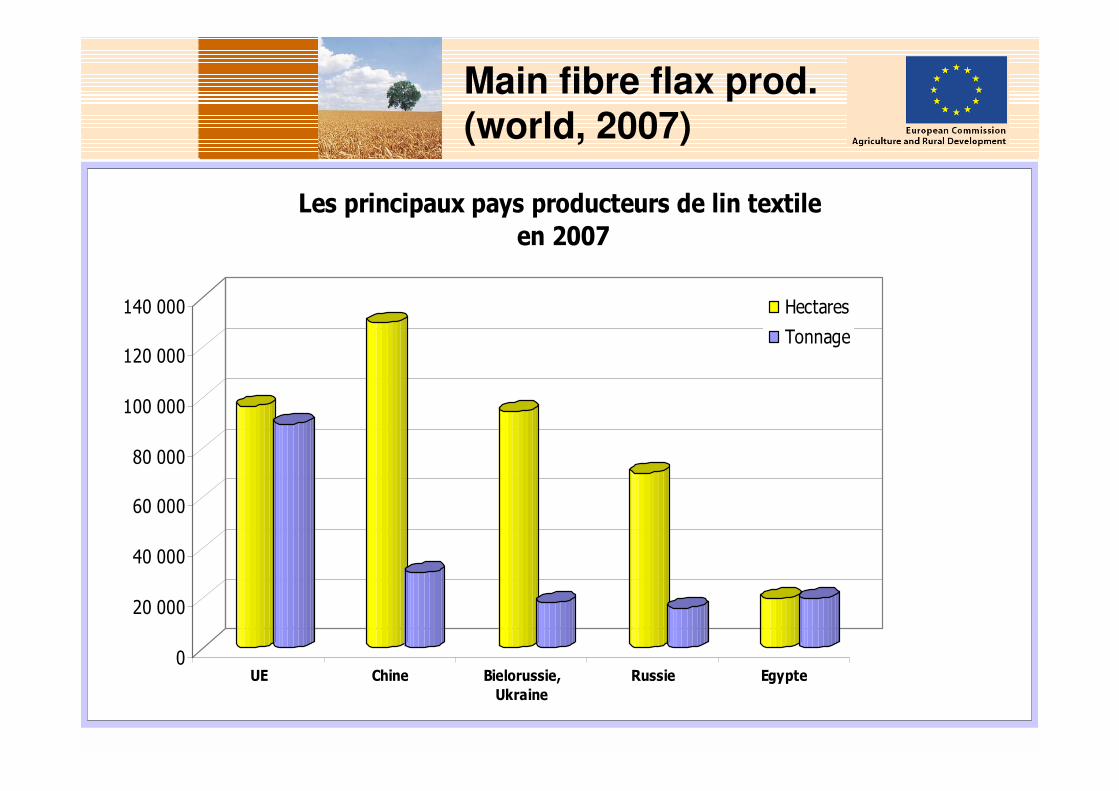
Main fibre flax prod. (world, 2007)
0
20 000
40 000
60 000
80 000
100 000
120 000
140 000
UE Chine Bielorussie,
Ukraine
Russie Egypte
Les principaux pays producteurs de lin textile
en 2007
Hectares
Tonnage

5
EU27 flax area (ha)
0
20.000
40.000
60.000
80.000
100.000
120.000
2004 2005 2006 2007 2008 2009
EU15 EU12 Source: Member States
6
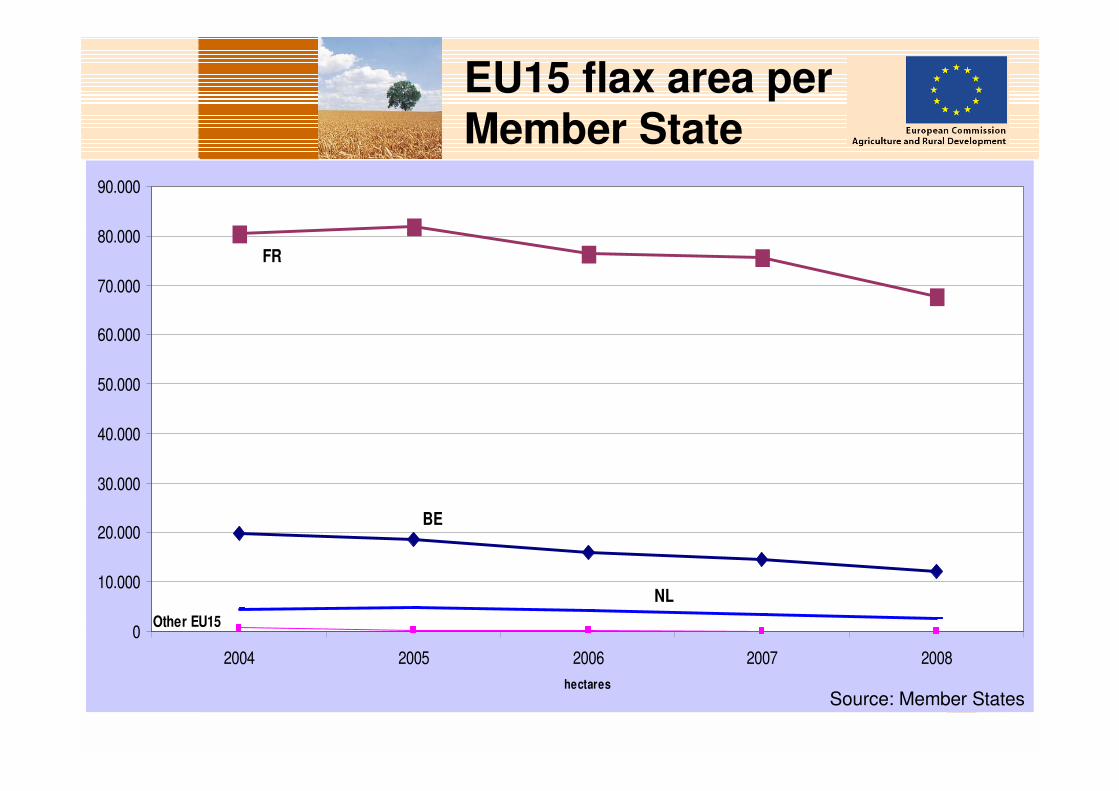
EU15 flax area per Member State
BE
FR
NL
Other EU150
10.000
20.000
30.000
40.000
50.000
60.000
70.000
80.000
90.000
2004 2005 2006 2007 2008
hectares
Source: Member States
7
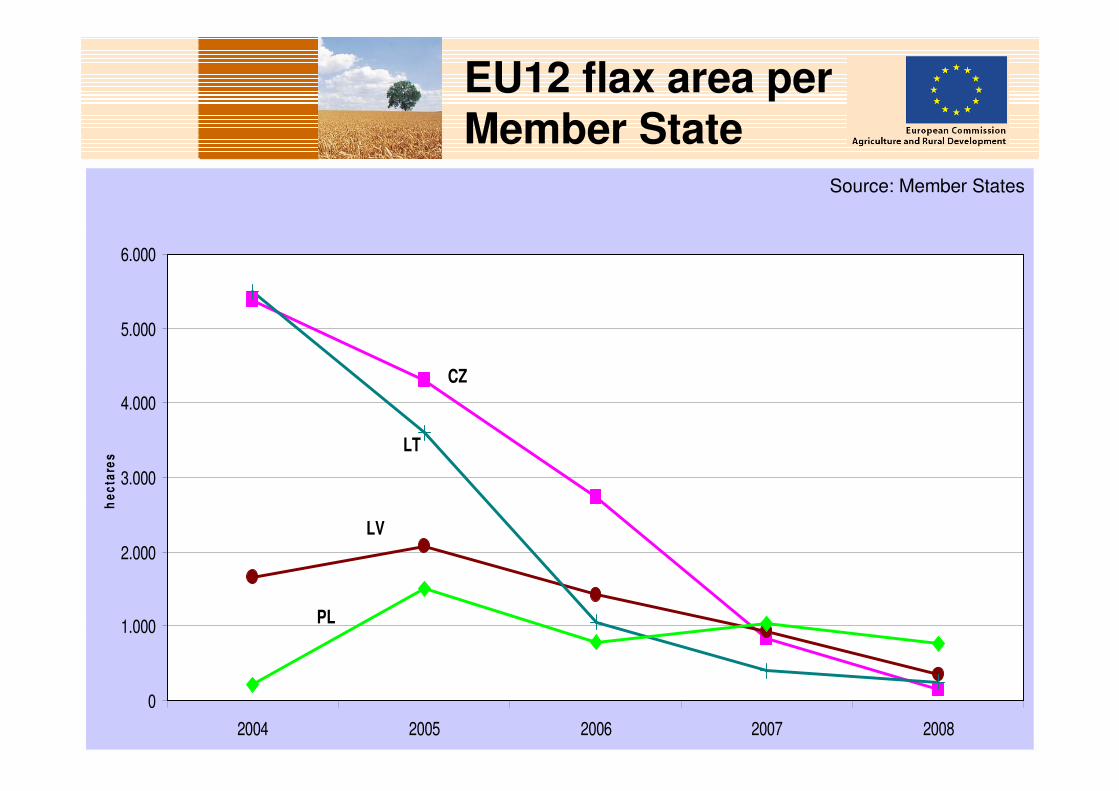
EU12 flax area per Member State
CZ
LV
LT
PL
0
1.000
2.000
3.000
4.000
5.000
6.000
2004 2005 2006 2007 2008
he
cta
res
Source: Member States
8
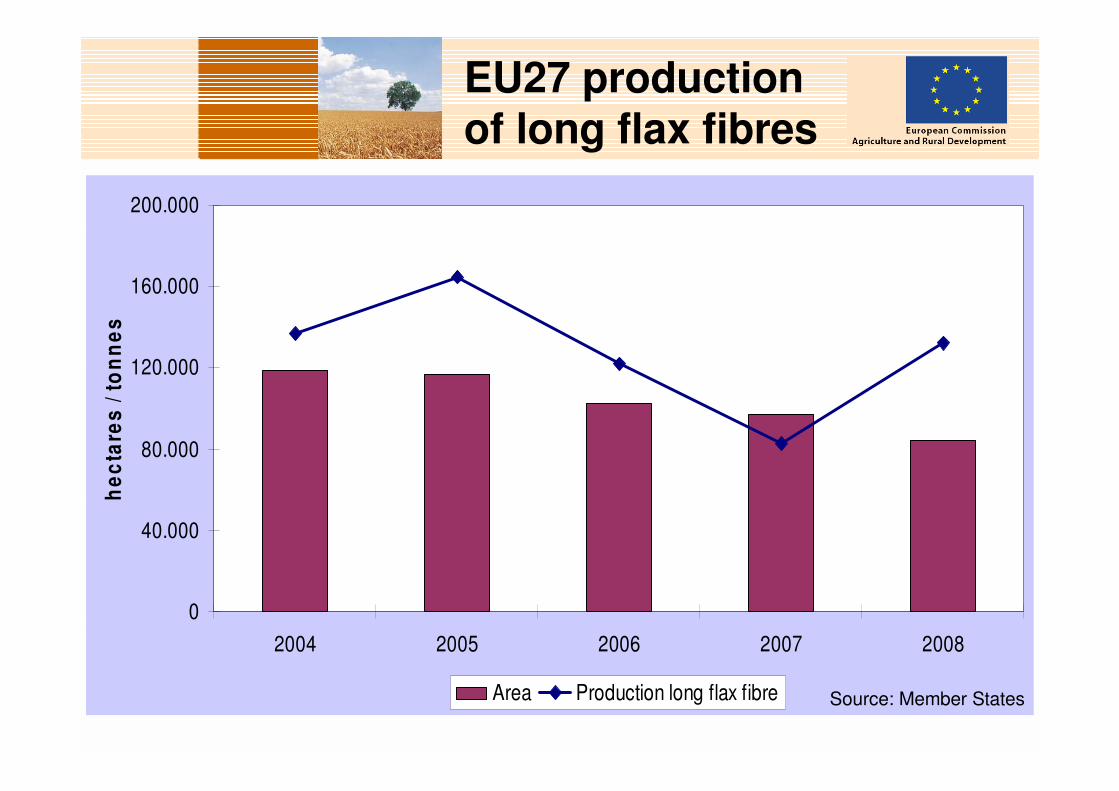
EU27 production of long flax fibres
0
40.000
80.000
120.000
160.000
200.000
2004 2005 2006 2007 2008
he
cta
res
/ t
on
ne
s
Area Production long flax fibre Source: Member States

9
Stocks of long flaxfibres (FR, BE, NL)
2008-09
estimate0
20
40
60
80
100
1201000 t
2003-04 2004-05 2005-06 2006-07 2007-08
Source: AGPL (FR)

� Flax area, production and stocks
� Flax trade
� Flax price development
� Linen yarn and textiles
� Hemp area and production

11
Total EU27 flaxexports
0
20
40
60
80
100
120
140
160
180
2001 2002 2003 2004 2005 2006 2007 2008
00
0 t
on
ne
s
53012100 FLAX, BROKEN OR SCUTCHED 53012900 FLAX, HACKLED, BUT NOT SPUN
530130 FLAX TOW AND WASTE 53011000 FLAX, RAW OR RETTEDSource: COMEXT
12
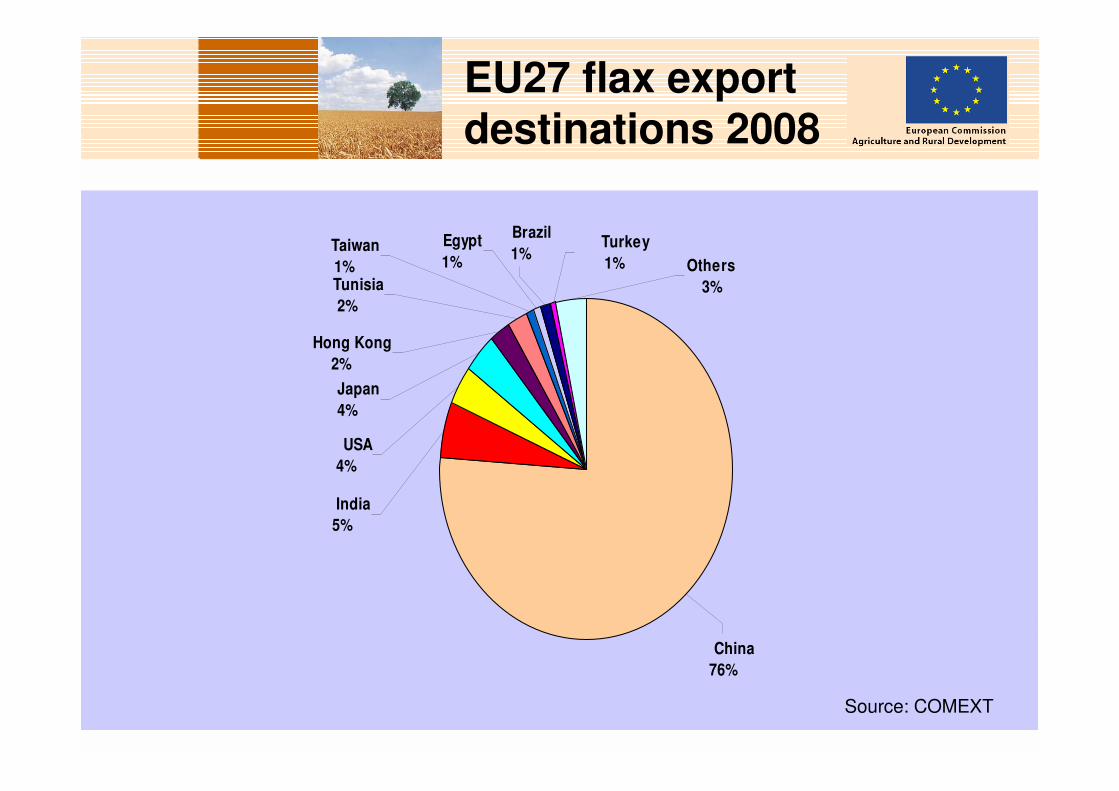
EU27 flax export destinations 2008
China
76%
Others
3%
Turkey
1%
Brazil
1%
India
5%
Egypt
1% Taiwan
1% Tunisia
2%
Hong Kong
2%
Japan
4%
USA
4%
Source: COMEXT

13
EU27 Top 3 flaxexport destinations
0
20.000
40.000
60.000
80.000
100.000
120.000
140.000
2001 2002 2003 2004 2005 2006 2007 2008
China
India
USA
tonnes
Source: COMEXT

14
EU27 flax fibre exports per month: 2006 - 2008
0
2
4
6
8
10
12
14
Jan. 2006 May. 2006 Sep. 2006 Jan. 2007 May. 2007 Sep. 2007 Jan. 2008 May. 2008 Sep. 2008
00
0 t
on
ne
s
China India Japan Hong KongSource: COMEXT
15
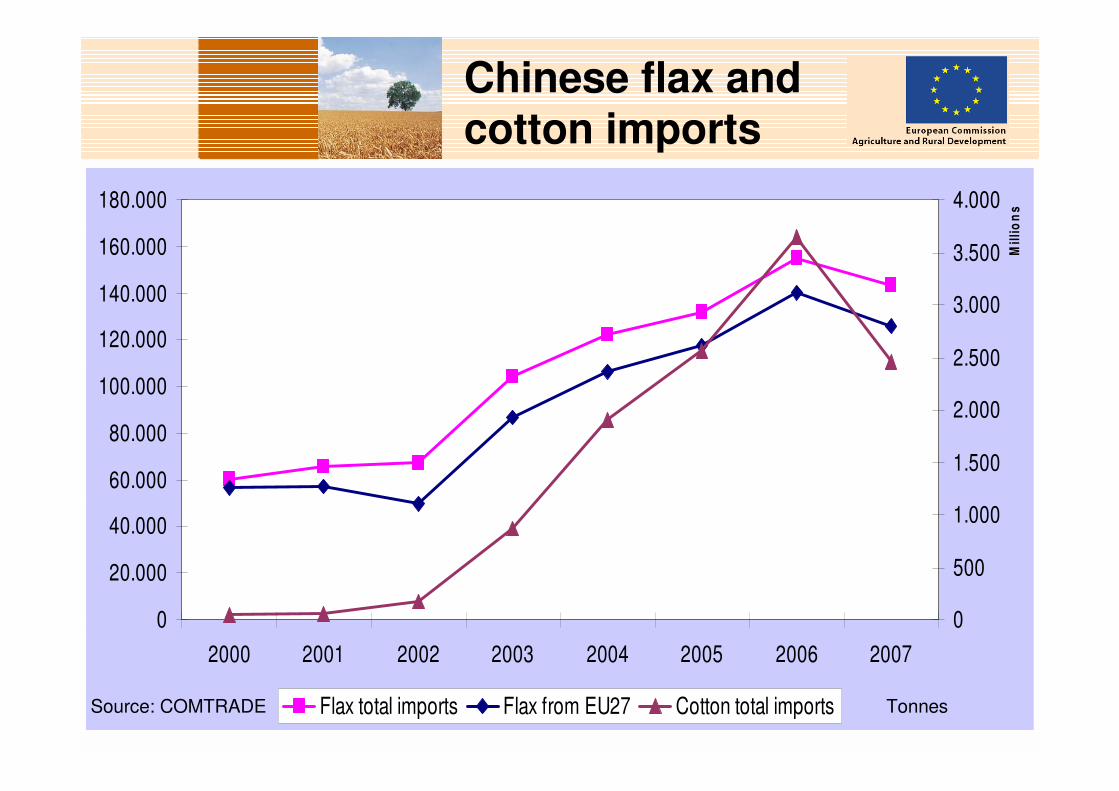
Chinese flax and cotton imports
0
20.000
40.000
60.000
80.000
100.000
120.000
140.000
160.000
180.000
2000 2001 2002 2003 2004 2005 2006 2007
0
500
1.000
1.500
2.000
2.500
3.000
3.500
4.000
Mil
lio
ns
Flax total imports Flax from EU27 Cotton total importsSource: COMTRADE Tonnes

� Flax area, production and stocks
� Flax trade
� Flax price development
� Linen yarn and textiles
� Hemp area and production

17
Lo
ng
flax
fibre
pric
es
(FR
, BE
, NL
) 2003-2
008
125,9
184,6
119,1
100,0
110,0
120,0
130,0
140,0
150,0
160,0
170,0
180,0
190,0
juil-03
sept-03
nov-03
janv-04
mars-04
mai-04
juil-04
sept-04
nov-04
janv-05
mars-05
mai-05
juil-05
sept-05
nov-05
janv-06
mars-06
mai-06
juil-06
sept-06
nov-06
janv-07
mars-07
mai-07
juil-07
sept-07
nov-07
janv-08
mars-08
mai-08
juil-08
sept-08
nov-08
€/q
Sourc
e: C
.I.P.A
.LIN
(FR
), AB
V (B
E), C
om
mis
sie
Vla
s(N
L)
Prices in €/100 kg

18
EU Long flax fibre prices (2004-2008)
0
500
1.000
1.500
2.000
2.500
July 20
04
Jan. 2
005
July 200
5
Jan. 2
006
July 2006
Jan. 2
007
July
2007
Jan. 2008
July 2
008
€/t
on
ne
BE NL FR LV LT PL CZ Source: Member States
19
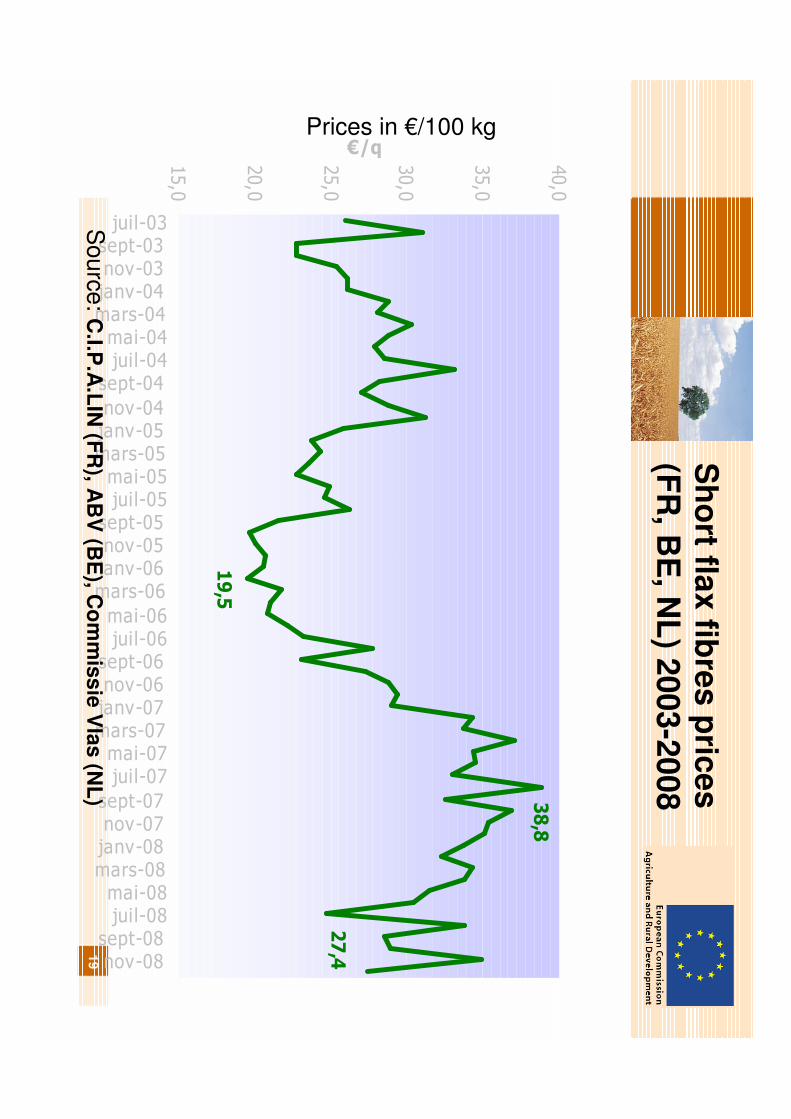
Sh
ort fla
xfib
res p
rices
(FR
, BE
, NL
) 2003-2
008
19,5
38,8
27,4
15,0
20,0
25,0
30,0
35,0
40,0
juil-03sept-03nov-03janv-04mars-04mai-04juil-04sept-04
nov-04janv-05mars-05mai-05juil-05sept-05nov-05janv-06mars-06
mai-06juil-06sept-06nov-06janv-07mars-07mai-07juil-07
sept-07nov-07janv-08mars-08mai-08juil-08sept-08nov-08
€/q
Sourc
e: C
.I.P.A
.LIN
(FR
), AB
V (B
E), C
om
mis
sie
Vla
s(N
L)
Prices in €/100 kg
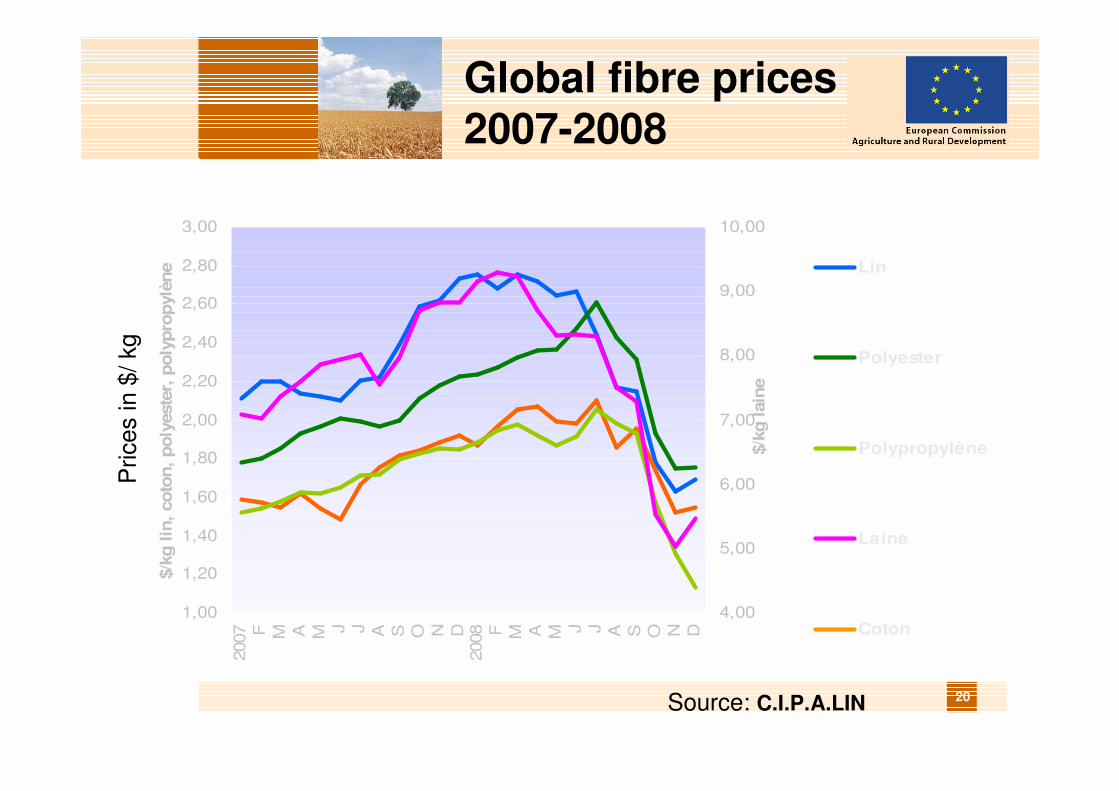
20
Global fibre prices2007-2008
1,00
1,20
1,40
1,60
1,80
2,00
2,20
2,40
2,60
2,80
3,002007 F M A M J J A S O N D
2008 F M A M J J A S O N D
$/k
g lin
, coto
n, poly
este
r, p
oly
pro
pylè
ne
4,00
5,00
6,00
7,00
8,00
9,00
10,00
$/k
g lain
e
Lin
Polyester
Polypropylène
Laine
Coton
Source: C.I.P.A.LIN
Prices
in $
/ kg

� Flax area, production and stocks
� Flax trade
� Flax price development
� Linen yarn and textiles
� Hemp area and production
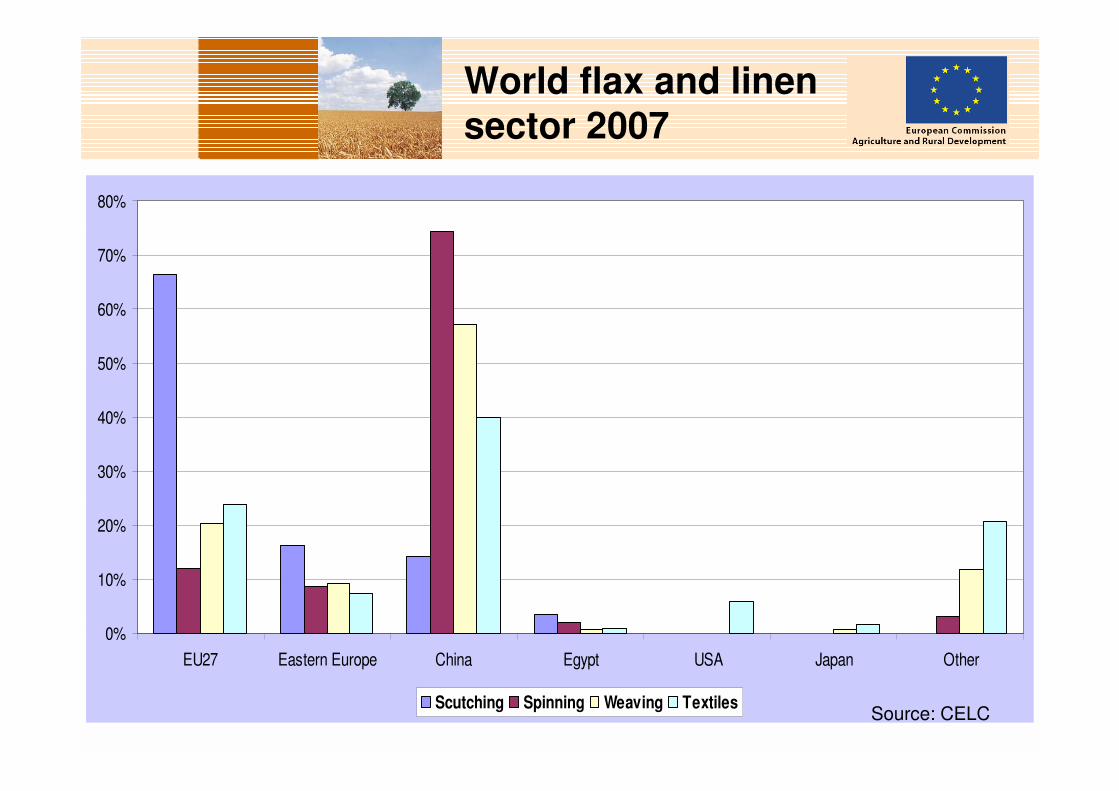
22
World flax and linensector 2007
0%
10%
20%
30%
40%
50%
60%
70%
80%
EU27 Eastern Europe China Egypt USA Japan Other
Scutching Spinning Weaving TextilesSource: CELC
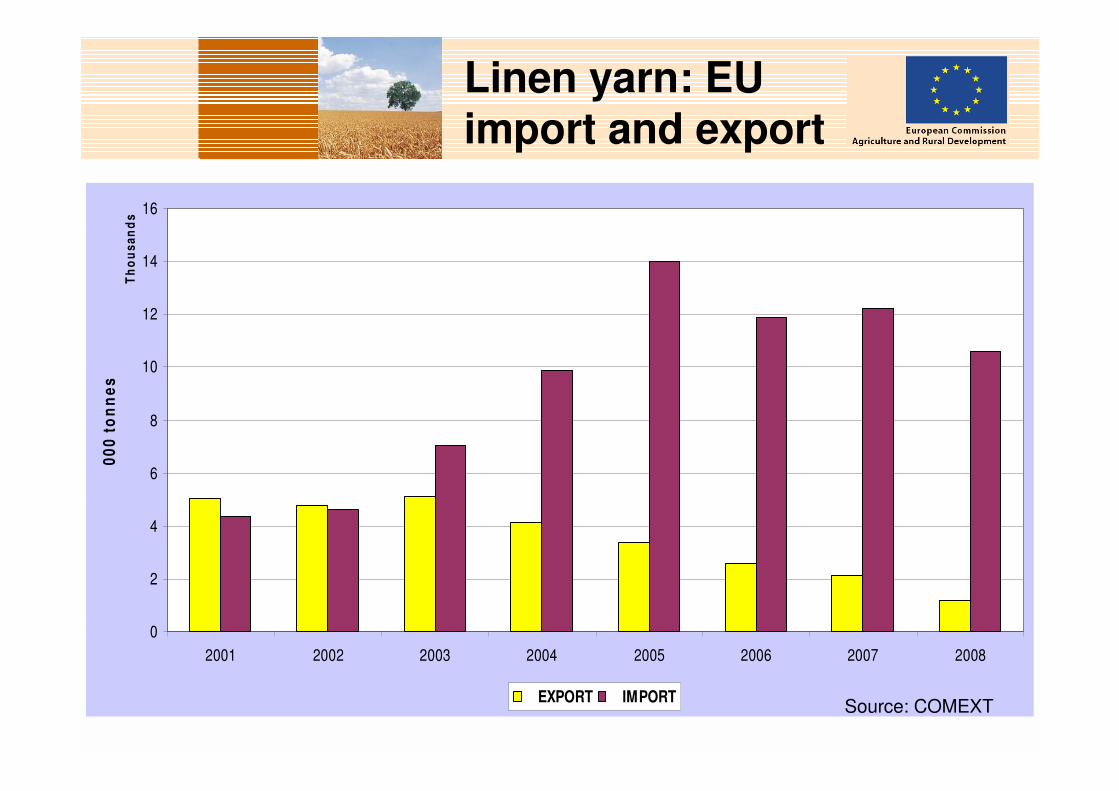
23
Linen yarn: EU import and export
0
2
4
6
8
10
12
14
16
2001 2002 2003 2004 2005 2006 2007 2008
Th
ou
sa
nd
s
00
0 t
on
ne
s
EXPORT IMPORTSource: COMEXT
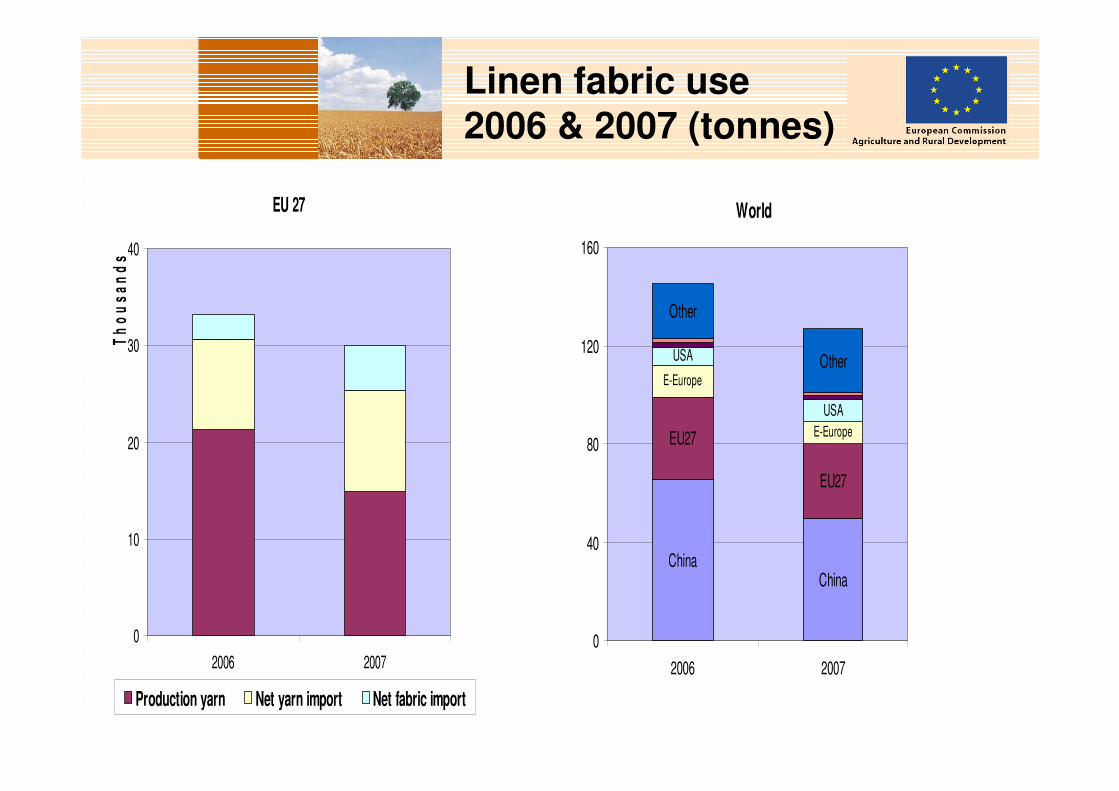
24
Linen fabric use2006 & 2007 (tonnes)
Source: CELC
EU 27
0
10
20
30
40
2006 2007
Th
ou
sa
nd
s
Production yarn Net yarn import Net fabric import
World
ChinaChina
EU27
EU27
E-Europe
E-Europe
USA
USA
Other
Other
0
40
80
120
160
2006 2007

25
World linen consumption 2007
EU27; 27,1%
Eastern Europe; 4,9%
China; 7,9%
Egypt; 0,8%
Japan; 7,2%
Other; 19,9%
USA; 32,2%
Source: CELC

� Flax area, production and stocks
� Flax trade
� Flax price development
� Linen yarn and textiles
� Hemp area and production

27
EU hemp area and fibre production
0
5.000
10.000
15.000
20.000
25.000
2001 2002 2003 2004 2005 2006 2007 2008
he
cta
res
/ t
on
ne
s
Area (ha) Production (t)

28
EU27 hemp area
0
2.000
4.000
6.000
8.000
10.000
12.000
14.000
16.000
18.000
20.000
2004 2005 2006 2007 2008 2009
FR DE UK CZ PL IT ES AT HU NL DK FI SE LV RO